EP2241990A1 - Determination of single peak melting temperature by PCR analogy and double sigmoid equation - Google Patents
Determination of single peak melting temperature by PCR analogy and double sigmoid equation Download PDFInfo
- Publication number
- EP2241990A1 EP2241990A1 EP10003919A EP10003919A EP2241990A1 EP 2241990 A1 EP2241990 A1 EP 2241990A1 EP 10003919 A EP10003919 A EP 10003919A EP 10003919 A EP10003919 A EP 10003919A EP 2241990 A1 EP2241990 A1 EP 2241990A1
- Authority
- EP
- European Patent Office
- Prior art keywords
- curve
- value
- dataset
- derivative
- determining
- Prior art date
- Legal status (The legal status is an assumption and is not a legal conclusion. Google has not performed a legal analysis and makes no representation as to the accuracy of the status listed.)
- Granted
Links
Images


Classifications
-
- C—CHEMISTRY; METALLURGY
- C12—BIOCHEMISTRY; BEER; SPIRITS; WINE; VINEGAR; MICROBIOLOGY; ENZYMOLOGY; MUTATION OR GENETIC ENGINEERING
- C12Q—MEASURING OR TESTING PROCESSES INVOLVING ENZYMES, NUCLEIC ACIDS OR MICROORGANISMS; COMPOSITIONS OR TEST PAPERS THEREFOR; PROCESSES OF PREPARING SUCH COMPOSITIONS; CONDITION-RESPONSIVE CONTROL IN MICROBIOLOGICAL OR ENZYMOLOGICAL PROCESSES
- C12Q1/00—Measuring or testing processes involving enzymes, nucleic acids or microorganisms; Compositions therefor; Processes of preparing such compositions
- C12Q1/68—Measuring or testing processes involving enzymes, nucleic acids or microorganisms; Compositions therefor; Processes of preparing such compositions involving nucleic acids
- C12Q1/6813—Hybridisation assays
- C12Q1/6816—Hybridisation assays characterised by the detection means
-
- G—PHYSICS
- G16—INFORMATION AND COMMUNICATION TECHNOLOGY [ICT] SPECIALLY ADAPTED FOR SPECIFIC APPLICATION FIELDS
- G16B—BIOINFORMATICS, i.e. INFORMATION AND COMMUNICATION TECHNOLOGY [ICT] SPECIALLY ADAPTED FOR GENETIC OR PROTEIN-RELATED DATA PROCESSING IN COMPUTATIONAL MOLECULAR BIOLOGY
- G16B20/00—ICT specially adapted for functional genomics or proteomics, e.g. genotype-phenotype associations
- G16B20/20—Allele or variant detection, e.g. single nucleotide polymorphism [SNP] detection
-
- G—PHYSICS
- G16—INFORMATION AND COMMUNICATION TECHNOLOGY [ICT] SPECIALLY ADAPTED FOR SPECIFIC APPLICATION FIELDS
- G16B—BIOINFORMATICS, i.e. INFORMATION AND COMMUNICATION TECHNOLOGY [ICT] SPECIALLY ADAPTED FOR GENETIC OR PROTEIN-RELATED DATA PROCESSING IN COMPUTATIONAL MOLECULAR BIOLOGY
- G16B40/00—ICT specially adapted for biostatistics; ICT specially adapted for bioinformatics-related machine learning or data mining, e.g. knowledge discovery or pattern finding
-
- G—PHYSICS
- G16—INFORMATION AND COMMUNICATION TECHNOLOGY [ICT] SPECIALLY ADAPTED FOR SPECIFIC APPLICATION FIELDS
- G16B—BIOINFORMATICS, i.e. INFORMATION AND COMMUNICATION TECHNOLOGY [ICT] SPECIALLY ADAPTED FOR GENETIC OR PROTEIN-RELATED DATA PROCESSING IN COMPUTATIONAL MOLECULAR BIOLOGY
- G16B40/00—ICT specially adapted for biostatistics; ICT specially adapted for bioinformatics-related machine learning or data mining, e.g. knowledge discovery or pattern finding
- G16B40/10—Signal processing, e.g. from mass spectrometry [MS] or from PCR
-
- G—PHYSICS
- G16—INFORMATION AND COMMUNICATION TECHNOLOGY [ICT] SPECIALLY ADAPTED FOR SPECIFIC APPLICATION FIELDS
- G16B—BIOINFORMATICS, i.e. INFORMATION AND COMMUNICATION TECHNOLOGY [ICT] SPECIALLY ADAPTED FOR GENETIC OR PROTEIN-RELATED DATA PROCESSING IN COMPUTATIONAL MOLECULAR BIOLOGY
- G16B20/00—ICT specially adapted for functional genomics or proteomics, e.g. genotype-phenotype associations
Definitions
- the present invention relates generally to processing data representing melt characteristics of oligonucleotides, and more particularly to systems and methods for determining melting temperatures for an oligonucleotide sample based on melt curve data.
- melting temperatures is an important method to distinguish genotypes.
- double strand-specific DNA dyes such as, e.g., SYBR Green I, Molecular Probes, Eugene, Oregon
- labeled oligonucleotides are used to monitor product formation ( Wittwer CT, et al., BioTechniques 1997; 22: 130-8 ) and melting temperature ( Ririe KM, et al., Anal. Biochem 1997; 245: 154-60 ) in real-time PCR.
- amplification is performed using a thermostable enzyme that is stable to the DNA denaturation temperature and at least one pair of oligonuleotide primers.
- one or more additional oligonucleotide primers may be used (e.g. for amplifying more than one locus of the DNA or more than one genotype).
- fluorescence techniques that are homogeneous and do not require the addition of reagents after commencement of amplification or physical sampling of the reactions for analysis are attractive.
- Exemplary homogeneous techniques use oligonucleotide primers to locate the region of interest and fluorescent labels or dyes for signal generation.
- Typical PCR-based methods use FRET oligonucleotide probes with two interacting chromophores (adjacent hybridization probes, TaqMan probes, Molecular Beacons, Scorpions), single oligonucleotide probes with only one fluorophore (G-quenching probes, Crockett, A. O. and C. T. Wittwer, Anal. Biochem. 2001; 290: 89-97 and SimpleProbes, Idaho Technology), and techniques that use a dsDNA dye (e.g. SYBR Green I) instead of covalent, fluorescently-labeled oligonucleotide probes.
- a dsDNA dye e.g. SYBR Green I
- a typical method for determining oligonucleotide or DNA melting temperatures includes the amplification of a portion of the target nucleic acid and a subsequent determination of the melting temperature of the amplicon.
- the temperature of the sample to be analyzed typically is altered (e.g., raised) by a fraction of a degree over a temperature range and the change in fluorescence is measured.
- the rate of change of the relative fluorescence units (RFU) with time (T) (-d(RFU)/dT) is plotted on the Y-axis versus the temperature on the X-axis.
- the determination of the melting temperatures is performed directly after the amplification step. In certain embodiments, the determination of the melting temperature may be performed already during the course of the amplification reaction.
- oligonucleotide or DNA melting temperatures is an important method to distinguish genotypes. Some assays require the determination of multiple melting temperatures to identify wild-type from mutant genes. Alternatively, melting assays can be used with a single genotype to quantitatively determine the amount of a gene based on peak height. For example, recently discussed in the literature is the use of examining the KRAS gene to determine which patients might be candidates for a treatment for non-small cell lung cancer. Patients whose KRAS gene is of a wild-type would benefit from the treatment, whereas if the patient had a mutant variation of this gene, the treatment would be of no benefit. As these treatments often have major side effects, it is very important to determine the patient's correct genotype. It is also useful to know the amount of gene present.
- the present invention provides systems and methods for determining the melting temperature, Tm, for oligonucleotides based on melt curve data.
- the systems and methods also allow for quantitative determination of the gene amount based on peak height.
- a PCR analogy is used to perform quantization of an acquired melting curve dataset.
- the melting curve is transformed using a horizontal flip and a horizontal translation.
- a double sigmoid equation is then fit to the data.
- Inverse translation and inverse horizontal flip transforms are then applied to the equation to produce an equation based solution of the melt curve dataset.
- the equation based solution of the melt curve is then used to determine the first derivative (e.g., Tm value) and peak height.
- a computer-implemented method for determining a melting temperature, Tm, of DNA.
- the method typically includes steps that are implemented in a processing module.
- the steps of the method typically include receiving a dataset representing a melt curve for a DNA sample, the dataset including a plurality of data points represented as a sequence of data values ⁇ (X 1 ,Y 1 ), (X 2 ,Y 2 )...(X n-1 ,Y n-1 ), (X n ,Y n ) ⁇ , where X represents a temperature (T) value and Y represents a fluorescence intensity value, determining an analytical expression that fits the dataset, and determining a derivative curve by taking the derivative of the analytical expression with respect to X.
- the steps of the method also typically include determining a value X max corresponding to a maximum derivative (dY/dX) value of the derivative curve, and outputting the value X max , wherein the value X max represents a melting temperature, T m , of the DNA sample.
- the method further includes determining the peak height of the derivative curve corresponding to the T m value, and outputting the peak height.
- the analytical expression is determined by calculating an approximation of a curve that fits the dataset by applying a regression process to a double sigmoid function to determine parameters of the function.
- the regression process is a Levenberg-Marquardt regression process.
- the analytical expression is determined by applying a first transform to the dataset such that the sequence of data values ⁇ (X1,Y1), (X2,Y2)...(Xn-1,Yn-1), (Xn,Yn) ⁇ becomes a transformed sequence ⁇ (Xn,Y1), (Xn-1,Y2)...(X2,Yn-1), (X1,Yn) ⁇ and calculating an approximation of a curve that fits the transformed sequence by applying a regression process to a double sigmoid function to determine parameters of the double sigmoid function.
- the regression process is a Levenberg-Marquardt regression process.
- the method further includes applying a second transform to the double sigmoid function, the second transform being inverse to the first transform.
- the second transform includes a function of the form (X1 + Xn) -x.
- the method further includes, prior to calculating shifting the X values of the dataset or of the transformed sequence by a first amount (Xtrans) so that the transformed sequence begins at a value of 1 unit.
- the method further includes, after calculating, shifting the X values of the double sigmoid function by -Xtrans.
- determining a derivative curve includes taking the negative derivative of the analytical expression with respect to X.
- the processing module is integrated in one of a computer system or a PCR data acquiring device or system or in a thermocycler (e.g., a kinetic thermocyler).
- a computer readable medium including code for controlling a processor to determining a melting temperature, Tm, of DNA.
- the code typically includes instructions to receive a dataset representing a melt curve for a DNA sample, the dataset including a plurality of data points represented as a sequence of data values ⁇ (X 1 ,Y 1 ), (X 2 ,Y 2 )...(X n-1 ,Y n-1 ), (X n ,Y n ) ⁇ , where X represents a temperature (T) value and Y represents a fluorescence intensity value, instructions to determine an analytical expression that fits the dataset, and instructions to determine a derivative curve by taking the derivative of the analytical expression with respect to X.
- the code also typically includes instructions to determine a value X max corresponding to a maximum derivative (dY/dX) value of the derivative curve, and instructions to output the value X max , wherein the value X max represents a melting temperature, T m , of the DNA sample.
- the code further includes instructions to determine the peak height of the derivative curve corresponding to the T m value, and output the peak height.
- the analytical expression is determined by calculating an approximation of a curve that fits the dataset by applying a regression process to a double sigmoid function to determine parameters of the function.
- the regression process is a Levenberg-Marquardt regression process.
- the instructions to determine the analytical expression includes instructions to apply a first transform to the dataset such that the sequence of data values ⁇ (X1,Y1), (X2,Y2)...(Xn-1,Yn-1), (Xn,Yn) ⁇ becomes a transformed sequence ⁇ (Xn,Y1), (Xn-1,Y2)...(X2,Yn-1), (X1,Yn) ⁇ and to calculate an approximation of a curve that fits the transformed sequence by applying a regression process to a double sigmoid function to determine parameters of the double sigmoid function.
- the regression process is a Levenberg-Marquardt regression process.
- the computer readable medium further includes instructions to apply a second transform to the double sigmoid function, the second transform being inverse to the first transform.
- the second transform includes a function of the form (X1 + Xn) -x.
- the computer readable medium further includes instructions to shift the X values of the dataset or of the transformed sequence by a first amount (Xtrans) before calculating so that the transformed sequence begins at a value of 1 unit.
- the computer readable further includes instructions to, after calculating, shift the X values of the double sigmoid function by -Xtrans.
- the computer readable determining a derivative curve includes taking the negative derivative of the analytical expression with respect to X.
- the processor is integrated in one of a computer system or a PCR data acquiring device or system.
- a kinetic Polymerase Chain Reaction (PCR) system typically includes a kinetic PCR analysis module that generates a melt curve dataset representing a DNA melt curve, the dataset including a plurality of data points represented as a sequence of data values ⁇ (X 1 ,Y 1 ), (X 2 ,Y 2 )...(X n-1 ,Y n-1 ), (X n ,Y n ) ⁇ , where X represents a temperature (T) value and Y represents a fluorescence intensity value, and an intelligence module adapted to process the melt curve dataset to determine a Tm value.
- T temperature
- Y represents a fluorescence intensity value
- the Intelligence module is typically adapted to determine a Tm value by determining an analytical expression that fits the dataset, to determine a derivative curve by taking the derivative of the analytical expression with respect to X, and to determine a value Xmax corresponding to a maximum derivative (dY/dX) value of the derivative curve.
- the Intelligence module is further typically adapted to output the value Xmax, wherein the value Xmax represents a melting temperature, Tm, of the DNA sample.
- the intelligence module includes one or more processors.
- the intelligence module is further adapted to determine the peak height of the derivative curve corresponding to the Tm value and to output the peak height.
- the analytical expression is determined by calculating an approximation of a curve that fits the dataset by applying a regression process to a double sigmoid function to determine parameters of the function.
- the regression process is a Levenberg-Marquardt regression process.
- the analytical expression is determined by applying a first transform to the dataset such that the sequence of data values ⁇ (X1,Y1), (X2,Y2)...(Xn-1,Yn-1), (Xn,Yn) ⁇ becomes a transformed sequence ⁇ (Xn,Y1), (Xn-1,Y2)...(X2,Yn-1), (X1,Yn) ⁇ and calculating an approximation of a curve that fits the transformed sequence by applying a regression process to a double sigmoid function to determine parameters of the double sigmoid function.
- the regression process is a Levenberg-Marquardt regression process.
- the analytical expression is further determined by applying a second transform to the double sigmoid function, the second transform being inverse to the first transform.
- the second transform includes a function of the form (X1 + Xn) -x.
- the intelligence module is further adapted to, prior to calculating, shift the X values of the dataset or of the transformed sequence by a first amount (Xtrans) so that the transformed sequence begins at a value of 1 unit.
- the intelligence module is further adapted to, after calculating, shift the X values of the double sigmoid function by -Xtrans.
- determining a derivative curve includes taking the negative derivative of the analytical expression with respect to X.
- the present invention provides systems and methods for determining melting temperatures, Tm, for DNA from melt curve data.
- the systems and methods also allow for quantitative determination of gene amount based on peak height.
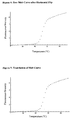
- FIG. 1 One example of a melt curve in the context of a PCR process is shown in FIG. 1 .
- the curve shown in FIG. 1 is a typical melting curve graph that was generated after a PCR experiment in the case where there is only one genotype present. In this curve, the fluorescence intensity decreases as a function of increasing temperature.
- data for a typical melt curve can be represented in a two-dimensional coordinate system, for example, with temperature defining the x-axis and an indicator of accumulated polynucleotide defining the y-axis.
- the indicator of accumulated polynucleotide is a fluorescence intensity value as the use of fluorescent markers is perhaps the most widely used labeling scheme. However, it should be understood that other indicators may be used depending on the particular labeling and/or detection scheme used.
- Examples of other useful indicators of accumulated signal include luminescence intensity, chemiluminescence intensity, bioluminescence intensity, phosphorescence intensity, charge transfer, voltage, current, power, energy, temperature, viscosity, light scatter, radioactive intensity, reflectivity, transmittance and absorbance.
- a process 100 for determining a melting temperature can be described briefly with reference to FIG. 2 .
- an experimental data set representing the melt curve is received or otherwise acquired.
- An example of a plotted melt curve data set is shown in FIG. 1 , where the y-axis (abscissa) and x-axis (ordinate) represent fluorescence intensity and temperature, respectively, for a melt curve.
- the acquired dataset includes a plurality of data points represented as a sequence of data values ⁇ (X 1 ,Y 1 ), (X 2 ,Y 2 )....(X n-1 ,Y n-1 ), (X n ,Y n ) ⁇ , where X represents a temperature (T) value and Y represents a fluorescence intensity value.
- the data set should include data that is continuous and equally spaced along the ordinate axis.
- the data set may be provided to the intelligence module in real time as the data is being collected, or it may be stored in a memory unit or buffer and provided to the intelligence module after an experiment has been completed.
- the data set may be provided to a separate system such as a desktop computer system or other computer system, via a network connection (e.g., LAN, VPN, intranet, Internet, etc.) or direct connection (e.g., USB or other direct wired or wireless connection) to the acquiring device, or provided on a portable medium such as a CD, DVD, floppy disk or the like.
- a network connection e.g., LAN, VPN, intranet, Internet, etc.
- direct connection e.g., USB or other direct wired or wireless connection
- the data set includes data points having a pair of coordinate values (or a 2-dimensional vector).
- the pair of coordinate values typically represents the temperature and the fluorescence intensity value.
- the x-axis (ordinate) typically represents the temperature
- the y-axis (abscissa) typically represents the fluorescence intensity.
- step 120 an analytical expression that fits the dataset is determined.
- a double sigmoid type equation is fit to the data set.
- a Levenberg-Marquardt regression process is used to fit the double sigmoid equation to the data set, although other regression processes may be used.
- step 130 a derivative curve is determined from the analytic expression by taking the derivative of the analytical expression with respect to X (temperature). A peak in the derivative curve is then determined in step 140 by determining a value Xmax corresponding to a maximum derivative (dY/dX) value of the derivative curve.
- step 150 the Tm value(s) and/or peak height value(s) are returned, e.g., for display or further processing.
- Graphical displays may be rendered with a display device, such as a monitor screen or printer, coupled with the system that performed the analysis of FIG. 2 , or data may be provided to a separate system for rendering on a display device.
- FIG 3 illustrates a process 200 of determining a melting temperature using a PCR analogy according to one embodiment.
- the melt curve dataset is transformed to be similar to that of a PCR curve (e.g., when visually viewing the dataset) so as to take advantage of previous algorithms designed to process and analyze PCR data, and hence to determine an analytic equation that fits the melt curve dataset.
- step 210 the melt curve data set is received or otherwise acquired as in step 110.
- step 220 through 260 an analytical expression that fits the dataset is determined.
- step 220 according to one embodiment, a horizontal flip transform is applied to the data set so that the temperature values are reversed.
- a transform is applied such that a sequence ⁇ T 1 ,F 1 ⁇ , ⁇ T 2 ,F 2 ⁇ ,..., ⁇ T n-1 ,F n-1 ⁇ , ⁇ T n ,F n ⁇ would become ⁇ T n ,F 1 ⁇ , ⁇ T n-1 ,F 2 ⁇ ,..., ⁇ T 2 ,F n-1 ⁇ , ⁇ T 1 ,F n ⁇ , where T represents temperature, F represents fluorescence, and the subscript represents order in a sequence.
- T represents temperature
- F represents fluorescence
- the subscript represents order in a sequence.
- step 230 a horizontal translation transform is applied to the data set so that the dataset starts at unit 1 (e.g., 1 degree Celsius) on the X-axis. In this manner, the curve is shifted to the left, so that it starts at 1°C in order to have identical characteristics of a PCR curve, so that analytical expressions previously developed for PCR can be readily applied to the melt curve.
- unit 1 e.g. 1 degree Celsius
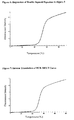
- FIG. 5 The result of this translation to the data of FIG. 4 (in this case by 39.47 C) is shown in FIG. 5 . It should be appreciated that steps 230 need not be performed, and that the order of steps 220 and 230 may be reversed.
- an analytic equation is fit to the data of FIG. 5 .
- a double sigmoid equation is fit to the data curve.
- a double sigmoid function with parameters determined by a Levenberg-Marquardt (LM) regression process or other regression process is used to find an approximation of a curve representing the data set.
- the LM method is a non-linear regression process; it is an iterative technique that minimizes the square of the distance between a non-linear function and a data set.
- the process behaves like a combination of a steepest descent process and a Gauss-Newton process: when the current approximation doesn't fit well it behaves like the steepest descent process (slower but more reliable convergence), but as the current approximation becomes more accurate it will then behave like the Gauss-Newton process (faster but less reliable convergence).
- the LM regression method is widely used to solve non-linear regression problems.
- the LM regression method includes an algorithm that requires various inputs and provides output.
- the inputs include a data set to be processed, a function that is used to fit the data, and an initial guess for the parameters or variables of the function.
- the output includes a set of parameters for the function that minimizes the distance between the function and the data set.
- the double sigmoid equation (1) has 7 parameters: a, b, c, d, e, f and g.
- the equation can be decomposed into a sum of a constant, a slope and a double sigmoid.
- the double sigmoid itself is the multiplication of two sigmoids. Details on methods to fit a double sigmoid equation to a PCR data set, including parameter determination, can be found in US Application Serial Number 11/349,550, filed February 6, 2006 , Publication No. US 2007-0143385 .
- Equation 2 The double sigmoid expression in Equation 2 has to now be transformed back into the raw melt curve format.
- step 250 the curves and double sigmoid expression corresponding to FIG. 6 and equation 2 are shifted by the negative amount shifted in step 230.
- a function for inverse horizontal flip of the curve shown in FIG. 7 is determined and applied.
- the function for inverse horizontal flip can be determined as the sum of the first and last x-axis coordinates of the original raw melt curve minus x.
- the original raw melt data is ⁇ T 1 ,F 1 ⁇ , ⁇ T 2 ,F 2 ⁇ ,..., ⁇ T n-1 ,F n-1 ⁇ , ⁇ T n ,F n ⁇ .
- the inverse horizontal flip function is: (T 1 + T n ) -x.
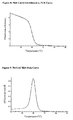
- the graph of ds3(x) with superposition of the original raw melt data is shown in FIG. 8 . It is seen that the fit is near perfect, thereby establishing the functional equivalence between a raw melt curve and a PCR curve.
- step 270 the negative derivative of the functional form of the raw melt curve is determined; the representation of the peaks for melting are established by taking the negative derivative of the raw melt data.
- Equation 5 The graphical representation of Equation 5 is shown in FIG. 9 .
- the melting temperature, Tm, and/or the peak height are determined and returned, e.g., for display or further processing.
- the melting temperature is determined as the temperature corresponding to the maximum of the melt peak curve.
- each channel can be divided by its own mean or median or range, or all channels can be divided by the mean/median/range of a single channel, for example, divide channel 1 and channel 2 by the mean/median/range of channel 1.
- the Tm determination processes may be implemented in computer code running on a processor of a computer system.
- the code includes instructions for controlling a processor to implement various aspects and steps of the Tm determination processes.
- the code is typically stored on a hard disk, RAM or portable medium such as a CD, DVD, etc.
- the processes may be implemented in a PCR device such as a thermocycler, or other specialized device, including a processor executing instructions stored in a memory unit coupled to the processor. Code including such instructions may be downloaded to the device memory unit over a network connection or direct connection to a code source or using a portable medium as is well known.
- Tm determination processes of the present invention can be coded using a variety of programming languages such as C, C++, C#, Fortran, VisualBasic, etc., as well as applications such as Mathematica ® which provide pre-packaged routines, functions and procedures useful for data visualization and analysis. Another example of the latter is MATLAB ® .
- the method according to the invention may be implemented by using conventional personal computer systems including, but not limited to, an input device to input a data set, such as a keyboard, mouse, and the like; a display device to represent a specific point of interest in a region of a curve, such as a monitor; a processing device necessary to carry out each step in the method, such as a CPU; a network interface such as a modem, a data storage device to store the data set, a computer code running on the processor and the like.
- the method may also be implemented in a PCR process such as according to the embodiments of the claims or in a PCR system such as according to the embodiments of claims.
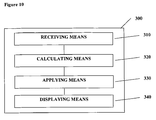
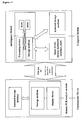
- FIG. 10 shows a general block diagram explaining the relation between software and hardware resources that may be used to implement the method and system of the invention.
- the system depicted on Fig. 11 comprises a kinetic PCR analysis module which may be located in a thermocycler device and an intelligence module which is part of the computer system.
- the data sets (PCR data sets) are transferred from the analysis module to the intelligence module or vice versa via a network connection or a direct connection.
- the data sets may for example be processed according to the flowcharts as depicted on Figs. 2 and 3 . These flowcharts may conveniently be implemented by software stored on the hardware of a computer system for example according to the flowchart as depicted on Fig.
- computer system (300) may comprise receiving means (310) for example for receiving fluorescence data obtained during PCR reactions, calculating means (320) for processing said data according to the method of the invention, applying means (330) for replacing a portion of said data according to the results obtained by the calculation means, and displaying means (340) for displaying the results on a computer screen.
- Fig. 11 illustrates the interaction between the thermocycler device and the computer system.
- the system comprises a kinetic PCR analysis module which may be located in a thermocycler device and an intelligence module which is part of the computer system.
- the data sets (PCR data sets) are transferred from the analysis module to the intelligence module or vice versa via a network connection or a direct connection.
- the data sets may be processed according to Fig. 10 by computer code running on the processor and being stored on the storage device of the intelligence module and after processing transferred back to the storage device of the analysis module, where the modified data may be displayed on a displaying device.
Landscapes
- Life Sciences & Earth Sciences (AREA)
- Health & Medical Sciences (AREA)
- Engineering & Computer Science (AREA)
- Physics & Mathematics (AREA)
- Chemical & Material Sciences (AREA)
- Bioinformatics & Cheminformatics (AREA)
- Medical Informatics (AREA)
- Biophysics (AREA)
- General Health & Medical Sciences (AREA)
- Biotechnology (AREA)
- Spectroscopy & Molecular Physics (AREA)
- Bioinformatics & Computational Biology (AREA)
- Organic Chemistry (AREA)
- Proteomics, Peptides & Aminoacids (AREA)
- Molecular Biology (AREA)
- Theoretical Computer Science (AREA)
- Evolutionary Biology (AREA)
- Software Systems (AREA)
- Genetics & Genomics (AREA)
- Data Mining & Analysis (AREA)
- Artificial Intelligence (AREA)
- Public Health (AREA)
- Bioethics (AREA)
- Computer Vision & Pattern Recognition (AREA)
- Evolutionary Computation (AREA)
- Analytical Chemistry (AREA)
- Zoology (AREA)
- Epidemiology (AREA)
- Wood Science & Technology (AREA)
- Databases & Information Systems (AREA)
- Microbiology (AREA)
- Immunology (AREA)
- Signal Processing (AREA)
- Biochemistry (AREA)
- General Engineering & Computer Science (AREA)
- Measuring Or Testing Involving Enzymes Or Micro-Organisms (AREA)
- Apparatus Associated With Microorganisms And Enzymes (AREA)
Abstract
Description
- The present invention relates generally to processing data representing melt characteristics of oligonucleotides, and more particularly to systems and methods for determining melting temperatures for an oligonucleotide sample based on melt curve data.
- The determination of melting temperatures is an important method to distinguish genotypes. In a typical single step, homogeneous, closed tube method for determining oligonucleotide or DNA melting temperatures, double strand-specific DNA dyes (such as, e.g., SYBR Green I, Molecular Probes, Eugene, Oregon) or labeled oligonucleotides are used to monitor product formation (Wittwer CT, et al., BioTechniques 1997; 22: 130-8) and melting temperature (Ririe KM, et al., Anal. Biochem 1997; 245: 154-60) in real-time PCR. Commonly, amplification is performed using a thermostable enzyme that is stable to the DNA denaturation temperature and at least one pair of oligonuleotide primers. In certain embodiments one or more additional oligonucleotide primers may be used (e.g. for amplifying more than one locus of the DNA or more than one genotype). In particular, fluorescence techniques that are homogeneous and do not require the addition of reagents after commencement of amplification or physical sampling of the reactions for analysis are attractive. Exemplary homogeneous techniques use oligonucleotide primers to locate the region of interest and fluorescent labels or dyes for signal generation. Typical PCR-based methods use FRET oligonucleotide probes with two interacting chromophores (adjacent hybridization probes, TaqMan probes, Molecular Beacons, Scorpions), single oligonucleotide probes with only one fluorophore (G-quenching probes, Crockett, A. O. and C. T. Wittwer, Anal. Biochem. 2001; 290: 89-97 and SimpleProbes, Idaho Technology), and techniques that use a dsDNA dye (e.g. SYBR Green I) instead of covalent, fluorescently-labeled oligonucleotide probes.
- A typical method for determining oligonucleotide or DNA melting temperatures includes the amplification of a portion of the target nucleic acid and a subsequent determination of the melting temperature of the amplicon. In the latter step, the temperature of the sample to be analyzed typically is altered (e.g., raised) by a fraction of a degree over a temperature range and the change in fluorescence is measured. At the melting point, the two strands of DNA will separate and the fluorescence rapidly decreases. The rate of change of the relative fluorescence units (RFU) with time (T) (-d(RFU)/dT) is plotted on the Y-axis versus the temperature on the X-axis. Commonly, the determination of the melting temperatures is performed directly after the amplification step. In certain embodiments, the determination of the melting temperature may be performed already during the course of the amplification reaction.
- Determination of oligonucleotide or DNA melting temperatures, usually performed directly after a PCR experiment, is an important method to distinguish genotypes. Some assays require the determination of multiple melting temperatures to identify wild-type from mutant genes. Alternatively, melting assays can be used with a single genotype to quantitatively determine the amount of a gene based on peak height. For example, recently discussed in the literature is the use of examining the KRAS gene to determine which patients might be candidates for a treatment for non-small cell lung cancer. Patients whose KRAS gene is of a wild-type would benefit from the treatment, whereas if the patient had a mutant variation of this gene, the treatment would be of no benefit. As these treatments often have major side effects, it is very important to determine the patient's correct genotype. It is also useful to know the amount of gene present.
- Therefore, it is desirable to provide systems and methods that accurately and efficiently determine the melting temperature of a DNA sample and the amount of gene based on peak height.
- The present invention provides systems and methods for determining the melting temperature, Tm, for oligonucleotides based on melt curve data. The systems and methods also allow for quantitative determination of the gene amount based on peak height.
- According to various embodiments, a PCR analogy is used to perform quantization of an acquired melting curve dataset. In certain aspects, the melting curve is transformed using a horizontal flip and a horizontal translation. A double sigmoid equation is then fit to the data. Inverse translation and inverse horizontal flip transforms are then applied to the equation to produce an equation based solution of the melt curve dataset. The equation based solution of the melt curve is then used to determine the first derivative (e.g., Tm value) and peak height.
- According to one aspect of the present invention, a computer-implemented method is provided for determining a melting temperature, Tm, of DNA. The method typically includes steps that are implemented in a processing module. The steps of the method typically include receiving a dataset representing a melt curve for a DNA sample, the dataset including a plurality of data points represented as a sequence of data values {(X1,Y1), (X2,Y2)...(Xn-1,Yn-1), (Xn,Yn)}, where X represents a temperature (T) value and Y represents a fluorescence intensity value, determining an analytical expression that fits the dataset, and determining a derivative curve by taking the derivative of the analytical expression with respect to X. The steps of the method also typically include determining a value Xmax corresponding to a maximum derivative (dY/dX) value of the derivative curve, and outputting the value Xmax, wherein the value Xmax represents a melting temperature, Tm, of the DNA sample. In certain aspects, the method further includes determining the peak height of the derivative curve corresponding to the Tm value, and outputting the peak height. In certain aspects, the analytical expression is determined by calculating an approximation of a curve that fits the dataset by applying a regression process to a double sigmoid function to determine parameters of the function. In certain aspects, the regression process is a Levenberg-Marquardt regression process.
- In certain embodiments, the analytical expression is determined by applying a first transform to the dataset such that the sequence of data values {(X1,Y1), (X2,Y2)...(Xn-1,Yn-1), (Xn,Yn)} becomes a transformed sequence {(Xn,Y1), (Xn-1,Y2)...(X2,Yn-1), (X1,Yn)} and calculating an approximation of a curve that fits the transformed sequence by applying a regression process to a double sigmoid function to determine parameters of the double sigmoid function. Herein, in certain aspects the regression process is a Levenberg-Marquardt regression process. In another aspect the method further includes applying a second transform to the double sigmoid function, the second transform being inverse to the first transform. Herein, in certain aspects the second transform includes a function of the form (X1 + Xn) -x.
- In yet another embodiment the method further includes, prior to calculating shifting the X values of the dataset or of the transformed sequence by a first amount (Xtrans) so that the transformed sequence begins at a value of 1 unit. Herein, in certain aspects the method further includes, after calculating, shifting the X values of the double sigmoid function by -Xtrans.
- In yet another aspect of the methods determining a derivative curve includes taking the negative derivative of the analytical expression with respect to X. In yet another aspect of the method the processing module is integrated in one of a computer system or a PCR data acquiring device or system or in a thermocycler (e.g., a kinetic thermocyler).
- According to another aspect of the present invention, a computer readable medium including code for controlling a processor to determining a melting temperature, Tm, of DNA is provided. The code typically includes instructions to receive a dataset representing a melt curve for a DNA sample, the dataset including a plurality of data points represented as a sequence of data values {(X1,Y1), (X2,Y2)...(Xn-1,Yn-1), (Xn,Yn)}, where X represents a temperature (T) value and Y represents a fluorescence intensity value, instructions to determine an analytical expression that fits the dataset, and instructions to determine a derivative curve by taking the derivative of the analytical expression with respect to X. The code also typically includes instructions to determine a value Xmax corresponding to a maximum derivative (dY/dX) value of the derivative curve, and instructions to output the value Xmax, wherein the value Xmax represents a melting temperature, Tm, of the DNA sample. In certain aspects, the code further includes instructions to determine the peak height of the derivative curve corresponding to the Tm value, and output the peak height. In certain aspects, the analytical expression is determined by calculating an approximation of a curve that fits the dataset by applying a regression process to a double sigmoid function to determine parameters of the function. In certain aspects, the regression process is a Levenberg-Marquardt regression process.
- In certain embodiments, the instructions to determine the analytical expression includes instructions to apply a first transform to the dataset such that the sequence of data values {(X1,Y1), (X2,Y2)...(Xn-1,Yn-1), (Xn,Yn)} becomes a transformed sequence {(Xn,Y1), (Xn-1,Y2)...(X2,Yn-1), (X1,Yn)} and to calculate an approximation of a curve that fits the transformed sequence by applying a regression process to a double sigmoid function to determine parameters of the double sigmoid function. Herein, in certain aspects the regression process is a Levenberg-Marquardt regression process. In another aspect, the computer readable medium further includes instructions to apply a second transform to the double sigmoid function, the second transform being inverse to the first transform. Herein, in certain aspects the second transform includes a function of the form (X1 + Xn) -x.
- In yet another embodiment, the computer readable medium further includes instructions to shift the X values of the dataset or of the transformed sequence by a first amount (Xtrans) before calculating so that the transformed sequence begins at a value of 1 unit. Herein, in certain aspects the computer readable further includes instructions to, after calculating, shift the X values of the double sigmoid function by -Xtrans.
- In yet another aspect of the computer readable determining a derivative curve includes taking the negative derivative of the analytical expression with respect to X. In yet another aspect of the computer readable medium the processor is integrated in one of a computer system or a PCR data acquiring device or system.
- According to yet another aspect of the present invention, a kinetic Polymerase Chain Reaction (PCR) system is provided. The PCR system typically includes a kinetic PCR analysis module that generates a melt curve dataset representing a DNA melt curve, the dataset including a plurality of data points represented as a sequence of data values {(X1,Y1), (X2,Y2)...(Xn-1,Yn-1), (Xn,Yn)}, where X represents a temperature (T) value and Y represents a fluorescence intensity value, and an intelligence module adapted to process the melt curve dataset to determine a Tm value. The Intelligence module is typically adapted to determine a Tm value by determining an analytical expression that fits the dataset, to determine a derivative curve by taking the derivative of the analytical expression with respect to X, and to determine a value Xmax corresponding to a maximum derivative (dY/dX) value of the derivative curve. The Intelligence module is further typically adapted to output the value Xmax, wherein the value Xmax represents a melting temperature, Tm, of the DNA sample. In certain aspects, the intelligence module includes one or more processors. In certain aspects, the intelligence module is further adapted to determine the peak height of the derivative curve corresponding to the Tm value and to output the peak height. In certain aspects, the analytical expression is determined by calculating an approximation of a curve that fits the dataset by applying a regression process to a double sigmoid function to determine parameters of the function. In certain aspects, the regression process is a Levenberg-Marquardt regression process.
- In certain embodiments, the analytical expression is determined by applying a first transform to the dataset such that the sequence of data values {(X1,Y1), (X2,Y2)...(Xn-1,Yn-1), (Xn,Yn)} becomes a transformed sequence {(Xn,Y1), (Xn-1,Y2)...(X2,Yn-1), (X1,Yn)} and calculating an approximation of a curve that fits the transformed sequence by applying a regression process to a double sigmoid function to determine parameters of the double sigmoid function. Herein, in certain aspects the regression process is a Levenberg-Marquardt regression process. In another aspect, the analytical expression is further determined by applying a second transform to the double sigmoid function, the second transform being inverse to the first transform. Herein, in certain aspects the second transform includes a function of the form (X1 + Xn) -x.
- In yet another embodiment of the kinetic PCR system, the intelligence module is further adapted to, prior to calculating, shift the X values of the dataset or of the transformed sequence by a first amount (Xtrans) so that the transformed sequence begins at a value of 1 unit. Herein, in certain aspects the intelligence module is further adapted to, after calculating, shift the X values of the double sigmoid function by -Xtrans.
- In yet another aspect of the kinetic PCR system determining a derivative curve includes taking the negative derivative of the analytical expression with respect to X.
- Reference to the remaining portions of the specification, including the drawings and claims, will realize other features and advantages of the present invention. Further features and advantages of the present invention, as well as the structure and operation of various embodiments of the present invention, are described in detail below with respect to the accompanying drawings. In the drawings, like reference numbers indicate identical or functionally similar elements.
-
-
FIG. 1 illustrates an example of a melt curve in the context of a PCR process. -
FIG. 2 illustrates a process for determining a melting temperature according to one embodiment. -
FIG. 3 illustrates a process for determining a melting temperature using a PCR analogy according to one embodiment. -
FIG. 4 illustrates the results of a horizontal flip transform applied to the data set ofFIG. 1 . -
FIG. 5 illustrates the results of a horizontal translation transform applied to the data set ofFIG. 4 . -
Fig. 6 illustrates a resultant double sigmoid curve fit to the data inFIG. 5 . -
Fig. 7 illustrates a result of the inverse translation transform. -
Fig. 8 illustrates a melt curve established as a PCR curve. -
Fig. 9 illustrates a graphical representation of a derived melt peak curve. -
Fig. 10 illustrates an example of general block diagram showing the relation between software and hardware resources that may be used to implement the method and system of the invention -
Fig. 11 illustrates an example of a general block diagram showing the relation between a thermocycler device and a computer system. - The present invention provides systems and methods for determining melting temperatures, Tm, for DNA from melt curve data. The systems and methods also allow for quantitative determination of gene amount based on peak height.
- One example of a melt curve in the context of a PCR process is shown in
FIG. 1 . The curve shown inFIG. 1 is a typical melting curve graph that was generated after a PCR experiment in the case where there is only one genotype present. In this curve, the fluorescence intensity decreases as a function of increasing temperature. - As shown in
FIG. 1 , data for a typical melt curve can be represented in a two-dimensional coordinate system, for example, with temperature defining the x-axis and an indicator of accumulated polynucleotide defining the y-axis. Typically, the indicator of accumulated polynucleotide is a fluorescence intensity value as the use of fluorescent markers is perhaps the most widely used labeling scheme. However, it should be understood that other indicators may be used depending on the particular labeling and/or detection scheme used. Examples of other useful indicators of accumulated signal include luminescence intensity, chemiluminescence intensity, bioluminescence intensity, phosphorescence intensity, charge transfer, voltage, current, power, energy, temperature, viscosity, light scatter, radioactive intensity, reflectivity, transmittance and absorbance. - Consider a typical melt curve as shown in
FIG. 1 . It is desired to obtain one or more melting temperatures from the data represented inFIG 1 . According to one embodiment, aprocess 100 for determining a melting temperature can be described briefly with reference toFIG. 2 . Instep 110, an experimental data set representing the melt curve is received or otherwise acquired. An example of a plotted melt curve data set is shown inFIG. 1 , where the y-axis (abscissa) and x-axis (ordinate) represent fluorescence intensity and temperature, respectively, for a melt curve. The acquired dataset includes a plurality of data points represented as a sequence of data values {(X1,Y1), (X2,Y2)....(Xn-1,Yn-1), (Xn,Yn)}, where X represents a temperature (T) value and Y represents a fluorescence intensity value. In certain aspects, the data set should include data that is continuous and equally spaced along the ordinate axis. - In the case where
process 100 is implemented in an intelligence module (e.g., one or more processors executing instructions) resident in a PCR device such as a thermocycler, the data set may be provided to the intelligence module in real time as the data is being collected, or it may be stored in a memory unit or buffer and provided to the intelligence module after an experiment has been completed. Similarly, the data set may be provided to a separate system such as a desktop computer system or other computer system, via a network connection (e.g., LAN, VPN, intranet, Internet, etc.) or direct connection (e.g., USB or other direct wired or wireless connection) to the acquiring device, or provided on a portable medium such as a CD, DVD, floppy disk or the like. In certain aspects, the data set includes data points having a pair of coordinate values (or a 2-dimensional vector). For melt data, the pair of coordinate values typically represents the temperature and the fluorescence intensity value. When displayed in a two-dimensional graph, for example, the x-axis (ordinate) typically represents the temperature and the y-axis (abscissa) typically represents the fluorescence intensity. After the data set has been received or acquired instep 110, the data set may be analyzed to determine the melting temperature(s) and/or peak height values of derivative curves. - In
step 120, an analytical expression that fits the dataset is determined. As will be discussed in more detail later, in certain aspects, a double sigmoid type equation is fit to the data set. In certain aspects, a Levenberg-Marquardt regression process is used to fit the double sigmoid equation to the data set, although other regression processes may be used. Instep 130, a derivative curve is determined from the analytic expression by taking the derivative of the analytical expression with respect to X (temperature). A peak in the derivative curve is then determined instep 140 by determining a value Xmax corresponding to a maximum derivative (dY/dX) value of the derivative curve. In certain aspects, standard analytical methods of curve maximization, such as Newton, Gradient, Grid Search, and other methods, are used to determine maximum value(s) Xmax of the derivative curve. A value Xmax represents a melting temperature, Tm, of the DNA sample. Instep 150, the Tm value(s) and/or peak height value(s) are returned, e.g., for display or further processing. Graphical displays may be rendered with a display device, such as a monitor screen or printer, coupled with the system that performed the analysis ofFIG. 2 , or data may be provided to a separate system for rendering on a display device. -
FIG 3 illustrates aprocess 200 of determining a melting temperature using a PCR analogy according to one embodiment. In this embodiment, the melt curve dataset is transformed to be similar to that of a PCR curve (e.g., when visually viewing the dataset) so as to take advantage of previous algorithms designed to process and analyze PCR data, and hence to determine an analytic equation that fits the melt curve dataset. - In
step 210, the melt curve data set is received or otherwise acquired as instep 110. Instep 220 through 260, an analytical expression that fits the dataset is determined. Instep 220, according to one embodiment, a horizontal flip transform is applied to the data set so that the temperature values are reversed. For example, a transform is applied such that a sequence {{T1,F1}, {T2,F2},..., {Tn-1,Fn-1}, {Tn,Fn}} would become {{Tn,F1}, {Tn-1,F2},..., {T2,Fn-1}, {T1,Fn}}, where T represents temperature, F represents fluorescence, and the subscript represents order in a sequence. Performing this transformation on the data inFIG. 1 yields the result shown inFIG. 4 . AsFIG. 4 indicates, this shape is now representative of a typical PCR curve. Instep 230, a horizontal translation transform is applied to the data set so that the dataset starts at unit 1 (e.g., 1 degree Celsius) on the X-axis. In this manner, the curve is shifted to the left, so that it starts at 1°C in order to have identical characteristics of a PCR curve, so that analytical expressions previously developed for PCR can be readily applied to the melt curve. The result of this translation to the data ofFIG. 4 (in this case by 39.47 C) is shown inFIG. 5 . It should be appreciated thatsteps 230 need not be performed, and that the order ofsteps - In
step 240, an analytic equation is fit to the data ofFIG. 5 . In one embodiment, a double sigmoid equation is fit to the data curve. As the curve inFIG. 5 has the characteristics of a PCR curve, methods previously developed to fit a double sigmoid equation can be applied to this data. Instep 240, in one embodiment, a double sigmoid function with parameters determined by a Levenberg-Marquardt (LM) regression process or other regression process is used to find an approximation of a curve representing the data set. The LM method is a non-linear regression process; it is an iterative technique that minimizes the square of the distance between a non-linear function and a data set. The process behaves like a combination of a steepest descent process and a Gauss-Newton process: when the current approximation doesn't fit well it behaves like the steepest descent process (slower but more reliable convergence), but as the current approximation becomes more accurate it will then behave like the Gauss-Newton process (faster but less reliable convergence). The LM regression method is widely used to solve non-linear regression problems. - In general, the LM regression method includes an algorithm that requires various inputs and provides output. In one aspect, the inputs include a data set to be processed, a function that is used to fit the data, and an initial guess for the parameters or variables of the function. The output includes a set of parameters for the function that minimizes the distance between the function and the data set.
- According to one embodiment, the fit function is a double sigmoid of the form:

- The choice of this equation as the fit function is based on its flexibility and its ability to fit the different curve shapes that a typical PCR curve or other growth curve may take.
- One skilled in the art will appreciate that variations of the above fit function or other fit functions may be used as desired. The double sigmoid equation (1) has 7 parameters: a, b, c, d, e, f and g. The equation can be decomposed into a sum of a constant, a slope and a double sigmoid. The double sigmoid itself is the multiplication of two sigmoids. Details on methods to fit a double sigmoid equation to a PCR data set, including parameter determination, can be found in
US Application Serial Number 11/349,550, filed February 6, 2006 US 2007-0143385 . - The resultant double sigmoid curve fit to the data in
FIG. 5 is shown inFIG. 6 , and the double sigmoid expression is shown in Equation 2:
- The double sigmoid expression in Equation 2 has to now be transformed back into the raw melt curve format. In
step 250, the curves and double sigmoid expression corresponding toFIG. 6 and equation 2 are shifted by the negative amount shifted instep 230. The resultant shifted curve and double sigmoid expression are shown inFIG. 7 andEquation 3 respectively
- In
step 260, a function for inverse horizontal flip of the curve shown inFIG. 7 is determined and applied. The function for inverse horizontal flip can be determined as the sum of the first and last x-axis coordinates of the original raw melt curve minus x. For example, assume the original raw melt data is {{T1,F1}, {T2,F2},..., {Tn-1,Fn-1}, {Tn,Fn}}. Then the inverse horizontal flip function is: (T1 + Tn) -x. For the data inFIG. 7 , the inverse function is found to be InvFlip(x) = 125 - x. - The re-establishment of the original melt function and curve are shown in
FIG. 8 and Equation 4:
- Equation 4 is determined as ds3(x) = ds2(InvFlip(x)). The graph of ds3(x) with superposition of the original raw melt data is shown in
FIG. 8 . It is seen that the fit is near perfect, thereby establishing the functional equivalence between a raw melt curve and a PCR curve. - In
step 270, the negative derivative of the functional form of the raw melt curve is determined; the representation of the peaks for melting are established by taking the negative derivative of the raw melt data. Using the equivalent analytical expression for the raw melt curve, the expression of the melt peak curve is derived as Equation 5:
- The graphical representation of
Equation 5 is shown inFIG. 9 . - In
step 280, the melting temperature, Tm, and/or the peak height are determined and returned, e.g., for display or further processing. The melting temperature is determined as the temperature corresponding to the maximum of the melt peak curve. The melting temperature, Tm, can be found by standard analytical methods of curve maximization, such as Newton, Gradient, Grid Search, and other methods. In the example used herein, the maximum temperature was found to be Tm = 59.64, and the peak height is found to be peak height = 0.655. - The methodologies described herein can be extended to melting curves with multiple peaks by using an analytical expression for a PCR curve that allows for multiple elbows. Alternatively, one can re-establish procedures to directly apply a double sigmoid expression to the original raw melt curve, so that the melt-PCR analogy is not required. Details for establishing such procedures can be found in
US Application Serial Number 11/349,550, filed February 6, 2006 US 2007-0143385 . - It should be appreciated that one can make the resultant peak height values machine independent, by divide the raw data by either of the following:
- 1) mean
- 2) median
- 3) range (max - min).
- If the machine comprises multiple channels, then each channel can be divided by its own mean or median or range, or all channels can be divided by the mean/median/range of a single channel, for example,
divide channel 1 and channel 2 by the mean/median/range ofchannel 1. - It also should be appreciated that the Tm determination processes may be implemented in computer code running on a processor of a computer system. The code includes instructions for controlling a processor to implement various aspects and steps of the Tm determination processes. The code is typically stored on a hard disk, RAM or portable medium such as a CD, DVD, etc. Similarly, the processes may be implemented in a PCR device such as a thermocycler, or other specialized device, including a processor executing instructions stored in a memory unit coupled to the processor. Code including such instructions may be downloaded to the device memory unit over a network connection or direct connection to a code source or using a portable medium as is well known.
- One skilled in the art should appreciate that the Tm determination processes of the present invention can be coded using a variety of programming languages such as C, C++, C#, Fortran, VisualBasic, etc., as well as applications such as Mathematica® which provide pre-packaged routines, functions and procedures useful for data visualization and analysis. Another example of the latter is MATLAB®.
- In a certain embodiment the method according to the invention may be implemented by using conventional personal computer systems including, but not limited to, an input device to input a data set, such as a keyboard, mouse, and the like; a display device to represent a specific point of interest in a region of a curve, such as a monitor; a processing device necessary to carry out each step in the method, such as a CPU; a network interface such as a modem, a data storage device to store the data set, a computer code running on the processor and the like. Furthermore, the method may also be implemented in a PCR process such as according to the embodiments of the claims or in a PCR system such as according to the embodiments of claims.
- An example of a system according to the invention is displayed in
Fig. 10-11 .Fig. 10 shows a general block diagram explaining the relation between software and hardware resources that may be used to implement the method and system of the invention. The system depicted onFig. 11 comprises a kinetic PCR analysis module which may be located in a thermocycler device and an intelligence module which is part of the computer system. The data sets (PCR data sets) are transferred from the analysis module to the intelligence module or vice versa via a network connection or a direct connection. The data sets may for example be processed according to the flowcharts as depicted onFigs. 2 and3 . These flowcharts may conveniently be implemented by software stored on the hardware of a computer system for example according to the flowchart as depicted onFig. 10 . Referring toFig. 10 , computer system (300) may comprise receiving means (310) for example for receiving fluorescence data obtained during PCR reactions, calculating means (320) for processing said data according to the method of the invention, applying means (330) for replacing a portion of said data according to the results obtained by the calculation means, and displaying means (340) for displaying the results on a computer screen.Fig. 11 illustrates the interaction between the thermocycler device and the computer system. The system comprises a kinetic PCR analysis module which may be located in a thermocycler device and an intelligence module which is part of the computer system. The data sets (PCR data sets) are transferred from the analysis module to the intelligence module or vice versa via a network connection or a direct connection. The data sets may be processed according toFig. 10 by computer code running on the processor and being stored on the storage device of the intelligence module and after processing transferred back to the storage device of the analysis module, where the modified data may be displayed on a displaying device. - While the invention has been described by way of example and in terms of the specific embodiments, it is to be understood that the invention is not limited to the disclosed embodiments. To the contrary, it is intended to cover various modifications and similar arrangements as would be apparent to those skilled in the art. Therefore, the scope of the appended claims should be accorded the broadest interpretation so as to encompass all such modifications and similar arrangements.
Claims (15)
- A computer-implemented method of determining a melting temperature, Tm, of DNA, the method comprising steps, implemented in a processing module, of:- receiving a dataset representing a melt curve for a DNA sample, the dataset including a plurality of data points represented as a sequence of data values {(X1,Y1), (X2,Y2)...(Xn-1,Yn-1), (Xn,Yn)}, where X represents a temperature (T) value and Y represents a fluorescence intensity value;- determining an analytical expression that fits the dataset;- determining a derivative curve by taking the derivative of the analytical expression with respect to X;- determining a value Xmax corresponding to a maximum derivative (dY/dX) value of the derivative curve; and- outputting the value Xmax, wherein the value Xmax represents a melting temperature, Tm, of the DNA sample.
- The method of claim 1, further including:- determining the peak height of the derivative curve corresponding to the Tm value; and- outputting the peak height.
- The method of claim 1 or 2, wherein the analytical expression is determined by:- calculating an approximation of a curve that fits the dataset by applying a regression process to a double sigmoid function to determine parameters of the function.
- The method of claim 3, wherein the regression process is a Levenberg-Marquardt regression process.
- The method of any one of claims 1 to 4, wherein the analytical expression is determined by:- applying a first transform to the dataset such that the sequence of data values {(X1,Y1), (X2,Y2)...(Xn-1,Yn-1), (Xn,Yn)} becomes a transformed sequence {(Xn,Y1), (Xn-1,Y2)...(X2,Yn-1), (X1,Yn)}; and- calculating an approximation of a curve that fits the transformed sequence by applying a regression process to a double sigmoid function to determine parameters of the double sigmoid function.
- The method of claim 5, wherein the regression process is a Levenberg-Marquardt regression process.
- The method of claim 5 or 6, further including applying a second transform to the double sigmoid function, the second transform being inverse to the first transform.
- The method of claim 7, wherein the second transform includes a function of the form (X1 + Xn) -x.
- The method of any one of claims 5 to 8, further including, prior to calculating:- shifting the X values of the dataset or of the transformed sequence by a first amount (Xtrans) so that the transformed sequence begins at a value of 1 unit.
- The method of claim 9, further including, after calculating, shifting the X values of the double sigmoid function by -Xtrans.
- The method of any one of claims 1 to 10, wherein determining a derivative curve includes taking the negative derivative of the analytical expression with respect to X.
- A computer readable medium including code for controlling a processor to determining a melting temperature, Tm, of DNA, the code including instructions to:- receive a dataset representing a melt curve for a DNA sample, the dataset including a plurality of data points represented as a sequence of data values {(X1,Y1), (X2,Y2)...(Xn-1,Yn-1), (Xn,Yn)}, where X represents a temperature (T) value and Y represents a fluorescence intensity value;- determine an analytical expression that fits the dataset;- determine a derivative curve by taking the derivative of the analytical expression with respect to X;- determine a value Xmax corresponding to a maximum dY/dX value of the derivative curve; and- output the value Xmax, wherein the value Xmax represents a melting temperature, Tm, of the DNA sample.
- A kinetic Polymerase Chain Reaction (PCR) system, comprising:- a kinetic PCR analysis module that generates a melt curve dataset representing a DNA melt curve, said dataset including a plurality of data points represented as a sequence of data values {(X1,Y1), (X2,Y2)...(Xn-1,Yn-1), (Xn,Yn)}, where X represents a temperature (T) value and Y represents a fluorescence intensity value; and- an intelligence module adapted to process the melt curve dataset to determine a Tm value, by:- determining an analytical expression that fits the dataset;- determining a derivative curve by taking the derivative of the analytical expression with respect to X;- determining a value Xmax corresponding to a maximum derivative (dY/dX) value of the derivative curve; and- outputting the value Xmax, wherein the value Xmax represents a melting temperature, Tm, of the DNA sample.
- The kinetic PCR system of claim 13, wherein the intelligence module is further adapted to:- determine the peak height of the derivative curve corresponding to the Tm value; and- output the peak height.
- The kinetic PCR system of claim 13 or 14, wherein the analytical expression is determined by:- calculating an approximation of a curve that fits the dataset by applying a regression process to a double sigmoid function to determine parameters of the function.
Applications Claiming Priority (1)
| Application Number | Priority Date | Filing Date | Title |
|---|---|---|---|
| US12/425,695 US8265879B2 (en) | 2009-04-17 | 2009-04-17 | Determination of single peak melting temperature by PCR analogy and double sigmoid equation |
Publications (2)
| Publication Number | Publication Date |
|---|---|
| EP2241990A1 true EP2241990A1 (en) | 2010-10-20 |
| EP2241990B1 EP2241990B1 (en) | 2017-05-17 |
Family
ID=42352230
Family Applications (1)
| Application Number | Title | Priority Date | Filing Date |
|---|---|---|---|
| EP10003919.7A Active EP2241990B1 (en) | 2009-04-17 | 2010-04-14 | Determination of single peak melting temperature by PCR analogy and double sigmoid equation |
Country Status (5)
| Country | Link |
|---|---|
| US (1) | US8265879B2 (en) |
| EP (1) | EP2241990B1 (en) |
| JP (1) | JP5749448B2 (en) |
| CN (1) | CN101882185B (en) |
| CA (1) | CA2701078A1 (en) |
Cited By (2)
| Publication number | Priority date | Publication date | Assignee | Title |
|---|---|---|---|---|
| WO2012106481A1 (en) * | 2011-02-01 | 2012-08-09 | Life Technologies Coporation | Systems and methods for the analysis of protein melt curve data |
| WO2019145303A1 (en) | 2018-01-23 | 2019-08-01 | Biocartis Nv | Methods for the analysis of dissociation melt curve data |
Families Citing this family (12)
| Publication number | Priority date | Publication date | Assignee | Title |
|---|---|---|---|---|
| JP6300452B2 (en) * | 2012-05-17 | 2018-03-28 | タカラバイオ株式会社 | Composition for DNA synthesis comprising intercalating dye and surfactant |
| JP5950740B2 (en) * | 2012-07-24 | 2016-07-13 | 株式会社日立ハイテクノロジーズ | Nucleic acid amplification analyzer and nucleic acid amplification analysis method |
| US10577895B2 (en) | 2012-11-20 | 2020-03-03 | Drilling Info, Inc. | Energy deposit discovery system and method |
| US10853893B2 (en) * | 2013-04-17 | 2020-12-01 | Drilling Info, Inc. | System and method for automatically correlating geologic tops |
| EP2989209A1 (en) * | 2013-04-23 | 2016-03-02 | Thermo Fisher Scientific OY | Melt curve analysis |
| CN104280417B (en) * | 2013-07-12 | 2017-02-08 | 中国科学院理化技术研究所 | Device and method for rapidly screening lowest-melting-point multi-element alloy |
| US9607128B2 (en) * | 2013-12-30 | 2017-03-28 | Roche Molecular Systems, Inc. | Detection and correction of jumps in real-time PCR signals |
| US10908316B2 (en) | 2015-10-15 | 2021-02-02 | Drilling Info, Inc. | Raster log digitization system and method |
| CN105954315A (en) * | 2016-05-03 | 2016-09-21 | 西安电子科技大学 | Method for determining phase transition temperature of two-component liposome |
| CN113215325B (en) * | 2021-06-10 | 2023-10-10 | 上海市第十人民医院 | Two-dimensional PCR reaction system, method and kit for single-tube closed-tube detection of multiple HPV subtypes |
| CN114854837B (en) * | 2022-05-30 | 2026-03-06 | 杭州博日科技股份有限公司 | Methods, apparatus, electronic equipment and storage media for determining the Tm value of melting curve |
| CN115545123B (en) * | 2022-11-29 | 2023-04-28 | 杭州博日科技股份有限公司 | Melting curve optimization method and device, electronic equipment and storage medium |
Citations (1)
| Publication number | Priority date | Publication date | Assignee | Title |
|---|---|---|---|---|
| US20070143385A1 (en) | 2005-12-20 | 2007-06-21 | Roche Molecular Systems, Inc. | PCR elbow determination by use of a double sigmoid function curve fit with the Levenberg-Marquardt algorithm and normalization |
Family Cites Families (3)
| Publication number | Priority date | Publication date | Assignee | Title |
|---|---|---|---|---|
| DE19732340A1 (en) | 1997-07-28 | 1999-02-04 | Mannesmann Vdo Ag | Accelerator pedal |
| US6303305B1 (en) | 1999-03-30 | 2001-10-16 | Roche Diagnostics, Gmbh | Method for quantification of an analyte |
| EP1992703B1 (en) * | 2006-03-13 | 2012-04-11 | Wako Pure Chemical Industries, Ltd. | Method for detection of mutant gene |
-
2009
- 2009-04-17 US US12/425,695 patent/US8265879B2/en active Active
-
2010
- 2010-04-14 EP EP10003919.7A patent/EP2241990B1/en active Active
- 2010-04-15 JP JP2010094354A patent/JP5749448B2/en active Active
- 2010-04-15 CA CA2701078A patent/CA2701078A1/en not_active Abandoned
- 2010-04-16 CN CN201010194872.8A patent/CN101882185B/en active Active
Patent Citations (1)
| Publication number | Priority date | Publication date | Assignee | Title |
|---|---|---|---|---|
| US20070143385A1 (en) | 2005-12-20 | 2007-06-21 | Roche Molecular Systems, Inc. | PCR elbow determination by use of a double sigmoid function curve fit with the Levenberg-Marquardt algorithm and normalization |
Non-Patent Citations (8)
| Title |
|---|
| CROCKETT, A. O.; C. T. WITTWER: "G-quenching probes", ANAL. BIOCHEM., vol. 290, 2001, pages 89 - 97 |
| LIU WEIHONG ET AL: "Validation of a quantitative method for real time PCR kinetics", BIOCHEMICAL AND BIOPHYSICAL RESEARCH COMMUNICATIONS, vol. 294, no. 2, 7 June 2002 (2002-06-07), pages 347 - 353, XP002594647, ISSN: 0006-291X * |
| MERGNY JEAN-LOUIS ET AL: "Analysis of thermal melting curves.", OLIGONUCLEOTIDES, vol. 13, no. 6, 2003, pages 515 - 537, XP002594648, ISSN: 1545-4576 * |
| PRYOR ROBERT J ET AL: "Real-time polymerase chain reaction and melting curve analysis", METHODS IN MOLECULAR BIOLOGY HUMANA PRESS INC, 999 RIVERVIEW DR, STE 208, TOTOWA, NJ 07512-1165 USA SERIES : METHODS IN MOLECULAR BIOLOGY (ISSN 1064-3745(PRINT)), 2006, pages 19 - 32, XP002594646 * |
| RIRIE KM ET AL., ANAL. BIOCHEM, vol. 245, 1997, pages 154 - 160 |
| WILHELM ET AL: "SoFAR: Software for Fully Automatic Evaluation of Real-Time PCR Data", BIOTECHNIQUES, INFORMA LIFE SCIENCES PUBLISHING, WESTBOROUGH, MA, US, vol. 34, no. 2, 1 January 2003 (2003-01-01), pages 324 - 332, XP003024150, ISSN: 0736-6205 * |
| WITTWER CT ET AL., BIOTECHNIQUES, vol. 22, 1997, pages 130 - 138 |
| ZHAO SHENG ET AL: "Comprehensive algorithm for quantitative real-time polymerase chain reaction", JOURNAL OF COMPUTATIONAL BIOLOGY, MARY ANN LIEBERT INC, US LNKD- DOI:10.1089/CMB.2005.12.1047, vol. 12, no. 8, 1 October 2005 (2005-10-01), pages 1047 - 1064, XP002380886, ISSN: 1066-5277 * |
Cited By (3)
| Publication number | Priority date | Publication date | Assignee | Title |
|---|---|---|---|---|
| WO2012106481A1 (en) * | 2011-02-01 | 2012-08-09 | Life Technologies Coporation | Systems and methods for the analysis of protein melt curve data |
| US10340029B2 (en) | 2011-02-01 | 2019-07-02 | Life Technologies Corporation | Systems and methods for the analysis of protein melt curve data |
| WO2019145303A1 (en) | 2018-01-23 | 2019-08-01 | Biocartis Nv | Methods for the analysis of dissociation melt curve data |
Also Published As
| Publication number | Publication date |
|---|---|
| JP5749448B2 (en) | 2015-07-15 |
| EP2241990B1 (en) | 2017-05-17 |
| CA2701078A1 (en) | 2010-10-17 |
| CN101882185A (en) | 2010-11-10 |
| US20100268472A1 (en) | 2010-10-21 |
| US8265879B2 (en) | 2012-09-11 |
| CN101882185B (en) | 2015-06-17 |
| JP2010246540A (en) | 2010-11-04 |
Similar Documents
| Publication | Publication Date | Title |
|---|---|---|
| EP2241990B1 (en) | Determination of single peak melting temperature by PCR analogy and double sigmoid equation | |
| CN1987880B (en) | Pcr elbow determination by use of a double sigmoid function curve fit with the levenberg-marquardt algorithm and normalization | |
| Kreitmann et al. | Next-generation molecular diagnostics: Leveraging digital technologies to enhance multiplexing in real-time PCR | |
| EP1801706B1 (en) | PCR elbow determination by use of a double sigmoid function curve fit with the Levenberg-Marquardt algorithm and normalization | |
| CN101710363B (en) | Determination of real-time PCR inflexion through no-equation algorithm | |
| CN101908037B (en) | PCR elbow determination using curvature analysis of a double sigmoid | |
| EP2904110B1 (en) | Universal method to determine real-time pcr cycle threshold values | |
| EP2107470B1 (en) | PCR elbow determination using quadratic test for curvature analysis of a double sigmoid | |
| EP1770172B1 (en) | Determination of the cycle threshold (Ct) value in a PCR amplification curve by cluster analysis with variable cluster endpoint | |
| EP2471007B1 (en) | Determination of elbow values for pcr for parabolic shaped curves | |
| CN101872386B (en) | Temperature step correction using double sigmoid LEVENBERG-MARQUARDT and robust linear regression | |
| US20100100363A1 (en) | Determination of Melting Temperatures by Equation-Less Methods | |
| EP2180418B1 (en) | Determination of melting temperatures by equation-less methods | |
| Stone et al. | A multi-stage model for quantitative PCR | |
| HK1105689B (en) | Pcr elbow determination by use a double sigmoid function curve fit with the levenberg-marquardt and normalization | |
| HK1106304A (en) | Pcr elbow determination using curvature analysis of a double sigmoid |
Legal Events
| Date | Code | Title | Description |
|---|---|---|---|
| PUAI | Public reference made under article 153(3) epc to a published international application that has entered the european phase |
Free format text: ORIGINAL CODE: 0009012 |
|
| AK | Designated contracting states |
Kind code of ref document: A1 Designated state(s): AT BE BG CH CY CZ DE DK EE ES FI FR GB GR HR HU IE IS IT LI LT LU LV MC MK MT NL NO PL PT RO SE SI SK SM TR |
|
| AX | Request for extension of the european patent |
Extension state: AL BA ME RS |
|
| 17P | Request for examination filed |
Effective date: 20110420 |
|
| REG | Reference to a national code |
Ref country code: DE Ref legal event code: R079 Ref document number: 602010042353 Country of ref document: DE Free format text: PREVIOUS MAIN CLASS: G06F0019000000 Ipc: G06F0019240000 |
|
| GRAP | Despatch of communication of intention to grant a patent |
Free format text: ORIGINAL CODE: EPIDOSNIGR1 |
|
| RIC1 | Information provided on ipc code assigned before grant |
Ipc: C12Q 1/68 20060101ALN20161123BHEP Ipc: G06F 19/24 20110101AFI20161123BHEP |
|
| RIC1 | Information provided on ipc code assigned before grant |
Ipc: G06F 19/24 20110101AFI20161128BHEP Ipc: C12Q 1/68 20060101ALN20161128BHEP |
|
| INTG | Intention to grant announced |
Effective date: 20161215 |
|
| RIN1 | Information on inventor provided before grant (corrected) |
Inventor name: THURNHERR, THOMAS Inventor name: KURNIK, RONALD, T. |
|
| GRAS | Grant fee paid |
Free format text: ORIGINAL CODE: EPIDOSNIGR3 |
|
| GRAA | (expected) grant |
Free format text: ORIGINAL CODE: 0009210 |
|
| AK | Designated contracting states |
Kind code of ref document: B1 Designated state(s): AT BE BG CH CY CZ DE DK EE ES FI FR GB GR HR HU IE IS IT LI LT LU LV MC MK MT NL NO PL PT RO SE SI SK SM TR |
|
| REG | Reference to a national code |
Ref country code: GB Ref legal event code: FG4D |
|
| REG | Reference to a national code |
Ref country code: CH Ref legal event code: EP |
|
| REG | Reference to a national code |
Ref country code: IE Ref legal event code: FG4D |
|
| REG | Reference to a national code |
Ref country code: AT Ref legal event code: REF Ref document number: 895081 Country of ref document: AT Kind code of ref document: T Effective date: 20170615 |
|
| REG | Reference to a national code |
Ref country code: DE Ref legal event code: R096 Ref document number: 602010042353 Country of ref document: DE |
|
| REG | Reference to a national code |
Ref country code: NL Ref legal event code: MP Effective date: 20170517 |
|
| REG | Reference to a national code |
Ref country code: LT Ref legal event code: MG4D |
|
| REG | Reference to a national code |
Ref country code: AT Ref legal event code: MK05 Ref document number: 895081 Country of ref document: AT Kind code of ref document: T Effective date: 20170517 |
|
| PG25 | Lapsed in a contracting state [announced via postgrant information from national office to epo] |
Ref country code: ES Free format text: LAPSE BECAUSE OF FAILURE TO SUBMIT A TRANSLATION OF THE DESCRIPTION OR TO PAY THE FEE WITHIN THE PRESCRIBED TIME-LIMIT Effective date: 20170517 Ref country code: LT Free format text: LAPSE BECAUSE OF FAILURE TO SUBMIT A TRANSLATION OF THE DESCRIPTION OR TO PAY THE FEE WITHIN THE PRESCRIBED TIME-LIMIT Effective date: 20170517 Ref country code: GR Free format text: LAPSE BECAUSE OF FAILURE TO SUBMIT A TRANSLATION OF THE DESCRIPTION OR TO PAY THE FEE WITHIN THE PRESCRIBED TIME-LIMIT Effective date: 20170818 Ref country code: HR Free format text: LAPSE BECAUSE OF FAILURE TO SUBMIT A TRANSLATION OF THE DESCRIPTION OR TO PAY THE FEE WITHIN THE PRESCRIBED TIME-LIMIT Effective date: 20170517 Ref country code: FI Free format text: LAPSE BECAUSE OF FAILURE TO SUBMIT A TRANSLATION OF THE DESCRIPTION OR TO PAY THE FEE WITHIN THE PRESCRIBED TIME-LIMIT Effective date: 20170517 Ref country code: AT Free format text: LAPSE BECAUSE OF FAILURE TO SUBMIT A TRANSLATION OF THE DESCRIPTION OR TO PAY THE FEE WITHIN THE PRESCRIBED TIME-LIMIT Effective date: 20170517 Ref country code: NO Free format text: LAPSE BECAUSE OF FAILURE TO SUBMIT A TRANSLATION OF THE DESCRIPTION OR TO PAY THE FEE WITHIN THE PRESCRIBED TIME-LIMIT Effective date: 20170817 |
|
| PG25 | Lapsed in a contracting state [announced via postgrant information from national office to epo] |
Ref country code: PL Free format text: LAPSE BECAUSE OF FAILURE TO SUBMIT A TRANSLATION OF THE DESCRIPTION OR TO PAY THE FEE WITHIN THE PRESCRIBED TIME-LIMIT Effective date: 20170517 Ref country code: LV Free format text: LAPSE BECAUSE OF FAILURE TO SUBMIT A TRANSLATION OF THE DESCRIPTION OR TO PAY THE FEE WITHIN THE PRESCRIBED TIME-LIMIT Effective date: 20170517 Ref country code: IS Free format text: LAPSE BECAUSE OF FAILURE TO SUBMIT A TRANSLATION OF THE DESCRIPTION OR TO PAY THE FEE WITHIN THE PRESCRIBED TIME-LIMIT Effective date: 20170917 Ref country code: NL Free format text: LAPSE BECAUSE OF FAILURE TO SUBMIT A TRANSLATION OF THE DESCRIPTION OR TO PAY THE FEE WITHIN THE PRESCRIBED TIME-LIMIT Effective date: 20170517 Ref country code: BG Free format text: LAPSE BECAUSE OF FAILURE TO SUBMIT A TRANSLATION OF THE DESCRIPTION OR TO PAY THE FEE WITHIN THE PRESCRIBED TIME-LIMIT Effective date: 20170817 Ref country code: SE Free format text: LAPSE BECAUSE OF FAILURE TO SUBMIT A TRANSLATION OF THE DESCRIPTION OR TO PAY THE FEE WITHIN THE PRESCRIBED TIME-LIMIT Effective date: 20170517 |
|
| PG25 | Lapsed in a contracting state [announced via postgrant information from national office to epo] |
Ref country code: DK Free format text: LAPSE BECAUSE OF FAILURE TO SUBMIT A TRANSLATION OF THE DESCRIPTION OR TO PAY THE FEE WITHIN THE PRESCRIBED TIME-LIMIT Effective date: 20170517 Ref country code: EE Free format text: LAPSE BECAUSE OF FAILURE TO SUBMIT A TRANSLATION OF THE DESCRIPTION OR TO PAY THE FEE WITHIN THE PRESCRIBED TIME-LIMIT Effective date: 20170517 Ref country code: RO Free format text: LAPSE BECAUSE OF FAILURE TO SUBMIT A TRANSLATION OF THE DESCRIPTION OR TO PAY THE FEE WITHIN THE PRESCRIBED TIME-LIMIT Effective date: 20170517 Ref country code: CZ Free format text: LAPSE BECAUSE OF FAILURE TO SUBMIT A TRANSLATION OF THE DESCRIPTION OR TO PAY THE FEE WITHIN THE PRESCRIBED TIME-LIMIT Effective date: 20170517 Ref country code: SK Free format text: LAPSE BECAUSE OF FAILURE TO SUBMIT A TRANSLATION OF THE DESCRIPTION OR TO PAY THE FEE WITHIN THE PRESCRIBED TIME-LIMIT Effective date: 20170517 |
|
| REG | Reference to a national code |
Ref country code: DE Ref legal event code: R097 Ref document number: 602010042353 Country of ref document: DE |
|
| PG25 | Lapsed in a contracting state [announced via postgrant information from national office to epo] |
Ref country code: IT Free format text: LAPSE BECAUSE OF FAILURE TO SUBMIT A TRANSLATION OF THE DESCRIPTION OR TO PAY THE FEE WITHIN THE PRESCRIBED TIME-LIMIT Effective date: 20170517 Ref country code: SM Free format text: LAPSE BECAUSE OF FAILURE TO SUBMIT A TRANSLATION OF THE DESCRIPTION OR TO PAY THE FEE WITHIN THE PRESCRIBED TIME-LIMIT Effective date: 20170517 |
|
| REG | Reference to a national code |
Ref country code: FR Ref legal event code: PLFP Year of fee payment: 9 |
|
| PLBE | No opposition filed within time limit |
Free format text: ORIGINAL CODE: 0009261 |
|
| STAA | Information on the status of an ep patent application or granted ep patent |
Free format text: STATUS: NO OPPOSITION FILED WITHIN TIME LIMIT |
|
| 26N | No opposition filed |
Effective date: 20180220 |
|
| PG25 | Lapsed in a contracting state [announced via postgrant information from national office to epo] |
Ref country code: SI Free format text: LAPSE BECAUSE OF FAILURE TO SUBMIT A TRANSLATION OF THE DESCRIPTION OR TO PAY THE FEE WITHIN THE PRESCRIBED TIME-LIMIT Effective date: 20170517 |
|
| REG | Reference to a national code |
Ref country code: DE Ref legal event code: R079 Ref document number: 602010042353 Country of ref document: DE Free format text: PREVIOUS MAIN CLASS: G06F0019240000 Ipc: G16B0040000000 |
|
| PG25 | Lapsed in a contracting state [announced via postgrant information from national office to epo] |
Ref country code: MC Free format text: LAPSE BECAUSE OF FAILURE TO SUBMIT A TRANSLATION OF THE DESCRIPTION OR TO PAY THE FEE WITHIN THE PRESCRIBED TIME-LIMIT Effective date: 20170517 |
|
| REG | Reference to a national code |
Ref country code: BE Ref legal event code: MM Effective date: 20180430 |
|
| REG | Reference to a national code |
Ref country code: IE Ref legal event code: MM4A |
|
| PG25 | Lapsed in a contracting state [announced via postgrant information from national office to epo] |
Ref country code: LU Free format text: LAPSE BECAUSE OF NON-PAYMENT OF DUE FEES Effective date: 20180414 |
|
| PG25 | Lapsed in a contracting state [announced via postgrant information from national office to epo] |
Ref country code: BE Free format text: LAPSE BECAUSE OF NON-PAYMENT OF DUE FEES Effective date: 20180430 |
|
| PG25 | Lapsed in a contracting state [announced via postgrant information from national office to epo] |
Ref country code: IE Free format text: LAPSE BECAUSE OF NON-PAYMENT OF DUE FEES Effective date: 20180414 |
|
| PG25 | Lapsed in a contracting state [announced via postgrant information from national office to epo] |
Ref country code: MT Free format text: LAPSE BECAUSE OF NON-PAYMENT OF DUE FEES Effective date: 20180414 |
|
| PG25 | Lapsed in a contracting state [announced via postgrant information from national office to epo] |
Ref country code: TR Free format text: LAPSE BECAUSE OF FAILURE TO SUBMIT A TRANSLATION OF THE DESCRIPTION OR TO PAY THE FEE WITHIN THE PRESCRIBED TIME-LIMIT Effective date: 20170517 |
|
| PG25 | Lapsed in a contracting state [announced via postgrant information from national office to epo] |
Ref country code: PT Free format text: LAPSE BECAUSE OF FAILURE TO SUBMIT A TRANSLATION OF THE DESCRIPTION OR TO PAY THE FEE WITHIN THE PRESCRIBED TIME-LIMIT Effective date: 20170517 Ref country code: HU Free format text: LAPSE BECAUSE OF FAILURE TO SUBMIT A TRANSLATION OF THE DESCRIPTION OR TO PAY THE FEE WITHIN THE PRESCRIBED TIME-LIMIT; INVALID AB INITIO Effective date: 20100414 |
|
| PG25 | Lapsed in a contracting state [announced via postgrant information from national office to epo] |
Ref country code: CY Free format text: LAPSE BECAUSE OF FAILURE TO SUBMIT A TRANSLATION OF THE DESCRIPTION OR TO PAY THE FEE WITHIN THE PRESCRIBED TIME-LIMIT Effective date: 20170517 Ref country code: MK Free format text: LAPSE BECAUSE OF NON-PAYMENT OF DUE FEES Effective date: 20170517 |
|
| PGFP | Annual fee paid to national office [announced via postgrant information from national office to epo] |
Ref country code: DE Payment date: 20250319 Year of fee payment: 16 |
|
| PGFP | Annual fee paid to national office [announced via postgrant information from national office to epo] |
Ref country code: CH Payment date: 20250501 Year of fee payment: 16 |
|
| PGFP | Annual fee paid to national office [announced via postgrant information from national office to epo] |
Ref country code: GB Payment date: 20260319 Year of fee payment: 17 |
|
| PGFP | Annual fee paid to national office [announced via postgrant information from national office to epo] |
Ref country code: FR Payment date: 20260319 Year of fee payment: 17 |