EP2235683B1 - Determining image content by image processing - Google Patents
Determining image content by image processing Download PDFInfo
- Publication number
- EP2235683B1 EP2235683B1 EP08870472A EP08870472A EP2235683B1 EP 2235683 B1 EP2235683 B1 EP 2235683B1 EP 08870472 A EP08870472 A EP 08870472A EP 08870472 A EP08870472 A EP 08870472A EP 2235683 B1 EP2235683 B1 EP 2235683B1
- Authority
- EP
- European Patent Office
- Prior art keywords
- image
- eccentricity
- correlation
- content
- block
- Prior art date
- Legal status (The legal status is an assumption and is not a legal conclusion. Google has not performed a legal analysis and makes no representation as to the accuracy of the status listed.)
- Active
Links
Images




Classifications
-
- G—PHYSICS
- G06—COMPUTING OR CALCULATING; COUNTING
- G06T—IMAGE DATA PROCESSING OR GENERATION, IN GENERAL
- G06T7/00—Image analysis
- G06T7/40—Analysis of texture
- G06T7/41—Analysis of texture based on statistical description of texture
Definitions
- the present invention is directed to data processing. More particularly, the present invention is directed to a method and apparatus for processing image data.
- the structure of an image may be characterized by many attributes, such as fractal, aliased, noisy, flat or featureless, periodic, and the like. Each of these characteristics poses a challenge to analyzing the structure.
- Periodic patterns for example, can assume almost any shape, at almost any scale, may range widely in frequency of occurrence, and may occur at any location in the image. Accordingly, detecting the presence of periodic patterns with these degrees of freedom may be difficult. In particular, it may be a more difficult problem than detecting a harmonic such as a pure tone at 20 kHz. Therefore, a simple Fourier transform will not easily reveal many of the essential properties of a periodic pattern. Additionally, content structure and content spectra should not be confused, despite the fact that the mappings may be one-to-one.
- phase plane correlation surface Since periodic patterns range from totally featureless, (i.e.; flat content having zero period), all the way up to the Nyquist frequency and beyond where they can degenerate into essentially chaotic content, examining the fully normalized phase plane correlation surface for periodicity is often not useful. Additionally, a combination or super-positioning of two or more types of periodic patterns can appear simultaneously when they are spatially co-located. Accordingly, normalized phase plane correlation can mask characteristics in the content structure.
- a method and apparatus of processing image data comprises correlating received image data.
- Image statistics are computed based upon the correlated image and eccentricity is estimated based upon the computed image statistics.
- An entropy metric of the correlated received image data is determined.
- An interpretation based upon the computed image statistics, estimated eccentricity, and entropy metric is performed and a report including the content of the processed image data is generated.
- Figure 1 is a functional block diagram of an apparatus for processing data including a processor and a display;
- Figure 2 is a functional block diagram of the processor of Figure 1 ;
- Figure 3 is a flow diagram of a method for processing image data
- Figure 4 is an example image for processing
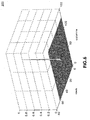
- Figure 5 is a graph of an adjusted autocorrelation surface of a portion of the example image of Figure 4 ;
- Figure 6 is a graph of a normalized autocorrelation surface of a portion of the example image of Figure 4 ;
- Figure 7 is a graphical representation of peaks, ridges, valleys, and sinks of a portion of the image of Figure 4 ;
- Figure 8 is a graphical representation of a radon transform of a portion of the image of Figure 4 ;
- Figure 9 is a graph of a surface map of the radon transform of Figure 8 ;
- Figure 10 is a graphical representation of a watershed transform of a portion of the image of Figure 4 ;
- Figure 11 is a graph of a surface map of the watershed transform of Figure 10 ;
- Figure 12 is a graph of a level set of the autocorrelation surface of the portion of the image of Figure 4 ;
- Figure 13 is a graph of an entropy surface of the portion of the image of Figure 4 .
- the present invention is defined by the appended claims and relates to a method and apparatus to infer the structure of an image content.
- the method computes an autocorrelation function and interprets the computed autocorrelation.
- Some of the metrics to interpret the computed autocorrelation include estimating the content of an image, computing measures of confidence, estimating content periodicity, estimating content flatness, estimating content frequency, estimating content noisiness, and estimating content entropy. These metrics may then be combined utilizing a pre-defined set of rules to provide an estimate of the overall image surface content characteristics.
- Figure 1 is a functional block diagram of an apparatus 100 for processing data including a processor 110 and a display 120. As shown in Figure 1 , the processor 110 is configured to receive data in and produce a processed data out. This processed data out may be forwarded to the display 120 where it may be viewed and utilized.
- FIG 2 is a functional block diagram of the processor 110 of Figure 1 .
- the processor 110 includes a correlation block 111, a property computation block 112, an eccentricity estimator 113, a contour analysis block 114, an entropy metric determination block 115, an interpretation block 116, and a generation block 117.
- Data is received by the correlation block 111.
- the data in to the correlation block 111 may be image data.
- the correlation block 111 performs a correlation on the data in after receiving it.
- the property computation block 112 computes properties related to the correlated data and the eccentricity estimator block 113 performs an estimation of eccentricity on the data.
- a contour analysis is performed by the contour analysis block 114 and the entropy metric determination block 115 performs a determination of entropy.
- Rules are applied at the interpretation block 116 to interpret the metrics measured or computed and a report is generated at the generation block 117.
- the generation block 117 is also capable of outputting the report as data out, which may be forwarded to, for example, the display 120 of Figure 1 .
- Figure 3 is a method 300 for processing image data in accordance with the present invention.
- Figure 3 is described in connection with Figures 4-12 to more clearly illustrate an example implementation of method 300.
- step 310 a received image is correlated.
- Figure 4 is an example image 400 for processing in accordance with the method 300 of Figure 3 .
- Figure 4 shows an image 400 of the flag of the United States of America.
- the image 400 and particularly the flag itself, includes portions that are highly periodic.
- the portion 410 identified by the rectangle in the image 400 may be considered for purposes of example of the method 300.
- the portion 410 identified includes a 64 by 128 block containing the stars from the flag.
- Figure 5 is a graph 500 of an adjusted autocorrelation surface of the portion 410 of the example image 400 of Figure 4 .
- the adjusted autocorrelation surface is non-normalized and includes a phase plane correlation (PPC) alpha equal to zero (0).
- Figure 6 is a graph 600 of a normalized autocorrelation surface of the portion 510 of the image 400 of Figure 4 .
- the normalized autocorrelation surface has a PPC alpha equal to one (1). It should be noted that either an autocorrelation or cross-correlation surface may be utilized when checking for periodic patterns in an image sequence.
- the correlation surface resides in the range of 0 to 1. Additionally, the autocorrelation surface is symmetric and contains an odd number of peaks.
- image properties are computed and inferred from the autocorrelation or cross-correlation surfaces.
- Table 1 shows example properties that may be inferred and their relationship to the properties that are computed.
- Table 1 Estimates Properties Item No. Estimated Property Related to 1 Degree of periodicity number of peaks, peak support 2 Direction of preponderate similarity of content peak eccentricity, ridge lines radiating from peak 3 Size of the structures in the analysis window equal to approximately 1/2 width of peak support 4 Distance between periodic structures distance between peaks, average distance between peaks.
- Some example techniques that may be used to analyze the surfaces depicted in Figures 5 and 6 include ridge filtering, peak extraction, valley extraction, and sink extraction. Additionally, a radon transform may be performed to determine whether there is a linear trend in the data under analysis.
- Figure 7 is a graphical representation 700 of peaks, ridges, valleys, and sinks of the portion 410 of the image 400 of Figure 4 .
- Eccentricity may be estimated for each peak, its support, and the direction of preponderate similarity.
- a radon transform may be utilized.
- Figure 8 is a graphical representation 800 of a radon transform of the portion 410 of the image 400.
- the radon surface can be parsed for peaks in the same way as either of the correlation surfaces 500 and 600. Additionally, the radon transform of either correlation surface may be used to estimate directions of preponderate similarity.
- Figure 9 is a graph 900 of a surface map of the radon transform 800 of Figure 8 .
- eccentricity is estimated.
- Peak eccentricity suggests the direction and relative strength of the similarity of the content in the image 400. For example, if a peak is highly eccentric, (i.e., has a non-circular footprint and may resemble an elongated ellipse), the image content is likely more similar in the direction of a major axis and less similar in the direction of a minor axis.
- Some of the ways to estimate peak eccentricity include fitting an ellipse about a peak or paraboloid, and obtaining a non-parametric estimate based on maximum and minimum chord lengths. Since the methods of fitting an ellipse about a peak or paraboloid may involve potential numerical instabilities, these methods may not be optimal methods in which to estimate peak eccentricity.
- the non-parametric approach to estimating eccentricity includes computing, or analyzing, contours (step 340), using a watershed algorithm or by a ridge and valley method. The rays that emanate from peaks outward to an edge are computed. The rays are swept through 180 degrees while retaining maximum and minimum ray values. The ratio of these quantities may be used to estimate eccentricity.
- the watershed transform or algorithm, is utilized to identify the mass about the peaks in the autocorrelation surface.
- the mass which may include the mean support or peak footprint at various watermarks, provides information about the image content.
- Figure 10 is a graphical representation 1000 of a watershed transform of the portion 410 of the image 400 of Figure 4 .
- the graphical representation 1000 shows a decomposition of the watershed transform.
- Figure 11 is a graph 1100 of a surface map of the watershed transform 1000 of Figure 10 .
- the graph 1100 shows a level set surface map.
- Table 2 shows an example "state-machine" that may be utilized to parse the boundary of an object that is determined from a watershed algorithm.
- Table 2 Perimeter parsing state machine State Pattern Action Comment 0 0 0 move right Outside object - search for object boundary 0 0 1 0 1 move right 0 0 2 1 0 move up 0 0 3 1 1 move right 0 0 4 0 0 move left 1 0 5 0 1 move left Ambiguous state 1 0 6 1 0 move up 1 0 7 1 1 move right 1 0 8 0 0 move down 0 1 9 0 1 move down 0 1 10 1 0 move down Ambiguous state 0 1 11 1 1 move down 0 1 12 0 0 move left 1 1 13 0 1 move left 1 1 14 1 0 move up 1 1 15 1 move right Inside object - move to perimeter 1 1
- Figure 12 is a graph 1200 of a level set of the autocorrelation surface of the portion 410 of the image 400 of Figure 4 .
- four objects (designated 1201, 1202, 1203, and 1204), are shown.
- Each object corresponds to a specific level set of the autocorrelation surface and parsed perimeter, respectively.
- the content is shifted by (10,10) pixels. Accordingly, the principal peak does not occur at the center of the autocorrellation surface.
- the areas computed for objects 1201, 1202, 1203, and 1204 are 256, 277, 207, and 281 square pixels, respectively.
- the area may be computed by extracting the area surrounding an object and computing the number of non-zero pixels.
- this method may require foreknowledge of the shape of objects.
- the size of the structures In addition to estimating the periodicity of the content in the image, it may be beneficial to estimate the size of the structures. One way to accomplish this estimation is by parsing the perimeter of an object level set projection. Another way is to estimate the eccentricity of the object.
- One way to estimate an object's size is to determine the peak support of the object. For example, an ellipse may be fitted around the major and minor axes of rays determined from an object in order to determine the size and orientation of the structures that led to the rays. The area of the ellipse may be used as an estimate for the object's size. However, if the major or minor axes are limited by the size of the analysis window, it may be assumed that the structures in the image extend beyond the analysis window. This could be indicated by asserting a "spillover" flag.
- the entropy metric is determined.
- the entropy matrix is an indication of the lack of uniformity of direction of the gradients in a local part of the image. If the c(i, j) is close to 1, then there are a great deal of changes in direction in the analysis window which could be indicative of very small, but defined, structures. Alternatively, if it is close to zero, there is a great deal of uniformity in direction and so there is well defined homogeneous directional structures in the analysis window.
- An example entropy metric is shown in Figure 13 , which is a graph 1300 of an entropy surface of the portion 410 the image 400 of Figure 4 .
- the entropy measure it becomes possible to make some determinations regarding the nature of the content within the analysis window. For example, if the correlation surface contains a large number of peaks, and the entropy measure is small, then the content is directionally structured with high periodicity. An example of this would be a zone plate below the Nyquist frequency.
- the correlation surface contains a large number of peaks, and the entropy measure is large, then the content is directionally unstructured with high periodicity. An example of this would be a highly textured surface such as a checkerboard pattern. Also, if the correlation surface contains one peak with small support, and the Entropy measure is large, then the content is probably best approximated by uncorrelated noise. An example of this would be a speckled background.
- n 1 - p 2 - p ⁇ p 1 - p ⁇ , where p 1 , p 2 and p are the largest, second largest and average peak heights derived from the autocorrelation surface.
- This measure is in the interval [0, 1] and is applicable when there is more than one peak, both are greater than the average, and when the peak support of the largest peak is small. So the 'noisier' the content, the closer the noise metric is to 1.
- interpretive rules see step 360 of Figure 3 .
- Whether a surface is noisy or not is a question of degree. It may be very noisy, slightly noisy, completely noise-free, or somewhere in between. To deal with this reality, rules are required that build some flexibility into the final outcome.
- the framework developed by "Fuzzy logic" that combines a membership function and logical operators may be utilized to construct these interpretive rules, that will combine the various inputs and come up with an overall estimate of surface structure.
- a report (e.g., data is output or data is stored in memory), is generated from the analysis performed in the previous steps.
- the report may be split into two parts. The first is a factual reporting of the computed statistics, and the second is the interpretive portion that uses rules to qualify the content.
- the statistics generated in this report may aid in determining the nature of the content of the image.
- This report may then be utilized to determine the structure and content of the image for display or further processing.
- the report may contain information relating to the structure such as the periodicity, eccentricity, fractal attributes, aliased attributes, noisiness, and the like.
- attributes such as the flatness or featurelessness of the image may be included.
- the present invention may be implemented in a computer program or firmware tangibly embodied in a computer-readable storage medium having machine readable instructions for execution by a machine, a processor, and/or any general purpose computer for use with or by any non-volatile memory device.
- Suitable processors include, by way of example, both general and special purpose processors.
- a processor will receive instructions and data from a read only memory (ROM), a RAM, and/or a storage device having stored software or firmware.
- Storage devices suitable for embodying computer program instructions and data include all forms of non-volatile memory, including by way of example semiconductor memory devices, read only memories (ROMs), magnetic media such as internal hard disks and removable disks, magneto-optical media, and optical media such as CD-ROM disks and digital versatile disks (DVDs).
- Types of hardware components, processors, or machines which may be used by or in conjunction with the present invention include Application Specific Integrated Circuits (ASICs), Field Programmable Gate Arrays (FPGAs), microprocessors, or any integrated circuit.
- ASICs Application Specific Integrated Circuits
- FPGAs Field Programmable Gate Arrays
- microprocessors or any integrated circuit.
Landscapes
- Physics & Mathematics (AREA)
- Engineering & Computer Science (AREA)
- Probability & Statistics with Applications (AREA)
- Computer Vision & Pattern Recognition (AREA)
- General Physics & Mathematics (AREA)
- Theoretical Computer Science (AREA)
- Image Analysis (AREA)
- Image Processing (AREA)
Description
- The present invention is directed to data processing. More particularly, the present invention is directed to a method and apparatus for processing image data.
- BACKGROUND
- In image processing, discerning the structure of an image is often a challenging undertaking. The structure of an image may be characterized by many attributes, such as fractal, aliased, noisy, flat or featureless, periodic, and the like. Each of these characteristics poses a challenge to analyzing the structure.
- Periodic patterns, for example, can assume almost any shape, at almost any scale, may range widely in frequency of occurrence, and may occur at any location in the image. Accordingly, detecting the presence of periodic patterns with these degrees of freedom may be difficult. In particular, it may be a more difficult problem than detecting a harmonic such as a pure tone at 20 kHz. Therefore, a simple Fourier transform will not easily reveal many of the essential properties of a periodic pattern. Additionally, content structure and content spectra should not be confused, despite the fact that the mappings may be one-to-one.
- Since periodic patterns range from totally featureless, (i.e.; flat content having zero period), all the way up to the Nyquist frequency and beyond where they can degenerate into essentially chaotic content, examining the fully normalized phase plane correlation surface for periodicity is often not useful. Additionally, a combination or super-positioning of two or more types of periodic patterns can appear simultaneously when they are spatially co-located. Accordingly, normalized phase plane correlation can mask characteristics in the content structure.
- Many attempts have been made to determine the content of image structure. However, the vast majority of these attempts focus on using the spectrum of the Fourier transform for this purpose, which is not very effective. One alternative based on autocorrelation is disclosed in Pattern Recognition Letters 18 (1997) 433-443. Accordingly, it would be beneficial to provide a method and apparatus for processing image data that aids in effectively determining the content of an image,
- SUMMARY
- A method and apparatus of processing image data is disclosed. The method comprises correlating received image data. Image statistics are computed based upon the correlated image and eccentricity is estimated based upon the computed image statistics. An entropy metric of the correlated received image data is determined. An interpretation based upon the computed image statistics, estimated eccentricity, and entropy metric is performed and a report including the content of the processed image data is generated.
- BRIEF DESCRIPTION OF THE DRAWINGS
-
Figure 1 is a functional block diagram of an apparatus for processing data including a processor and a display; -
Figure 2 is a functional block diagram of the processor ofFigure 1 ; -
Figure 3 is a flow diagram of a method for processing image data; -
Figure 4 is an example image for processing; -
Figure 5 is a graph of an adjusted autocorrelation surface of a portion of the example image ofFigure 4 ; -
Figure 6 is a graph of a normalized autocorrelation surface of a portion of the example image ofFigure 4 ; -
Figure 7 is a graphical representation of peaks, ridges, valleys, and sinks of a portion of the image ofFigure 4 ; -
Figure 8 is a graphical representation of a radon transform of a portion of the image ofFigure 4 ; -
Figure 9 is a graph of a surface map of the radon transform ofFigure 8 ; -
Figure 10 is a graphical representation of a watershed transform of a portion of the image ofFigure 4 ; -
Figure 11 is a graph of a surface map of the watershed transform ofFigure 10 ; -
Figure 12 is a graph of a level set of the autocorrelation surface of the portion of the image ofFigure 4 ; and -
Figure 13 is a graph of an entropy surface of the portion of the image ofFigure 4 . - DETAILED DESCRIPTION
- The present invention is defined by the appended claims and relates to a method and apparatus to infer the structure of an image content. The method, in one example, computes an autocorrelation function and interprets the computed autocorrelation. Some of the metrics to interpret the computed autocorrelation include estimating the content of an image, computing measures of confidence, estimating content periodicity, estimating content flatness, estimating content frequency, estimating content noisiness, and estimating content entropy. These metrics may then be combined utilizing a pre-defined set of rules to provide an estimate of the overall image surface content characteristics.
-
Figure 1 is a functional block diagram of anapparatus 100 for processing data including aprocessor 110 and adisplay 120. As shown inFigure 1 , theprocessor 110 is configured to receive data in and produce a processed data out. This processed data out may be forwarded to thedisplay 120 where it may be viewed and utilized. -
Figure 2 is a functional block diagram of theprocessor 110 ofFigure 1 . Theprocessor 110 includes acorrelation block 111, aproperty computation block 112, aneccentricity estimator 113, acontour analysis block 114, an entropymetric determination block 115, aninterpretation block 116, and a generation block 117. Data is received by thecorrelation block 111. For example, the data in to thecorrelation block 111 may be image data. - Although the steps performed by each functional block of the
processor 110 will be described in more detail below, briefly, thecorrelation block 111 performs a correlation on the data in after receiving it. Theproperty computation block 112 computes properties related to the correlated data and theeccentricity estimator block 113 performs an estimation of eccentricity on the data. A contour analysis is performed by thecontour analysis block 114 and the entropymetric determination block 115 performs a determination of entropy. Rules are applied at theinterpretation block 116 to interpret the metrics measured or computed and a report is generated at the generation block 117. The generation block 117 is also capable of outputting the report as data out, which may be forwarded to, for example, thedisplay 120 ofFigure 1 . -
Figure 3 is amethod 300 for processing image data in accordance with the present invention.Figure 3 is described in connection withFigures 4-12 to more clearly illustrate an example implementation ofmethod 300. Instep 310, a received image is correlated. For purposes of example,Figure 4 is anexample image 400 for processing in accordance with themethod 300 ofFigure 3 . -
Figure 4 shows animage 400 of the flag of the United States of America. Theimage 400, and particularly the flag itself, includes portions that are highly periodic. Theportion 410 identified by the rectangle in theimage 400 may be considered for purposes of example of themethod 300. Theportion 410 identified includes a 64 by 128 block containing the stars from the flag. -
Figure 5 is agraph 500 of an adjusted autocorrelation surface of theportion 410 of theexample image 400 ofFigure 4 . As shown inFigure 5 , the adjusted autocorrelation surface is non-normalized and includes a phase plane correlation (PPC) alpha equal to zero (0).Figure 6 is agraph 600 of a normalized autocorrelation surface of the portion 510 of theimage 400 ofFigure 4 . As shown in thegraph 600, the normalized autocorrelation surface has a PPC alpha equal to one (1). It should be noted that either an autocorrelation or cross-correlation surface may be utilized when checking for periodic patterns in an image sequence. - Normalization is performed with respect to an area in an analysis window and a maximum grey scale. Accordingly, the correlation surface resides in the range of 0 to 1. Additionally, the autocorrelation surface is symmetric and contains an odd number of peaks.
- Referring again to
Figure 3 , instep 320, image properties are computed and inferred from the autocorrelation or cross-correlation surfaces. Table 1 below shows example properties that may be inferred and their relationship to the properties that are computed.Table 1: Estimates Properties Item No. Estimated Property Related to 1 Degree of periodicity number of peaks, peak support 2 Direction of preponderate similarity of content peak eccentricity, ridge lines radiating from peak 3 Size of the structures in the analysis window equal to approximately 1/2 width of peak support 4 Distance between periodic structures distance between peaks, average distance between peaks. 5 Eccentricity of structures of interest ratio of maximum and minimum rays radiating from peak until a valley is reached 6 Geometric relationship between periodic structures the geometric relationship between peaks, subject to similarity in peak support, and relative peak strength 7 Texture (is the surface is noisy or not, or essentially featureless, or flat) One peak - very narrow - content is essentially flat and/or is uncorrelated noise. If difference between peak and minimum value in the correlation surface (CS) is small, the content is essentially featureless. If max(CS) -min(CS) small but max(CS) and min(CS) closer to 1, then content has high luminance. If max(CS) -min(CS) small but max(CS) and min(CS) close to 0, then content has low luminance. If the traced ray between two peaks crosses a valley then the content is relatively distinct. Further, if the valley is deep, similar content is separated by dissimilar content. 8 Relative luminance orientation of periodic structure if CS surface is high (>0.5), periodic elements are darker than background. if CS surface is low (<0.5), periodic elements are brighter than background. - Some example techniques that may be used to analyze the surfaces depicted in
Figures 5 and6 include ridge filtering, peak extraction, valley extraction, and sink extraction. Additionally, a radon transform may be performed to determine whether there is a linear trend in the data under analysis. -
Figure 7 is agraphical representation 700 of peaks, ridges, valleys, and sinks of theportion 410 of theimage 400 ofFigure 4 . Eccentricity may be estimated for each peak, its support, and the direction of preponderate similarity. - In order to identify energy along one or more of the angular projections, a radon transform may be utilized.
Figure 8 is agraphical representation 800 of a radon transform of theportion 410 of theimage 400. The radon surface can be parsed for peaks in the same way as either of the correlation surfaces 500 and 600. Additionally, the radon transform of either correlation surface may be used to estimate directions of preponderate similarity.Figure 9 is agraph 900 of a surface map of the radon transform 800 ofFigure 8 . - Referring again to
Figure 3 , instep 330, eccentricity is estimated. Peak eccentricity suggests the direction and relative strength of the similarity of the content in theimage 400. For example, if a peak is highly eccentric, (i.e., has a non-circular footprint and may resemble an elongated ellipse), the image content is likely more similar in the direction of a major axis and less similar in the direction of a minor axis. - Some of the ways to estimate peak eccentricity include fitting an ellipse about a peak or paraboloid, and obtaining a non-parametric estimate based on maximum and minimum chord lengths. Since the methods of fitting an ellipse about a peak or paraboloid may involve potential numerical instabilities, these methods may not be optimal methods in which to estimate peak eccentricity.
- On the other hand, using the non-parametric approach infers parameters empirically from direct measurements of raw data, without assuming a mathematical model having estimated parameters. In one example, the non-parametric approach to estimating eccentricity includes computing, or analyzing, contours (step 340), using a watershed algorithm or by a ridge and valley method. The rays that emanate from peaks outward to an edge are computed. The rays are swept through 180 degrees while retaining maximum and minimum ray values. The ratio of these quantities may be used to estimate eccentricity.
- The watershed transform, or algorithm, is utilized to identify the mass about the peaks in the autocorrelation surface. The mass, which may include the mean support or peak footprint at various watermarks, provides information about the image content.
-
Figure 10 is agraphical representation 1000 of a watershed transform of theportion 410 of theimage 400 ofFigure 4 . Thegraphical representation 1000 shows a decomposition of the watershed transform.Figure 11 is agraph 1100 of a surface map of thewatershed transform 1000 ofFigure 10 . In particular, thegraph 1100 shows a level set surface map. In order to collect the points that form the contour inFigures 10 and11 , a contour parsing is performed. Table 2 below shows an example "state-machine" that may be utilized to parse the boundary of an object that is determined from a watershed algorithm.Table 2: Perimeter parsing state machine State Pattern Action Comment 0 0 0 move right Outside object - search for object boundary 0 0 1 0 1 move right 0 0 2 1 0 move up 0 0 3 1 1 move right 0 0 4 0 0 move left 1 0 5 0 1 move left Ambiguous state 1 0 6 1 0 move up 1 0 7 1 1 move right 1 0 8 0 0 move down 0 1 9 0 1 move down 0 1 10 1 0 move down Ambiguous state 0 1 11 1 1 move down 0 1 12 0 0 move left 1 1 13 0 1 move left 1 1 14 1 0 move up 1 1 15 1 1 move right Inside object - move to perimeter 1 1 - Referring now to Table 2 above, since it is possible for each of the two-by-two tables depicted in the "Pattern" column of the table to be the result of a logical expression, different types of contours may be efficiently followed. Also, it should be noted that although a two dimensional object is used as an example, this concept may be extended to an arbitrary number of dimensions.
-
Figure 12 is agraph 1200 of a level set of the autocorrelation surface of theportion 410 of theimage 400 ofFigure 4 . As shown inFigure 12 , four objects, (designated 1201, 1202, 1203, and 1204), are shown. Each object corresponds to a specific level set of the autocorrelation surface and parsed perimeter, respectively. In the present example, the content is shifted by (10,10) pixels. Accordingly, the principal peak does not occur at the center of the autocorrellation surface. - One way to estimate area of an object that is enclosed by curves that do not cross over themselves is Green's Theorem, which by way of example is shown in the equation below:

- Accordingly, using equation (1), the areas computed for
objects - Alternatively to using equation (1) above, the area may be computed by extracting the area surrounding an object and computing the number of non-zero pixels. However, this method may require foreknowledge of the shape of objects.
- In addition to estimating the periodicity of the content in the image, it may be beneficial to estimate the size of the structures. One way to accomplish this estimation is by parsing the perimeter of an object level set projection. Another way is to estimate the eccentricity of the object.
- One way to estimate an object's size is to determine the peak support of the object. For example, an ellipse may be fitted around the major and minor axes of rays determined from an object in order to determine the size and orientation of the structures that led to the rays. The area of the ellipse may be used as an estimate for the object's size. However, if the major or minor axes are limited by the size of the analysis window, it may be assumed that the structures in the image extend beyond the analysis window. This could be indicated by asserting a "spillover" flag.
- In
step 350, the entropy metric is determined. The entropy metric is a local measure that is utilized to estimate the orientation and scale of structures in the image by first applying an anisotropic decomposition of the image and then computing a measure defined by the following equation:
where v(x, y) is the anisotropic orientation vector adjusted to lie in the range [0,π] and Ω is the region over which the entropy is computed. In the discrete domain, the entropy measure becomes:
where w and h are the block height and block width. This measure lies in the interval [0, 1]. It is also possible to define a variant of this measure that takes into account the magnitude of the anisotropic vectors. This is done so that relatively flat regions are given less importance. In flat regions, there is often no structure present, so the anisotropic vectors can become confused due to having many haphazard orientations depending on noise. It may not be desirable to consider these as important. To facilitate this variant, the entropy measure may therefore be modified in accordance with the following equation:
- In one respect, the entropy matrix is an indication of the lack of uniformity of direction of the gradients in a local part of the image. If the c(i, j) is close to 1, then there are a great deal of changes in direction in the analysis window which could be indicative of very small, but defined, structures. Alternatively, if it is close to zero, there is a great deal of uniformity in direction and so there is well defined homogeneous directional structures in the analysis window. An example entropy metric is shown in
Figure 13 , which is agraph 1300 of an entropy surface of theportion 410 theimage 400 ofFigure 4 . - With the entropy measure, it becomes possible to make some determinations regarding the nature of the content within the analysis window. For example, if the correlation surface contains a large number of peaks, and the entropy measure is small, then the content is directionally structured with high periodicity. An example of this would be a zone plate below the Nyquist frequency.
- If the correlation surface contains a large number of peaks, and the entropy measure is large, then the content is directionally unstructured with high periodicity. An example of this would be a highly textured surface such as a checkerboard pattern. Also, if the correlation surface contains one peak with small support, and the Entropy measure is large, then the content is probably best approximated by uncorrelated noise. An example of this would be a speckled background.
- Another measure of image content that can be derived from the autocorrelation function is the noisiness, which may be determined in accordance with the following equation:

where p 1, p 2 and p are the largest, second largest and average peak heights derived from the autocorrelation surface. This measure is in the interval [0, 1] and is applicable when there is more than one peak, both are greater than the average, and when the peak support of the largest peak is small. So the 'noisier' the content, the closer the noise metric is to 1. In recognition that the noisiness measure is only applicable when the peak support is small, the noisiness measure can be modified to take this into account in accordance with the following equation:
where ps is the peak support. - Another measurement that is useful to know is how similar images are to one another. A similarity measure is a number between 0 and 1 that is intended to capture image similarity. It is based on the PPC (alpha =1) cross correlation, and may be defined in accordance with the following equation:

- In addition, whenever it is necessary to make a decision based on analogue, (i.e., continuous), inputs and represent the decision with a few discrete categories, there is often a need to apply interpretive rules (see
step 360 ofFigure 3 ). Whether a surface is noisy or not is a question of degree. It may be very noisy, slightly noisy, completely noise-free, or somewhere in between. To deal with this reality, rules are required that build some flexibility into the final outcome. The framework developed by "Fuzzy logic" that combines a membership function and logical operators may be utilized to construct these interpretive rules, that will combine the various inputs and come up with an overall estimate of surface structure. - In
step 370, a report, (e.g., data is output or data is stored in memory), is generated from the analysis performed in the previous steps. In one example, the report may be split into two parts. The first is a factual reporting of the computed statistics, and the second is the interpretive portion that uses rules to qualify the content. The statistics generated in this report may aid in determining the nature of the content of the image. This report may then be utilized to determine the structure and content of the image for display or further processing. For example, the report may contain information relating to the structure such as the periodicity, eccentricity, fractal attributes, aliased attributes, noisiness, and the like. In addition, attributes such as the flatness or featurelessness of the image may be included. - The present invention may be implemented in a computer program or firmware tangibly embodied in a computer-readable storage medium having machine readable instructions for execution by a machine, a processor, and/or any general purpose computer for use with or by any non-volatile memory device. Suitable processors include, by way of example, both general and special purpose processors.
- Typically, a processor will receive instructions and data from a read only memory (ROM), a RAM, and/or a storage device having stored software or firmware. Storage devices suitable for embodying computer program instructions and data include all forms of non-volatile memory, including by way of example semiconductor memory devices, read only memories (ROMs), magnetic media such as internal hard disks and removable disks, magneto-optical media, and optical media such as CD-ROM disks and digital versatile disks (DVDs). Types of hardware components, processors, or machines which may be used by or in conjunction with the present invention include Application Specific Integrated Circuits (ASICs), Field Programmable Gate Arrays (FPGAs), microprocessors, or any integrated circuit.
Claims (15)
- A method of processing a received image, the method comprising:correlating said received image to obtain a correlated image;computing image statistics based upon the correlated image;estimating eccentricity based upon the computed image statistics;determining an entropy metric of the correlated image;performing role-based interpretation of the structural content of said received image based upon the computed image statistics, estimated eccentricity, and entropy metric; andgenerating a report including the content of the received image, wherein the report is based on said interpretation and includes information relating to said structural content of the image for display or further processing of the image, and wherein said correlated image results from auto-correlation or cross-correlation, said entropy metric indicates a degree of uniformity of local directional structures, and said structural content corresponds to image attributes such as, for example, fractal, aliased, noisy, flat or featureless, or periodic.
- The method of claim 1, further comprising analyzing contour of the image data.
- The method of claim 1 wherein correlating received image data includes generating an auto-correlation surface of the image.
- The method of claim 1 wherein the structural content includes at least one of the following: fractal attributes, aliased attributes, noisiness, featurelessness, and flatness.
- The method of claim 1 wherein the image statistics include any one of the following: degree of periodicity, direction of preponderate similarity of content, size of structures in an analysis window, distance between periodic structures, eccentricity of structures, geometric relationship between periodic structures, texture, and relative luminance orientation of periodic structures.
- The method of claim 3, further comprising applying at least one of the following on the autocorrelation surface: a ridge filter to the autocorrelation surface, a peak extraction, a valley extraction, and a sink extraction.
- The method of claim 1 wherein estimating eccentricity includes obtaining a non-parametric estimate.
- The method of claim 7 wherein the non-parametric estimate is based upon maximum and minimum chord lengths.
- The method of claim 7, further comprising computing contours using at least one of the following: a watershed algorithm, and a ridge and valley extraction.
- The method of claim 1 wherein determining an entropy metric includes applying an anistropic decomposition to the received image.
- The method of claim 1, further comprising determining a noisiness value of the correlated image.
- A processor for processing a received image comprising:a correlation block configured to perform a correlation on said received image to obtain a correlated image;a property computation block in communication with the correlation block, the property computation block configured to compute image statistics based upon the correlated image;an eccentricity estimator in communication with the property computation block, the eccentricity estimator configured to estimate eccentricity based upon the computed image statistics;an entropy metric determination block in communication with the eccentricity estimator, the entropy metric determination block configured to determine an entropy metric of the correlated image;an interpretations block in communication with the entropy metric determination block, the interpretations block configured to perform a rule-based interpretation based upon the image statistics, estimated eccentricity, and entropy metric; anda generation block in communication with the interpretations block, the generation block configured to generate a report including the content of the received image, wherein the report is based on said interpretation and includes information relating to the structural content of the image for display or further processing of the image, and wherein said correlated image results from auto-correlation or cross-correlation, said entropy metric indicates a degree of uniformity of local directional structures, and said structural content corresponds to image attributes such as, for example, fractal, aliased, noisy, flat or featureless, or periodic.
- The processor of claim 12 wherein the structural content includes at least one of the following: fractal attributes, aliased attributes, noisiness, featurelessness, and flatness.
- The processor of claim 12, further comprising a contour analysis block in communication with the eccentricity estimator and the entropy metric determination block, the contour analysis block configured to compute contours.
- A computer-readable storage medium containing a set of instructions adapted to configure a processor to execute said set of instructions comprising:a correlating code segment for correlating a received image to obtain a correlated image;a computing code segment for computing image statistics based upon the correlated image;an estimating code segment for estimating eccentricity based upon the computed image statistics;a determining code segment for determining an entropy metric of the correlated image;an interpreting code segment performing a rule-based interpretation of the structural content of said received image based upon the computed image statistics, estimated eccentricity, and entropy metric;anda generating code segment for generating a report including the content of the received image wherein the report is based on said interpretation and includes information relating to the structural content of the image for display or further processing of the image, and wherein said correlated image results from auto-correlation or cross-correlation, said entropy metric indicales a degree of uniformity of local directional structures, and said structural content corresponds to image attributes such as, for example, fractal, aliased, noisy, flat or featureless, or periodic.
Applications Claiming Priority (2)
| Application Number | Priority Date | Filing Date | Title |
|---|---|---|---|
| US11/961,330 US8233719B2 (en) | 2007-12-20 | 2007-12-20 | Method and apparatus for determining image content |
| PCT/IB2008/003590 WO2009087452A1 (en) | 2007-12-20 | 2008-12-19 | Method and apparatus for processing image data |
Publications (2)
| Publication Number | Publication Date |
|---|---|
| EP2235683A1 EP2235683A1 (en) | 2010-10-06 |
| EP2235683B1 true EP2235683B1 (en) | 2013-03-20 |
Family
ID=40600430
Family Applications (1)
| Application Number | Title | Priority Date | Filing Date |
|---|---|---|---|
| EP08870472A Active EP2235683B1 (en) | 2007-12-20 | 2008-12-19 | Determining image content by image processing |
Country Status (3)
| Country | Link |
|---|---|
| US (1) | US8233719B2 (en) |
| EP (1) | EP2235683B1 (en) |
| WO (1) | WO2009087452A1 (en) |
Families Citing this family (2)
| Publication number | Priority date | Publication date | Assignee | Title |
|---|---|---|---|---|
| CN111325727B (en) * | 2020-02-19 | 2023-06-16 | 重庆邮电大学 | A 3D Segmentation Method of Intracranial Hemorrhage Region Based on Local Entropy and Level Set Algorithm |
| EP3916673B1 (en) * | 2020-05-26 | 2025-07-16 | Airbus (S.A.S.) | Method for determining striation properties of fatigue striations and for determining the presence of fatigue damage |
Citations (1)
| Publication number | Priority date | Publication date | Assignee | Title |
|---|---|---|---|---|
| US20090161988A1 (en) * | 2007-12-21 | 2009-06-25 | Ati Technologies Ulc | System and method of image correlation based on image structure |
Family Cites Families (3)
| Publication number | Priority date | Publication date | Assignee | Title |
|---|---|---|---|---|
| US6782138B1 (en) * | 1999-07-14 | 2004-08-24 | Purdue Research Foundation | Method and system for processing multidimensional data |
| JP3997198B2 (en) * | 2003-12-05 | 2007-10-24 | キヤノン株式会社 | Image processing system and image processing method |
| US20050271300A1 (en) * | 2004-06-02 | 2005-12-08 | Pina Robert K | Image registration system and method |
-
2007
- 2007-12-20 US US11/961,330 patent/US8233719B2/en active Active
-
2008
- 2008-12-19 WO PCT/IB2008/003590 patent/WO2009087452A1/en not_active Ceased
- 2008-12-19 EP EP08870472A patent/EP2235683B1/en active Active
Patent Citations (1)
| Publication number | Priority date | Publication date | Assignee | Title |
|---|---|---|---|---|
| US20090161988A1 (en) * | 2007-12-21 | 2009-06-25 | Ati Technologies Ulc | System and method of image correlation based on image structure |
Non-Patent Citations (3)
| Title |
|---|
| BERGONNIER ET AL: "Local anisotropy analysis for non-smooth images", PATTERN RECOGNITION, ELSEVIER, GB, vol. 40, no. 2, 29 October 2006 (2006-10-29), pages 544 - 556, XP005837130, ISSN: 0031-3203, DOI: 10.1016/J.PATCOG.2005.09.013 * |
| JIANG X: "On Orientation and Anisotropy Estimation for Online Fingerprint Authentication", IEEE TRANSACTIONS ON SIGNAL PROCESSING, IEEE SERVICE CENTER, NEW YORK, NY, US, vol. 53, no. 10, 1 October 2005 (2005-10-01), pages 4038 - 4049, XP011139476, ISSN: 1053-587X, DOI: 10.1109/TSP.2005.855417 * |
| VAN VLIET AND P W VERBEEK L J: "Estimators for Orientation and Anisotropy in Digitized Images", PROCEEDINGS OF THE ANNUAL CONFERENCE OF THE ADVANCED SCHOOL FORCOMPUTING AND IMAGING, XX, XX, 1 May 1995 (1995-05-01), XP002299342 * |
Also Published As
| Publication number | Publication date |
|---|---|
| EP2235683A1 (en) | 2010-10-06 |
| WO2009087452A1 (en) | 2009-07-16 |
| US8233719B2 (en) | 2012-07-31 |
| US20090161987A1 (en) | 2009-06-25 |
Similar Documents
| Publication | Publication Date | Title |
|---|---|---|
| Atherton et al. | Size invariant circle detection | |
| CA2338724C (en) | Method and apparatus for spatial and temporal filtering of intravascular ultrasonic image data | |
| Se et al. | Vision-based detection of staircases | |
| US20140240467A1 (en) | Image processing method and apparatus for elimination of depth artifacts | |
| CN1656824A (en) | A method and system for estimating sharpness metrics based on local edge statistical distribution | |
| CN107977973B (en) | Method and device for acquiring irradiation field boundary of beam limiter in medical diagnosis image | |
| Malpica et al. | Range image quality assessment by structural similarity | |
| US8233719B2 (en) | Method and apparatus for determining image content | |
| Lin et al. | Detection of pinhole defects on chips and wafers using DCT enhancement in computer vision systems | |
| Gao et al. | Phase‐and GVF‐Based Level Set Segmentation of Ultrasonic Breast Tumors | |
| Chakraborty et al. | Gabor-based spectral domain automated notch-reject filter for quasi-periodic noise reduction from digital images | |
| JP5578965B2 (en) | Object estimation apparatus and method, and program | |
| US20070126893A1 (en) | Method for detecting streaks in digital images | |
| Ahmed et al. | RECENT APPROACHES ON NO-REFERENCE IMAGE QUALITY ASSESSMENT FOR CONTRAST DISTORTION IMAGES WITH MULTISCALE GEOMETRIC ANALYSIS TRANSFORMS: A SURVEY. | |
| Zhang et al. | Measurement method for human body anteflexion angle based on image processing | |
| Sujatha et al. | An optimal solution for image edge detection problem using simplified gabor wavelet | |
| JP2002183739A (en) | Ellipse detection method and ellipse detection device | |
| Zhang et al. | BM3D denoising algorithm with adaptive block-match thresholds | |
| Luo et al. | A fast circle detection method based on threshold segmentation and validity check for FPC images | |
| Slabaugh et al. | Information-theoretic feature detection in ultrasound images | |
| Kaur et al. | A review on: Comparison and analysis of edge detection techniques | |
| Xu et al. | General method for edge detection based on the shear transform | |
| Peng et al. | A robust crack filter based on local gray level variation and multiscale analysis for automatic crack detection in X-ray images | |
| Nikaido et al. | A dental radiograph registration algorithm using phase-based image matching for human identification | |
| Chuang et al. | X? Test for Feature Detection |
Legal Events
| Date | Code | Title | Description |
|---|---|---|---|
| PUAI | Public reference made under article 153(3) epc to a published international application that has entered the european phase |
Free format text: ORIGINAL CODE: 0009012 |
|
| 17P | Request for examination filed |
Effective date: 20100719 |
|
| AK | Designated contracting states |
Kind code of ref document: A1 Designated state(s): AT BE BG CH CY CZ DE DK EE ES FI FR GB GR HR HU IE IS IT LI LT LU LV MC MT NL NO PL PT RO SE SI SK TR |
|
| AX | Request for extension of the european patent |
Extension state: AL BA MK RS |
|
| 17Q | First examination report despatched |
Effective date: 20101215 |
|
| DAX | Request for extension of the european patent (deleted) | ||
| GRAP | Despatch of communication of intention to grant a patent |
Free format text: ORIGINAL CODE: EPIDOSNIGR1 |
|
| GRAS | Grant fee paid |
Free format text: ORIGINAL CODE: EPIDOSNIGR3 |
|
| GRAA | (expected) grant |
Free format text: ORIGINAL CODE: 0009210 |
|
| AK | Designated contracting states |
Kind code of ref document: B1 Designated state(s): AT BE BG CH CY CZ DE DK EE ES FI FR GB GR HR HU IE IS IT LI LT LU LV MC MT NL NO PL PT RO SE SI SK TR |
|
| REG | Reference to a national code |
Ref country code: GB Ref legal event code: FG4D |
|
| REG | Reference to a national code |
Ref country code: CH Ref legal event code: EP |
|
| REG | Reference to a national code |
Ref country code: IE Ref legal event code: FG4D |
|
| REG | Reference to a national code |
Ref country code: AT Ref legal event code: REF Ref document number: 602474 Country of ref document: AT Kind code of ref document: T Effective date: 20130415 |
|
| REG | Reference to a national code |
Ref country code: DE Ref legal event code: R096 Ref document number: 602008023142 Country of ref document: DE Effective date: 20130508 |
|
| PG25 | Lapsed in a contracting state [announced via postgrant information from national office to epo] |
Ref country code: NO Free format text: LAPSE BECAUSE OF FAILURE TO SUBMIT A TRANSLATION OF THE DESCRIPTION OR TO PAY THE FEE WITHIN THE PRESCRIBED TIME-LIMIT Effective date: 20130620 Ref country code: LT Free format text: LAPSE BECAUSE OF FAILURE TO SUBMIT A TRANSLATION OF THE DESCRIPTION OR TO PAY THE FEE WITHIN THE PRESCRIBED TIME-LIMIT Effective date: 20130320 Ref country code: ES Free format text: LAPSE BECAUSE OF FAILURE TO SUBMIT A TRANSLATION OF THE DESCRIPTION OR TO PAY THE FEE WITHIN THE PRESCRIBED TIME-LIMIT Effective date: 20130701 Ref country code: BG Free format text: LAPSE BECAUSE OF FAILURE TO SUBMIT A TRANSLATION OF THE DESCRIPTION OR TO PAY THE FEE WITHIN THE PRESCRIBED TIME-LIMIT Effective date: 20130620 Ref country code: SE Free format text: LAPSE BECAUSE OF FAILURE TO SUBMIT A TRANSLATION OF THE DESCRIPTION OR TO PAY THE FEE WITHIN THE PRESCRIBED TIME-LIMIT Effective date: 20130320 |
|
| REG | Reference to a national code |
Ref country code: AT Ref legal event code: MK05 Ref document number: 602474 Country of ref document: AT Kind code of ref document: T Effective date: 20130320 |
|
| REG | Reference to a national code |
Ref country code: LT Ref legal event code: MG4D |
|
| PG25 | Lapsed in a contracting state [announced via postgrant information from national office to epo] |
Ref country code: LV Free format text: LAPSE BECAUSE OF FAILURE TO SUBMIT A TRANSLATION OF THE DESCRIPTION OR TO PAY THE FEE WITHIN THE PRESCRIBED TIME-LIMIT Effective date: 20130320 Ref country code: GR Free format text: LAPSE BECAUSE OF FAILURE TO SUBMIT A TRANSLATION OF THE DESCRIPTION OR TO PAY THE FEE WITHIN THE PRESCRIBED TIME-LIMIT Effective date: 20130621 Ref country code: SI Free format text: LAPSE BECAUSE OF FAILURE TO SUBMIT A TRANSLATION OF THE DESCRIPTION OR TO PAY THE FEE WITHIN THE PRESCRIBED TIME-LIMIT Effective date: 20130320 Ref country code: FI Free format text: LAPSE BECAUSE OF FAILURE TO SUBMIT A TRANSLATION OF THE DESCRIPTION OR TO PAY THE FEE WITHIN THE PRESCRIBED TIME-LIMIT Effective date: 20130320 |
|
| REG | Reference to a national code |
Ref country code: NL Ref legal event code: VDEP Effective date: 20130320 |
|
| PG25 | Lapsed in a contracting state [announced via postgrant information from national office to epo] |
Ref country code: BE Free format text: LAPSE BECAUSE OF FAILURE TO SUBMIT A TRANSLATION OF THE DESCRIPTION OR TO PAY THE FEE WITHIN THE PRESCRIBED TIME-LIMIT Effective date: 20130320 Ref country code: HR Free format text: LAPSE BECAUSE OF FAILURE TO SUBMIT A TRANSLATION OF THE DESCRIPTION OR TO PAY THE FEE WITHIN THE PRESCRIBED TIME-LIMIT Effective date: 20130320 |
|
| PG25 | Lapsed in a contracting state [announced via postgrant information from national office to epo] |
Ref country code: EE Free format text: LAPSE BECAUSE OF FAILURE TO SUBMIT A TRANSLATION OF THE DESCRIPTION OR TO PAY THE FEE WITHIN THE PRESCRIBED TIME-LIMIT Effective date: 20130320 Ref country code: AT Free format text: LAPSE BECAUSE OF FAILURE TO SUBMIT A TRANSLATION OF THE DESCRIPTION OR TO PAY THE FEE WITHIN THE PRESCRIBED TIME-LIMIT Effective date: 20130320 Ref country code: CZ Free format text: LAPSE BECAUSE OF FAILURE TO SUBMIT A TRANSLATION OF THE DESCRIPTION OR TO PAY THE FEE WITHIN THE PRESCRIBED TIME-LIMIT Effective date: 20130320 Ref country code: IS Free format text: LAPSE BECAUSE OF FAILURE TO SUBMIT A TRANSLATION OF THE DESCRIPTION OR TO PAY THE FEE WITHIN THE PRESCRIBED TIME-LIMIT Effective date: 20130720 Ref country code: RO Free format text: LAPSE BECAUSE OF FAILURE TO SUBMIT A TRANSLATION OF THE DESCRIPTION OR TO PAY THE FEE WITHIN THE PRESCRIBED TIME-LIMIT Effective date: 20130320 Ref country code: PT Free format text: LAPSE BECAUSE OF FAILURE TO SUBMIT A TRANSLATION OF THE DESCRIPTION OR TO PAY THE FEE WITHIN THE PRESCRIBED TIME-LIMIT Effective date: 20130722 Ref country code: SK Free format text: LAPSE BECAUSE OF FAILURE TO SUBMIT A TRANSLATION OF THE DESCRIPTION OR TO PAY THE FEE WITHIN THE PRESCRIBED TIME-LIMIT Effective date: 20130320 Ref country code: NL Free format text: LAPSE BECAUSE OF FAILURE TO SUBMIT A TRANSLATION OF THE DESCRIPTION OR TO PAY THE FEE WITHIN THE PRESCRIBED TIME-LIMIT Effective date: 20130320 |
|
| PG25 | Lapsed in a contracting state [announced via postgrant information from national office to epo] |
Ref country code: CY Free format text: LAPSE BECAUSE OF FAILURE TO SUBMIT A TRANSLATION OF THE DESCRIPTION OR TO PAY THE FEE WITHIN THE PRESCRIBED TIME-LIMIT Effective date: 20130320 Ref country code: PL Free format text: LAPSE BECAUSE OF FAILURE TO SUBMIT A TRANSLATION OF THE DESCRIPTION OR TO PAY THE FEE WITHIN THE PRESCRIBED TIME-LIMIT Effective date: 20130320 |
|
| PLBE | No opposition filed within time limit |
Free format text: ORIGINAL CODE: 0009261 |
|
| STAA | Information on the status of an ep patent application or granted ep patent |
Free format text: STATUS: NO OPPOSITION FILED WITHIN TIME LIMIT |
|
| PG25 | Lapsed in a contracting state [announced via postgrant information from national office to epo] |
Ref country code: DK Free format text: LAPSE BECAUSE OF FAILURE TO SUBMIT A TRANSLATION OF THE DESCRIPTION OR TO PAY THE FEE WITHIN THE PRESCRIBED TIME-LIMIT Effective date: 20130320 |
|
| 26N | No opposition filed |
Effective date: 20140102 |
|
| PG25 | Lapsed in a contracting state [announced via postgrant information from national office to epo] |
Ref country code: IT Free format text: LAPSE BECAUSE OF FAILURE TO SUBMIT A TRANSLATION OF THE DESCRIPTION OR TO PAY THE FEE WITHIN THE PRESCRIBED TIME-LIMIT Effective date: 20130320 |
|
| REG | Reference to a national code |
Ref country code: DE Ref legal event code: R097 Ref document number: 602008023142 Country of ref document: DE Effective date: 20140102 |
|
| REG | Reference to a national code |
Ref country code: CH Ref legal event code: PL |
|
| PG25 | Lapsed in a contracting state [announced via postgrant information from national office to epo] |
Ref country code: MC Free format text: LAPSE BECAUSE OF FAILURE TO SUBMIT A TRANSLATION OF THE DESCRIPTION OR TO PAY THE FEE WITHIN THE PRESCRIBED TIME-LIMIT Effective date: 20130320 Ref country code: LU Free format text: LAPSE BECAUSE OF FAILURE TO SUBMIT A TRANSLATION OF THE DESCRIPTION OR TO PAY THE FEE WITHIN THE PRESCRIBED TIME-LIMIT Effective date: 20131219 |
|
| REG | Reference to a national code |
Ref country code: IE Ref legal event code: MM4A |
|
| REG | Reference to a national code |
Ref country code: FR Ref legal event code: ST Effective date: 20140829 |
|
| PG25 | Lapsed in a contracting state [announced via postgrant information from national office to epo] |
Ref country code: LI Free format text: LAPSE BECAUSE OF NON-PAYMENT OF DUE FEES Effective date: 20131231 Ref country code: IE Free format text: LAPSE BECAUSE OF NON-PAYMENT OF DUE FEES Effective date: 20131219 Ref country code: CH Free format text: LAPSE BECAUSE OF NON-PAYMENT OF DUE FEES Effective date: 20131231 |
|
| PG25 | Lapsed in a contracting state [announced via postgrant information from national office to epo] |
Ref country code: FR Free format text: LAPSE BECAUSE OF NON-PAYMENT OF DUE FEES Effective date: 20131231 |
|
| PG25 | Lapsed in a contracting state [announced via postgrant information from national office to epo] |
Ref country code: TR Free format text: LAPSE BECAUSE OF FAILURE TO SUBMIT A TRANSLATION OF THE DESCRIPTION OR TO PAY THE FEE WITHIN THE PRESCRIBED TIME-LIMIT Effective date: 20130320 |
|
| PG25 | Lapsed in a contracting state [announced via postgrant information from national office to epo] |
Ref country code: HU Free format text: LAPSE BECAUSE OF FAILURE TO SUBMIT A TRANSLATION OF THE DESCRIPTION OR TO PAY THE FEE WITHIN THE PRESCRIBED TIME-LIMIT; INVALID AB INITIO Effective date: 20081219 |
|
| PG25 | Lapsed in a contracting state [announced via postgrant information from national office to epo] |
Ref country code: MT Free format text: LAPSE BECAUSE OF FAILURE TO SUBMIT A TRANSLATION OF THE DESCRIPTION OR TO PAY THE FEE WITHIN THE PRESCRIBED TIME-LIMIT Effective date: 20130320 |
|
| P01 | Opt-out of the competence of the unified patent court (upc) registered |
Effective date: 20230530 |
|
| PGFP | Annual fee paid to national office [announced via postgrant information from national office to epo] |
Ref country code: DE Payment date: 20251113 Year of fee payment: 18 |
|
| PGFP | Annual fee paid to national office [announced via postgrant information from national office to epo] |
Ref country code: GB Payment date: 20251203 Year of fee payment: 18 |