EP2180834B1 - Automated monitoring of myocardial function by ultrasonic transducers positioned on the heart - Google Patents
Automated monitoring of myocardial function by ultrasonic transducers positioned on the heart Download PDFInfo
- Publication number
- EP2180834B1 EP2180834B1 EP08803411A EP08803411A EP2180834B1 EP 2180834 B1 EP2180834 B1 EP 2180834B1 EP 08803411 A EP08803411 A EP 08803411A EP 08803411 A EP08803411 A EP 08803411A EP 2180834 B1 EP2180834 B1 EP 2180834B1
- Authority
- EP
- European Patent Office
- Prior art keywords
- graphical representation
- parameter
- systolic
- post
- trace
- Prior art date
- Legal status (The legal status is an assumption and is not a legal conclusion. Google has not performed a legal analysis and makes no representation as to the accuracy of the status listed.)
- Not-in-force
Links
- 238000012544 monitoring process Methods 0.000 title claims description 25
- 210000002216 heart Anatomy 0.000 title description 18
- 230000010016 myocardial function Effects 0.000 title description 10
- 238000000034 method Methods 0.000 claims abstract description 54
- 239000000523 sample Substances 0.000 claims abstract description 27
- 230000006870 function Effects 0.000 claims abstract description 26
- 210000004165 myocardium Anatomy 0.000 claims abstract description 21
- 230000003483 hypokinetic effect Effects 0.000 claims abstract description 20
- 208000031225 myocardial ischemia Diseases 0.000 claims abstract description 20
- 230000004217 heart function Effects 0.000 claims abstract description 19
- 230000000747 cardiac effect Effects 0.000 claims abstract description 13
- 230000002980 postoperative effect Effects 0.000 claims abstract description 13
- 238000002604 ultrasonography Methods 0.000 claims abstract description 11
- 238000003384 imaging method Methods 0.000 claims abstract description 7
- 210000004351 coronary vessel Anatomy 0.000 claims description 15
- 230000008859 change Effects 0.000 claims description 10
- 238000012545 processing Methods 0.000 claims description 8
- 239000003814 drug Substances 0.000 claims description 5
- 230000003213 activating effect Effects 0.000 claims description 3
- 239000012530 fluid Substances 0.000 claims description 3
- 238000013506 data mapping Methods 0.000 claims description 2
- 238000001990 intravenous administration Methods 0.000 claims description 2
- 238000002526 synchrotron radiation photoelectron spectroscopy Methods 0.000 claims description 2
- 238000011477 surgical intervention Methods 0.000 claims 1
- 208000028867 ischemia Diseases 0.000 abstract description 25
- 230000008901 benefit Effects 0.000 abstract description 6
- 230000000875 corresponding effect Effects 0.000 abstract 2
- 230000002596 correlated effect Effects 0.000 abstract 1
- 210000001519 tissue Anatomy 0.000 description 24
- 238000005259 measurement Methods 0.000 description 18
- 230000008719 thickening Effects 0.000 description 9
- 230000008602 contraction Effects 0.000 description 6
- 230000004064 dysfunction Effects 0.000 description 6
- 239000013078 crystal Substances 0.000 description 5
- 238000002592 echocardiography Methods 0.000 description 5
- 238000002474 experimental method Methods 0.000 description 5
- 230000000302 ischemic effect Effects 0.000 description 5
- 230000002107 myocardial effect Effects 0.000 description 5
- 238000004458 analytical method Methods 0.000 description 4
- 230000000694 effects Effects 0.000 description 4
- 230000002861 ventricular Effects 0.000 description 4
- UCTWMZQNUQWSLP-UHFFFAOYSA-N adrenaline Chemical compound CNCC(O)C1=CC=C(O)C(O)=C1 UCTWMZQNUQWSLP-UHFFFAOYSA-N 0.000 description 3
- 210000001765 aortic valve Anatomy 0.000 description 3
- 230000036772 blood pressure Effects 0.000 description 3
- 238000007675 cardiac surgery Methods 0.000 description 3
- 210000001174 endocardium Anatomy 0.000 description 3
- 230000035945 sensitivity Effects 0.000 description 3
- UCTWMZQNUQWSLP-VIFPVBQESA-N (R)-adrenaline Chemical compound CNC[C@H](O)C1=CC=C(O)C(O)=C1 UCTWMZQNUQWSLP-VIFPVBQESA-N 0.000 description 2
- 230000002159 abnormal effect Effects 0.000 description 2
- 230000010247 heart contraction Effects 0.000 description 2
- 230000008569 process Effects 0.000 description 2
- 238000011002 quantification Methods 0.000 description 2
- 238000001356 surgical procedure Methods 0.000 description 2
- 238000011265 2D-echocardiography Methods 0.000 description 1
- 206010058145 Subendocardial ischaemia Diseases 0.000 description 1
- 241000282887 Suidae Species 0.000 description 1
- 229940102884 adrenalin Drugs 0.000 description 1
- 238000010420 art technique Methods 0.000 description 1
- 210000001367 artery Anatomy 0.000 description 1
- 230000001746 atrial effect Effects 0.000 description 1
- 239000002876 beta blocker Substances 0.000 description 1
- 229940097320 beta blocking agent Drugs 0.000 description 1
- 230000017531 blood circulation Effects 0.000 description 1
- 230000004087 circulation Effects 0.000 description 1
- 230000003111 delayed effect Effects 0.000 description 1
- 238000001514 detection method Methods 0.000 description 1
- 229940079593 drug Drugs 0.000 description 1
- 238000011156 evaluation Methods 0.000 description 1
- 238000000605 extraction Methods 0.000 description 1
- 208000011316 hemodynamic instability Diseases 0.000 description 1
- 238000002513 implantation Methods 0.000 description 1
- 238000010348 incorporation Methods 0.000 description 1
- 238000001802 infusion Methods 0.000 description 1
- 230000000297 inotrophic effect Effects 0.000 description 1
- 230000003993 interaction Effects 0.000 description 1
- 238000007620 mathematical function Methods 0.000 description 1
- 230000007246 mechanism Effects 0.000 description 1
- 210000003365 myofibril Anatomy 0.000 description 1
- 210000000056 organ Anatomy 0.000 description 1
- 230000010412 perfusion Effects 0.000 description 1
- 238000013105 post hoc analysis Methods 0.000 description 1
- 238000005086 pumping Methods 0.000 description 1
- 238000000718 qrs complex Methods 0.000 description 1
- 230000009467 reduction Effects 0.000 description 1
- 230000004044 response Effects 0.000 description 1
- 210000005241 right ventricle Anatomy 0.000 description 1
- 238000005070 sampling Methods 0.000 description 1
- 238000004904 shortening Methods 0.000 description 1
- 238000010561 standard procedure Methods 0.000 description 1
- 230000001360 synchronised effect Effects 0.000 description 1
Images




Classifications
-
- A—HUMAN NECESSITIES
- A61—MEDICAL OR VETERINARY SCIENCE; HYGIENE
- A61B—DIAGNOSIS; SURGERY; IDENTIFICATION
- A61B8/00—Diagnosis using ultrasonic, sonic or infrasonic waves
- A61B8/48—Diagnostic techniques
- A61B8/485—Diagnostic techniques involving measuring strain or elastic properties
-
- A—HUMAN NECESSITIES
- A61—MEDICAL OR VETERINARY SCIENCE; HYGIENE
- A61B—DIAGNOSIS; SURGERY; IDENTIFICATION
- A61B8/00—Diagnosis using ultrasonic, sonic or infrasonic waves
- A61B8/08—Clinical applications
- A61B8/0883—Clinical applications for diagnosis of the heart
-
- A—HUMAN NECESSITIES
- A61—MEDICAL OR VETERINARY SCIENCE; HYGIENE
- A61B—DIAGNOSIS; SURGERY; IDENTIFICATION
- A61B8/00—Diagnosis using ultrasonic, sonic or infrasonic waves
- A61B8/12—Diagnosis using ultrasonic, sonic or infrasonic waves in body cavities or body tracts, e.g. by using catheters
-
- A—HUMAN NECESSITIES
- A61—MEDICAL OR VETERINARY SCIENCE; HYGIENE
- A61B—DIAGNOSIS; SURGERY; IDENTIFICATION
- A61B8/00—Diagnosis using ultrasonic, sonic or infrasonic waves
- A61B8/42—Details of probe positioning or probe attachment to the patient
-
- A—HUMAN NECESSITIES
- A61—MEDICAL OR VETERINARY SCIENCE; HYGIENE
- A61B—DIAGNOSIS; SURGERY; IDENTIFICATION
- A61B8/00—Diagnosis using ultrasonic, sonic or infrasonic waves
- A61B8/44—Constructional features of the ultrasonic, sonic or infrasonic diagnostic device
- A61B8/4483—Constructional features of the ultrasonic, sonic or infrasonic diagnostic device characterised by features of the ultrasound transducer
- A61B8/4488—Constructional features of the ultrasonic, sonic or infrasonic diagnostic device characterised by features of the ultrasound transducer the transducer being a phased array
-
- A—HUMAN NECESSITIES
- A61—MEDICAL OR VETERINARY SCIENCE; HYGIENE
- A61B—DIAGNOSIS; SURGERY; IDENTIFICATION
- A61B8/00—Diagnosis using ultrasonic, sonic or infrasonic waves
- A61B8/48—Diagnostic techniques
- A61B8/488—Diagnostic techniques involving Doppler signals
Definitions
- the present invention relates to estimating cardiac pumping capacity, in particular a myocardial function monitoring system applying data recorded by ultrasonic transducers positioned on the heart.
- US 5,188,106 describes, in relation to Figures 8A-C , a transducer implanted in the right ventricle for detecting myofibril motion.
- the object of the invention is to provide a method and a post-operative care unit for analysing and quantifying an ultrasound tissue Doppler imaging (TDI) signal from a transducer fastened on the myocardium.
- the quantification may result in a parameter or a graphical representation that indicates regional cardiac ischaemia or correlates with global hypokinetic heart function, thereby making the method and care unit suited for continuous postoperative monitoring.
- TDI ultrasound tissue Doppler imaging
- the invention provides a method for automatically analysing an ultrasound TDI signal on a computer and generate a parameter or a graphical representation that indicates regional cardiac ischemia or correlates with global hypokinetic heart function from a first TDI signal obtained by a miniaturized Doppler probe positioned in a relevant coronary artery supply area (e.g. the supply area of the left anterior descending (LAD) coronary artery) on an outer surface part of the myocardium, the method comprising:
- a miniaturized Doppler probe is an ultrasonic transducer with connections, cable outlet, housing etc. that are so small that it may be easily fixed to an inner organ with the cable through the skin.
- the invention provides a postoperative care unit for automatically analysing an ultrasound TDI signal, the unit comprising means for receiving a first TDI signal obtained by a miniaturized Doppler probe to be positioned in a relevant coronary artery supply area (e.g. the supply area of the LAD coronary artery) on an outer surface part of the myocardium and a simultaneously recorded electrocardiogram; a display; and an electronic processing unit comprising software means configured to:
- the method and the software means in the care unit also read a velocity and/or a strain and/or a strain rate in the systolic phase of the extracted trace, and generate a parameter or a graphical representation which is a function of both the systolic and post-systolic readings. Including both readings may provide the advantage of improving the correlation leading to a more precise prediction of ischaemia.
- miniaturized ultrasonic probes are sutured to the outer surface of the one to three main perfusion areas of the coronary arteries and connected to a computer by leads perforating the skin.
- Reflected ultrasonic signals from the myocardial wall are recorded as radiofrequency (RF) data and can be presented as so-called M-mode pictures which show how the thickness of the wall varies through the heart cycle.
- RF radiofrequency
- a stable recording of the inside border line of the wall (the endocardium) is difficult to obtain due to several reasons.
- the transducer has to keep an approximate 90° angle between the ultrasonic beam and the surface. The angle can vary during the heart contraction, thus adding difference in measured thickness.
- the interior lining of the heart will fold, and these foldings may superimpose on the wall inside, thus leading to overestimated wall thickness.
- Another reason may be that signal quality is poor, so that the border between wall inside and the ventricle lumen is poorly outlined.
- thickening velocities are calculated from the RF data using the Doppler effect. These Doppler signals are stronger than the ultrasonic signals used for measurement of wall thickness and are therefore more optimal for monitoring myocardial function. Thickening velocities increase gradually when the site of measurement is moved from the wall surface towards the endocardium and velocity measurement must be done in defined depths of the wall. It is also an advantage that myocardial ischaemia reduces peak velocity in all layers through the wall. From a technical point of view the aim is to find a depth of measurement where optimal signals are obtained making this embodiment simple to implement.
- the early systolic phase is a period equal to or within the interval from 50ms before the QRS-complex in the ECG (see e.g. Figure 4 ) signal and until at least 150ms after the peak R, and including the isovolumic contraction phase (IVC).
- the post-systolic phase is a period equal to or within the interval from aortic valve closure until 150 ms after aortic valve closure, and including the isovolumic relaxation phase (IVR).
- the timing of aortic valve closure is marked on ECG as the moment the positive systolic velocity declines to zero.
- the velocity, strain and/or strain rate value may be read in both the early systolic phase and the post-systolic phase of the extracted trace, so that the reading comprises reading:
- the generated parameter or graphical representation may be a function of both the systolic and the post-systolic reading.
- the generated parameter or graphical representation is a function of a difference between the systolic and post-systolic reading, preferably of V SYS - V PS .
- the value of such function may be displayed as a number or graphically, e.g. as a function of time.
- the reading may be a peak value of the trace in the subsection of the extracted trace, or it may be a mean value of the trace in the subsection.
- the reading may comprise analysing the signal and calculating a derived value.
- empiric signal interpretation data mapping the read velocity, strain or strain rate value, or a derived value or function, to the parameter or graphical representation.
- empiric signal interpretation data may e.g. be a lookup table, an empiric curve or a function which can be used to determine a parameter or graphical representation from a read value.
- the empiric signal interpretation data is typically determined from previously performed readings during experimentally induced ischaemia or dysfunction, where a degree of seriousness is simultaneously determined by other methods.
- signals from further probes fastened elsewhere on the heart may be included in the analysis.
- the analysis is carried out on a second TDI signal obtained by a miniaturized Doppler probe on an outer surface part of the myocardium, and the generated parameter or graphical representation is also a function of one of the readings from the trace extracted from the second TDI signal.
- a TDI signals from a third probe positioned on an outer surface part of the myocardium may be included. The regions of interest will depend on which artery supply areas that have received bypass vessels.
- An advantage of the present invention is that the generation of the parameter or graphical representation used for monitoring may be automated to a very large degree, such as requiring no human interaction after initial setup.
- the embodiments described above may preferably be carried out automatically so that the method and care unit generates the parameter or graphical representation automatically when receiving TDI and ECG signal.
- the generation of the parameter or graphical representation may preferably be carried out continuously over a longer period of time.
- the parameter or graphical representation is generated from the first TDI signal continuously over a period of at least 24 hours succeeding cardiac surgery.
- a threshold value for the generated parameter or graphical representation may preferably be provided, and
- incorporation of an alarm in the monitoring may be implemented by further comprising input means allowing an operator to set a threshold value for the generated parameter or graphical representation and means for generating an alarm, wherein electronic processing unit further comprises software means for monitoring the generated parameter or graphical representation and activating the means for generating an alarm if the generated parameter or graphical representation passes the threshold value.
- the method and care unit may not only be used for monitoring a state of a patient in order to detect ischaemia or dysfunction due to graft occlusion.
- the method and care unit is used to monitor the effect or lack of effect from a medical intervention.
- the parameter or graphical representation is generated over a period of time including or following intravenous administration of a fluid or a medicament affecting the global hypokinetic heart function. A change in the global hypokinetic heart function during this period of time may be followed and optionally quantified using the parameter or graphical representation.
- Such a medicament could be infusion of adrenaline to increase the contraction of a hypokinetic heart. This drug may induce ischaemia if given in a too large dose.
- the ultrasonic measurements of cardiac function would precisely show when the function is normalized and/or if ischaemia occurs and a correct lowest medicament dose can be determined.
- the invention provides a method for indicating regional cardiac ischaemia or estimating global hypokinetic heart function. This method comprises
- the invention provides the use of a TDI signal for indicating regional cardiac ischaemia or estimating global hypokinetic heart function in accordance with the above method.
- the basic idea of the invention is to use TDI signals from one or more miniaturized ultrasonic transducers fastened to the myocardium of a patient to automatically generate parameters or graphical representations that indicate or correlate with myocardial ischaemia or dysfunction.
- This has the advantage over standard methods using a manually operated ultrasound probe that it can be used continuously over longer periods of time, and thereby be used in post-operation monitoring of patients.
- the invention provides the advantage of generating parameters or graphical representations that indicate or correlate with myocardial ischaemia or dysfunction.
- the invention relates to the analysis and treatment of data from a miniaturized ultrasonic transducer fastened to the myocardium of a patient.
- the operative procedure of fastening the transducer is a separate and preceding step which is not part of the invention or covered by the present application/patent.
- Miniaturized ultrasonic transducers are known from a number of applications, both medical and non-medical, see e.g. US 2006/0116584 .
- the ultrasonic transducer When the ultrasonic transducer is sutured to the heart during the operation an optimal position on the wall and depth of measurement is secured by using M-mode echo signals as guidance shown in Figure 1 . An optimal position has been obtained when relatively distinct outer and inner surface lines of the wall are seen.
- the miniature ultrasound transducer is a regional monitor of myocardial function, it may be preferable to have two or three miniature ultrasound transducers in order to monitor global function or to confirm the reading from the main transducer. If more than one transducer is to be positioned, it is preferable to have one transducer in each of the one to three by-pass areas of the myocardium.
- FIG. 2 is a schematic illustration of a postoperative care unit 20 according to an embodiment of the invention, comprising an electronic processing unit 22 such as an integrated computer.
- the care unit has means 21 for receiving a first TDI signal from the miniaturized ultrasonic transducer, e.g. the one positioned in the supply area of the left anterior descending (LAD) coronary artery on an outer surface part of the myocardium.
- the means 21 can typically comprise a cable, an input terminal, an analogue to digital converter, and circuitry connecting the means to the electronic processing unit 22 comprising a processor 23 and a memory 24 for storing the received signals.
- the means 21 also receives a simultaneously recorded electrocardiogram, typically from standard ECG equipment.
- the memory 24 of the electronic processing unit 22 holds software means to be executed by the processor 23 for analysing the received signals and generating the parameter or graphical representation as will be described in relation to the method elsewhere.
- the care unit 20 further comprises a display 25 for displaying the generated parameter or graphical representation.
- a parameter values is represented graphically as a function of time as curve 26 in display 25.
- the care unit can also have a display 27 for showing the e.g. direct echo and Doppler signals as well as other standard monitoring parameters used in an intensive care unit (electrocardiogram (ECG), blood pressure, heart rate, central venous pressure, O2-tension etc.). These can be used by an operator to ensure that the obtained TDI signals are appropriate, confirming that the transducer is properly fastened and functioning.
- ECG electrocardiogram
- O2-tension central venous pressure
- the care unit comprises input means 28 allowing an operator to set a threshold value for the generated parameter or graphical representation, typically a keyboard as shown or a connection 40 to a remote computer.
- the threshold value is shown in the display 25 as line 29, so that the operator can continuously see how close the generated value 26 is to the threshold.
- the electronic processing unit comprises software means for monitoring the generated value 26 and activating means for generating an alarm if the generated value 26 passes below the line 29.
- the means for generating an alarm serves to notify an operator or hospital staff on duty. It can be implemented by a loudspeaker and a warning light 41 as shown, or it could be a network connection 40 to a centralized alarm system.
- the operator can define a baseline value, e.g. defined over 10 heart beats.
- the threshold value can then be set as a fraction or multiple of the baseline, e.g. when an abnormal low peak velocity, a high post-systolic velocity, or a negative value of the function (V SYS - V PS ) occurs.
- the user may select which of these options he wants to use during the monitoring.
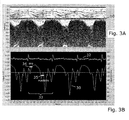
- the computer transforms the RF signals to velocities at a depth inside the wall, showing a velocity trace, curve 30, on the Doppler screen in Figure 3B .
- This trace is displayed below the M-mode picture of the wall ( Figure 3A ).
- the optimal quality of velocity trace is usually obtained close to the inner surface of the wall.
- the measuring depth is shown as a grey line 10 in the M-mode picture in Figure 3A .
- the Doppler screen of Figure 3B also displays a ECG-curve 32.
- the extracted trace can be divided into individual sections 33 according to individual cardiac cycles, i.e. heartbeats. Within each section 33, subsections corresponding to the early systolic phase and the post-systolic phase can be defined, shown as time intervals 34 and 35 on the extracted velocity trace 30.
- a velocity (and/or strain and/or strain rate) value can be read in the defined intervals, such reading can be performed by an appropriate software application in the velocity trace data.
- the values can for example be peak or average values within the interval.
- systolic velocity is automatically measured and a peak or mean value, V SYS , can be calculated.
- V SYS peak or mean value
- the parameter is the peak or mean value of the post-systolic velocity, V PS .
- the parameter is the function V SYS - V PS , i.e. difference between (peak or mean values of) systolic velocity and post-systolic velocity. This value predicts ischaemia with good sensitivity and specificity, and improves the certainty in ischaemia diagnostics as will be shown later.
- the above procedure is performed for each of the transducers and the display can show three numbers continuously plus a baseline value on the screen. If the alarm is activated due to a low value from one or more of the transducers, this may indicate falling myocardial function. The operator can check the velocity trace to control that the quality of the myocardial velocity signals are adequate. If the quality of the velocity is adequate there are two possible conclusions: When V SYS is abnormal in all three regions of the myocardium with unchanged V PS and only moderate fall in V SYS - V PS , there is strong evidence for a global altered myocardial function due to changes in loading or inotropic conditions. If there are changes in only one of the regions, and most for the V SYS - V PS parameter, there are strong evidences for a regional ischemic event.
- Ultrasonic RF-data were recorded simultaneously and synchronized with ECG and pressure data in a customized sampling programme made in LabView (LabView 8.0, National Instruments, TX).
- the miniature transducer was sutured to the surface of the heart in the supply area of the left descending coronary artery (LAD). LAD was occluded by snaring for 60 seconds. Cessation of flow was confirmed by Doppler flow measurement.
- baseline measurement were carried out prior to occlusion or intervention to show the sensitivity of the parameter or graphical representation characterizing the state after occlusion or intervention.
- FIG. 4 show ECG-synchronized tissue velocity curves of the wall thickening velocity at baseline and after 60 seconds of regional ischaemia.
- the time frames of 200 and 150 ms show the periods where systolic velocity and post-systolic velocity were registered.
- Systolic velocity (V SYS ) was registered as peak value after isovolumic contraction phase (IVC - this being the first spike in the 200 ms window).
- Post-systolic velocity (V PS ) was calculated as a mean of the minimum and maximum deflection on the velocity curve after start of isovolumic relaxation phase (IVR - this starting at negative velocity-shift after systole).
- V SYS Systolic wall thickening velocity
- V PS post-systolic thickening velocity
- V sys Peak and postsystolic velocities with V sys -V ps relationship Baseline (cm/s) Ischemia (cm/s) p Systolic velocity (V sys ) 1.0 ⁇ 0.28 0.28 ⁇ 0.12 ⁇ 0.01 Miniature probe Postsystolic velocity (V ps ) 0.13 ⁇ 0.56 1.57 ⁇ 0.59 ⁇ 0.01 V sys -V ps 0.88 ⁇ 0.63 -1.29 ⁇ 0.57 ⁇ 0.01 Systolic velocity (Vsys) 1.93 ⁇ 0.47 0.81 ⁇ 0.42 ⁇ 0.01 Echocardiography Postsystolic velocity (V ps ) -0.35 ⁇ 0.94 2.09 ⁇ 1.07 ⁇ 0.01 V sys -V ps 2.28 ⁇ 1,10 -1.67 ⁇ 0.76 ⁇ 0.01
- Figures 5A and B show the parameter V SYS, peak , the peak velocity in the early systolic phase, for baseline and occluded LAD coronary artery.
- V SYS parameter SYS
- peak the peak velocity in the early systolic phase
- 5B a change in the parameter is seen between baseline and ischaemia for all subjects although the parameter values and the relative change varies from subject to subject.
- 5B There is a good correlation to the external probe measurements in 5B, confirming the validity of the ischaemia indications by the method.
- Figure 6A-B shows the changes in post-systolic tissue velocity (including IVR) in the region of ischaemia.
- V ps the values for V ps are negative, except for one subject which is commented later.
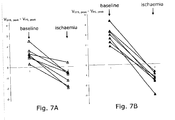
- Figures 7A and B show the parameter V sys, peak - V PS, peak , i.e. the difference between the peak velocity in the early systolic phase and in the post-systolic phase, for the embodiments of the invention (7A) and the external probe measurements (7B). Again, the parameters are shown for baseline and occluded LAD coronary artery for the miniaturized probe on the heart and an external probe. In 7A, a clear change in the parameter is seen between baseline and ischaemia for all subjects.
- the change shifts the sign on the parameter, from positive to negative.
- the parameter V SYS, peak - V PS, peak it is easy to distinct between baseline and ischaemia based solely on the sign of the parameter.
- the V SYS, peak - V PS, peak does not change to negative in the ischemic situation post-hoc analysis of the transducer placement in a video recording of the experiment reveals that the transducer were situated in a borderline ischemic area. This is interesting, because the trend is very clear also in this subject, even though the transducer is not optimally situated.
- the parameter V SYS, peak - V PS , peak provides a binary indication of ischaemia which does not seem to depend on the absolute parameter values or the subject.
- Such binary indication is extremely well suited for automation by computers.
- FIGS 8 and 9 show how changes in wall thickening and (V SYS -V PS ) occur when the heart is exposed to global interventions such as adrenalin, betablockers, niprid and added fluid volume. It demonstrate the potential of using the method or care unit to discriminate between ischaemia and the effect of other interventions.
Landscapes
- Health & Medical Sciences (AREA)
- Life Sciences & Earth Sciences (AREA)
- Medical Informatics (AREA)
- Biophysics (AREA)
- Nuclear Medicine, Radiotherapy & Molecular Imaging (AREA)
- Pathology (AREA)
- Radiology & Medical Imaging (AREA)
- Engineering & Computer Science (AREA)
- Biomedical Technology (AREA)
- Heart & Thoracic Surgery (AREA)
- Physics & Mathematics (AREA)
- Molecular Biology (AREA)
- Surgery (AREA)
- Animal Behavior & Ethology (AREA)
- General Health & Medical Sciences (AREA)
- Public Health (AREA)
- Veterinary Medicine (AREA)
- Cardiology (AREA)
- Gynecology & Obstetrics (AREA)
- Ultra Sonic Daignosis Equipment (AREA)
- Measuring Pulse, Heart Rate, Blood Pressure Or Blood Flow (AREA)
Abstract
Description
- The present invention relates to estimating cardiac pumping capacity, in particular a myocardial function monitoring system applying data recorded by ultrasonic transducers positioned on the heart.
- During and after cardiac surgery, it is of interest to monitor the performance of the heart and its responses to various forms of treatment. For example, an important mechanism for haemodynamic instability in the post operative period after aorta-coronary bypass surgery is graft occlusion. The regional myocardial ischaemia induced by this occlusion is often difficult to detect with present bedside monitoring techniques. Also, a sensitive technique for detecting regional ischaemia is strongly warranted during the surgical procedure in off-pump by-pass procedures.
- There is a need for new monitoring techniques of regional myocardial function in the postoperative period after cardiac surgery. Conventional monitoring techniques as ECG and blood pressure monitoring are of limited sensitivity and specificity. Established modalities as CT and MR are not suitable for continuous post-operative monitoring. Non-invasive echocardiographic methods with 2-D speckle tracking technique or Tissue Doppler Imaging are sensitive methods for detection of myocardial ischaemia, see e.g. " Grading of myocardial dysfunction by tissue Doppler echocardiography" Skulstad et al. J. American College of Cardiology 47: 1672-82, 2006. However, such techniques require a skilled operator and do therefore not allow continuous monitoring of myocardial function.
- Some older references describe using transducers fastened on the heart.
US 4,947,854 and " Doppler measurement of myocardial thickening with a single epicardial transducer" Hartley et al., Am J Physiol. Heart Circ Physiol. 245: 1066-1072, 1983 both describe two ultrasound transducers fastened to the myocardium, using one crystal for Doppler measurements of blood flow in coronary vessels and one crystal for measuring thickening of the chamber wall, the crystals are combined in a single probe. - There exist implantable sonomicrographic crystals for real-time monitoring of regional myocardial function, but for experimental use only (e.g " Post-systolic Shortening in Ischemic Myocardium - Active Contraction or Passive Recoil?" Skulstad et. Al, Circulation, 106: 718-724, 2002). Implantation of the crystals is not atraumatic or indifferent to the myocardium.
- Also, techniques for estimating ischemia from strain rate determined from TDI measurements have been described in e.g. Matre et al. "Multilayer radial systolic strain can identify subendocardial ischemia: An experimental tissue Doppler imaging study of the porcine left ventricular wall" Eup. J. Echocar. 8(6), 420-430, and Hashimoto et al. (2003) "Myocardial Strain Rate Is a Superiour Method for Evaluation of Left Ventricular Subendocardial Function Compared With Tissue Doppler Imaging" Journ. of the American College of Cardiology, Elsevier, .
- Finally,
US 5,188,106 describes, in relation toFigures 8A-C , a transducer implanted in the right ventricle for detecting myofibril motion. - It is a disadvantage of the above prior art techniques that no automated quantification of the signals is provided, which is needed if it shall be used in a postoperative care unit, especially where a multiple of patient data are continuously monitored.
- The object of the invention is to provide a method and a post-operative care unit for analysing and quantifying an ultrasound tissue Doppler imaging (TDI) signal from a transducer fastened on the myocardium. The quantification may result in a parameter or a graphical representation that indicates regional cardiac ischaemia or correlates with global hypokinetic heart function, thereby making the method and care unit suited for continuous postoperative monitoring.
- In a first embodiment, the invention provides a method for automatically analysing an ultrasound TDI signal on a computer and generate a parameter or a graphical representation that indicates regional cardiac ischemia or correlates with global hypokinetic heart function from a first TDI signal obtained by a miniaturized Doppler probe positioned in a relevant coronary artery supply area (e.g. the supply area of the left anterior descending (LAD) coronary artery) on an outer surface part of the myocardium, the method comprising:
- extracting from the first TDI signal a trace corresponding to at least one of tissue velocity, tissue strain, or tissue strain rate;
- correlating the extracted trace with a simultaneously recorded electrocardiogram to:
- o assign sections of the extracted trace to individual cardiac cycles; and to
- o define subsections within a cardiac cycle in the extracted trace corresponding to the early systolic phase and the post-systolic phase;
- reading, in at least the post-systolic phase of the extracted trace, a velocity and/or a strain and/or a strain rate; and
- generating a parameter or a graphical representation which is a function of one of these readings and which indicates regional cardiac ischaemia or correlates with global hypokinetic heart function.
- A miniaturized Doppler probe is an ultrasonic transducer with connections, cable outlet, housing etc. that are so small that it may be easily fixed to an inner organ with the cable through the skin.
- In a second embodiment, the invention provides a postoperative care unit for automatically analysing an ultrasound TDI signal, the unit comprising means for receiving a first TDI signal obtained by a miniaturized Doppler probe to be positioned in a relevant coronary artery supply area (e.g. the supply area of the LAD coronary artery) on an outer surface part of the myocardium and a simultaneously recorded electrocardiogram; a display; and an electronic processing unit comprising software means configured to:
- extracting from the first TDI signal a trace corresponding to at least one of tissue velocity, tissue strain, or tissue strain rate;
- correlating the extracted trace with the electrocardiogram to
- o assign sections of the extracted trace to individual cardiac cycles; and to
- o define subsections within a cardiac cycle in the extracted trace corresponding to the early systolic phase and the post-systolic phase;
- reading, in at least the post-systolic phase of the extracted trace, a velocity and/or a strain and/or a strain rate;
- generating a parameter or a graphical representation which is a function of one of these readings and which indicates regional cardiac ischaemia or correlates with global hypokinetic heart function; and
- displaying the generated parameter or graphical representation.
- In a preferred embodiment, the method and the software means in the care unit also read a velocity and/or a strain and/or a strain rate in the systolic phase of the extracted trace, and generate a parameter or a graphical representation which is a function of both the systolic and post-systolic readings. Including both readings may provide the advantage of improving the correlation leading to a more precise prediction of ischaemia.
- A specific implementation of the first and second embodiments is briefly described in the following for the purpose of illustration. In this implementation, miniaturized ultrasonic probes are sutured to the outer surface of the one to three main perfusion areas of the coronary arteries and connected to a computer by leads perforating the skin. Reflected ultrasonic signals from the myocardial wall are recorded as radiofrequency (RF) data and can be presented as so-called M-mode pictures which show how the thickness of the wall varies through the heart cycle.
- A stable recording of the inside border line of the wall (the endocardium) is difficult to obtain due to several reasons. The transducer has to keep an approximate 90° angle between the ultrasonic beam and the surface. The angle can vary during the heart contraction, thus adding difference in measured thickness. During contraction the interior lining of the heart will fold, and these foldings may superimpose on the wall inside, thus leading to overestimated wall thickness. Another reason may be that signal quality is poor, so that the border between wall inside and the ventricle lumen is poorly outlined. These problems with detecting the endocardium are the main reasons why automated monitoring of the changes in wall thickness during the heart contractions has not become a clinical tool.
- To avoid the endocardial problem wall thickening velocities are calculated from the RF data using the Doppler effect. These Doppler signals are stronger than the ultrasonic signals used for measurement of wall thickness and are therefore more optimal for monitoring myocardial function. Thickening velocities increase gradually when the site of measurement is moved from the wall surface towards the endocardium and velocity measurement must be done in defined depths of the wall. It is also an advantage that myocardial ischaemia reduces peak velocity in all layers through the wall. From a technical point of view the aim is to find a depth of measurement where optimal signals are obtained making this embodiment simple to implement.
- Below, a number of preferred embodiments, features or elements for the method of care unit are described. Although described mainly in relation to the method of the first embodiment, these preferred embodiments, features or elements are applicable also to the embodiment of the care unit.
- In the present context, the early systolic phase is a period equal to or within the interval from 50ms before the QRS-complex in the ECG (see e.g.
Figure 4 ) signal and until at least 150ms after the peak R, and including the isovolumic contraction phase (IVC). Also, the post-systolic phase is a period equal to or within the interval from aortic valve closure until 150 ms after aortic valve closure, and including the isovolumic relaxation phase (IVR). The timing of aortic valve closure is marked on ECG as the moment the positive systolic velocity declines to zero. - The velocity, strain and/or strain rate value may be read in both the early systolic phase and the post-systolic phase of the extracted trace, so that the reading comprises reading:
- systolic velocity, VSYS, and post-systolic velocity, VPS; and/or
- systolic strain, SSYS, and post-systolic strain, SPS; and/or
- systolic strain rate, SRSYS, and post-systolic strain rate, SRPS.
- Thereby, the generated parameter or graphical representation may be a function of both the systolic and the post-systolic reading. In a preferred embodiment, the generated parameter or graphical representation is a function of a difference between the systolic and post-systolic reading, preferably of VSYS - VPS. The value of such function may be displayed as a number or graphically, e.g. as a function of time.
- The reading may be a peak value of the trace in the subsection of the extracted trace, or it may be a mean value of the trace in the subsection. Thus the reading may comprise analysing the signal and calculating a derived value.
- Instead of a direct generation of the parameter or graphical representation as a mathematical function of the read value(s), it may be preferred to provide empiric signal interpretation data mapping the read velocity, strain or strain rate value, or a derived value or function, to the parameter or graphical representation. Such empiric signal interpretation data may e.g. be a lookup table, an empiric curve or a function which can be used to determine a parameter or graphical representation from a read value. The empiric signal interpretation data is typically determined from previously performed readings during experimentally induced ischaemia or dysfunction, where a degree of seriousness is simultaneously determined by other methods.
- In order to verify the correlation with regional cardiac ischaemia or global hypokinetic heart function, signals from further probes fastened elsewhere on the heart may be included in the analysis. Thus, in a preferred embodiment, the analysis is carried out on a second TDI signal obtained by a miniaturized Doppler probe on an outer surface part of the myocardium, and the generated parameter or graphical representation is also a function of one of the readings from the trace extracted from the second TDI signal. Similarly, in yet another embodiment, a TDI signals from a third probe positioned on an outer surface part of the myocardium may be included. The regions of interest will depend on which artery supply areas that have received bypass vessels.
- To enable monitoring of the patient over time, it may be preferred to:
- store the parameter or graphical representation generated at a first time; and
- present the stored parameter or graphical representation together with the corresponding parameter or graphical representation generated at later times, thereby enabling direct comparison between parameters or graphical representations at the first time and later times.
- An advantage of the present invention is that the generation of the parameter or graphical representation used for monitoring may be automated to a very large degree, such as requiring no human interaction after initial setup. Thus, the embodiments described above may preferably be carried out automatically so that the method and care unit generates the parameter or graphical representation automatically when receiving TDI and ECG signal. In addition, the generation of the parameter or graphical representation may preferably be carried out continuously over a longer period of time. In a preferred embodiment, the parameter or graphical representation is generated from the first TDI signal continuously over a period of at least 24 hours succeeding cardiac surgery.
In order to further automate the monitoring, a threshold value for the generated parameter or graphical representation may preferably be provided, and - o the generated parameter or graphical representation be monitored; and
- o an alarm state initiated if the generated parameter or graphical representation passes the threshold value.
- For the care unit, incorporation of an alarm in the monitoring may be implemented by further comprising input means allowing an operator to set a threshold value for the generated parameter or graphical representation and means for generating an alarm, wherein electronic processing unit further comprises software means for monitoring the generated parameter or graphical representation and activating the means for generating an alarm if the generated parameter or graphical representation passes the threshold value.
- The method and care unit may not only be used for monitoring a state of a patient in order to detect ischaemia or dysfunction due to graft occlusion. In another embodiment, the method and care unit is used to monitor the effect or lack of effect from a medical intervention. Here, the parameter or graphical representation is generated over a period of time including or following intravenous administration of a fluid or a medicament affecting the global hypokinetic heart function. A change in the global hypokinetic heart function during this period of time may be followed and optionally quantified using the parameter or graphical representation. Such a medicament could be infusion of adrenaline to increase the contraction of a hypokinetic heart. This drug may induce ischaemia if given in a too large dose. The ultrasonic measurements of cardiac function would precisely show when the function is normalized and/or if ischaemia occurs and a correct lowest medicament dose can be determined.
- In a further embodiment, the invention provides a method for indicating regional cardiac ischaemia or estimating global hypokinetic heart function. This method comprises
- obtaining a first TDI signal from a miniaturized Doppler probe positioned in a relevant coronary artery supply area on an outer surface part of the myocardium;
- extracting from the first TDI signal a trace corresponding to at least one of tissue velocity, tissue strain, or tissue strain rate and reading, in at least a post-systolic phase of the extracted trace, a velocity and/or a strain and/or a strain rate; and
- using the read value, or a derived value or function, to indicate regional cardiac ischaemia or estimate global hypokinetic heart function.
- In yet another embodiment, the invention provides the use of a TDI signal for indicating regional cardiac ischaemia or estimating global hypokinetic heart function in accordance with the above method.
- The basic idea of the invention is to use TDI signals from one or more miniaturized ultrasonic transducers fastened to the myocardium of a patient to automatically generate parameters or graphical representations that indicate or correlate with myocardial ischaemia or dysfunction. This has the advantage over standard methods using a manually operated ultrasound probe that it can be used continuously over longer periods of time, and thereby be used in post-operation monitoring of patients. In relation to previous disclosures of miniaturized ultrasonic transducers fastened to the heart, the invention provides the advantage of generating parameters or graphical representations that indicate or correlate with myocardial ischaemia or dysfunction.
-
-
Figure 1 is an echo screen showing a M-mode picture displaying wall thickness variations through four cardiac cycles. The broad grey line indicates depth of tissue velocity measurement (SeeFigure 3B ). -
Figure 2 is an illustration of a postoperative care unit according to an embodiment of the invention. -
Figure 3A echo screen, 3B Doppler screen; In 3B, ECG-curve (upper) and trace of tissue velocity (lower) in indicated depth (broad grey line) in M-mode window (3B). White horizontal and vertical bars inserted to exemplify a relevant time window for measurement of mean systolic and post-systolic velocities, and their approximate values. -
Figure 4 shows ECG-synchronized velocity curves in baseline and ischaemic situation. -
Figures 5A-B and 6A-B show the changes in (5) systolic and (6) post-systolic tissue velocity from baseline to ischaemia for (A) miniaturized ultrasonic transducer on the myocardium and (B) standard echocardiography using an external manually operated probe. -
Figures 7A-B shows the change in a velocity parameter from baseline to ischaemia for (A) miniaturized ultrasonic transducer on the myocardium and (B) standard echocardiography using an external manually operated probe. -
Figures 8 and 9 show how changes in wall thickening and (Vsys-Vps) occur when the heart is exposed to global interventions. - The invention relates to the analysis and treatment of data from a miniaturized ultrasonic transducer fastened to the myocardium of a patient. Hence, the operative procedure of fastening the transducer is a separate and preceding step which is not part of the invention or covered by the present application/patent.
- Miniaturized ultrasonic transducers are known from a number of applications, both medical and non-medical, see e.g.
US 2006/0116584 . When the ultrasonic transducer is sutured to the heart during the operation an optimal position on the wall and depth of measurement is secured by using M-mode echo signals as guidance shown inFigure 1 . An optimal position has been obtained when relatively distinct outer and inner surface lines of the wall are seen. Since the miniature ultrasound transducer is a regional monitor of myocardial function, it may be preferable to have two or three miniature ultrasound transducers in order to monitor global function or to confirm the reading from the main transducer. If more than one transducer is to be positioned, it is preferable to have one transducer in each of the one to three by-pass areas of the myocardium. -
Figure 2 is a schematic illustration of apostoperative care unit 20 according to an embodiment of the invention, comprising anelectronic processing unit 22 such as an integrated computer. The care unit has means 21 for receiving a first TDI signal from the miniaturized ultrasonic transducer, e.g. the one positioned in the supply area of the left anterior descending (LAD) coronary artery on an outer surface part of the myocardium. The means 21 can typically comprise a cable, an input terminal, an analogue to digital converter, and circuitry connecting the means to theelectronic processing unit 22 comprising aprocessor 23 and amemory 24 for storing the received signals. The means 21 also receives a simultaneously recorded electrocardiogram, typically from standard ECG equipment. - The
memory 24 of theelectronic processing unit 22 holds software means to be executed by theprocessor 23 for analysing the received signals and generating the parameter or graphical representation as will be described in relation to the method elsewhere. - The
care unit 20 further comprises adisplay 25 for displaying the generated parameter or graphical representation. In the specific example shown inFigure 2 , a parameter values is represented graphically as a function of time ascurve 26 indisplay 25. - As an optional feature, the care unit can also have a
display 27 for showing the e.g. direct echo and Doppler signals as well as other standard monitoring parameters used in an intensive care unit (electrocardiogram (ECG), blood pressure, heart rate, central venous pressure, O2-tension etc.). These can be used by an operator to ensure that the obtained TDI signals are appropriate, confirming that the transducer is properly fastened and functioning. - In one embodiment, the care unit comprises input means 28 allowing an operator to set a threshold value for the generated parameter or graphical representation, typically a keyboard as shown or a connection 40 to a remote computer. In the specific example shown in
Figure 2 , the threshold value is shown in thedisplay 25 asline 29, so that the operator can continuously see how close the generatedvalue 26 is to the threshold. The electronic processing unit comprises software means for monitoring the generatedvalue 26 and activating means for generating an alarm if the generatedvalue 26 passes below theline 29. The means for generating an alarm serves to notify an operator or hospital staff on duty. It can be implemented by a loudspeaker and awarning light 41 as shown, or it could be a network connection 40 to a centralized alarm system. - In order to set the threshold value, the operator can define a baseline value, e.g. defined over 10 heart beats. The threshold value can then be set as a fraction or multiple of the baseline, e.g. when an abnormal low peak velocity, a high post-systolic velocity, or a negative value of the function (VSYS - VPS) occurs. The user may select which of these options he wants to use during the monitoring.
- In the following, the process of extraction and analysis of a tissue velocity trace from the first TDI signal is described. Although described in relation to tissue velocity, the process applied equally to traces corresponding to tissue strain or tissue strain rate.
- In the
intensive care unit 20, the computer transforms the RF signals to velocities at a depth inside the wall, showing a velocity trace,curve 30, on the Doppler screen inFigure 3B . This trace is displayed below the M-mode picture of the wall (Figure 3A ). The optimal quality of velocity trace is usually obtained close to the inner surface of the wall. The measuring depth is shown as agrey line 10 in the M-mode picture inFigure 3A . The Doppler screen ofFigure 3B also displays a ECG-curve 32. - Using the simultaneously recorded ECG, the extracted trace can be divided into
individual sections 33 according to individual cardiac cycles, i.e. heartbeats. Within eachsection 33, subsections corresponding to the early systolic phase and the post-systolic phase can be defined, shown astime intervals velocity trace 30. - Now, a velocity (and/or strain and/or strain rate) value can be read in the defined intervals, such reading can be performed by an appropriate software application in the velocity trace data. The values can for example be peak or average values within the interval. When
such interval 34 is placed at the ejection phase as inFigure 3B , systolic velocity is automatically measured and a peak or mean value, VSYS, can be calculated. The same principle is used for selection of a post-systolic time interval 35 (just after end of systole), thereby acquiring an automated measurement of post-systolic velocity, VPS. - Several different parameters or graphical representations indicating regional cardiac ischaemia or correlating with global hypokinetic heart function exist. In the simplest embodiment, the parameter is the peak or mean value of the post-systolic velocity, VPS. In another embodiment, the parameter is the function VSYS - VPS, i.e. difference between (peak or mean values of) systolic velocity and post-systolic velocity. This value predicts ischaemia with good sensitivity and specificity, and improves the certainty in ischaemia diagnostics as will be shown later.
- If more than one transducer, the above procedure is performed for each of the transducers and the display can show three numbers continuously plus a baseline value on the screen. If the alarm is activated due to a low value from one or more of the transducers, this may indicate falling myocardial function. The operator can check the velocity trace to control that the quality of the myocardial velocity signals are adequate. If the quality of the velocity is adequate there are two possible conclusions: When VSYS is abnormal in all three regions of the myocardium with unchanged VPS and only moderate fall in VSYS - VPS, there is strong evidence for a global altered myocardial function due to changes in loading or inotropic conditions. If there are changes in only one of the regions, and most for the VSYS - VPS parameter, there are strong evidences for a regional ischemic event.
- In the following, a number of experiments and clinical studies are described in relation to
Figures 4 through 7 . These demonstrate the ability of the method and care unit of the invention to detect myocardial ischaemia and/or dysfunction. The results obtained with the miniaturized ultrasonic transducers are shown inFigures 5A-7A . These results are compared to results from standard echocardiographic techniques using a manually operated external ultrasonic probe, shown in correspondingFigures 5B-7B , in order to show the correlation with present techniques. It is, again, noted that the external probes are not suited for continuous postoperative monitoring of myocardial function since they can not be automated or carried out over longer periods of time. - Experiments have been carried out in a porcine model with seven pigs. We used a
miniature prototype 5 MHz ultrasonic transducer (GE Vingmed Ultrasound, Norway) sutured to the heart. In later experiments we used a 10 MHz transducer (Imasonic, France). We registered simultaneous ECG, blood pressure (arterial, central venous, left ventricular and left atrial), cardiac output by transit-time flowprobe (Medistim, Norway). 2D echo and tissue Doppler recordings were performed by conventional echocardiography (Vivid 7, GE Vingmed, Norway). - Ultrasonic RF-data were recorded simultaneously and synchronized with ECG and pressure data in a customized sampling programme made in LabView (LabView 8.0, National Instruments, TX).
- The miniature transducer was sutured to the surface of the heart in the supply area of the left descending coronary artery (LAD). LAD was occluded by snaring for 60 seconds. Cessation of flow was confirmed by Doppler flow measurement.
- For all measurements, baseline measurement were carried out prior to occlusion or intervention to show the sensitivity of the parameter or graphical representation characterizing the state after occlusion or intervention.
-
Figure 4 show ECG-synchronized tissue velocity curves of the wall thickening velocity at baseline and after 60 seconds of regional ischaemia. The time frames of 200 and 150 ms show the periods where systolic velocity and post-systolic velocity were registered. Systolic velocity (VSYS) was registered as peak value after isovolumic contraction phase (IVC - this being the first spike in the 200 ms window). Post-systolic velocity (VPS) was calculated as a mean of the minimum and maximum deflection on the velocity curve after start of isovolumic relaxation phase (IVR - this starting at negative velocity-shift after systole). - Systolic wall thickening velocity (VSYS) was significantly reduced from baseline to ischaemia after 60 seconds. Simultaneously, post-systolic thickening velocity (VPS) increased (see
Figure 4 ). The reduction in VSYS indicates loss of contractile force in this region due to ischaemia. A delayed contraction probably occurs during the post-systolic period when the left ventricular pressure falls. This may explain explain the striking increase in VPS. - The findings by the fastened miniature probe (
Figures 5A, 6A , and7A ) were in accordance with the results by conventional 2-D echocardiography using an external probe (Figures 5B, 6B and7B ). The results are also summarised in the table below showing mean values with standard deviation. P-values indicate a significant change in all values from baseline to ischaemia.Table. Peak and postsystolic velocities with Vsys-Vps relationship Baseline (cm/s) Ischemia (cm/s) p Systolic velocity (Vsys) 1.0 ± 0.28 0.28 ± 0.12 <0.01 Miniature probe Postsystolic velocity (Vps) 0.13 ± 0.56 1.57 ± 0.59 <0.01 Vsys-Vps 0.88 ± 0.63 -1.29 ± 0.57 <0.01 Systolic velocity (Vsys) 1.93 ± 0.47 0.81 ± 0.42 <0.01 Echocardiography Postsystolic velocity (Vps) -0.35 ± 0.94 2.09 ± 1.07 <0.01 Vsys-Vps 2.28 ±1,10 -1.67 ± 0.76 <0.01 -
Figures 5A and B show the parameter VSYS, peak, the peak velocity in the early systolic phase, for baseline and occluded LAD coronary artery. In 5A, a change in the parameter is seen between baseline and ischaemia for all subjects although the parameter values and the relative change varies from subject to subject. There is a good correlation to the external probe measurements in 5B, confirming the validity of the ischaemia indications by the method. -
Figure 6A-B shows the changes in post-systolic tissue velocity (including IVR) in the region of ischaemia. In the baseline situation the values for Vps are negative, except for one subject which is commented later. -
Figures 7A and B show the parameter Vsys, peak - VPS, peak, i.e. the difference between the peak velocity in the early systolic phase and in the post-systolic phase, for the embodiments of the invention (7A) and the external probe measurements (7B). Again, the parameters are shown for baseline and occluded LAD coronary artery for the miniaturized probe on the heart and an external probe. In 7A, a clear change in the parameter is seen between baseline and ischaemia for all subjects. - For all subjects but one, the change shifts the sign on the parameter, from positive to negative. Thus, even though the parameter values and the relative change varies from subject to subject, the parameter VSYS, peak - VPS, peak, it is easy to distinct between baseline and ischaemia based solely on the sign of the parameter. In the one subject where the VSYS, peak - VPS, peak does not change to negative in the ischemic situation post-hoc analysis of the transducer placement in a video recording of the experiment reveals that the transducer were situated in a borderline ischemic area. This is interesting, because the trend is very clear also in this subject, even though the transducer is not optimally situated.
- Hence, the parameter VSYS, peak - VPS, peak provides a binary indication of ischaemia which does not seem to depend on the absolute parameter values or the subject. Such binary indication is extremely well suited for automation by computers. Again, there is a good correlation to the external probe measurements in 5B and 6B, confirming the validity of the ischaemia indications by the method.
-
Figures 8 and 9 show how changes in wall thickening and (VSYS-VPS) occur when the heart is exposed to global interventions such as adrenalin, betablockers, niprid and added fluid volume. It demonstrate the potential of using the method or care unit to discriminate between ischaemia and the effect of other interventions.
Claims (14)
- A method for automatically analysing an ultrasound tissue Doppler imaging (TDI) signal on a computer (22) and automatically generate a parameter or a graphical representation that indicates regional cardiac ischaemia or correlates with global hypokinetic heart function, the method comprising:- obtaining a first TDI signal from a miniaturized Doppler probe fastened in a relevant coronary artery supply area on an outer surface part of the myocardium;- extracting from the first TDI signal a trace corresponding to at least one of tissue velocity, tissue strain, or tissue strain rate;- correlating the extracted trace with a simultaneously recorded electrocardiogram (30) too assign sections of the extracted trace to individual cardiac cycles; and too define subsections (34, 35) within a cardiac cycle in the extracted trace corresponding to the early systolic phase and the post-systolic phase;- reading, in at least the post-systolic phase of the extracted trace, a velocity and/or a strain and/or a strain rate; and- generating a parameter or a graphical representation which is a function of one of these readings and which indicates regional myocardial ischaemia or correlates with global hypokinetic heart function.
- The method according to claim 1, wherein the reading comprises reading, in the early systolic phase and the post-systolic phase of the extracted trace:- systolic velocity, VSYS, and post-systolic velocity, VPS; and/or- systolic strain, SSYS, and post-systolic strain, SPS; and/or- systolic strain rate, SRSYS, and post-systolic strain rate, SRPS; andwherein the generated parameter or graphical representation is a function of the systolic and the post-systolic reading.
- The method according to claim 2, wherein the generated parameter or graphical representation is a function of a difference between the systolic and post-systolic reading.
- The method according to any of the preceding claims, wherein the reading comprises reading a peak value of the trace in the subsection of the extracted trace.
- The method according to any of claims 1-3, wherein the reading comprises reading a mean value of the trace in the subsection of the extracted trace.
- The method according to any of the preceding claims, further comprising carrying out the steps of the method on a second TDI signal obtained by a miniaturized Doppler probe positioned in a second relevant coronary artery supply area on an outer surface part of the myocardium, and wherein the generated parameter or graphical representation is also a function of one of the readings from the trace extracted from the second TDI signal.
- The method according to claim 6, further comprising carrying out the steps of the method on a third TDI signal obtained by a miniaturized Doppler probe positioned in a third relevant coronary artery supply area on an outer surface part of the myocardium, and wherein the generated parameter or graphical representation is also a function of one of the readings from the trace extracted from the third TDI signal.
- The method according to any of the preceding claims, wherein the generation of a parameter or graphical representation which indicates regional cardiac ischaemia or which correlates with global hypokinetic heart function comprises providing empiric signal interpretation data mapping the read velocity, strain or strain rate value, or a derived value or function, to a parameter or graphical representation.
- The method according to any of the preceding claims, further comprising:- storing the parameter or graphical representation generated at a first time;- presenting the stored parameter or graphical representation together with the corresponding parameter or graphical representation generated at later times to enable direct comparison between parameters or graphical representations at the first time and later times.
- The method according to any of the preceding claims, wherein the parameter or graphical representation is generated from the first TDI signal continuously over a period of at least 24 hours succeeding a surgical intervention.
- The method according to any of the preceding claims, further comprising providing a threshold value for the generated parameter or graphical representation, and whereino the generated parameter or graphical representation is monitored; ando an alarm state is initiated if the generated parameter or graphical representation passes the threshold value.
- The method according to any of the preceding claims, wherein the parameter or graphical representation is generated over a period of time including or following intravenous administration of a fluid or a medicament affecting the global hypokinetic heart function, and wherein the method further comprises monitoring a change in the global hypokinetic heart function during this period of time.
- A postoperative care unit (20) for automatically analysing an ultrasound tissue Doppler imaging (TDI) signal, the unit comprising
means (21) for receiving a first TDI signal obtained by a miniaturized Doppler probe to be positioned in a relevant coronary artery supply area on an outer surface part of the myocardium and a simultaneously recorded electrocardiogram;
a display (27); and
an electronic processing unit (20) comprising software means configured for:- extracting from the first TDI signal a trace corresponding to at least one of tissue velocity, tissue strain, or tissue strain rate;- correlating the extracted trace with the electrocardiogram too assign sections of the extracted trace to individual cardiac cycles; and too define subsections within a cardiac cycle in the extracted trace corresponding to the early systolic phase and the post-systolic phase;- reading, in at least the post-systolic phase of the extracted trace, a velocity and/or a strain and/or a strain rate;- generating a parameter or a graphical representation which is a function of one of these readings and which indicates regional cardiac ischaemia or correlates with global hypokinetic heart function; and- displaying the generated parameter or graphical representation. - The postoperative care unit according to claim 13, further comprising input means (28, 40) allowing an operator to set a threshold value for the generated parameter or graphical representation and means (40, 41) for generating an alarm; and wherein electronic processing unit further comprises software means for monitoring the generated parameter or graphical representation and activating the means for generating an alarm if the generated parameter or graphical representation passes the threshold value.
Applications Claiming Priority (2)
| Application Number | Priority Date | Filing Date | Title |
|---|---|---|---|
| DKPA200701236 | 2007-08-30 | ||
| PCT/EP2008/061421 WO2009027522A1 (en) | 2007-08-30 | 2008-08-29 | Automated monitoring of myocardial function by ultrasonic transducers positioned on the heart |
Publications (2)
| Publication Number | Publication Date |
|---|---|
| EP2180834A1 EP2180834A1 (en) | 2010-05-05 |
| EP2180834B1 true EP2180834B1 (en) | 2011-05-04 |
Family
ID=39929935
Family Applications (1)
| Application Number | Title | Priority Date | Filing Date |
|---|---|---|---|
| EP08803411A Not-in-force EP2180834B1 (en) | 2007-08-30 | 2008-08-29 | Automated monitoring of myocardial function by ultrasonic transducers positioned on the heart |
Country Status (6)
| Country | Link |
|---|---|
| US (1) | US20110046488A1 (en) |
| EP (1) | EP2180834B1 (en) |
| AT (1) | ATE507777T1 (en) |
| CA (1) | CA2697456A1 (en) |
| DE (1) | DE602008006735D1 (en) |
| WO (1) | WO2009027522A1 (en) |
Families Citing this family (8)
| Publication number | Priority date | Publication date | Assignee | Title |
|---|---|---|---|---|
| CN102008327B (en) * | 2010-12-30 | 2012-05-16 | 广州宝胆医疗器械科技有限公司 | Capsule enteroscope system with color Doppler ultrasound function |
| WO2014137584A1 (en) * | 2013-03-06 | 2014-09-12 | The General Hospital Corporation | Determination of myocardial scar using velocity spectral map |
| GB201311494D0 (en) | 2013-06-27 | 2013-08-14 | Univ Oslo Hf | Monitoring of a cardiac assist device |
| CN104546009B (en) * | 2013-10-10 | 2019-01-22 | 深圳迈瑞生物医疗电子股份有限公司 | A dynamic cardiogram detection device |
| US11462238B2 (en) * | 2019-10-14 | 2022-10-04 | Dp Technologies, Inc. | Detection of sleep sounds with cycled noise sources |
| US12533110B2 (en) * | 2023-01-10 | 2026-01-27 | Echosens | Elastography device and method |
| CN116616813B (en) * | 2023-04-19 | 2025-11-28 | 青岛海信医疗设备股份有限公司 | Ultrasonic equipment and myocardial data processing method |
| CN117281494B (en) * | 2023-11-27 | 2024-03-12 | 安徽通灵仿生科技有限公司 | Method and device for identifying signal characteristic points of arterial blood pressure signals |
Family Cites Families (12)
| Publication number | Priority date | Publication date | Assignee | Title |
|---|---|---|---|---|
| US4947854A (en) | 1988-09-13 | 1990-08-14 | Baylor College Of Medicine | Epicardial multifunctional probe |
| US5188106A (en) * | 1991-03-08 | 1993-02-23 | Telectronics Pacing Systems, Inc. | Method and apparatus for chronically monitoring the hemodynamic state of a patient using doppler ultrasound |
| US5622174A (en) * | 1992-10-02 | 1997-04-22 | Kabushiki Kaisha Toshiba | Ultrasonic diagnosis apparatus and image displaying system |
| US6863655B2 (en) * | 2001-06-12 | 2005-03-08 | Ge Medical Systems Global Technology Company, Llc | Ultrasound display of tissue, tracking and tagging |
| CN100435741C (en) | 2002-12-11 | 2008-11-26 | 皇家飞利浦电子股份有限公司 | Miniaturized ultrasonic transducer |
| US8900149B2 (en) * | 2004-04-02 | 2014-12-02 | Teratech Corporation | Wall motion analyzer |
| JP2005342006A (en) * | 2004-05-31 | 2005-12-15 | Toshiba Corp | Ultrasonic diagnostic apparatus, ultrasonic image processing apparatus, and ultrasonic signal processing program |
| US7925329B2 (en) * | 2004-10-08 | 2011-04-12 | Proteus Biomedical, Inc. | Implantable doppler tomography system |
| US7689283B1 (en) * | 2004-11-15 | 2010-03-30 | Pacesetter, Inc. | Diastolic mechanical algorithm for optimization of AV timing using a plurality of sensors |
| US8155729B1 (en) * | 2006-02-17 | 2012-04-10 | General Electric Company | Method and apparatus to compensate imaging data with simultaneously acquired motion data |
| JP3955313B1 (en) * | 2006-10-02 | 2007-08-08 | 理一郎 柿原 | Ischemic heart disease diagnostic apparatus and program |
| JP5443719B2 (en) * | 2007-09-07 | 2014-03-19 | 株式会社東芝 | Ultrasonic diagnostic apparatus, ultrasonic image processing apparatus, and ultrasonic image processing program |
-
2008
- 2008-08-29 CA CA2697456A patent/CA2697456A1/en not_active Abandoned
- 2008-08-29 WO PCT/EP2008/061421 patent/WO2009027522A1/en not_active Ceased
- 2008-08-29 DE DE602008006735T patent/DE602008006735D1/en active Active
- 2008-08-29 AT AT08803411T patent/ATE507777T1/en not_active IP Right Cessation
- 2008-08-29 EP EP08803411A patent/EP2180834B1/en not_active Not-in-force
- 2008-08-29 US US12/672,569 patent/US20110046488A1/en not_active Abandoned
Also Published As
| Publication number | Publication date |
|---|---|
| DE602008006735D1 (en) | 2011-06-16 |
| WO2009027522A1 (en) | 2009-03-05 |
| CA2697456A1 (en) | 2009-03-05 |
| US20110046488A1 (en) | 2011-02-24 |
| ATE507777T1 (en) | 2011-05-15 |
| EP2180834A1 (en) | 2010-05-05 |
Similar Documents
| Publication | Publication Date | Title |
|---|---|---|
| JP4602972B2 (en) | Ultrasonic diagnostic apparatus and control method of ultrasonic diagnostic apparatus | |
| CN103260524B (en) | Method for myocardial segment work analysis | |
| US9179889B2 (en) | Ultrasonic diagnostic device, and method for measuring initma-media complex thickness | |
| US20110046488A1 (en) | Automated monitoring of myocardial function by ultrasonic transducers positioned on the heart | |
| JP6010050B2 (en) | Transthoracic cardiopulmonary monitor | |
| CN100512764C (en) | Ultrasonograph and ultrasonography | |
| US9724067B2 (en) | Transthoracic pulmonary doppler ultrasound for evaluating the heart or lung via doppler shift power spectrum | |
| WO2012052824A1 (en) | Measuring pulmonary blood pressure using transthoracic pulmonary doppler ultrasound | |
| WO2006043528A1 (en) | Ultrasonographic device and ultrasonographic device control method | |
| JP4667392B2 (en) | Ultrasonic diagnostic equipment | |
| CN112043259B (en) | Monitoring system, method and device | |
| JP3842285B2 (en) | Ultrasonic diagnostic apparatus and control method of ultrasonic diagnostic apparatus | |
| US20060135871A1 (en) | Method for measurement of systolic and diastolic time intervals | |
| JPH0779974A (en) | Ultrasonic diagnostic equipment | |
| CN100496410C (en) | Ultrasonic diagnostic apparatus and method for controlling ultrasonic diagnostic apparatus | |
| JP2008161546A (en) | Ultrasonic diagnostic equipment | |
| JP2004344370A (en) | Ultrasound diagnostic equipment | |
| CN103687549B (en) | Ultrasonic probe, living body information measuring device, and living body information measuring method | |
| Wilson | Improved Strain Analysis of Left Ventricular Function Post Myocardial Infarction in Mice | |
| Espinoza | Monitoring of myocardial function by epicardial ultrasonic transducers. | |
| CN103687549A (en) | Ultrasonic probe, living body information measuring device, and living body information measuring method |
Legal Events
| Date | Code | Title | Description |
|---|---|---|---|
| PUAI | Public reference made under article 153(3) epc to a published international application that has entered the european phase |
Free format text: ORIGINAL CODE: 0009012 |
|
| 17P | Request for examination filed |
Effective date: 20100208 |
|
| AK | Designated contracting states |
Kind code of ref document: A1 Designated state(s): AT BE BG CH CY CZ DE DK EE ES FI FR GB GR HR HU IE IS IT LI LT LU LV MC MT NL NO PL PT RO SE SI SK TR |
|
| AX | Request for extension of the european patent |
Extension state: AL BA MK RS |
|
| RIN1 | Information on inventor provided before grant (corrected) |
Inventor name: ESPINOZA, ANDREAS Inventor name: HOFF, LARS Inventor name: IHLEN, HALFDAN Inventor name: ELLE, OLE JAKOB Inventor name: FOSSE, ERIK |
|
| GRAP | Despatch of communication of intention to grant a patent |
Free format text: ORIGINAL CODE: EPIDOSNIGR1 |
|
| DAX | Request for extension of the european patent (deleted) | ||
| RAP1 | Party data changed (applicant data changed or rights of an application transferred) |
Owner name: OSLO UNIVERSITETSSYKEHUS HF |
|
| GRAS | Grant fee paid |
Free format text: ORIGINAL CODE: EPIDOSNIGR3 |
|
| GRAA | (expected) grant |
Free format text: ORIGINAL CODE: 0009210 |
|
| AK | Designated contracting states |
Kind code of ref document: B1 Designated state(s): AT BE BG CH CY CZ DE DK EE ES FI FR GB GR HR HU IE IS IT LI LT LU LV MC MT NL NO PL PT RO SE SI SK TR |
|
| REG | Reference to a national code |
Ref country code: GB Ref legal event code: FG4D |
|
| REG | Reference to a national code |
Ref country code: CH Ref legal event code: EP |
|
| REG | Reference to a national code |
Ref country code: IE Ref legal event code: FG4D |
|
| REF | Corresponds to: |
Ref document number: 602008006735 Country of ref document: DE Date of ref document: 20110616 Kind code of ref document: P |
|
| REG | Reference to a national code |
Ref country code: DE Ref legal event code: R096 Ref document number: 602008006735 Country of ref document: DE Effective date: 20110616 |
|
| REG | Reference to a national code |
Ref country code: NL Ref legal event code: VDEP Effective date: 20110504 |
|
| REG | Reference to a national code |
Ref country code: CH Ref legal event code: NV Representative=s name: FIAMMENGHI-FIAMMENGHI |
|
| PG25 | Lapsed in a contracting state [announced via postgrant information from national office to epo] |
Ref country code: NO Free format text: LAPSE BECAUSE OF FAILURE TO SUBMIT A TRANSLATION OF THE DESCRIPTION OR TO PAY THE FEE WITHIN THE PRESCRIBED TIME-LIMIT Effective date: 20110804 Ref country code: PT Free format text: LAPSE BECAUSE OF FAILURE TO SUBMIT A TRANSLATION OF THE DESCRIPTION OR TO PAY THE FEE WITHIN THE PRESCRIBED TIME-LIMIT Effective date: 20110905 Ref country code: LT Free format text: LAPSE BECAUSE OF FAILURE TO SUBMIT A TRANSLATION OF THE DESCRIPTION OR TO PAY THE FEE WITHIN THE PRESCRIBED TIME-LIMIT Effective date: 20110504 Ref country code: SE Free format text: LAPSE BECAUSE OF FAILURE TO SUBMIT A TRANSLATION OF THE DESCRIPTION OR TO PAY THE FEE WITHIN THE PRESCRIBED TIME-LIMIT Effective date: 20110504 |
|
| PG25 | Lapsed in a contracting state [announced via postgrant information from national office to epo] |
Ref country code: FI Free format text: LAPSE BECAUSE OF FAILURE TO SUBMIT A TRANSLATION OF THE DESCRIPTION OR TO PAY THE FEE WITHIN THE PRESCRIBED TIME-LIMIT Effective date: 20110504 Ref country code: CY Free format text: LAPSE BECAUSE OF FAILURE TO SUBMIT A TRANSLATION OF THE DESCRIPTION OR TO PAY THE FEE WITHIN THE PRESCRIBED TIME-LIMIT Effective date: 20110504 Ref country code: AT Free format text: LAPSE BECAUSE OF FAILURE TO SUBMIT A TRANSLATION OF THE DESCRIPTION OR TO PAY THE FEE WITHIN THE PRESCRIBED TIME-LIMIT Effective date: 20110504 Ref country code: ES Free format text: LAPSE BECAUSE OF FAILURE TO SUBMIT A TRANSLATION OF THE DESCRIPTION OR TO PAY THE FEE WITHIN THE PRESCRIBED TIME-LIMIT Effective date: 20110815 Ref country code: LV Free format text: LAPSE BECAUSE OF FAILURE TO SUBMIT A TRANSLATION OF THE DESCRIPTION OR TO PAY THE FEE WITHIN THE PRESCRIBED TIME-LIMIT Effective date: 20110504 Ref country code: IS Free format text: LAPSE BECAUSE OF FAILURE TO SUBMIT A TRANSLATION OF THE DESCRIPTION OR TO PAY THE FEE WITHIN THE PRESCRIBED TIME-LIMIT Effective date: 20110904 Ref country code: BE Free format text: LAPSE BECAUSE OF FAILURE TO SUBMIT A TRANSLATION OF THE DESCRIPTION OR TO PAY THE FEE WITHIN THE PRESCRIBED TIME-LIMIT Effective date: 20110504 Ref country code: GR Free format text: LAPSE BECAUSE OF FAILURE TO SUBMIT A TRANSLATION OF THE DESCRIPTION OR TO PAY THE FEE WITHIN THE PRESCRIBED TIME-LIMIT Effective date: 20110805 Ref country code: SI Free format text: LAPSE BECAUSE OF FAILURE TO SUBMIT A TRANSLATION OF THE DESCRIPTION OR TO PAY THE FEE WITHIN THE PRESCRIBED TIME-LIMIT Effective date: 20110504 |
|
| PGFP | Annual fee paid to national office [announced via postgrant information from national office to epo] |
Ref country code: DE Payment date: 20110823 Year of fee payment: 4 Ref country code: FR Payment date: 20110901 Year of fee payment: 4 |
|
| PG25 | Lapsed in a contracting state [announced via postgrant information from national office to epo] |
Ref country code: MT Free format text: LAPSE BECAUSE OF FAILURE TO SUBMIT A TRANSLATION OF THE DESCRIPTION OR TO PAY THE FEE WITHIN THE PRESCRIBED TIME-LIMIT Effective date: 20110504 Ref country code: NL Free format text: LAPSE BECAUSE OF FAILURE TO SUBMIT A TRANSLATION OF THE DESCRIPTION OR TO PAY THE FEE WITHIN THE PRESCRIBED TIME-LIMIT Effective date: 20110504 |
|
| PG25 | Lapsed in a contracting state [announced via postgrant information from national office to epo] |
Ref country code: CZ Free format text: LAPSE BECAUSE OF FAILURE TO SUBMIT A TRANSLATION OF THE DESCRIPTION OR TO PAY THE FEE WITHIN THE PRESCRIBED TIME-LIMIT Effective date: 20110504 Ref country code: EE Free format text: LAPSE BECAUSE OF FAILURE TO SUBMIT A TRANSLATION OF THE DESCRIPTION OR TO PAY THE FEE WITHIN THE PRESCRIBED TIME-LIMIT Effective date: 20110504 |
|
| PG25 | Lapsed in a contracting state [announced via postgrant information from national office to epo] |
Ref country code: PL Free format text: LAPSE BECAUSE OF FAILURE TO SUBMIT A TRANSLATION OF THE DESCRIPTION OR TO PAY THE FEE WITHIN THE PRESCRIBED TIME-LIMIT Effective date: 20110504 Ref country code: DK Free format text: LAPSE BECAUSE OF FAILURE TO SUBMIT A TRANSLATION OF THE DESCRIPTION OR TO PAY THE FEE WITHIN THE PRESCRIBED TIME-LIMIT Effective date: 20110504 Ref country code: RO Free format text: LAPSE BECAUSE OF FAILURE TO SUBMIT A TRANSLATION OF THE DESCRIPTION OR TO PAY THE FEE WITHIN THE PRESCRIBED TIME-LIMIT Effective date: 20110504 Ref country code: SK Free format text: LAPSE BECAUSE OF FAILURE TO SUBMIT A TRANSLATION OF THE DESCRIPTION OR TO PAY THE FEE WITHIN THE PRESCRIBED TIME-LIMIT Effective date: 20110504 |
|
| PLBE | No opposition filed within time limit |
Free format text: ORIGINAL CODE: 0009261 |
|
| STAA | Information on the status of an ep patent application or granted ep patent |
Free format text: STATUS: NO OPPOSITION FILED WITHIN TIME LIMIT |
|
| PG25 | Lapsed in a contracting state [announced via postgrant information from national office to epo] |
Ref country code: MC Free format text: LAPSE BECAUSE OF NON-PAYMENT OF DUE FEES Effective date: 20110831 |
|
| 26N | No opposition filed |
Effective date: 20120207 |
|
| REG | Reference to a national code |
Ref country code: IE Ref legal event code: MM4A |
|
| PG25 | Lapsed in a contracting state [announced via postgrant information from national office to epo] |
Ref country code: HR Free format text: LAPSE BECAUSE OF FAILURE TO SUBMIT A TRANSLATION OF THE DESCRIPTION OR TO PAY THE FEE WITHIN THE PRESCRIBED TIME-LIMIT Effective date: 20111123 |
|
| REG | Reference to a national code |
Ref country code: DE Ref legal event code: R097 Ref document number: 602008006735 Country of ref document: DE Effective date: 20120207 |
|
| PG25 | Lapsed in a contracting state [announced via postgrant information from national office to epo] |
Ref country code: IE Free format text: LAPSE BECAUSE OF NON-PAYMENT OF DUE FEES Effective date: 20110829 |
|
| REG | Reference to a national code |
Ref country code: CH Ref legal event code: PL |
|
| GBPC | Gb: european patent ceased through non-payment of renewal fee |
Effective date: 20120829 |
|
| PG25 | Lapsed in a contracting state [announced via postgrant information from national office to epo] |
Ref country code: CH Free format text: LAPSE BECAUSE OF NON-PAYMENT OF DUE FEES Effective date: 20120831 Ref country code: LI Free format text: LAPSE BECAUSE OF NON-PAYMENT OF DUE FEES Effective date: 20120831 |
|
| REG | Reference to a national code |
Ref country code: FR Ref legal event code: ST Effective date: 20130430 |
|
| PG25 | Lapsed in a contracting state [announced via postgrant information from national office to epo] |
Ref country code: LU Free format text: LAPSE BECAUSE OF NON-PAYMENT OF DUE FEES Effective date: 20110829 Ref country code: IT Free format text: LAPSE BECAUSE OF NON-PAYMENT OF DUE FEES Effective date: 20120829 |
|
| PG25 | Lapsed in a contracting state [announced via postgrant information from national office to epo] |
Ref country code: BG Free format text: LAPSE BECAUSE OF FAILURE TO SUBMIT A TRANSLATION OF THE DESCRIPTION OR TO PAY THE FEE WITHIN THE PRESCRIBED TIME-LIMIT Effective date: 20110804 |
|
| PG25 | Lapsed in a contracting state [announced via postgrant information from national office to epo] |
Ref country code: GB Free format text: LAPSE BECAUSE OF NON-PAYMENT OF DUE FEES Effective date: 20120829 Ref country code: DE Free format text: LAPSE BECAUSE OF NON-PAYMENT OF DUE FEES Effective date: 20130301 |
|
| PG25 | Lapsed in a contracting state [announced via postgrant information from national office to epo] |
Ref country code: FR Free format text: LAPSE BECAUSE OF NON-PAYMENT OF DUE FEES Effective date: 20120831 |
|
| REG | Reference to a national code |
Ref country code: DE Ref legal event code: R119 Ref document number: 602008006735 Country of ref document: DE Effective date: 20130301 |
|
| PG25 | Lapsed in a contracting state [announced via postgrant information from national office to epo] |
Ref country code: TR Free format text: LAPSE BECAUSE OF FAILURE TO SUBMIT A TRANSLATION OF THE DESCRIPTION OR TO PAY THE FEE WITHIN THE PRESCRIBED TIME-LIMIT Effective date: 20110504 |
|
| PG25 | Lapsed in a contracting state [announced via postgrant information from national office to epo] |
Ref country code: HU Free format text: LAPSE BECAUSE OF FAILURE TO SUBMIT A TRANSLATION OF THE DESCRIPTION OR TO PAY THE FEE WITHIN THE PRESCRIBED TIME-LIMIT Effective date: 20110504 |
|
| PG25 | Lapsed in a contracting state [announced via postgrant information from national office to epo] |
Ref country code: HR Free format text: LAPSE BECAUSE OF FAILURE TO SUBMIT A TRANSLATION OF THE DESCRIPTION OR TO PAY THE FEE WITHIN THE PRESCRIBED TIME-LIMIT Effective date: 20110504 |