EP2157905B1 - A method for tracking 3d anatomical and pathological changes in tubular-shaped anatomical structures - Google Patents
A method for tracking 3d anatomical and pathological changes in tubular-shaped anatomical structures Download PDFInfo
- Publication number
- EP2157905B1 EP2157905B1 EP08757093A EP08757093A EP2157905B1 EP 2157905 B1 EP2157905 B1 EP 2157905B1 EP 08757093 A EP08757093 A EP 08757093A EP 08757093 A EP08757093 A EP 08757093A EP 2157905 B1 EP2157905 B1 EP 2157905B1
- Authority
- EP
- European Patent Office
- Prior art keywords
- image
- interest
- region
- cross
- tubular
- Prior art date
- Legal status (The legal status is an assumption and is not a legal conclusion. Google has not performed a legal analysis and makes no representation as to the accuracy of the status listed.)
- Not-in-force
Links
Images








Classifications
-
- A—HUMAN NECESSITIES
- A61—MEDICAL OR VETERINARY SCIENCE; HYGIENE
- A61B—DIAGNOSIS; SURGERY; IDENTIFICATION
- A61B6/00—Apparatus or devices for radiation diagnosis; Apparatus or devices for radiation diagnosis combined with radiation therapy equipment
- A61B6/52—Devices using data or image processing specially adapted for radiation diagnosis
- A61B6/5211—Devices using data or image processing specially adapted for radiation diagnosis involving processing of medical diagnostic data
- A61B6/5229—Devices using data or image processing specially adapted for radiation diagnosis involving processing of medical diagnostic data combining image data of a patient, e.g. combining a functional image with an anatomical image
- A61B6/5247—Devices using data or image processing specially adapted for radiation diagnosis involving processing of medical diagnostic data combining image data of a patient, e.g. combining a functional image with an anatomical image combining images from an ionising-radiation diagnostic technique and a non-ionising radiation diagnostic technique, e.g. X-ray and ultrasound
-
- A—HUMAN NECESSITIES
- A61—MEDICAL OR VETERINARY SCIENCE; HYGIENE
- A61B—DIAGNOSIS; SURGERY; IDENTIFICATION
- A61B6/00—Apparatus or devices for radiation diagnosis; Apparatus or devices for radiation diagnosis combined with radiation therapy equipment
- A61B6/50—Apparatus or devices for radiation diagnosis; Apparatus or devices for radiation diagnosis combined with radiation therapy equipment specially adapted for specific body parts; specially adapted for specific clinical applications
- A61B6/504—Apparatus or devices for radiation diagnosis; Apparatus or devices for radiation diagnosis combined with radiation therapy equipment specially adapted for specific body parts; specially adapted for specific clinical applications for diagnosis of blood vessels, e.g. by angiography
-
- G—PHYSICS
- G06—COMPUTING OR CALCULATING; COUNTING
- G06T—IMAGE DATA PROCESSING OR GENERATION, IN GENERAL
- G06T7/00—Image analysis
- G06T7/10—Segmentation; Edge detection
- G06T7/11—Region-based segmentation
-
- G—PHYSICS
- G06—COMPUTING OR CALCULATING; COUNTING
- G06T—IMAGE DATA PROCESSING OR GENERATION, IN GENERAL
- G06T7/00—Image analysis
- G06T7/10—Segmentation; Edge detection
- G06T7/149—Segmentation; Edge detection involving deformable models, e.g. active contour models
-
- A—HUMAN NECESSITIES
- A61—MEDICAL OR VETERINARY SCIENCE; HYGIENE
- A61B—DIAGNOSIS; SURGERY; IDENTIFICATION
- A61B6/00—Apparatus or devices for radiation diagnosis; Apparatus or devices for radiation diagnosis combined with radiation therapy equipment
- A61B6/48—Diagnostic techniques
- A61B6/481—Diagnostic techniques involving the use of contrast agents
-
- G—PHYSICS
- G06—COMPUTING OR CALCULATING; COUNTING
- G06T—IMAGE DATA PROCESSING OR GENERATION, IN GENERAL
- G06T2200/00—Indexing scheme for image data processing or generation, in general
- G06T2200/08—Indexing scheme for image data processing or generation, in general involving all processing steps from image acquisition to 3D model generation
-
- G—PHYSICS
- G06—COMPUTING OR CALCULATING; COUNTING
- G06T—IMAGE DATA PROCESSING OR GENERATION, IN GENERAL
- G06T2207/00—Indexing scheme for image analysis or image enhancement
- G06T2207/10—Image acquisition modality
- G06T2207/10072—Tomographic images
- G06T2207/10081—Computed x-ray tomography [CT]
-
- G—PHYSICS
- G06—COMPUTING OR CALCULATING; COUNTING
- G06T—IMAGE DATA PROCESSING OR GENERATION, IN GENERAL
- G06T2207/00—Indexing scheme for image analysis or image enhancement
- G06T2207/20—Special algorithmic details
- G06T2207/20092—Interactive image processing based on input by user
-
- G—PHYSICS
- G06—COMPUTING OR CALCULATING; COUNTING
- G06T—IMAGE DATA PROCESSING OR GENERATION, IN GENERAL
- G06T2207/00—Indexing scheme for image analysis or image enhancement
- G06T2207/20—Special algorithmic details
- G06T2207/20112—Image segmentation details
- G06T2207/20116—Active contour; Active surface; Snakes
-
- G—PHYSICS
- G06—COMPUTING OR CALCULATING; COUNTING
- G06T—IMAGE DATA PROCESSING OR GENERATION, IN GENERAL
- G06T2207/00—Indexing scheme for image analysis or image enhancement
- G06T2207/30—Subject of image; Context of image processing
- G06T2207/30004—Biomedical image processing
- G06T2207/30101—Blood vessel; Artery; Vein; Vascular
Definitions
- the present invention relates to a method for tracking 3D anatomical and pathological changes in tubular-shaped anatomical structures.
- Medical imaging is increasingly used to study the changes in size and shape of anatomical structures over time. As these changes often serve as indicators of the presence of a disease, extraction of quantitative information from such medical images has many applications in clinical diagnosis.
- the prior art teaches various methods for computing the value of Dmax, leading to different inconsistent definitions of the Dmax parameter.
- current measurement methods typically generate intra- and inter-observer variability as well as result in systematic overestimation of the Dmax value as they use either rough estimation based on the appearance of the aneurysm or cumbersome and time-consuming manual outlining of aneurysm anatomy or pathology on sequences of patient images.
- current segmentation techniques use contrast agents that only enable visualization of the aneurysm lumen and not visualization of the thrombus, the latter cannot be segmented using these methods, although it is critical in determining the value of Dmax.
- Current segmentation techniques further make it difficult to control the quality of the segmentation as well as correct any mistakes generated by the software.
- WO 2006/085155 discloses a method for imaging a volume of interest, such as an organ or tumour or the like, where the data slices contain a contour line which when stacked together define the volume and from which a plurality of curves are calculated. The curves are arranged to bound the volume.
- an object of the present invention is a standardized method for tracking 3D changes in an anatomical structure, such as an aortic aneurysm, based on 3D images.
- a clinical diagnostic tool which enables segmentation of medical images in 3D to be performed and accurate information related to the anatomical structure under observation obtained in a simple, fast and reproducible manner, would be useful.
- a method for visualizing an anatomy of a region of interest of a tubular-shaped organ on a display comprises acquiring an image of the anatomy of the tubular shaped organ in the region of interest at a first point in time, extracting a plurality of discrete points from the image defining a minimum-curvature path within the tubular-shaped organ, interpolating a set of cross-sectional images along planes substantially perpendicular to a tangent vector of the minimum-curvature path at each of the plurality of discrete points, delimiting a segmented area corresponding to the region of interest of the tubular-shaped organ in each of the set of cross-sectional images, rendering a three-dimensional surface representation of the region of interest from the delimited set of cross-sectional images and displaying the rendered three-dimensional surface representation on the display.
- a system for visualizing the anatomy of a region of interest of a tubular-shaped organ comprises a scanning device for acquiring an image of the region of interest of the tubular shaped organ, a database connected to the scanning device for storing the acquired image, and a workstation connected to the database for retrieving the stored image, the workstation comprising a display, a user interface, and an image processor.
- the image processor extracts from the image a plurality of discrete points defining a minimum-curvature path within the region of interest of the tubular-shaped organ, interpolates a set of cross-sectional images along planes substantially perpendicular to a tangent vector of the minimum-curvature path at each of the plurality of discrete points, delimits a segmented area corresponding to the region of interest of the tubular-shaped organ in each of the set of cross-sectional images, computes a three-dimensional surface representation of the region of interest from the delimited set of cross-sectional images and displays the computed three-dimensional surface representation on the display.
- a computer program storage medium readable by a computing system and encoding a computer program of instructions for executing a computer process for visualizing the anatomy of a region of interest of a tubular-shaped organ.
- the computer process comprises acquiring an image of the anatomy of the tubular shaped organ in the region of interest, extracting from the image a plurality of discrete points defining a minimum-curvature path within the tubular-shaped organ, interpolating a set of cross-sectional images along planes substantially perpendicular to a tangent vector of the minimum-curvature path at each of the discrete points, delimiting a segmented area corresponding to the region of interest of the tubular-shaped organ in each of the set of cross-sectional images, computing a three-dimensional surface representation of the region of interest from the delimited set of cross-sectional images, and displaying the rendered three-dimensional surface representation on the display.
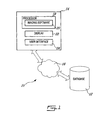
- Figure 1 is a schematic diagram of an image analysis system in accordance with an illustrative embodiment of the present invention
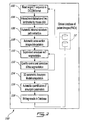
- Figure 2 is a flow chart of an image analysis method in accordance with an illustrative embodiment of the present invention
- Figure 3 is a diagram of an abdominal aortic aneurysm in accordance with an illustrative embodiment of the present invention.
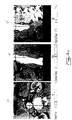
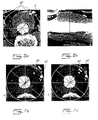
- Figures 4a and 4b show cross-section images of the abdominal aortic aneurysm of Figure 3 during landmark initialization in accordance with an illustrative embodiment of the present invention
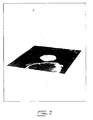
- Figure 5 shows a cross-section image of an abdominal aortic aneurysm interpolated along a minimum-curvature path in accordance with an illustrative embodiment of the present invention
- Figures 6a and 6b show a representation of cross-section images used for segmentation of an abdominal aortic aneurysm in accordance with an illustrative embodiment of the present invention
- Figures 7a and 7b show the cross-section images of Figures 6a and 6b during positioning of angular slices in accordance with an illustrative embodiment of the present invention
- Figures 8a and 8b show cross-section images of an abdominal aortic aneurysm during active-shape contour segmentation in accordance with an illustrative embodiment of the present invention
- Figures 9a and 9b show cross-section images of an abdominal aortic aneurysm during segmentation quality control in accordance with an illustrative embodiment of the present invention
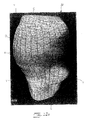
- Figure 10 is a schematic diagram of a 3D aneurysm wall model in accordance with an illustrative embodiment of the present invention.
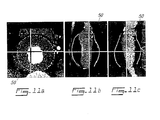
- Figure 11 is a representation of the 3D aneurysm wall model of Figure 10 in axial, sagittal and coronal views in accordance with an illustrative embodiment of the present invention
- Figures 12a and 12b show two representations of the maximum diameter of an abdominal aortic aneurysm in accordance with an illustrative embodiment of the present invention
- Figure 13a shows a segmentation of the false thrombus an aorta in accordance with an illustrative embodiment of the present invention
- Figure 13b shows a segmentation of an aorta separated into two pathological components resulting from aortic dissection in accordance with an illustrative embodiment of the present invention
- Figure 14a shows a segmentation of the lumen of a thoracic aortic aneurysm in accordance with an illustrative embodiment of the present invention
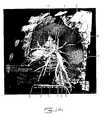
- Figures 14b and 14c show a segmentation of the thrombus and a representation on a 3D wall model of the maximum diameter of a thoracic aortic aneurysm in accordance with an illustrative embodiment of the present invention
- Figure 14d and 14e show a representation on a 3D wall model of the thrombus thickness of a thoracic aortic aneurysm in accordance with an illustrative embodiment of the present invention
- Figure 15 shows a segmentation of a cat's spinal cord in accordance with an illustrative embodiment of the present invention
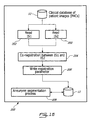
- Figure 16 is a flow chart of an image registration method in accordance with an illustrative embodiment of the present invention.
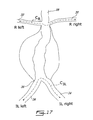
- Figure 17 is a schematic of an abdominal aortic aneurysm during landmark initialization for image registration in accordance with an illustrative embodiment of the present invention.
- the system 10 comprises a database 12 for storing patient images and a workstation 14 for accessing the stored images through a communications network 16, such as a Local Area Network (LAN).
- the workstation 14 comprises a processor 18, on which an imaging software module 20 responsible for processing images retrieved from the database 12 is installed.
- the workstation 14 further comprises a display 22 and a user interface 24 (e.g. a mouse and keyboard), which enable users to interact with the imaging software 20 by displaying and manipulating image data in response to input commands.
- the display 22 and the user interface 24 thus enable users to visualize and supervise the image analysis process performed by the imaging software 20.
- Angiography has the advantage of being an efficient and relatively non-invasive diagnostic tool.
- CT angiography an X-ray picture is taken to visualize the inner opening of blood filled structures, including arteries, veins and the heart chambers.
- Contrast agents may be used to improve the visibility of the patient's internal bodily structures on the angiography image, for instance by enabling to differentiate intensity values of the vessel interior and wall.
- DICOM Digital Image Communications in Medicine
- Thin axial image slices of the area under observation are typically obtained during the procedure and images in the remaining two spatial planes (coronal and sagittal) are calculated by a computer.
- the patient images are stored as image data sets into the database 12, illustratively in the Digital Image Communications in Medicine (DICOM) format, for subsequent retrieval and analysis.
- DICOM format is of particular interest in medical applications, as it enables easy standardised data communication between systems produced by different manufacturers and using different internal formats, thus allowing effective connection of different components of an imaging department. Since different clinical imaging exams may be performed at different times to study the progression of a patient's disorder, a resulting plurality of image data sets corresponding to each imaging exam may be stored in the database 12 and each image set is then treated separately by the imaging software 20.
- a user wishing to analyze patient images illustratively accesses the workstation 14, and via the user interface 24 (which illustratively comprises, in addition to the display 22, a pointing device such as a mouse or the like and an appropriate operating system software), imports the image set(s) related to the patient under observation.
- the imaging software 20 is then invoked by the user in order to open the imported images (102), which are shown on the display 22 so that the user may proceed with the segmentation process at 104.
- the anatomical structure under observation is an abdominal aortic aneurysm 26, although it would be understood by one skilled in the art that the method 100 may be applied to other types of aneurysms (e.g. thoracic, intracranial), as well as other tubular-shaped organs, such as the colon, trachea, and spine.
- the method 100 may also have other applications such as analysis of soft tissues, of atheromatous plaque in carotid arteries, and follow-up of stent grafts.
- an abdominal aortic aneurysm 26 is a disorder of the aorta 28 characterized by a localized dilation of the arterial wall 30.
- An aortic aneurysm is typically located below the renal arteries 32 and above the iliac arteries 34 and the aorta-iliac bifurcation 36.
- the inner space of the aorta is referred to as the lumen 38, as is the case for any other vessel in the body, while the thickness of the aorta wall in the region of the aneurysm is referred to as the thrombus 40.
- Figure 4a and Figure 4b in addition to Figure 2 , to visualize the aneurysm 26 and initiate the segmentation process of the aneurysm wall 30, the user illustratively defines two displaced landmarks L1 and L2 in characteristic and easily identifiable regions of the lumen 38 and towards either ends of the portion of the lumen 38 to be visualised. This is done via the user interface 24 by moving a cursor in one or other of the displayed axial, coronal and sagittal image slices, as illustrated in Figure 3 .
- a first landmark L1 is placed before the aneurysm 26 ( Figure 4a ) and a second landmark L2 after the aneurysm 26 ( Figure 4b ).
- Landmark initialization is illustratively done in Multi-Planar Reformatting (MPR) view, a reformatting technique which passes a plane through an image set, thus enabling users to view the volume under inspection along a different direction than that of the original image set.
- MPR Multi-Planar Reformatting
- the landmarks L1 and L2 thus defined are used at 106 as start and end points for automatic extraction of a minimum-curvature path A (not necessarily straight). It is desirable for the path A, which links landmarks L1 and L2 and has minimal curvature, to be fully defined inside the aneurysm lumen 38.
- the path A is used to define new cross-section images, which ensure that slicing of the aneurysm 26, leads to proper segmentation of the aneurysm wall 30 and to accurate rendering in 3D.
- the minimum-curvature path A is computed by initially extracting a shortest path between the two landmarks L1 and L2.
- This shortest path is illustratively obtained using Dijkstra's algorithm, an algorithm which solves shortest-path problems for directed graphs.
- a matrix of discrete point coordinates D p which correspond to the lowest-cost (i.e. shortest) path between the two landmarks L1 and L2, is then obtained in the Dijkstra metric.
- Fuzzylmage exp - lmage - mldp . ⁇ ⁇ 2 / k * Stdldp ⁇ ⁇ 2
- a distance-map is illustratively obtained using the fast-Marching algorithm based on the propagation of a wave front starting at landmark point L1.
- the front propagation is stopped when it reaches landmark point L2 and a distance map, which supplies each point in the image with the distance to the nearest obstacle point (i.e. boundary), is obtained.
- the minimum-curvature path A between L2 and L1 is computed, illustratively by back propagation from L2 to L1 using an optimization algorithm such as the gradient descent algorithm, in which a local minimum of a function is found by determining successive descent directions and steps from a starting point on the function.
- the minimum-curvature path A is then used to interpolate image slices defined by successive cross-sections along the path A. This will result in a new image space of interpolated cross-section images, on which segmentation of the aneurysm will subsequently be performed.
- a Frenet reference frame is illustratively defined on the path start point (L1 or L2).
- a Frenet reference frame is a local coordinate system, which can be calculated anywhere along a curve independently from the curve's parameterization and consists of the tangent vector to the curve, the normal vector that points to the centre of the curve and the binormal vector, which is a cross product of the tangent and normal vectors.
- the Frenet reference frame is recomputed and the changes in translation and rotation between the actual and precedent frame are evaluated.
- the precedent frame is then propagated to the actual position using small local rotations in order to obtain a torsion-free frame.
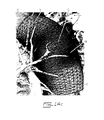
- Figure 5 shows an example of a cross-section image interpolated at a specific position on the path A.
- the interpolated cross-section images may be spaced along the path A either regularly or with a spacing function defined by the path's curvature. If a spacing function is used, more cross-sections are computed in the path sections having a high curvature, in order to better define the aneurysm, thus leading to more accurate segmentation.
- the number of angular slices 42 (N as ) is preferably set to a pre-determined value, which may be interactively modified by the user according to the shape of the aneurysm 26 to be segmented by editing the corresponding input field using the interaction device 24.
- the number of angular slices 42 is increased to create more cross-sections around the more irregular areas of the aneurysm 26, thereby better defining and more accurately representing it.
- N as is set to four (4), thereby defining angular slices 42 regularly spaced by a spacing step of 45 degrees.
- the corresponding angular positions ⁇ of the slices 42 are illustratively then 0, 45, 90, and 135 degrees.
- the user may further edit the configuration, position, and number of the angular slices 42 (or half-slices 42'), leading to angular slices 42 which are irregularly spaced.
- Such irregular spacing of the angular slices 42 may be desirable to better define the volume under inspection, especially when the latter is not perfectly circular, in which case more slices 42 should be introduced, as discussed herein above.
- the angular position ⁇ of a slice 42 may be edited with the user interaction device 24 by mouse click and drag, thus changing the position of the selected angular slice 42.
- the angular position ⁇ of a full slice 42 is moved while in Figure 7b only a half-slice 42' is edited by mouse drag.
- a selected slice 42 (or half-slice) can be removed and new slices (or half-slices) added by mouse click and drag.
- the latter may proceed with the segmentation (110) of the aneurysm boundaries.
- the user illustratively uses an active contour method to segment the outer aneurysm wall 30 in the angular slices 42 defined beforehand.
- This method is an iterative energy-minimizer method, which is based on the rigidity of the deformable contour.
- Livewire segmentation may also be used as a segmentation method. In this case, regions of interest are extracted based on Dijkstra's algorithm by calculation of a smallest cost path between selected landmarks.
- Another segmentation approach that can be used is active-shape contour, which specifies the shape of the segmented boundary curve for a particular type of objects a priori, based on statistics of a set of images and measurements of the relevant area.
- This enables natural inclusion of anatomical knowledge into the segmentation process.
- the borders in a particular anatomical scene are characterized by discrete samples at the contours, with these points being situated at selected landmarks characteristic for every image of the same scene, e.g. typical corners, bays or protrusions, holes, and blood vessel branching.
- the selection of a set of such landmarks is carried out in preparation of the segmentation procedure.
- the feature points in the typical image may form one or more closed borders surrounding anatomically meaningful means.
- the user interactively places several landmarks L3 ( Figure 8a ) near the aneurysm wall 30 by mouse click, thus generating automatic segmentation of the aneurysm boundary 46 ( Figure 8b ).
- the user may further control the quality of the segmentation on the axial view (112).
- the segmented boundary 46 may be locally edited to correct the position of some points as needed.
- the intersection between the observed axial plane and the segmented aneurysm boundaries 46 is represented by points 48 located on the respective angular slices 42.
- the user may push or pull a local region on all boundary curves 46 ( Figure 8b ) and thus edit the latter using specific mouse-defined functions.
- the boundary curves 46 will be automatically optimized by local active contour deformation.
- the segmentation process may be applied on images illustrated in Figure 7a and Figure 7b , such images being substantially perpendicular to the ones illustrated in Figure 8a and Figure 8b .
- the user similarly initializes the active contour interactively as a closed contour on several slices, the active contour being initialized either by placing successive markers, such as the landmarks mentioned herein above, or by positioning a parametrical model, such as a circle or ellipse, subsequently transformed and optimized in the image space.
- active-shape contour has been used as a segmentation approach, it will be apparent to one skilled in the art that other methods, such as parametric and geometric flexible contour algorithms, may be used.
- a 3D parametric surface representation 50 of the aneurysm wall 30 is automatically computed at 114 (although one skilled in the art would recognize that other visualization techniques are possible).
- This 3D surface mesh model 50 (illustrated in Figure 10 ) is then back-projected in the initial image space (i.e. the native DICOM images), resliced and represented in axial ( Figure 11a ), sagittal ( Figure 11 b) and coronal ( Figure 11c ) views. From the 3D wall model 50, it is then possible to proceed with quantification of the aneurysm parameters (116).
- the geometrical centreline (represented by the dashed line associated with reference B in Figure 3 ) of the aneurysm 26, which passes through the centre of the aneurysm 26 and whose points are all at equidistance from the aneurysm wall 30, is computed.
- This geometrical centreline B which differs from the minimum-curvature path A described herein above and used to define cross-sections, is used to compute the value of the maximum diameter D max of the aneurysm 26.
- the 3D wall model 50 is automatically resliced by cross-section planes defined along this new centreline B.
- the maximal distance between all points on the 3D wall model 50 is then computed in each centreline-defined cross-section, illustratively using the following pseudo-code:
- the final matrix aThrombusALLMaxDiameters holds the value of D max for each point of the 3D aneurysm wall model 50.
- other attributes or components of the aneurysm 26, such as the thickness of the thrombus 40, lumen 38, wall 30, calcifications and plaque can be measured in order to monitor changes over time.
- the 3D surface wall model 50 is augmented with a coding, such as colour-coding, shading, hatching, or the like.
- a coding such as colour-coding, shading, hatching, or the like.
- a combination of hatching, colour and letter coding (with B for blue, C for cyan, G for green, Y for yellow, O for orange and R for red) is shown in Figure 12a for illustrative purposes only, although a person of skill in the art will appreciate that any other suitable coding may be used to represent the measured parameters.
- the D max value is mapped on the 3D model 50 using a colour scale, for example one which varies from blue to red or the like to represent increasing values of D max .
- D max may be represented for each cross-section along the centreline B, as shown in Figure 12b .
- This representation advantageously shows the D max profile along the centreline B in a two-dimensional (2D) curve.
- the maximal value on the curve is therefore the sought global value of D max , which can be used as a diagnostic measure of the aneurysm 26.
- two values D max1 and D max2 of the maximal diameter are computed for each image set.
- the change in the maximal diameter of the aneurysm 26 over time is then computed as the difference between D max1 and D max2 .
- the results are stored in the database 12 for subsequent review. This allows patient monitoring and follow up by enabling the study of the expansion rate of the D max parameter (and similarly other attributes of the aneurysm 26 mentioned herein above) in the long run.
- the present invention can be used for a plurality of applications.
- the segmentation method illustratively allows to distinguish the volume of the false thrombus 52 ( Figure 13a ), i.e. the abnormal channel within the wall of the aorta 28, from the volume of the pathological components 54 and 56 ( Figure 13b ) of the aorta lumen (reference 38 in Figure 3 ), which are due to aortic dissection, a tear in the wall of the aorta 28 that causes blood to flow between the layers of the aortic wall and to force the layers apart.
- the aorta 28 is illustratively automatically segmented from the aortic arch to the iliac bifurcation (both not shown).
- the segmentation process described herein above can be applied to anatomical structures other than abdominal aortic aneurysms, such as thoracic aortic aneurysms for example. This is illustrated in Figure 14a , which, in the case of a thoracic aortic aneurysm, shows the segmentation of the aorta lumen 38.
- Figure 14b and Figure 14c further show the segmentation of the thrombus (reference 40 in Figure 3 ) and the mapping of the D max value on the 3D model (reference 50 in Figure 10 ) using coding, illustratively hatching, although it will be apparent to a person skilled in the art that a colour scale or the like could be used without departing from the scope of the present invention, as discussed herein above with reference to Figure 12a and Figure 12b .
- Figure 14d and Figure 14e illustrate the segmentation of the thrombus 40 and the mapping of the thrombus thickness on the 3D model 50 using a suitable coding.
- Figure 15 illustrates the application of the method of the present invention for segmentation of a cat's spinal cord (not shown).
- Registration thus transforms the images geometrically, in order to compensate for the distortions and fulfil the consistency condition.
- one of the images which may be considered undistorted, is taken as the reference (base) image.
- the process of registration illustratively uses a geometrical transformation controlled by a parameter vector that transforms one image into a transformed image, which is then laid on (i.e. spatially identified with) the other (base) image so that both images can be compared.
- a degree of accuracy and precision is required when registering medical images as imprecise registration leads to a loss of resolution or to artefacts in the combined (fused) images, viihile unreliable and possibly false registration may cause misinterpretation of the fused image (or of the information obtained by fusion), with possibly fatal consequences.
- each image set (204). This can be done, for example as illustrated in Figure 17 (for a single image set), by a user defining (preferably in MPR view) two landmarks, R left and R right , in the left and right renal arteries 32 respectively and two other landmarks, IL left and IL right , in the left and right iliac arteries 34 respectively, after the bifurcation 36 of the aorta 28.
- vascular centreline-paths are extracted from the landmarks.
- a first vessel centreline-path, the renal path C R is computed from R right to R left while a second vessel centreline-path, the iliac path C IL , is computed from IL right to IL left .
- these centreline paths C R and C IL are obtained illustratively using the Dijkstra shortest path algorithm on the images smoothed by a Gaussian filter.
- the vessel curves thus obtained are represented as ordered discrete points defined in the image coordinate system.
- more than two such vessel curves may be extracted from the initialized landmarks R right, R left , IL right and IL left , resulting in more accurate registration of the image sets IS 1 and IS 2 .
- two additional centreline paths may be computed from R left to IL right and R right to IL left respectively.
- the similarity criteria between the renal paths C R and iliac paths C IL extracted from each image set IS 1 and IS 2 are then identified. Similarity criteria, which serve to evaluate the resemblance of two (and possibly more) images or their areas, must be evaluated when matching two or more images via geometrical transformations, as is the case of image registration. For this purpose, it is desirable to use a method independent of location, rotation and scale.
- the curve signature of each centreline path C R and C IL can thus be represented by its local tangent, curvature and torsion.
- the curve arc-length is illustratively normalized and the curve signature is computed, followed by signature correlation between the two renal paths C R and the two iliac paths C IL . Point to point association is then achieved by maximum correlation detection, thus leading to 3D registration between paired points.
- an affine transformation matrix with three (3) rotation and three (3) translation parameters is illustratively obtained. These registration parameters are stored in the database 12 at 206 and the transformation is applied to one of the image sets, i.e. either IS 1 or IS 2 , in order to co-register it with the other image set.
- the above registration process may be further improved using an image-based processes such as mutual information algorithms.
- Mutual information which proves to be a good criterion of similarity, is defined as the difference between the sum of information in individual images and the joint information in the union.
- Use of the mutual information algorithm results in masking the image sets by a weighted function that enables an image volume element (voxel) near the centreline and disables the others, thus showing how much the a priori information content of one image is changed by obtaining the knowledge of the other image.
- the segmentation process (208) may proceed as described above, with a minimum-curvature path A being extracted in a similar manner as in 106.
- the segmentation algorithm will use the pair of co-registered image sets together to ensure that the extracted minimum-curvature path is defined inside both lumens of the two superimposed image sets.
- the results obtained with co-registered images are more efficient since the real changes in volume, surface, and thickness may be illustratively computed and mapped in 3D, as the two image sets IS 1 and IS 2 are superimposed in the same geometrical reference frame.
- local and global changes in geometry and topology of the aneurysm may be obtained for the two image sets.
- contrast agents are not used during all clinical imaging exams, as it is preferable to avoid their use in some cases, such as when the patient under observation is suffering from renal failure. If no contrast agent has been used, although the lumen 38 ( Figure 3 ) will potentially have the same gray level distribution as the thrombus 40, it is still possible to quantify the maximum diameter as well as the aneurysm volume using the method described herein above. More importantly, the diagnostic tool of the present invention achieves fast and accurate results with a high level of reproducibility. The segmentation may therefore be performed in a standardized manner by technicians, thus leading to time savings for doctors and other clinicians who only need to be involved in the subsequent review processes.
Landscapes
- Engineering & Computer Science (AREA)
- Health & Medical Sciences (AREA)
- Life Sciences & Earth Sciences (AREA)
- Medical Informatics (AREA)
- Physics & Mathematics (AREA)
- Computer Vision & Pattern Recognition (AREA)
- Molecular Biology (AREA)
- General Health & Medical Sciences (AREA)
- Nuclear Medicine, Radiotherapy & Molecular Imaging (AREA)
- Optics & Photonics (AREA)
- Pathology (AREA)
- Radiology & Medical Imaging (AREA)
- Biomedical Technology (AREA)
- Heart & Thoracic Surgery (AREA)
- Biophysics (AREA)
- Surgery (AREA)
- Animal Behavior & Ethology (AREA)
- High Energy & Nuclear Physics (AREA)
- Public Health (AREA)
- Veterinary Medicine (AREA)
- Theoretical Computer Science (AREA)
- General Physics & Mathematics (AREA)
- Software Systems (AREA)
- Vascular Medicine (AREA)
- Dentistry (AREA)
- Oral & Maxillofacial Surgery (AREA)
- Apparatus For Radiation Diagnosis (AREA)
- Magnetic Resonance Imaging Apparatus (AREA)
Description
- The present invention relates to a method for tracking 3D anatomical and pathological changes in tubular-shaped anatomical structures.
- Medical imaging is increasingly used to study the changes in size and shape of anatomical structures over time. As these changes often serve as indicators of the presence of a disease, extraction of quantitative information from such medical images has many applications in clinical diagnosis.
- Conventional practice is to outline anatomical structures by image segmentation, a fundamental step of image analysis, during which anatomical and pathological structure information is typically extracted from patient image data. Image segmentation allows various relevant anatomical structures to be distinguished, which often have similar intensity values on the image and thus overlap or are interrelated. Performing the segmentation directly in the three-dimensional (3D) space brings more consistency in the results. The method enables clinicians to emphasize and extract various features in the digital images by partitioning them into multiple regions, thereby delimiting image areas representing objects of interest, such as organs, bones, and different tissue types. Although different segmentation approaches have been applied in different situations, the common principle lies in the iterative process, which progressively improves the resulting segmentation so that it gradually corresponds better to a certain a priori image interpretation. Still, currently practiced methods take a significant amount of time to extract information from the medical images, and as a result do not achieve optimal results in a fast and efficient manner.
- Medical imaging has proven particularly effective in the diagnosis of pathologies such as aortic aneurysms, a fairly common disorder characterized by a localized dilation greater than 1.5 times the typical diameter of the aorta. As rupture of the aneurysm, which is the main complication of the disorder, typically results in death due to internal bleeding, accurate diagnosis and control of the aneurysm are critical. The main predictors of rupture risk are the maximal diameter (Dmax) and the expansion rate of the aneurysm. It has been suggested that a Dmax value greater than 5.5 cm in men and 4.5 to 5.0 cm in women, as well as an expansion rate greater than 1 cm per year are indications for a procedure. Study of these parameters is therefore crucial in determining when a surgical intervention is warranted to prevent the aneurysm from rupturing or causing other complications in the future.
- The prior art teaches various methods for computing the value of Dmax, leading to different inconsistent definitions of the Dmax parameter. In addition, current measurement methods typically generate intra- and inter-observer variability as well as result in systematic overestimation of the Dmax value as they use either rough estimation based on the appearance of the aneurysm or cumbersome and time-consuming manual outlining of aneurysm anatomy or pathology on sequences of patient images. Also, as current segmentation techniques use contrast agents that only enable visualization of the aneurysm lumen and not visualization of the thrombus, the latter cannot be segmented using these methods, although it is critical in determining the value of Dmax. Current segmentation techniques further make it difficult to control the quality of the segmentation as well as correct any mistakes generated by the software.
- Additionally,
WO 2006/085155 discloses a method for imaging a volume of interest, such as an organ or tumour or the like, where the data slices contain a contour line which when stacked together define the volume and from which a plurality of curves are calculated. The curves are arranged to bound the volume. - What is therefore needed, and an object of the present invention, is a standardized method for tracking 3D changes in an anatomical structure, such as an aortic aneurysm, based on 3D images. In particular, a clinical diagnostic tool, which enables segmentation of medical images in 3D to be performed and accurate information related to the anatomical structure under observation obtained in a simple, fast and reproducible manner, would be useful.
- In order to address the above and other drawbacks, there is disclosed a method for visualizing an anatomy of a region of interest of a tubular-shaped organ on a display. The method comprises acquiring an image of the anatomy of the tubular shaped organ in the region of interest at a first point in time, extracting a plurality of discrete points from the image defining a minimum-curvature path within the tubular-shaped organ, interpolating a set of cross-sectional images along planes substantially perpendicular to a tangent vector of the minimum-curvature path at each of the plurality of discrete points, delimiting a segmented area corresponding to the region of interest of the tubular-shaped organ in each of the set of cross-sectional images, rendering a three-dimensional surface representation of the region of interest from the delimited set of cross-sectional images and displaying the rendered three-dimensional surface representation on the display.
- Additionally, there is disclosed a system for visualizing the anatomy of a region of interest of a tubular-shaped organ. The system comprises a scanning device for acquiring an image of the region of interest of the tubular shaped organ, a database connected to the scanning device for storing the acquired image, and a workstation connected to the database for retrieving the stored image, the workstation comprising a display, a user interface, and an image processor. Responsive to the commands from the user interface, the image processor extracts from the image a plurality of discrete points defining a minimum-curvature path within the region of interest of the tubular-shaped organ, interpolates a set of cross-sectional images along planes substantially perpendicular to a tangent vector of the minimum-curvature path at each of the plurality of discrete points, delimits a segmented area corresponding to the region of interest of the tubular-shaped organ in each of the set of cross-sectional images, computes a three-dimensional surface representation of the region of interest from the delimited set of cross-sectional images and displays the computed three-dimensional surface representation on the display.
- Furthermore, there is disclosed a computer program storage medium readable by a computing system and encoding a computer program of instructions for executing a computer process for visualizing the anatomy of a region of interest of a tubular-shaped organ. The computer process comprises acquiring an image of the anatomy of the tubular shaped organ in the region of interest, extracting from the image a plurality of discrete points defining a minimum-curvature path within the tubular-shaped organ, interpolating a set of cross-sectional images along planes substantially perpendicular to a tangent vector of the minimum-curvature path at each of the discrete points, delimiting a segmented area corresponding to the region of interest of the tubular-shaped organ in each of the set of cross-sectional images, computing a three-dimensional surface representation of the region of interest from the delimited set of cross-sectional images, and displaying the rendered three-dimensional surface representation on the display.
- Other objects, advantages and features of the present invention will become more apparent upon reading of the following non-restrictive description of specific embodiments thereof, given by way of example only with reference to the accompanying drawings.
- In the appended drawings:
-
Figure 1 is a schematic diagram of an image analysis system in accordance with an illustrative embodiment of the present invention; -
Figure 2 is a flow chart of an image analysis method in accordance with an illustrative embodiment of the present invention; -
Figure 3 is a diagram of an abdominal aortic aneurysm in accordance with an illustrative embodiment of the present invention; -
Figures 4a and4b show cross-section images of the abdominal aortic aneurysm ofFigure 3 during landmark initialization in accordance with an illustrative embodiment of the present invention; -
Figure 5 shows a cross-section image of an abdominal aortic aneurysm interpolated along a minimum-curvature path in accordance with an illustrative embodiment of the present invention; -
Figures 6a and 6b show a representation of cross-section images used for segmentation of an abdominal aortic aneurysm in accordance with an illustrative embodiment of the present invention; -
Figures 7a and 7b show the cross-section images ofFigures 6a and 6b during positioning of angular slices in accordance with an illustrative embodiment of the present invention; -
Figures 8a and 8b show cross-section images of an abdominal aortic aneurysm during active-shape contour segmentation in accordance with an illustrative embodiment of the present invention; -
Figures 9a and 9b show cross-section images of an abdominal aortic aneurysm during segmentation quality control in accordance with an illustrative embodiment of the present invention; -
Figure 10 is a schematic diagram of a 3D aneurysm wall model in accordance with an illustrative embodiment of the present invention; -
Figure 11 is a representation of the 3D aneurysm wall model ofFigure 10 in axial, sagittal and coronal views in accordance with an illustrative embodiment of the present invention; -
Figures 12a and12b show two representations of the maximum diameter of an abdominal aortic aneurysm in accordance with an illustrative embodiment of the present invention; -
Figure 13a shows a segmentation of the false thrombus an aorta in accordance with an illustrative embodiment of the present invention; -
Figure 13b shows a segmentation of an aorta separated into two pathological components resulting from aortic dissection in accordance with an illustrative embodiment of the present invention; -
Figure 14a shows a segmentation of the lumen of a thoracic aortic aneurysm in accordance with an illustrative embodiment of the present invention; -
Figures 14b and14c show a segmentation of the thrombus and a representation on a 3D wall model of the maximum diameter of a thoracic aortic aneurysm in accordance with an illustrative embodiment of the present invention; -
Figure 14d and14e show a representation on a 3D wall model of the thrombus thickness of a thoracic aortic aneurysm in accordance with an illustrative embodiment of the present invention; -
Figure 15 shows a segmentation of a cat's spinal cord in accordance with an illustrative embodiment of the present invention; -
Figure 16 is a flow chart of an image registration method in accordance with an illustrative embodiment of the present invention; and -
Figure 17 is a schematic of an abdominal aortic aneurysm during landmark initialization for image registration in accordance with an illustrative embodiment of the present invention. - The present invention is illustrated in further details by the following nonlimiting examples.
- Referring to
Figure 1 , and in accordance with an illustrative embodiment of the present invention, a system for processing and analyzing medical images, generally referred to using thereference numeral 10, will now be described. Thesystem 10 comprises adatabase 12 for storing patient images and aworkstation 14 for accessing the stored images through acommunications network 16, such as a Local Area Network (LAN). Theworkstation 14 comprises aprocessor 18, on which animaging software module 20 responsible for processing images retrieved from thedatabase 12 is installed. Theworkstation 14 further comprises adisplay 22 and a user interface 24 (e.g. a mouse and keyboard), which enable users to interact with theimaging software 20 by displaying and manipulating image data in response to input commands. Thedisplay 22 and theuser interface 24 thus enable users to visualize and supervise the image analysis process performed by theimaging software 20. - Referring now to
Figure 2 in addition toFigure 1 , a medicalimage analysis method 100 implemented by theimaging software 20 will now be described. Clinical image data related to a patient under observation is typically acquired by a scanner (not shown) of a standard medical imaging modality such as Computed Tomography (CT) or Magnetic Resonance Imaging (MRI) angiography. Angiography has the advantage of being an efficient and relatively non-invasive diagnostic tool. Illustratively, in CT angiography, an X-ray picture is taken to visualize the inner opening of blood filled structures, including arteries, veins and the heart chambers. Contrast agents may be used to improve the visibility of the patient's internal bodily structures on the angiography image, for instance by enabling to differentiate intensity values of the vessel interior and wall. Thin axial image slices of the area under observation are typically obtained during the procedure and images in the remaining two spatial planes (coronal and sagittal) are calculated by a computer. After their acquisition, the patient images are stored as image data sets into thedatabase 12, illustratively in the Digital Image Communications in Medicine (DICOM) format, for subsequent retrieval and analysis. DICOM format is of particular interest in medical applications, as it enables easy standardised data communication between systems produced by different manufacturers and using different internal formats, thus allowing effective connection of different components of an imaging department. Since different clinical imaging exams may be performed at different times to study the progression of a patient's disorder, a resulting plurality of image data sets corresponding to each imaging exam may be stored in thedatabase 12 and each image set is then treated separately by theimaging software 20. - Referring now to
Figure 3 andFigures 4a and4b in addition toFigures 1 and2 , a user wishing to analyze patient images illustratively accesses theworkstation 14, and via the user interface 24 (which illustratively comprises, in addition to thedisplay 22, a pointing device such as a mouse or the like and an appropriate operating system software), imports the image set(s) related to the patient under observation. Theimaging software 20 is then invoked by the user in order to open the imported images (102), which are shown on thedisplay 22 so that the user may proceed with the segmentation process at 104. For sake of illustration, the anatomical structure under observation is an abdominalaortic aneurysm 26, although it would be understood by one skilled in the art that themethod 100 may be applied to other types of aneurysms (e.g. thoracic, intracranial), as well as other tubular-shaped organs, such as the colon, trachea, and spine. Themethod 100 may also have other applications such as analysis of soft tissues, of atheromatous plaque in carotid arteries, and follow-up of stent grafts. - As illustrated in
Figure 3 , an abdominalaortic aneurysm 26 is a disorder of theaorta 28 characterized by a localized dilation of thearterial wall 30. An aortic aneurysm is typically located below therenal arteries 32 and above theiliac arteries 34 and the aorta-iliac bifurcation 36. The inner space of the aorta is referred to as thelumen 38, as is the case for any other vessel in the body, while the thickness of the aorta wall in the region of the aneurysm is referred to as thethrombus 40. - Still referring to
Figure 3 ,Figure 4a andFigure 4b in addition toFigure 2 , to visualize theaneurysm 26 and initiate the segmentation process of theaneurysm wall 30, the user illustratively defines two displaced landmarks L1 and L2 in characteristic and easily identifiable regions of thelumen 38 and towards either ends of the portion of thelumen 38 to be visualised. This is done via theuser interface 24 by moving a cursor in one or other of the displayed axial, coronal and sagittal image slices, as illustrated inFigure 3 . Illustratively, a first landmark L1 is placed before the aneurysm 26 (Figure 4a ) and a second landmark L2 after the aneurysm 26 (Figure 4b ). The user then validates the positions of the landmarks, for example by simple mouse click. Landmark initialization is illustratively done in Multi-Planar Reformatting (MPR) view, a reformatting technique which passes a plane through an image set, thus enabling users to view the volume under inspection along a different direction than that of the original image set. In effect, one can view the image data from different viewpoints without having to rescan the patient. - Still referring to
Figure 3 ,Figure 4a andFigure 4b in addition toFigure 2 , the landmarks L1 and L2 thus defined are used at 106 as start and end points for automatic extraction of a minimum-curvature path A (not necessarily straight). It is desirable for the path A, which links landmarks L1 and L2 and has minimal curvature, to be fully defined inside theaneurysm lumen 38. The path A is used to define new cross-section images, which ensure that slicing of theaneurysm 26, leads to proper segmentation of theaneurysm wall 30 and to accurate rendering in 3D. Indeed, as seen onFigure 3 , if cross-section images were to be defined along the geometric centreline B of theaneurysm lumen 38 for example, two successive cross-section images taken in areas where thelumen 38 is more irregular might intersect at point B1 on one side of the aneurysmouter wall 30. On the opposite side, each cross-section image would intersect theouter wall 30 at points B2 and B3 but the spacing between these points would be large, leading to a loss in precision, as no additional points would have been obtained to more accurately define the region of theouter wall 30 between B2 and B3. Taking cross-section images along the minimum-curvature path A therefore ensures that none of the cross-section images intersect, resulting in a more precise definition of the contour of theaneurysm 26. Illustratively, the minimum-curvature path A is computed by initially extracting a shortest path between the two landmarks L1 and L2. This shortest path is illustratively obtained using Dijkstra's algorithm, an algorithm which solves shortest-path problems for directed graphs. A matrix of discrete point coordinates Dp, which correspond to the lowest-cost (i.e. shortest) path between the two landmarks L1 and L2, is then obtained in the Dijkstra metric. The gray-level values Idp (i.e. the brightness) of each discrete point Dp are further extracted as Idp = Image (Dp), using the 3D image (Image) reconstructed from the acquired slices. These values are then used to compute a Fuzzy representation Fuzzylmage of the native (i.e. original) images based on a Gaussian distribution centred at the mean value of the gray-level values Idp as follows:
- with: Image = normalized 3D image
- mldp = mean value of Idp
- Stdldp = standard deviation of Idp
- k = an integer that controls the width of the Gaussian distribution
- Once the Fuzzy images have been computed, a distance-map is illustratively obtained using the fast-Marching algorithm based on the propagation of a wave front starting at landmark point L1. The front propagation is stopped when it reaches landmark point L2 and a distance map, which supplies each point in the image with the distance to the nearest obstacle point (i.e. boundary), is obtained. From this distance map, the minimum-curvature path A between L2 and L1 is computed, illustratively by back propagation from L2 to L1 using an optimization algorithm such as the gradient descent algorithm, in which a local minimum of a function is found by determining successive descent directions and steps from a starting point on the function.
- Referring now to
Figure 5 in addition toFigure 4a ,Figure 4b andFigure 2 , at 108, the minimum-curvature path A is then used to interpolate image slices defined by successive cross-sections along the path A. This will result in a new image space of interpolated cross-section images, on which segmentation of the aneurysm will subsequently be performed. For this purpose, a Frenet reference frame is illustratively defined on the path start point (L1 or L2). A Frenet reference frame is a local coordinate system, which can be calculated anywhere along a curve independently from the curve's parameterization and consists of the tangent vector to the curve, the normal vector that points to the centre of the curve and the binormal vector, which is a cross product of the tangent and normal vectors. For each successive discrete point on the path A, the Frenet reference frame is recomputed and the changes in translation and rotation between the actual and precedent frame are evaluated. The precedent frame is then propagated to the actual position using small local rotations in order to obtain a torsion-free frame.Figure 5 shows an example of a cross-section image interpolated at a specific position on the path A. The interpolated cross-section images may be spaced along the path A either regularly or with a spacing function defined by the path's curvature. If a spacing function is used, more cross-sections are computed in the path sections having a high curvature, in order to better define the aneurysm, thus leading to more accurate segmentation. - Referring now to
Figure 6a, Figure 6b, Figure 7a and Figure 7b in addition toFigure 1 ,Figure 2 andFigure 3 , using the new image space interpolation, two representations of the cross-section images are illustratively used at 110 to segment the aneurysm wall 30: an axial representation (Figure 6a ) and an image interpolation along the minimum-curvature path A at a specific angular position θ around it (Figure 6b ). Definingangular slices 42 at an angular position θ allows the user to segment theaneurysm wall 30 at a variety of angles θ. Proper selection of the number ofslices 42 ensures that theslices 42 pass through certainty areas, i.e. areas of theaneurysm 26 where image information is known, and avoid risk areas (e.g. noise and artifacts) during the segmentation process. The number of angular slices 42 (Nas) is preferably set to a pre-determined value, which may be interactively modified by the user according to the shape of theaneurysm 26 to be segmented by editing the corresponding input field using theinteraction device 24. Nas is illustratively set by default to four (4)angular slices 42 foraneurysms 26 of generally circular shape but it may be increased foraneurysms 26 with a less regular shape, e.g. when theaneurysm 26 is very off-centre. In the latter case, the number ofangular slices 42 is increased to create more cross-sections around the more irregular areas of theaneurysm 26, thereby better defining and more accurately representing it. The value of Nas defines the spacing step (in degrees) for the angular positioning θ of theslices 42. This spacing step may be computed as follows:
- As seen in
Figure 6a for example, Nas is set to four (4), thereby definingangular slices 42 regularly spaced by a spacing step of 45 degrees. The corresponding angular positions θ of theslices 42 are illustratively then 0, 45, 90, and 135 degrees. The user may further edit the configuration, position, and number of the angular slices 42 (or half-slices 42'), leading toangular slices 42 which are irregularly spaced. Such irregular spacing of theangular slices 42 may be desirable to better define the volume under inspection, especially when the latter is not perfectly circular, in which case more slices 42 should be introduced, as discussed herein above. As shown inFigure 7a and Figure 7b , the angular position θ of aslice 42 may be edited with theuser interaction device 24 by mouse click and drag, thus changing the position of the selectedangular slice 42. InFigure 7a , in order to avoid anartefact 44, the angular position θ of afull slice 42 is moved while inFigure 7b only a half-slice 42' is edited by mouse drag. Similarly, a selected slice 42 (or half-slice) can be removed and new slices (or half-slices) added by mouse click and drag. - Now referring to
Figure 8a, Figure 8b ,Figure 9a and Figure 9b in addition toFigure 2 ,Figure 3 andFigure 7 , once the configuration of theslices 42 has been validated by the user, the latter may proceed with the segmentation (110) of the aneurysm boundaries. For this purpose, the user illustratively uses an active contour method to segment theouter aneurysm wall 30 in theangular slices 42 defined beforehand. This method is an iterative energy-minimizer method, which is based on the rigidity of the deformable contour. Livewire segmentation may also be used as a segmentation method. In this case, regions of interest are extracted based on Dijkstra's algorithm by calculation of a smallest cost path between selected landmarks. Another segmentation approach that can be used is active-shape contour, which specifies the shape of the segmented boundary curve for a particular type of objects a priori, based on statistics of a set of images and measurements of the relevant area. This enables natural inclusion of anatomical knowledge into the segmentation process. Indeed, the borders in a particular anatomical scene are characterized by discrete samples at the contours, with these points being situated at selected landmarks characteristic for every image of the same scene, e.g. typical corners, bays or protrusions, holes, and blood vessel branching. The selection of a set of such landmarks is carried out in preparation of the segmentation procedure. Depending on the image character, the feature points in the typical image may form one or more closed borders surrounding anatomically meaningful means. - As illustrated in
Figure 8a and Figure 8b , using active-shape contour segmentation, the user interactively places several landmarks L3 (Figure 8a ) near theaneurysm wall 30 by mouse click, thus generating automatic segmentation of the aneurysm boundary 46 (Figure 8b ). The user may further control the quality of the segmentation on the axial view (112). Thesegmented boundary 46 may be locally edited to correct the position of some points as needed. As illustrated inFigure 9a , the intersection between the observed axial plane and thesegmented aneurysm boundaries 46 is represented bypoints 48 located on the respective angular slices 42. The user may push or pull a local region on all boundary curves 46 (Figure 8b ) and thus edit the latter using specific mouse-defined functions. After manual deformation, the boundary curves 46 will be automatically optimized by local active contour deformation. Alternatively, the segmentation process may be applied on images illustrated inFigure 7a and Figure 7b , such images being substantially perpendicular to the ones illustrated inFigure 8a and Figure 8b . In this case, the user similarly initializes the active contour interactively as a closed contour on several slices, the active contour being initialized either by placing successive markers, such as the landmarks mentioned herein above, or by positioning a parametrical model, such as a circle or ellipse, subsequently transformed and optimized in the image space. Still, although active-shape contour has been used as a segmentation approach, it will be apparent to one skilled in the art that other methods, such as parametric and geometric flexible contour algorithms, may be used. - Referring now to
Figure 10 ,Figure 11 a, Figure 11 b andFigure 11 a in addition toFigure 2 andFigure 3 , following quality control and correction at 112, a 3Dparametric surface representation 50 of theaneurysm wall 30 is automatically computed at 114 (although one skilled in the art would recognize that other visualization techniques are possible). This 3D surface mesh model 50 (illustrated inFigure 10 ) is then back-projected in the initial image space (i.e. the native DICOM images), resliced and represented in axial (Figure 11a ), sagittal (Figure 11 b) and coronal (Figure 11c ) views. From the3D wall model 50, it is then possible to proceed with quantification of the aneurysm parameters (116). At this point, the geometrical centreline (represented by the dashed line associated with reference B inFigure 3 ) of theaneurysm 26, which passes through the centre of theaneurysm 26 and whose points are all at equidistance from theaneurysm wall 30, is computed. This geometrical centreline B, which differs from the minimum-curvature path A described herein above and used to define cross-sections, is used to compute the value of the maximum diameter Dmax of theaneurysm 26. Indeed, upon extraction of the centreline B, the3D wall model 50 is automatically resliced by cross-section planes defined along this new centreline B. The maximal distance between all points on the3D wall model 50 is then computed in each centreline-defined cross-section, illustratively using the following pseudo-code:
All_Pts = matrix(M,N,3)
 for j=1, N do begin
 X = All_Pts(*,j,1 )
 Y = All_Pts(*,j,2)
 Z = All_Pts(*,j,3)
 for i=1, M do begin
        diam = max(sqrt(((x[i]-x))^2 +((y[i]-y))^2 +((z[i]-z))^2))
        aThrombusALLMaxDiameters[j,i] = diam
 endfor
 endfor
 with All_Pts = matrix of all data points on the parametric 3D model;
 diam = maximum diameter mapped at a given point of the 3D model.
Claims (12)
- A method (100) for visualizing an anatomy of a region of interest of a tubular-shaped organ on a display (22), the method comprising:acquiring (102) a three-dimensional image of the anatomy of the tubular shaped organ in the region of interest at a first point in time, and characterized by:extracting (106) a plurality of discrete points from said three-dimensional image defining a minimum-curvature path within the tubular-shaped organ;interpolating (108) a set of cross-sectional images along planes substantially perpendicular to a tangent vector of said minimum-curvature path at each of said plurality of discrete points;delimiting a segmented area corresponding to the region of interest of the tubular-shaped organ in each of said set of cross-sectional images;rendering (114) a three-dimensional surface representation of the region of interest from said delimited set of cross-sectional images; anddisplaying said rendered three-dimensional surface representation on the display.
- The method of claim 1, characterized in that said three-dimensional image is comprised of a plurality of image slices, preferably further comprising positioning at least two reference markers in said image slices, wherein said reference markers preferably comprise a first reference marker and a second reference marker, wherein said minimum-curvature path connects said reference markers, and wherein said positioning reference markers in said image slices is preferably performed in Multi-Planar Reformatting (MPR) view.
- The method of claim 1, characterized in that the tubular-shaped organ has a longitudinal axis and further wherein said acquiring successive image slices comprises taking each one of said image slices along a plane substantially perpendicular to said longitudinal axis.
- The method of claim 1, characterized in that said acquiring successive image slices comprises using an image modality selected from the group consisting of Computed Tomography angiography and Magnetic Resonance Imaging angiography.
- The method of claim 1, characterized in that said extracting a plurality of discrete points comprises:obtaining a plurality of discrete point coordinates defining a lowest-cost path between said reference markers using Dijkstra's algorithm;deriving gray-level values of each one of said plurality of discrete point coordinates;computing from said derived gray-level values fuzzy image representations of said acquired image slices;computing a distance map representative of a distance from a discrete point in each one of said fuzzy image representations to an adjacent obstacle point in said one fuzzy image representation; andcomputing said minimum-curvature path from said distance map, wherein said minimum-curvature path is preferably computed from said distance map by applying back propagation from said second reference marker to said first reference marker using an optimization algorithm, preferably a gradient descent algorithm;wherein said computing a distance map preferably comprises applying a fast-marching algorithm based on propagation of a wave front from said first reference marker to said second reference marker.
- The method of claim 1, characterized in that said interpolating cross-sectional images comprises defining a Frenet reference frame at a first one of said reference markers, and, for a successive one of said discrete points along said minimum-curvature path, recomputing said Frenet reference frame and propagating said recomputed Frenet reference frame to said successive one of said discrete points.
- The method of claim 1, characterized in that said segmented area is delimited in an axial representation and in an angular representation of each of said cross-sectional images, wherein said angular representation preferably comprises a plurality of angular slices of each of said cross-sectional images acquired at a plurality of angles around said minimum-curvature path, and further wherein a positioning and a number of said angular slices is preferably selected to accurately define the region of interest.
- The method of claim 1, characterized in that said delimiting a segmented area is performed using a method selected from a group consisting of active-shape contour segmentation, parametric flexible contour segmentation, geometric flexible contour segmentation, and livewire segmentation.
- The method of claim 1, further comprising quantifying an attribute of the region of interest from said three-dimensional surface representation, preferably wherein said attribute of the region of interest is selected from a group consisting of maximal diameter and volume, and augmenting said three-dimensional surface representation with a coding representative of said attribute, preferably wherein said coding is selected from a group consisting of colour, shading and hatching or combinations thereof and wherein quantifying said maximal diameter of the region of interest preferably comprises:computing a geometrical centreline of the region of interest;slicing said three-dimensional surface representation by cross-section planes defined along said geometrical centreline to generate a plurality of centreline-defined cross-sections; andcomputing a maximal distance between discrete points in each one of said plurality of centreline-defined cross-sections.
- The method of claim 9, characterized in that said quantifying an attribute of the region of interest comprises:acquiring a second three-dimensional image of the anatomy of the tubular shaped organ in the region of interest at a second point in time;extracting a second plurality of discrete points from said second three-dimensional image, said second points defining a minimum-curvature path within the tubular-shaped organ;interpolating a second set of cross-sectional images along planes substantially perpendicular to a tangent vector of said minimum-curvature path at each of said second plurality of discrete points;delimiting a segmented area corresponding to the region of interest of the tubular-shaped organ in each of said second set of cross-sectional images;rendering a second three-dimensional surface representation of the region of interest from said delimited second set of cross-sectional images;calculating a difference between said three-dimensional surface representation and said second three-dimensional surface representation; andaugmenting said three-dimensional surface representation with a coding representative of said difference.
- A system for visualizing the anatomy of a region of interest of a tubular-shaped organ, the system comprising:a scanning device for acquiring a three-dimensional image of the region of interest of the tubular shaped organ;a database (12) connected to said scanning device for storing said acquired three-dimensional image; anda workstation (14) connected to said database for retrieving said stored image, said workstation comprising:a display (22);a user interface (24); andan image processor (18, 20);characterized in that responsive to said commands from said user interface, said image processor extracts from said image a plurality of discrete points defining a minimum-curvature path within the region of interest of the tubular-shaped organ, interpolates a set of cross-sectional images along planes substantially perpendicular to a tangent vector of said minimum-curvature path at each of said plurality of discrete points, delimits a segmented area corresponding to the region of interest of the tubular-shaped organ in each of said set of cross-sectional images, computes a three-dimensional surface representation of the region of interest from said delimited set of cross-sectional images and displays said computed three-dimensional surface representation on said display.
- A computer program storage medium readable by a computing system and encoding a computer program of instructions for executing a computer process for visualizing the anatomy of a region of interest of a tubular-shaped organ, the computer process comprising:acquiring a three-dimensional image of the anatomy of the tubular shaped organ in the region of interest, and characterized by:extracting from said three-dimensional image a plurality of discrete points defining a minimum-curvature path within the tubular-shaped organ;interpolating a set of cross-sectional images along planes substantially perpendicular to a tangent vector of said minimum-curvature path at each of said discrete points;delimiting a segmented area corresponding to the region of interest of the tubular-shaped organ in each of said set of cross-sectional images;computing a three-dimensional surface representation of the region of interest from said delimited set of cross-sectional images; anddisplaying said rendered three-dimensional surface representation on the display.
Applications Claiming Priority (2)
| Application Number | Priority Date | Filing Date | Title |
|---|---|---|---|
| US93807807P | 2007-05-15 | 2007-05-15 | |
| PCT/CA2008/000933 WO2008138140A1 (en) | 2007-05-15 | 2008-05-15 | A method for tracking 3d anatomical and pathological changes in tubular-shaped anatomical structures |
Publications (3)
| Publication Number | Publication Date |
|---|---|
| EP2157905A1 EP2157905A1 (en) | 2010-03-03 |
| EP2157905A4 EP2157905A4 (en) | 2011-12-28 |
| EP2157905B1 true EP2157905B1 (en) | 2013-03-27 |
Family
ID=40001647
Family Applications (1)
| Application Number | Title | Priority Date | Filing Date |
|---|---|---|---|
| EP08757093A Not-in-force EP2157905B1 (en) | 2007-05-15 | 2008-05-15 | A method for tracking 3d anatomical and pathological changes in tubular-shaped anatomical structures |
Country Status (4)
| Country | Link |
|---|---|
| US (1) | US20100309198A1 (en) |
| EP (1) | EP2157905B1 (en) |
| CA (1) | CA2723670A1 (en) |
| WO (1) | WO2008138140A1 (en) |
Families Citing this family (32)
| Publication number | Priority date | Publication date | Assignee | Title |
|---|---|---|---|---|
| WO2007036857A2 (en) * | 2005-09-29 | 2007-04-05 | Koninklijke Philips Electronics N.V. | System and method for acquiring magnetic resonance imaging (mri) data |
| JP5148094B2 (en) * | 2006-09-27 | 2013-02-20 | 株式会社東芝 | Ultrasonic diagnostic apparatus, medical image processing apparatus, and program |
| US8041095B2 (en) * | 2008-06-11 | 2011-10-18 | Siemens Aktiengesellschaft | Method and apparatus for pretreatment planning of endovascular coil placement |
| DE102009032257B4 (en) | 2009-07-08 | 2017-05-04 | Siemens Healthcare Gmbh | Method and device for automated determination of the center line of at least a portion of a tubular tissue structure |
| US8929622B2 (en) * | 2009-12-09 | 2015-01-06 | Manipal Institute Of Technology | Method and apparatus for in vitro analysis of the physical response of blood-vessels to vaso-active agents |
| DE102010022305A1 (en) * | 2010-06-01 | 2011-12-01 | Siemens Aktiengesellschaft | Iterative reconstruction of CT images without regularization term |
| DE102010022306A1 (en) * | 2010-06-01 | 2011-12-01 | Siemens Aktiengesellschaft | Iterative CT image reconstruction in combination with a four-dimensional noise filter |
| CN107669295B (en) | 2010-09-10 | 2021-04-20 | 阿西斯特医疗系统有限公司 | Apparatus and method for medical image search |
| DE102011079380A1 (en) * | 2011-07-19 | 2013-01-24 | Siemens Aktiengesellschaft | Method, computer program and system for computer-aided evaluation of image data sets |
| US8588501B2 (en) * | 2011-07-29 | 2013-11-19 | Siemens Aktiengesellschaft | Automatic pose initialization for accurate 2-D/3-D registration applied to abdominal aortic aneurysm endovascular repair |
| CA2851426C (en) | 2011-10-06 | 2019-08-13 | Nant Holdings Ip, Llc | Healthcare object recognition, systems and methods |
| JP5931508B2 (en) | 2012-03-02 | 2016-06-08 | 株式会社東芝 | Medical image processing device |
| JP6230782B2 (en) * | 2012-11-15 | 2017-11-15 | 東芝メディカルシステムズ株式会社 | Aneurysm rupture risk analysis program |
| US9275432B2 (en) * | 2013-11-11 | 2016-03-01 | Toshiba Medical Systems Corporation | Method of, and apparatus for, registration of medical images |
| US9865086B2 (en) * | 2014-03-21 | 2018-01-09 | St. Jude Medical, Cardiololgy Division, Inc. | Methods and systems for generating a multi-dimensional surface model of a geometric structure |
| EP3195267A4 (en) * | 2014-08-06 | 2018-01-24 | Commonwealth Scientific and Industrial Research Organisation | Representing an interior of a volume |
| CN105796053B (en) * | 2015-02-15 | 2018-11-20 | 执鼎医疗科技(杭州)有限公司 | Utilize the method for OCT measurement dynamic contrast and the lateral flow of estimation |
| US10949975B2 (en) * | 2015-04-13 | 2021-03-16 | Siemens Healthcare Gmbh | Patient management based on anatomic measurements |
| US11284811B2 (en) * | 2016-06-22 | 2022-03-29 | Viewray Technologies, Inc. | Magnetic resonance volumetric imaging |
| US10327724B2 (en) | 2017-10-10 | 2019-06-25 | International Business Machines Corporation | Detection and characterization of aortic pathologies |
| CN109308477A (en) * | 2018-09-21 | 2019-02-05 | 北京连心医疗科技有限公司 | A kind of medical image automatic division method, equipment and storage medium based on rough sort |
| JP7401540B2 (en) * | 2018-11-09 | 2023-12-19 | バイダ ダイアグノスティクス,インコーポレイティド | Cut surface display of tubular structure |
| WO2020205714A1 (en) * | 2019-03-29 | 2020-10-08 | Eagle View Imaging,Inc. | Surgical planning, surgical navigation and imaging system |
| CN113573640B (en) * | 2019-04-04 | 2024-11-05 | 中心线生物医药股份有限公司 | Modeling regions of interest in anatomical structures |
| EP3792870B1 (en) * | 2019-09-12 | 2025-04-30 | Siemens Healthineers AG | Method and device for automatic determination of the change of a hollow organ |
| CN111145877A (en) * | 2019-12-27 | 2020-05-12 | 杭州依图医疗技术有限公司 | Interaction method, information processing method, display method, and storage medium |
| CN111951316B (en) * | 2020-07-27 | 2024-11-22 | 上海联影智能医疗科技有限公司 | Image quantization method and storage medium |
| CN112614217B (en) * | 2020-12-17 | 2024-06-14 | 深圳睿心智能医疗科技有限公司 | Tubular object three-dimensional model straightening method and device and electronic equipment |
| CN115272159A (en) * | 2021-04-30 | 2022-11-01 | 数坤(北京)网络科技股份有限公司 | Image identification method and device, electronic equipment and readable storage medium |
| US12458232B2 (en) * | 2021-12-07 | 2025-11-04 | Coreline Soft Co, Ltd. | Medical image visualization apparatus and method for diagnosis of aorta |
| CN117115183B (en) * | 2023-09-01 | 2024-02-09 | 北京透彻未来科技有限公司 | Interception method and system based on digital pathological image visual area |
| CN117438092B (en) * | 2023-12-20 | 2024-03-22 | 杭州脉流科技有限公司 | Intracranial aneurysm rupture risk prediction device, computer device, and storage medium |
Family Cites Families (12)
| Publication number | Priority date | Publication date | Assignee | Title |
|---|---|---|---|---|
| US6771262B2 (en) * | 1998-11-25 | 2004-08-03 | Siemens Corporate Research, Inc. | System and method for volume rendering-based segmentation |
| AU1122401A (en) * | 1999-11-01 | 2001-05-14 | Arthrovision, Inc. | Evaluating disease progression using magnetic resonance imaging |
| US6643533B2 (en) * | 2000-11-28 | 2003-11-04 | Ge Medical Systems Global Technology Company, Llc | Method and apparatus for displaying images of tubular structures |
| JP2005528681A (en) * | 2002-05-24 | 2005-09-22 | ダイナピクス インテリジェンス イメージング インコーポレイテッド | Method and apparatus for integrated multi-scale 3D image documentation and navigation |
| US7639855B2 (en) * | 2003-04-02 | 2009-12-29 | Ziosoft, Inc. | Medical image processing apparatus, and medical image processing method |
| JP5129480B2 (en) * | 2003-09-25 | 2013-01-30 | パイエオン インコーポレイテッド | System for performing three-dimensional reconstruction of tubular organ and method for operating blood vessel imaging device |
| CN100457047C (en) * | 2003-09-29 | 2009-02-04 | 皇家飞利浦电子股份有限公司 | Cardiac volumetric ultrasound quantification method |
| CA2444364A1 (en) * | 2003-10-09 | 2005-04-09 | Alexandre J. Boudreau | A multi-agent system for automated image analysis and understanding |
| WO2005069223A2 (en) * | 2004-01-15 | 2005-07-28 | Algotec Systems Ltd. | Vessel centerline determination |
| US7292250B2 (en) * | 2004-03-31 | 2007-11-06 | Dreamworks Animation, Llc | Character deformation pipeline for computer-generated animation |
| CN101065775B (en) * | 2004-11-26 | 2010-06-09 | 皇家飞利浦电子股份有限公司 | Selection of volume of interest |
| US7379062B2 (en) * | 2005-08-01 | 2008-05-27 | Barco Nv | Method for determining a path along a biological object with a lumen |
-
2008
- 2008-05-15 WO PCT/CA2008/000933 patent/WO2008138140A1/en not_active Ceased
- 2008-05-15 US US12/600,134 patent/US20100309198A1/en not_active Abandoned
- 2008-05-15 EP EP08757093A patent/EP2157905B1/en not_active Not-in-force
- 2008-05-15 CA CA2723670A patent/CA2723670A1/en not_active Abandoned
Also Published As
| Publication number | Publication date |
|---|---|
| EP2157905A1 (en) | 2010-03-03 |
| WO2008138140A1 (en) | 2008-11-20 |
| EP2157905A4 (en) | 2011-12-28 |
| CA2723670A1 (en) | 2008-11-20 |
| US20100309198A1 (en) | 2010-12-09 |
Similar Documents
| Publication | Publication Date | Title |
|---|---|---|
| US20100309198A1 (en) | method for tracking 3d anatomical and pathological changes in tubular-shaped anatomical structures | |
| US9830427B2 (en) | Method for intracranial aneurysm analysis and endovascular intervention planning | |
| JP5129480B2 (en) | System for performing three-dimensional reconstruction of tubular organ and method for operating blood vessel imaging device | |
| US8731271B2 (en) | Generating object data | |
| JP4728627B2 (en) | Method and apparatus for segmenting structures in CT angiography | |
| EP1761898B1 (en) | Image processing system for displaying information relating to parameters of a 3-d tubular object | |
| US8611989B2 (en) | Multi-planar reconstruction lumen imaging method and apparatus | |
| US7565000B2 (en) | Method and apparatus for semi-automatic segmentation technique for low-contrast tubular shaped objects | |
| EP3561768B1 (en) | Visualization of lung fissures in medical imaging | |
| EP3164073B1 (en) | System and method for detecting trachea | |
| Termeer et al. | CoViCAD: Comprehensive visualization of coronary artery disease | |
| US20060056685A1 (en) | Method and apparatus for embolism analysis | |
| JP2010528750A (en) | Inspection of tubular structures | |
| US9019272B2 (en) | Curved planar reformation | |
| US8588490B2 (en) | Image-based diagnosis assistance apparatus, its operation method and program | |
| Gotra et al. | Validation of a semiautomated liver segmentation method using CT for accurate volumetry | |
| US20250014299A1 (en) | Method for visualizing at least a zone of an object in at least one interface | |
| CN114708390B (en) | Image processing method and device for physiological tubular structure and storage medium | |
| JP2004313736A (en) | Medical image processing apparatus, medical image processing method, and program | |
| Debarba et al. | Efficient liver surgery planning in 3D based on functional segment classification and volumetric information | |
| JP2012085833A (en) | Image processing system for three-dimensional medical image data, image processing method for the same, and program | |
| EP3828836A1 (en) | Method and data processing system for providing a two-dimensional unfolded image of at least one tubular structure | |
| CN109242964B (en) | Processing method and device of three-dimensional medical model | |
| EP4281932A1 (en) | Segment shape determination | |
| CN112767299A (en) | Multi-mode three-dimensional image registration and fusion method |
Legal Events
| Date | Code | Title | Description |
|---|---|---|---|
| PUAI | Public reference made under article 153(3) epc to a published international application that has entered the european phase |
Free format text: ORIGINAL CODE: 0009012 |
|
| 17P | Request for examination filed |
Effective date: 20091215 |
|
| AK | Designated contracting states |
Kind code of ref document: A1 Designated state(s): AT BE BG CH CY CZ DE DK EE ES FI FR GB GR HR HU IE IS IT LI LT LU LV MC MT NL NO PL PT RO SE SI SK TR |
|
| AX | Request for extension of the european patent |
Extension state: AL BA MK RS |
|
| RAP1 | Party data changed (applicant data changed or rights of an application transferred) |
Owner name: CENTRE HOSPITALIER DE L'UNIVERSITE DE MONTREAL (CH Owner name: ECOLE DE TECHNOLOGIE SUPERIEURE |
|
| DAX | Request for extension of the european patent (deleted) | ||
| A4 | Supplementary search report drawn up and despatched |
Effective date: 20111129 |
|
| RIC1 | Information provided on ipc code assigned before grant |
Ipc: G06T 15/00 20110101ALI20111123BHEP Ipc: A61B 5/00 20060101AFI20111123BHEP Ipc: A61B 6/03 20060101ALI20111123BHEP Ipc: G06T 7/00 20060101ALI20111123BHEP Ipc: G06T 7/60 20060101ALI20111123BHEP |
|
| GRAP | Despatch of communication of intention to grant a patent |
Free format text: ORIGINAL CODE: EPIDOSNIGR1 |
|
| GRAS | Grant fee paid |
Free format text: ORIGINAL CODE: EPIDOSNIGR3 |
|
| GRAA | (expected) grant |
Free format text: ORIGINAL CODE: 0009210 |
|
| RAP1 | Party data changed (applicant data changed or rights of an application transferred) |
Owner name: VAL-CHUM, LIMITED PARTNERSHIP Owner name: CENTRE HOSPITALIER DE L'UNIVERSITE DE MONTREAL (CH Owner name: ECOLE DE TECHNOLOGIE SUPERIEURE |
|
| RAP1 | Party data changed (applicant data changed or rights of an application transferred) |
Owner name: VAL-CHUM, LIMITED PARTNERSHIP Owner name: ECOLE DE TECHNOLOGIE SUPERIEURE |
|
| AK | Designated contracting states |
Kind code of ref document: B1 Designated state(s): AT BE BG CH CY CZ DE DK EE ES FI FR GB GR HR HU IE IS IT LI LT LU LV MC MT NL NO PL PT RO SE SI SK TR |
|
| REG | Reference to a national code |
Ref country code: GB Ref legal event code: FG4D |
|
| REG | Reference to a national code |
Ref country code: CH Ref legal event code: EP |
|
| REG | Reference to a national code |
Ref country code: AT Ref legal event code: REF Ref document number: 602845 Country of ref document: AT Kind code of ref document: T Effective date: 20130415 |
|
| REG | Reference to a national code |
Ref country code: IE Ref legal event code: FG4D |
|
| REG | Reference to a national code |
Ref country code: DE Ref legal event code: R096 Ref document number: 602008023251 Country of ref document: DE Effective date: 20130523 |
|
| PG25 | Lapsed in a contracting state [announced via postgrant information from national office to epo] |
Ref country code: BG Free format text: LAPSE BECAUSE OF FAILURE TO SUBMIT A TRANSLATION OF THE DESCRIPTION OR TO PAY THE FEE WITHIN THE PRESCRIBED TIME-LIMIT Effective date: 20130627 Ref country code: SE Free format text: LAPSE BECAUSE OF FAILURE TO SUBMIT A TRANSLATION OF THE DESCRIPTION OR TO PAY THE FEE WITHIN THE PRESCRIBED TIME-LIMIT Effective date: 20130327 Ref country code: NO Free format text: LAPSE BECAUSE OF FAILURE TO SUBMIT A TRANSLATION OF THE DESCRIPTION OR TO PAY THE FEE WITHIN THE PRESCRIBED TIME-LIMIT Effective date: 20130627 Ref country code: LT Free format text: LAPSE BECAUSE OF FAILURE TO SUBMIT A TRANSLATION OF THE DESCRIPTION OR TO PAY THE FEE WITHIN THE PRESCRIBED TIME-LIMIT Effective date: 20130327 |
|
| REG | Reference to a national code |
Ref country code: AT Ref legal event code: MK05 Ref document number: 602845 Country of ref document: AT Kind code of ref document: T Effective date: 20130327 |
|
| REG | Reference to a national code |
Ref country code: LT Ref legal event code: MG4D |
|
| PG25 | Lapsed in a contracting state [announced via postgrant information from national office to epo] |
Ref country code: LV Free format text: LAPSE BECAUSE OF FAILURE TO SUBMIT A TRANSLATION OF THE DESCRIPTION OR TO PAY THE FEE WITHIN THE PRESCRIBED TIME-LIMIT Effective date: 20130327 Ref country code: FI Free format text: LAPSE BECAUSE OF FAILURE TO SUBMIT A TRANSLATION OF THE DESCRIPTION OR TO PAY THE FEE WITHIN THE PRESCRIBED TIME-LIMIT Effective date: 20130327 Ref country code: SI Free format text: LAPSE BECAUSE OF FAILURE TO SUBMIT A TRANSLATION OF THE DESCRIPTION OR TO PAY THE FEE WITHIN THE PRESCRIBED TIME-LIMIT Effective date: 20130327 Ref country code: GR Free format text: LAPSE BECAUSE OF FAILURE TO SUBMIT A TRANSLATION OF THE DESCRIPTION OR TO PAY THE FEE WITHIN THE PRESCRIBED TIME-LIMIT Effective date: 20130628 |
|
| REG | Reference to a national code |
Ref country code: NL Ref legal event code: VDEP Effective date: 20130327 |
|
| PG25 | Lapsed in a contracting state [announced via postgrant information from national office to epo] |
Ref country code: HR Free format text: LAPSE BECAUSE OF FAILURE TO SUBMIT A TRANSLATION OF THE DESCRIPTION OR TO PAY THE FEE WITHIN THE PRESCRIBED TIME-LIMIT Effective date: 20130327 Ref country code: BE Free format text: LAPSE BECAUSE OF FAILURE TO SUBMIT A TRANSLATION OF THE DESCRIPTION OR TO PAY THE FEE WITHIN THE PRESCRIBED TIME-LIMIT Effective date: 20130327 |
|
| PG25 | Lapsed in a contracting state [announced via postgrant information from national office to epo] |
Ref country code: EE Free format text: LAPSE BECAUSE OF FAILURE TO SUBMIT A TRANSLATION OF THE DESCRIPTION OR TO PAY THE FEE WITHIN THE PRESCRIBED TIME-LIMIT Effective date: 20130327 Ref country code: SK Free format text: LAPSE BECAUSE OF FAILURE TO SUBMIT A TRANSLATION OF THE DESCRIPTION OR TO PAY THE FEE WITHIN THE PRESCRIBED TIME-LIMIT Effective date: 20130327 Ref country code: CZ Free format text: LAPSE BECAUSE OF FAILURE TO SUBMIT A TRANSLATION OF THE DESCRIPTION OR TO PAY THE FEE WITHIN THE PRESCRIBED TIME-LIMIT Effective date: 20130327 Ref country code: NL Free format text: LAPSE BECAUSE OF FAILURE TO SUBMIT A TRANSLATION OF THE DESCRIPTION OR TO PAY THE FEE WITHIN THE PRESCRIBED TIME-LIMIT Effective date: 20130327 Ref country code: PT Free format text: LAPSE BECAUSE OF FAILURE TO SUBMIT A TRANSLATION OF THE DESCRIPTION OR TO PAY THE FEE WITHIN THE PRESCRIBED TIME-LIMIT Effective date: 20130729 Ref country code: RO Free format text: LAPSE BECAUSE OF FAILURE TO SUBMIT A TRANSLATION OF THE DESCRIPTION OR TO PAY THE FEE WITHIN THE PRESCRIBED TIME-LIMIT Effective date: 20130327 Ref country code: IS Free format text: LAPSE BECAUSE OF FAILURE TO SUBMIT A TRANSLATION OF THE DESCRIPTION OR TO PAY THE FEE WITHIN THE PRESCRIBED TIME-LIMIT Effective date: 20130727 Ref country code: AT Free format text: LAPSE BECAUSE OF FAILURE TO SUBMIT A TRANSLATION OF THE DESCRIPTION OR TO PAY THE FEE WITHIN THE PRESCRIBED TIME-LIMIT Effective date: 20130327 Ref country code: ES Free format text: LAPSE BECAUSE OF FAILURE TO SUBMIT A TRANSLATION OF THE DESCRIPTION OR TO PAY THE FEE WITHIN THE PRESCRIBED TIME-LIMIT Effective date: 20130708 |
|
| PG25 | Lapsed in a contracting state [announced via postgrant information from national office to epo] |
Ref country code: PL Free format text: LAPSE BECAUSE OF FAILURE TO SUBMIT A TRANSLATION OF THE DESCRIPTION OR TO PAY THE FEE WITHIN THE PRESCRIBED TIME-LIMIT Effective date: 20130327 Ref country code: CY Free format text: LAPSE BECAUSE OF FAILURE TO SUBMIT A TRANSLATION OF THE DESCRIPTION OR TO PAY THE FEE WITHIN THE PRESCRIBED TIME-LIMIT Effective date: 20130327 |
|
| PG25 | Lapsed in a contracting state [announced via postgrant information from national office to epo] |
Ref country code: MC Free format text: LAPSE BECAUSE OF FAILURE TO SUBMIT A TRANSLATION OF THE DESCRIPTION OR TO PAY THE FEE WITHIN THE PRESCRIBED TIME-LIMIT Effective date: 20130327 |
|
| REG | Reference to a national code |
Ref country code: CH Ref legal event code: PL |
|
| PG25 | Lapsed in a contracting state [announced via postgrant information from national office to epo] |
Ref country code: CH Free format text: LAPSE BECAUSE OF NON-PAYMENT OF DUE FEES Effective date: 20130531 Ref country code: LI Free format text: LAPSE BECAUSE OF NON-PAYMENT OF DUE FEES Effective date: 20130531 Ref country code: DK Free format text: LAPSE BECAUSE OF FAILURE TO SUBMIT A TRANSLATION OF THE DESCRIPTION OR TO PAY THE FEE WITHIN THE PRESCRIBED TIME-LIMIT Effective date: 20130327 |
|
| PLBE | No opposition filed within time limit |
Free format text: ORIGINAL CODE: 0009261 |
|
| STAA | Information on the status of an ep patent application or granted ep patent |
Free format text: STATUS: NO OPPOSITION FILED WITHIN TIME LIMIT |
|
| REG | Reference to a national code |
Ref country code: IE Ref legal event code: MM4A |
|
| PG25 | Lapsed in a contracting state [announced via postgrant information from national office to epo] |
Ref country code: IT Free format text: LAPSE BECAUSE OF FAILURE TO SUBMIT A TRANSLATION OF THE DESCRIPTION OR TO PAY THE FEE WITHIN THE PRESCRIBED TIME-LIMIT Effective date: 20130327 |
|
| 26N | No opposition filed |
Effective date: 20140103 |
|
| REG | Reference to a national code |
Ref country code: DE Ref legal event code: R097 Ref document number: 602008023251 Country of ref document: DE Effective date: 20140103 |
|
| PG25 | Lapsed in a contracting state [announced via postgrant information from national office to epo] |
Ref country code: IE Free format text: LAPSE BECAUSE OF NON-PAYMENT OF DUE FEES Effective date: 20130515 |
|
| PG25 | Lapsed in a contracting state [announced via postgrant information from national office to epo] |
Ref country code: MT Free format text: LAPSE BECAUSE OF FAILURE TO SUBMIT A TRANSLATION OF THE DESCRIPTION OR TO PAY THE FEE WITHIN THE PRESCRIBED TIME-LIMIT Effective date: 20130327 |
|
| REG | Reference to a national code |
Ref country code: FR Ref legal event code: PLFP Year of fee payment: 8 |
|
| PG25 | Lapsed in a contracting state [announced via postgrant information from national office to epo] |
Ref country code: TR Free format text: LAPSE BECAUSE OF FAILURE TO SUBMIT A TRANSLATION OF THE DESCRIPTION OR TO PAY THE FEE WITHIN THE PRESCRIBED TIME-LIMIT Effective date: 20130327 |
|
| PG25 | Lapsed in a contracting state [announced via postgrant information from national office to epo] |
Ref country code: LU Free format text: LAPSE BECAUSE OF NON-PAYMENT OF DUE FEES Effective date: 20130515 Ref country code: HU Free format text: LAPSE BECAUSE OF FAILURE TO SUBMIT A TRANSLATION OF THE DESCRIPTION OR TO PAY THE FEE WITHIN THE PRESCRIBED TIME-LIMIT; INVALID AB INITIO Effective date: 20080515 |
|
| PGFP | Annual fee paid to national office [announced via postgrant information from national office to epo] |
Ref country code: GB Payment date: 20150424 Year of fee payment: 8 Ref country code: DE Payment date: 20150422 Year of fee payment: 8 |
|
| PGFP | Annual fee paid to national office [announced via postgrant information from national office to epo] |
Ref country code: FR Payment date: 20150422 Year of fee payment: 8 |
|
| REG | Reference to a national code |
Ref country code: DE Ref legal event code: R119 Ref document number: 602008023251 Country of ref document: DE |
|
| GBPC | Gb: european patent ceased through non-payment of renewal fee |
Effective date: 20160515 |
|
| REG | Reference to a national code |
Ref country code: FR Ref legal event code: ST Effective date: 20170131 |
|
| PG25 | Lapsed in a contracting state [announced via postgrant information from national office to epo] |
Ref country code: FR Free format text: LAPSE BECAUSE OF NON-PAYMENT OF DUE FEES Effective date: 20160531 Ref country code: DE Free format text: LAPSE BECAUSE OF NON-PAYMENT OF DUE FEES Effective date: 20161201 |
|
| PG25 | Lapsed in a contracting state [announced via postgrant information from national office to epo] |
Ref country code: GB Free format text: LAPSE BECAUSE OF NON-PAYMENT OF DUE FEES Effective date: 20160515 |