EP2138589A1 - Molecular signature of liver tumor grade and use to evaluate prognosis and therapeutic regimen - Google Patents
Molecular signature of liver tumor grade and use to evaluate prognosis and therapeutic regimen Download PDFInfo
- Publication number
- EP2138589A1 EP2138589A1 EP08290628A EP08290628A EP2138589A1 EP 2138589 A1 EP2138589 A1 EP 2138589A1 EP 08290628 A EP08290628 A EP 08290628A EP 08290628 A EP08290628 A EP 08290628A EP 2138589 A1 EP2138589 A1 EP 2138589A1
- Authority
- EP
- European Patent Office
- Prior art keywords
- genes
- gene
- probes
- tumor
- expression
- Prior art date
- Legal status (The legal status is an assumption and is not a legal conclusion. Google has not performed a legal analysis and makes no representation as to the accuracy of the status listed.)
- Withdrawn
Links
- 206010019695 Hepatic neoplasm Diseases 0.000 title claims abstract description 58
- 208000014018 liver neoplasm Diseases 0.000 title claims abstract description 58
- 238000011285 therapeutic regimen Methods 0.000 title claims abstract description 4
- 238000004393 prognosis Methods 0.000 title description 25
- 108090000623 proteins and genes Proteins 0.000 claims abstract description 275
- 239000000523 sample Substances 0.000 claims abstract description 189
- 230000014509 gene expression Effects 0.000 claims abstract description 141
- 208000006359 hepatoblastoma Diseases 0.000 claims abstract description 90
- 238000000034 method Methods 0.000 claims abstract description 77
- 206010027476 Metastases Diseases 0.000 claims abstract description 20
- 206010073071 hepatocellular carcinoma Diseases 0.000 claims abstract description 20
- 231100000844 hepatocellular carcinoma Toxicity 0.000 claims abstract description 20
- 230000009401 metastasis Effects 0.000 claims abstract description 15
- 239000000203 mixture Substances 0.000 claims abstract description 14
- 239000007787 solid Substances 0.000 claims abstract description 9
- 239000002773 nucleotide Substances 0.000 claims description 69
- 125000003729 nucleotide group Chemical group 0.000 claims description 69
- 108010077181 E2F5 Transcription Factor Proteins 0.000 claims description 39
- 102000009931 E2F5 Transcription Factor Human genes 0.000 claims description 39
- 101710086822 Apolipoprotein C-IV Proteins 0.000 claims description 34
- 102100037322 Apolipoprotein C-IV Human genes 0.000 claims description 34
- 102100020948 Growth hormone receptor Human genes 0.000 claims description 34
- 108010068542 Somatotropin Receptors Proteins 0.000 claims description 34
- 102100024889 Cytochrome P450 2E1 Human genes 0.000 claims description 32
- 102000019384 Aquaporin 9 Human genes 0.000 claims description 31
- 108050006914 Aquaporin 9 Proteins 0.000 claims description 31
- 108010001202 Cytochrome P-450 CYP2E1 Proteins 0.000 claims description 31
- 101000755323 Homo sapiens 60S ribosomal protein L10a Proteins 0.000 claims description 31
- -1 EFF1A1 Proteins 0.000 claims description 29
- 108010026331 alpha-Fetoproteins Proteins 0.000 claims description 29
- 102100021160 Dual specificity protein phosphatase 9 Human genes 0.000 claims description 28
- 101000968556 Homo sapiens Dual specificity protein phosphatase 9 Proteins 0.000 claims description 28
- 102100025406 Complement C1s subcomponent Human genes 0.000 claims description 27
- 102100037980 Disks large-associated protein 5 Human genes 0.000 claims description 27
- 101000934958 Homo sapiens Complement C1s subcomponent Proteins 0.000 claims description 27
- 101710181553 Disks large-associated protein 5 Proteins 0.000 claims description 25
- 101001024286 Homo sapiens Notchless protein homolog 1 Proteins 0.000 claims description 25
- 102100035358 Notchless protein homolog 1 Human genes 0.000 claims description 25
- 230000003321 amplification Effects 0.000 claims description 18
- 238000003491 array Methods 0.000 claims description 18
- 238000003199 nucleic acid amplification method Methods 0.000 claims description 18
- 230000000295 complement effect Effects 0.000 claims description 14
- 238000009396 hybridization Methods 0.000 claims description 14
- 102100022406 60S ribosomal protein L10a Human genes 0.000 claims description 13
- 238000003556 assay Methods 0.000 claims description 13
- 108010068327 4-hydroxyphenylpyruvate dioxygenase Proteins 0.000 claims description 12
- 102100030374 Actin, cytoplasmic 2 Human genes 0.000 claims description 11
- 101000773237 Homo sapiens Actin, cytoplasmic 2 Proteins 0.000 claims description 11
- 101000990976 Homo sapiens Mitochondrial Rho GTPase 2 Proteins 0.000 claims description 11
- 108020004999 messenger RNA Proteins 0.000 claims description 10
- 239000003153 chemical reaction reagent Substances 0.000 claims description 7
- 102100028626 4-hydroxyphenylpyruvate dioxygenase Human genes 0.000 claims description 6
- 108010045517 Serum Amyloid P-Component Proteins 0.000 claims description 3
- 238000002360 preparation method Methods 0.000 claims description 3
- 239000013074 reference sample Substances 0.000 claims description 3
- 102000005369 Aldehyde Dehydrogenase Human genes 0.000 claims description 2
- 108020002663 Aldehyde Dehydrogenase Proteins 0.000 claims description 2
- 108010028143 Dioxygenases Proteins 0.000 claims description 2
- 102000016680 Dioxygenases Human genes 0.000 claims description 2
- 150000001556 benzimidazoles Chemical class 0.000 claims description 2
- 230000034303 cell budding Effects 0.000 claims description 2
- 210000002966 serum Anatomy 0.000 claims description 2
- 102000013529 alpha-Fetoproteins Human genes 0.000 claims 7
- 239000012472 biological sample Substances 0.000 claims 1
- 239000007788 liquid Substances 0.000 claims 1
- 238000003752 polymerase chain reaction Methods 0.000 claims 1
- 206010028980 Neoplasm Diseases 0.000 description 160
- 210000004185 liver Anatomy 0.000 description 60
- 230000001605 fetal effect Effects 0.000 description 39
- 230000004083 survival effect Effects 0.000 description 29
- 102100023635 Alpha-fetoprotein Human genes 0.000 description 22
- 239000000047 product Substances 0.000 description 22
- 238000003753 real-time PCR Methods 0.000 description 22
- 102000015735 Beta-catenin Human genes 0.000 description 21
- 108060000903 Beta-catenin Proteins 0.000 description 21
- 101150076401 16 gene Proteins 0.000 description 18
- 210000004027 cell Anatomy 0.000 description 18
- 201000010099 disease Diseases 0.000 description 14
- 208000037265 diseases, disorders, signs and symptoms Diseases 0.000 description 14
- 102000013814 Wnt Human genes 0.000 description 13
- 108050003627 Wnt Proteins 0.000 description 13
- 238000004458 analytical method Methods 0.000 description 13
- 230000002440 hepatic effect Effects 0.000 description 13
- 238000004422 calculation algorithm Methods 0.000 description 12
- 108091032973 (ribonucleotides)n+m Proteins 0.000 description 11
- 238000001574 biopsy Methods 0.000 description 11
- 238000002512 chemotherapy Methods 0.000 description 11
- 201000007270 liver cancer Diseases 0.000 description 11
- 238000010837 poor prognosis Methods 0.000 description 11
- 238000011282 treatment Methods 0.000 description 11
- 230000009790 vascular invasion Effects 0.000 description 11
- 108091093088 Amplicon Proteins 0.000 description 10
- 101000605827 Homo sapiens Pinin Proteins 0.000 description 10
- 102100038374 Pinin Human genes 0.000 description 10
- 230000004069 differentiation Effects 0.000 description 10
- 238000001325 log-rank test Methods 0.000 description 10
- 238000002493 microarray Methods 0.000 description 10
- 230000008569 process Effects 0.000 description 10
- 238000001356 surgical procedure Methods 0.000 description 10
- 230000035772 mutation Effects 0.000 description 9
- 239000002299 complementary DNA Substances 0.000 description 8
- 238000003364 immunohistochemistry Methods 0.000 description 8
- 230000031142 liver development Effects 0.000 description 8
- 102000004169 proteins and genes Human genes 0.000 description 8
- 238000006467 substitution reaction Methods 0.000 description 8
- 238000012360 testing method Methods 0.000 description 8
- 210000004881 tumor cell Anatomy 0.000 description 8
- 108020004414 DNA Proteins 0.000 description 7
- 102100030325 Mitochondrial Rho GTPase 2 Human genes 0.000 description 7
- 239000000872 buffer Substances 0.000 description 7
- 238000006243 chemical reaction Methods 0.000 description 7
- 230000002018 overexpression Effects 0.000 description 7
- 230000001575 pathological effect Effects 0.000 description 7
- 102100038641 Cleavage and polyadenylation specificity factor subunit 1 Human genes 0.000 description 6
- 101000957603 Homo sapiens Cleavage and polyadenylation specificity factor subunit 1 Proteins 0.000 description 6
- 201000011510 cancer Diseases 0.000 description 6
- 230000006870 function Effects 0.000 description 6
- 230000000155 isotopic effect Effects 0.000 description 6
- 230000011664 signaling Effects 0.000 description 6
- 238000012706 support-vector machine Methods 0.000 description 6
- 102100031940 Epithelial cell adhesion molecule Human genes 0.000 description 5
- 102100039611 Glutamine synthetase Human genes 0.000 description 5
- 101000888841 Homo sapiens Glutamine synthetase Proteins 0.000 description 5
- 239000011324 bead Substances 0.000 description 5
- 238000010199 gene set enrichment analysis Methods 0.000 description 5
- 238000000491 multivariate analysis Methods 0.000 description 5
- 230000037361 pathway Effects 0.000 description 5
- 238000002203 pretreatment Methods 0.000 description 5
- YBJHBAHKTGYVGT-ZKWXMUAHSA-N (+)-Biotin Chemical compound N1C(=O)N[C@@H]2[C@H](CCCCC(=O)O)SC[C@@H]21 YBJHBAHKTGYVGT-ZKWXMUAHSA-N 0.000 description 4
- 108010066687 Epithelial Cell Adhesion Molecule Proteins 0.000 description 4
- ZHNUHDYFZUAESO-UHFFFAOYSA-N Formamide Chemical compound NC=O ZHNUHDYFZUAESO-UHFFFAOYSA-N 0.000 description 4
- 102100032340 G2/mitotic-specific cyclin-B1 Human genes 0.000 description 4
- 101001005528 Homo sapiens LYR motif-containing protein 4 Proteins 0.000 description 4
- 102100033420 Keratin, type I cytoskeletal 19 Human genes 0.000 description 4
- 102100025154 LYR motif-containing protein 4 Human genes 0.000 description 4
- 241001529936 Murinae Species 0.000 description 4
- 238000013459 approach Methods 0.000 description 4
- 238000000546 chi-square test Methods 0.000 description 4
- 238000013461 design Methods 0.000 description 4
- 230000002068 genetic effect Effects 0.000 description 4
- 238000012744 immunostaining Methods 0.000 description 4
- 230000001394 metastastic effect Effects 0.000 description 4
- 206010061289 metastatic neoplasm Diseases 0.000 description 4
- 238000010606 normalization Methods 0.000 description 4
- 238000005192 partition Methods 0.000 description 4
- 102000040430 polynucleotide Human genes 0.000 description 4
- 108091033319 polynucleotide Proteins 0.000 description 4
- 239000002157 polynucleotide Substances 0.000 description 4
- 230000002062 proliferating effect Effects 0.000 description 4
- 230000002103 transcriptional effect Effects 0.000 description 4
- 102100030755 5-aminolevulinate synthase, nonspecific, mitochondrial Human genes 0.000 description 3
- 102100026750 60S ribosomal protein L5 Human genes 0.000 description 3
- 102100035931 60S ribosomal protein L8 Human genes 0.000 description 3
- 102100036774 Afamin Human genes 0.000 description 3
- 102100032311 Aurora kinase A Human genes 0.000 description 3
- 102100035682 Axin-1 Human genes 0.000 description 3
- 102100035634 B-cell linker protein Human genes 0.000 description 3
- 102100021714 Bystin Human genes 0.000 description 3
- 102100030297 Calcium uptake protein 1, mitochondrial Human genes 0.000 description 3
- 102100038215 Chromodomain-helicase-DNA-binding protein 7 Human genes 0.000 description 3
- 102100033843 Condensin complex subunit 1 Human genes 0.000 description 3
- 102100040626 Cytosolic phospholipase A2 gamma Human genes 0.000 description 3
- 102100034157 DNA mismatch repair protein Msh2 Human genes 0.000 description 3
- 102100021389 DNA replication licensing factor MCM4 Human genes 0.000 description 3
- 102100033711 DNA replication licensing factor MCM7 Human genes 0.000 description 3
- 102100036109 Dual specificity protein kinase TTK Human genes 0.000 description 3
- 102100030801 Elongation factor 1-alpha 1 Human genes 0.000 description 3
- 102100021699 Eukaryotic translation initiation factor 3 subunit B Human genes 0.000 description 3
- 102100037115 Eukaryotic translation initiation factor 3 subunit H Human genes 0.000 description 3
- 102100025783 Glutamyl aminopeptidase Human genes 0.000 description 3
- 102100031249 H/ACA ribonucleoprotein complex subunit DKC1 Human genes 0.000 description 3
- 206010073069 Hepatic cancer Diseases 0.000 description 3
- 102100024501 Histone H3-like centromeric protein A Human genes 0.000 description 3
- 102100022107 Holliday junction recognition protein Human genes 0.000 description 3
- 101000843649 Homo sapiens 5-aminolevulinate synthase, nonspecific, mitochondrial Proteins 0.000 description 3
- 101000798300 Homo sapiens Aurora kinase A Proteins 0.000 description 3
- 101000874566 Homo sapiens Axin-1 Proteins 0.000 description 3
- 101000803266 Homo sapiens B-cell linker protein Proteins 0.000 description 3
- 101000896419 Homo sapiens Bystin Proteins 0.000 description 3
- 101000991050 Homo sapiens Calcium uptake protein 1, mitochondrial Proteins 0.000 description 3
- 101000614106 Homo sapiens Cytosolic phospholipase A2 gamma Proteins 0.000 description 3
- 101001134036 Homo sapiens DNA mismatch repair protein Msh2 Proteins 0.000 description 3
- 101000615280 Homo sapiens DNA replication licensing factor MCM4 Proteins 0.000 description 3
- 101001018431 Homo sapiens DNA replication licensing factor MCM7 Proteins 0.000 description 3
- 101000659223 Homo sapiens Dual specificity protein kinase TTK Proteins 0.000 description 3
- 101000920078 Homo sapiens Elongation factor 1-alpha 1 Proteins 0.000 description 3
- 101000896557 Homo sapiens Eukaryotic translation initiation factor 3 subunit B Proteins 0.000 description 3
- 101000719019 Homo sapiens Glutamyl aminopeptidase Proteins 0.000 description 3
- 101000844866 Homo sapiens H/ACA ribonucleoprotein complex subunit DKC1 Proteins 0.000 description 3
- 101001045907 Homo sapiens Holliday junction recognition protein Proteins 0.000 description 3
- 101001008949 Homo sapiens Kinesin-like protein KIF14 Proteins 0.000 description 3
- 101001112162 Homo sapiens Kinetochore protein NDC80 homolog Proteins 0.000 description 3
- 101000624643 Homo sapiens M-phase inducer phosphatase 3 Proteins 0.000 description 3
- 101000929834 Homo sapiens Monoacylglycerol lipase ABHD6 Proteins 0.000 description 3
- 101000924530 Homo sapiens Protein arginine N-methyltransferase 5 Proteins 0.000 description 3
- 101000825726 Homo sapiens Structural maintenance of chromosomes protein 4 Proteins 0.000 description 3
- 101000653469 Homo sapiens T-complex protein 1 subunit zeta Proteins 0.000 description 3
- 101000830894 Homo sapiens Targeting protein for Xklp2 Proteins 0.000 description 3
- 101000614354 Homo sapiens Transmembrane prolyl 4-hydroxylase Proteins 0.000 description 3
- 101000894586 Homo sapiens UPF0687 protein C20orf27 Proteins 0.000 description 3
- 101000667337 Homo sapiens V-set and transmembrane domain-containing protein 4 Proteins 0.000 description 3
- 101000744322 Homo sapiens eIF5-mimic protein 1 Proteins 0.000 description 3
- 102100031613 Hypermethylated in cancer 2 protein Human genes 0.000 description 3
- 102100036341 Importin-4 Human genes 0.000 description 3
- 102100039062 Interleukin enhancer-binding factor 3 Human genes 0.000 description 3
- 102100027631 Kinesin-like protein KIF14 Human genes 0.000 description 3
- 102100023890 Kinetochore protein NDC80 homolog Human genes 0.000 description 3
- 102100022744 Laminin subunit alpha-3 Human genes 0.000 description 3
- 102100023330 M-phase inducer phosphatase 3 Human genes 0.000 description 3
- 102100035912 Monoacylglycerol lipase ABHD6 Human genes 0.000 description 3
- 102100035570 Nuclear pore membrane glycoprotein 210 Human genes 0.000 description 3
- 102100037826 Nucleoporin NDC1 Human genes 0.000 description 3
- 108091034117 Oligonucleotide Proteins 0.000 description 3
- 108091000080 Phosphotransferase Proteins 0.000 description 3
- 102100034607 Protein arginine N-methyltransferase 5 Human genes 0.000 description 3
- 102100039790 Ran-specific GTPase-activating protein Human genes 0.000 description 3
- 102100027055 Ribosome biogenesis protein BOP1 Human genes 0.000 description 3
- 102100031463 Serine/threonine-protein kinase PLK1 Human genes 0.000 description 3
- 102100034803 Small nuclear ribonucleoprotein-associated protein N Human genes 0.000 description 3
- 102100022842 Structural maintenance of chromosomes protein 4 Human genes 0.000 description 3
- 102100024813 Targeting protein for Xklp2 Human genes 0.000 description 3
- 102100040472 Transmembrane prolyl 4-hydroxylase Human genes 0.000 description 3
- 102100021441 UPF0687 protein C20orf27 Human genes 0.000 description 3
- 102100037938 Ubiquitin-like modifier-activating enzyme 7 Human genes 0.000 description 3
- 102000006943 Uracil-DNA Glycosidase Human genes 0.000 description 3
- 108010072685 Uracil-DNA Glycosidase Proteins 0.000 description 3
- 102100039764 V-set and transmembrane domain-containing protein 4 Human genes 0.000 description 3
- 208000008383 Wilms tumor Diseases 0.000 description 3
- 201000002698 adult hepatocellular carcinoma Diseases 0.000 description 3
- 230000033228 biological regulation Effects 0.000 description 3
- 230000001086 cytosolic effect Effects 0.000 description 3
- 238000012217 deletion Methods 0.000 description 3
- 230000037430 deletion Effects 0.000 description 3
- 230000001419 dependent effect Effects 0.000 description 3
- 238000011161 development Methods 0.000 description 3
- 230000018109 developmental process Effects 0.000 description 3
- 238000003745 diagnosis Methods 0.000 description 3
- 102100039119 eIF5-mimic protein 1 Human genes 0.000 description 3
- 238000002474 experimental method Methods 0.000 description 3
- 230000004547 gene signature Effects 0.000 description 3
- 239000011521 glass Substances 0.000 description 3
- 210000003494 hepatocyte Anatomy 0.000 description 3
- 230000002962 histologic effect Effects 0.000 description 3
- 210000005229 liver cell Anatomy 0.000 description 3
- 230000003908 liver function Effects 0.000 description 3
- 230000004807 localization Effects 0.000 description 3
- 230000011278 mitosis Effects 0.000 description 3
- 238000010369 molecular cloning Methods 0.000 description 3
- 102000039446 nucleic acids Human genes 0.000 description 3
- 108020004707 nucleic acids Proteins 0.000 description 3
- 150000007523 nucleic acids Chemical class 0.000 description 3
- 102000020233 phosphotransferase Human genes 0.000 description 3
- 108010056274 polo-like kinase 1 Proteins 0.000 description 3
- 230000035755 proliferation Effects 0.000 description 3
- 230000002285 radioactive effect Effects 0.000 description 3
- 238000011160 research Methods 0.000 description 3
- 239000000243 solution Substances 0.000 description 3
- 230000019130 spindle checkpoint Effects 0.000 description 3
- 238000007619 statistical method Methods 0.000 description 3
- 210000000130 stem cell Anatomy 0.000 description 3
- 238000013518 transcription Methods 0.000 description 3
- 102100028914 Catenin beta-1 Human genes 0.000 description 2
- 108010076303 Centromere Protein A Proteins 0.000 description 2
- 102100030149 Complement C1r subcomponent Human genes 0.000 description 2
- 108010060385 Cyclin B1 Proteins 0.000 description 2
- 108010015742 Cytochrome P-450 Enzyme System Proteins 0.000 description 2
- 102000003849 Cytochrome P450 Human genes 0.000 description 2
- 102000016928 DNA-directed DNA polymerase Human genes 0.000 description 2
- 108010014303 DNA-directed DNA polymerase Proteins 0.000 description 2
- AOJJSUZBOXZQNB-TZSSRYMLSA-N Doxorubicin Chemical compound O([C@H]1C[C@@](O)(CC=2C(O)=C3C(=O)C=4C=CC=C(C=4C(=O)C3=C(O)C=21)OC)C(=O)CO)[C@H]1C[C@H](N)[C@H](O)[C@H](C)O1 AOJJSUZBOXZQNB-TZSSRYMLSA-N 0.000 description 2
- 241000255581 Drosophila <fruit fly, genus> Species 0.000 description 2
- 102000004190 Enzymes Human genes 0.000 description 2
- 108090000790 Enzymes Proteins 0.000 description 2
- 108010089790 Eukaryotic Initiation Factor-3 Proteins 0.000 description 2
- WZUVPPKBWHMQCE-UHFFFAOYSA-N Haematoxylin Chemical compound C12=CC(O)=C(O)C=C2CC2(O)C1C1=CC=C(O)C(O)=C1OC2 WZUVPPKBWHMQCE-UHFFFAOYSA-N 0.000 description 2
- 101000691083 Homo sapiens 60S ribosomal protein L5 Proteins 0.000 description 2
- 101000853659 Homo sapiens 60S ribosomal protein L8 Proteins 0.000 description 2
- 101000916173 Homo sapiens Catenin beta-1 Proteins 0.000 description 2
- 101000883739 Homo sapiens Chromodomain-helicase-DNA-binding protein 7 Proteins 0.000 description 2
- 101000794279 Homo sapiens Complement C1r subcomponent Proteins 0.000 description 2
- 101000710846 Homo sapiens Condensin complex subunit 1 Proteins 0.000 description 2
- 101000868643 Homo sapiens G2/mitotic-specific cyclin-B1 Proteins 0.000 description 2
- 101000993376 Homo sapiens Hypermethylated in cancer 2 protein Proteins 0.000 description 2
- 101000852543 Homo sapiens Importin-4 Proteins 0.000 description 2
- 101001076642 Homo sapiens Inosine-5'-monophosphate dehydrogenase 2 Proteins 0.000 description 2
- 101001050282 Homo sapiens Jupiter microtubule associated homolog 2 Proteins 0.000 description 2
- 101000998011 Homo sapiens Keratin, type I cytoskeletal 19 Proteins 0.000 description 2
- 101000603068 Homo sapiens Nucleolar protein 56 Proteins 0.000 description 2
- 101001024723 Homo sapiens Nucleoporin NDC1 Proteins 0.000 description 2
- 101000618174 Homo sapiens Protein Spindly Proteins 0.000 description 2
- 101000984584 Homo sapiens Ribosome biogenesis protein BOP1 Proteins 0.000 description 2
- 101000662026 Homo sapiens Ubiquitin-like modifier-activating enzyme 7 Proteins 0.000 description 2
- GRSZFWQUAKGDAV-KQYNXXCUSA-N IMP Chemical compound O[C@@H]1[C@H](O)[C@@H](COP(O)(O)=O)O[C@H]1N1C(NC=NC2=O)=C2N=C1 GRSZFWQUAKGDAV-KQYNXXCUSA-N 0.000 description 2
- 102100025891 Inosine-5'-monophosphate dehydrogenase 2 Human genes 0.000 description 2
- 102100023130 Jupiter microtubule associated homolog 2 Human genes 0.000 description 2
- 238000010824 Kaplan-Meier survival analysis Methods 0.000 description 2
- 108010066302 Keratin-19 Proteins 0.000 description 2
- 229910015837 MSH2 Inorganic materials 0.000 description 2
- 108700012912 MYCN Proteins 0.000 description 2
- 101150022024 MYCN gene Proteins 0.000 description 2
- TWRXJAOTZQYOKJ-UHFFFAOYSA-L Magnesium chloride Chemical compound [Mg+2].[Cl-].[Cl-] TWRXJAOTZQYOKJ-UHFFFAOYSA-L 0.000 description 2
- 101001033610 Mycobacterium tuberculosis (strain ATCC 25618 / H37Rv) Inosine-5'-monophosphate dehydrogenase Proteins 0.000 description 2
- SECXISVLQFMRJM-UHFFFAOYSA-N N-Methylpyrrolidone Chemical compound CN1CCCC1=O SECXISVLQFMRJM-UHFFFAOYSA-N 0.000 description 2
- 108700026495 N-Myc Proto-Oncogene Proteins 0.000 description 2
- 102100030124 N-myc proto-oncogene protein Human genes 0.000 description 2
- 101710104492 NUP210 Proteins 0.000 description 2
- 108010010424 Nuclear Factor 90 Proteins Proteins 0.000 description 2
- 102100037052 Nucleolar protein 56 Human genes 0.000 description 2
- 102100022678 Nucleophosmin Human genes 0.000 description 2
- 102100021884 Protein Spindly Human genes 0.000 description 2
- 101150075139 RHOT2 gene Proteins 0.000 description 2
- 101710179353 Ran-specific GTPase-activating protein Proteins 0.000 description 2
- 101710180752 Ran-specific GTPase-activating protein 1 Proteins 0.000 description 2
- 238000012952 Resampling Methods 0.000 description 2
- VYPSYNLAJGMNEJ-UHFFFAOYSA-N Silicium dioxide Chemical compound O=[Si]=O VYPSYNLAJGMNEJ-UHFFFAOYSA-N 0.000 description 2
- 102100023985 Sulfotransferase 1C2 Human genes 0.000 description 2
- 102100030664 T-complex protein 1 subunit zeta Human genes 0.000 description 2
- 102100029785 UDP-glucuronosyltransferase 2B4 Human genes 0.000 description 2
- 101710200334 UDP-glucuronosyltransferase 2B4 Proteins 0.000 description 2
- ZUPXXZAVUHFCNV-UHFFFAOYSA-N [[5-(6-aminopurin-9-yl)-3,4-dihydroxyoxolan-2-yl]methoxy-hydroxyphosphoryl] [5-(3-carbamoyl-4h-pyridin-1-yl)-3,4-dihydroxyoxolan-2-yl]methyl hydrogen phosphate;potassium Chemical compound [K].C1=CCC(C(=O)N)=CN1C1C(O)C(O)C(COP(O)(=O)OP(O)(=O)OCC2C(C(O)C(O2)N2C3=NC=NC(N)=C3N=C2)O)O1 ZUPXXZAVUHFCNV-UHFFFAOYSA-N 0.000 description 2
- 230000004913 activation Effects 0.000 description 2
- 210000003050 axon Anatomy 0.000 description 2
- 230000015572 biosynthetic process Effects 0.000 description 2
- 229960002685 biotin Drugs 0.000 description 2
- 235000020958 biotin Nutrition 0.000 description 2
- 239000011616 biotin Substances 0.000 description 2
- 238000004364 calculation method Methods 0.000 description 2
- 230000022131 cell cycle Effects 0.000 description 2
- 230000001413 cellular effect Effects 0.000 description 2
- 208000006990 cholangiocarcinoma Diseases 0.000 description 2
- 230000002759 chromosomal effect Effects 0.000 description 2
- 230000024321 chromosome segregation Effects 0.000 description 2
- 208000029664 classic familial adenomatous polyposis Diseases 0.000 description 2
- 150000001875 compounds Chemical class 0.000 description 2
- 239000013068 control sample Substances 0.000 description 2
- 238000007796 conventional method Methods 0.000 description 2
- 238000002790 cross-validation Methods 0.000 description 2
- 238000007405 data analysis Methods 0.000 description 2
- 230000034994 death Effects 0.000 description 2
- 238000004925 denaturation Methods 0.000 description 2
- 230000036425 denaturation Effects 0.000 description 2
- 230000000694 effects Effects 0.000 description 2
- 238000005516 engineering process Methods 0.000 description 2
- 230000002255 enzymatic effect Effects 0.000 description 2
- 210000003999 epithelial cell of bile duct Anatomy 0.000 description 2
- 230000006203 ethylation Effects 0.000 description 2
- 238000006200 ethylation reaction Methods 0.000 description 2
- 125000000524 functional group Chemical group 0.000 description 2
- 238000003384 imaging method Methods 0.000 description 2
- 230000001771 impaired effect Effects 0.000 description 2
- 238000000338 in vitro Methods 0.000 description 2
- 235000013902 inosinic acid Nutrition 0.000 description 2
- 238000003780 insertion Methods 0.000 description 2
- 230000037431 insertion Effects 0.000 description 2
- 238000002372 labelling Methods 0.000 description 2
- 108010008094 laminin alpha 3 Proteins 0.000 description 2
- 210000004072 lung Anatomy 0.000 description 2
- 238000002595 magnetic resonance imaging Methods 0.000 description 2
- 238000007726 management method Methods 0.000 description 2
- 230000035800 maturation Effects 0.000 description 2
- 238000005259 measurement Methods 0.000 description 2
- 239000012528 membrane Substances 0.000 description 2
- 201000008806 mesenchymal cell neoplasm Diseases 0.000 description 2
- 230000011987 methylation Effects 0.000 description 2
- 238000007069 methylation reaction Methods 0.000 description 2
- 230000000877 morphologic effect Effects 0.000 description 2
- 230000004942 nuclear accumulation Effects 0.000 description 2
- 239000002245 particle Substances 0.000 description 2
- 238000003068 pathway analysis Methods 0.000 description 2
- 229920001184 polypeptide Polymers 0.000 description 2
- 230000035935 pregnancy Effects 0.000 description 2
- 102000004196 processed proteins & peptides Human genes 0.000 description 2
- 108090000765 processed proteins & peptides Proteins 0.000 description 2
- 230000000306 recurrent effect Effects 0.000 description 2
- 108010039827 snRNP Core Proteins Proteins 0.000 description 2
- 238000012353 t test Methods 0.000 description 2
- 238000002560 therapeutic procedure Methods 0.000 description 2
- 125000003396 thiol group Chemical group [H]S* 0.000 description 2
- 210000001519 tissue Anatomy 0.000 description 2
- 238000012549 training Methods 0.000 description 2
- 230000035897 transcription Effects 0.000 description 2
- 230000009452 underexpressoin Effects 0.000 description 2
- 210000001631 vena cava inferior Anatomy 0.000 description 2
- 239000011534 wash buffer Substances 0.000 description 2
- 238000005406 washing Methods 0.000 description 2
- 230000036266 weeks of gestation Effects 0.000 description 2
- 102000040650 (ribonucleotides)n+m Human genes 0.000 description 1
- FALRKNHUBBKYCC-UHFFFAOYSA-N 2-(chloromethyl)pyridine-3-carbonitrile Chemical compound ClCC1=NC=CC=C1C#N FALRKNHUBBKYCC-UHFFFAOYSA-N 0.000 description 1
- KXSKAZFMTGADIV-UHFFFAOYSA-N 2-[3-(2-hydroxyethoxy)propoxy]ethanol Chemical compound OCCOCCCOCCO KXSKAZFMTGADIV-UHFFFAOYSA-N 0.000 description 1
- 101150030271 AXIN1 gene Proteins 0.000 description 1
- HRPVXLWXLXDGHG-UHFFFAOYSA-N Acrylamide Chemical compound NC(=O)C=C HRPVXLWXLXDGHG-UHFFFAOYSA-N 0.000 description 1
- 101710093498 Actin, gamma Proteins 0.000 description 1
- 108010085238 Actins Proteins 0.000 description 1
- 102000007469 Actins Human genes 0.000 description 1
- 102100034540 Adenomatous polyposis coli protein Human genes 0.000 description 1
- 101710149366 Afamin Proteins 0.000 description 1
- 102100033816 Aldehyde dehydrogenase, mitochondrial Human genes 0.000 description 1
- 101710150756 Aldehyde dehydrogenase, mitochondrial Proteins 0.000 description 1
- 102100030793 Ammonium transporter Rh type B Human genes 0.000 description 1
- 102000003989 Aurora kinases Human genes 0.000 description 1
- 108090000433 Aurora kinases Proteins 0.000 description 1
- 108010092778 Autophagy-Related Protein 7 Proteins 0.000 description 1
- 102100035683 Axin-2 Human genes 0.000 description 1
- 102000004506 Blood Proteins Human genes 0.000 description 1
- 108010017384 Blood Proteins Proteins 0.000 description 1
- 102100024505 Bone morphogenetic protein 4 Human genes 0.000 description 1
- 108091003079 Bovine Serum Albumin Proteins 0.000 description 1
- 101150037241 CTNNB1 gene Proteins 0.000 description 1
- 102000000905 Cadherin Human genes 0.000 description 1
- 108050007957 Cadherin Proteins 0.000 description 1
- 208000005623 Carcinogenesis Diseases 0.000 description 1
- 102100031608 Centlein Human genes 0.000 description 1
- 101710096681 Centlein Proteins 0.000 description 1
- 101710170304 Chromodomain-helicase-DNA-binding protein 7 Proteins 0.000 description 1
- 108010076130 Cleavage And Polyadenylation Specificity Factor Proteins 0.000 description 1
- 102000011591 Cleavage And Polyadenylation Specificity Factor Human genes 0.000 description 1
- 208000001333 Colorectal Neoplasms Diseases 0.000 description 1
- 102000016917 Complement C1 Human genes 0.000 description 1
- 108010028774 Complement C1 Proteins 0.000 description 1
- 108020004635 Complementary DNA Proteins 0.000 description 1
- 101710126411 Condensin complex subunit 1 Proteins 0.000 description 1
- 102100032952 Condensin complex subunit 3 Human genes 0.000 description 1
- 101710088194 Dehydrogenase Proteins 0.000 description 1
- 102100030074 Dickkopf-related protein 1 Human genes 0.000 description 1
- 102100037985 Dickkopf-related protein 3 Human genes 0.000 description 1
- KCXVZYZYPLLWCC-UHFFFAOYSA-N EDTA Chemical compound OC(=O)CN(CC(O)=O)CCN(CC(O)=O)CC(O)=O KCXVZYZYPLLWCC-UHFFFAOYSA-N 0.000 description 1
- 101150084967 EPCAM gene Proteins 0.000 description 1
- LFQSCWFLJHTTHZ-UHFFFAOYSA-N Ethanol Chemical compound CCO LFQSCWFLJHTTHZ-UHFFFAOYSA-N 0.000 description 1
- 201000006107 Familial adenomatous polyposis Diseases 0.000 description 1
- 238000000729 Fisher's exact test Methods 0.000 description 1
- 102000016354 Glucuronosyltransferase Human genes 0.000 description 1
- 108010092364 Glucuronosyltransferase Proteins 0.000 description 1
- 102100025961 Glutaminase liver isoform, mitochondrial Human genes 0.000 description 1
- 108010051696 Growth Hormone Proteins 0.000 description 1
- 208000032843 Hemorrhage Diseases 0.000 description 1
- 102100039999 Histone deacetylase 2 Human genes 0.000 description 1
- 101000924577 Homo sapiens Adenomatous polyposis coli protein Proteins 0.000 description 1
- 101000703292 Homo sapiens Ammonium transporter Rh type B Proteins 0.000 description 1
- 101000874569 Homo sapiens Axin-2 Proteins 0.000 description 1
- 101000762379 Homo sapiens Bone morphogenetic protein 4 Proteins 0.000 description 1
- 101000942622 Homo sapiens Condensin complex subunit 3 Proteins 0.000 description 1
- 101000864646 Homo sapiens Dickkopf-related protein 1 Proteins 0.000 description 1
- 101000951342 Homo sapiens Dickkopf-related protein 3 Proteins 0.000 description 1
- 101000951365 Homo sapiens Disks large-associated protein 5 Proteins 0.000 description 1
- 101000881778 Homo sapiens Eukaryotic translation initiation factor 3 subunit H Proteins 0.000 description 1
- 101000856993 Homo sapiens Glutaminase liver isoform, mitochondrial Proteins 0.000 description 1
- 101000981071 Homo sapiens Histone H3-like centromeric protein A Proteins 0.000 description 1
- 101001035011 Homo sapiens Histone deacetylase 2 Proteins 0.000 description 1
- 101001045123 Homo sapiens Hyccin Proteins 0.000 description 1
- 101001044371 Homo sapiens Immunoglobulin superfamily member 1 Proteins 0.000 description 1
- 101001076292 Homo sapiens Insulin-like growth factor II Proteins 0.000 description 1
- 101001033293 Homo sapiens Interleukin enhancer-binding factor 3 Proteins 0.000 description 1
- 101000972486 Homo sapiens Laminin subunit alpha-3 Proteins 0.000 description 1
- 101000896657 Homo sapiens Mitotic checkpoint serine/threonine-protein kinase BUB1 Proteins 0.000 description 1
- 101001000799 Homo sapiens Nuclear pore membrane glycoprotein 210 Proteins 0.000 description 1
- 101001109719 Homo sapiens Nucleophosmin Proteins 0.000 description 1
- 101000693243 Homo sapiens Paternally-expressed gene 3 protein Proteins 0.000 description 1
- 101001033020 Homo sapiens Platelet glycoprotein VI Proteins 0.000 description 1
- 101000928535 Homo sapiens Protein delta homolog 1 Proteins 0.000 description 1
- 101001073409 Homo sapiens Retrotransposon-derived protein PEG10 Proteins 0.000 description 1
- 101000657580 Homo sapiens Small nuclear ribonucleoprotein-associated protein N Proteins 0.000 description 1
- 101000826406 Homo sapiens Sulfotransferase 1C2 Proteins 0.000 description 1
- 101000866336 Homo sapiens Transcription factor E2F5 Proteins 0.000 description 1
- 102100022652 Hyccin Human genes 0.000 description 1
- 101710091638 Hypermethylated in cancer 2 protein Proteins 0.000 description 1
- 102100022514 Immunoglobulin superfamily member 1 Human genes 0.000 description 1
- 101710125768 Importin-4 Proteins 0.000 description 1
- 102100025947 Insulin-like growth factor II Human genes 0.000 description 1
- 108090000862 Ion Channels Proteins 0.000 description 1
- 102000004310 Ion Channels Human genes 0.000 description 1
- 208000007433 Lymphatic Metastasis Diseases 0.000 description 1
- 108091054455 MAP kinase family Proteins 0.000 description 1
- 102000043136 MAP kinase family Human genes 0.000 description 1
- 208000000172 Medulloblastoma Diseases 0.000 description 1
- 206010027459 Metastases to lymph nodes Diseases 0.000 description 1
- 241001465754 Metazoa Species 0.000 description 1
- 108010058682 Mitochondrial Proteins Proteins 0.000 description 1
- 102000006404 Mitochondrial Proteins Human genes 0.000 description 1
- 102100021691 Mitotic checkpoint serine/threonine-protein kinase BUB1 Human genes 0.000 description 1
- 108010059196 N-hydroxy-2-acetylaminofluorene sulfotransferase Proteins 0.000 description 1
- 101100384865 Neurospora crassa (strain ATCC 24698 / 74-OR23-1A / CBS 708.71 / DSM 1257 / FGSC 987) cot-1 gene Proteins 0.000 description 1
- 239000000020 Nitrocellulose Substances 0.000 description 1
- 108020004485 Nonsense Codon Proteins 0.000 description 1
- 108091028043 Nucleic acid sequence Proteins 0.000 description 1
- 102100021010 Nucleolin Human genes 0.000 description 1
- 108010025568 Nucleophosmin Proteins 0.000 description 1
- 101710093525 Nucleoporin NDC1 Proteins 0.000 description 1
- 239000004677 Nylon Substances 0.000 description 1
- 208000032366 Oversensing Diseases 0.000 description 1
- 238000012408 PCR amplification Methods 0.000 description 1
- 102100025757 Paternally-expressed gene 3 protein Human genes 0.000 description 1
- 102000004160 Phosphoric Monoester Hydrolases Human genes 0.000 description 1
- 108090000608 Phosphoric Monoester Hydrolases Proteins 0.000 description 1
- 102100038394 Platelet glycoprotein VI Human genes 0.000 description 1
- 201000010769 Prader-Willi syndrome Diseases 0.000 description 1
- 102000001708 Protein Isoforms Human genes 0.000 description 1
- 108010029485 Protein Isoforms Proteins 0.000 description 1
- 102100036467 Protein delta homolog 1 Human genes 0.000 description 1
- 108090000944 RNA Helicases Proteins 0.000 description 1
- 102000004409 RNA Helicases Human genes 0.000 description 1
- 238000011530 RNeasy Mini Kit Methods 0.000 description 1
- 102100035844 Retrotransposon-derived protein PEG10 Human genes 0.000 description 1
- 102000002278 Ribosomal Proteins Human genes 0.000 description 1
- 108010000605 Ribosomal Proteins Proteins 0.000 description 1
- 108090000776 Ribosomal protein L5 Proteins 0.000 description 1
- 101710186223 Ribosome biogenesis protein BOP1 Proteins 0.000 description 1
- 102100036202 Serum amyloid P-component Human genes 0.000 description 1
- 102100038803 Somatotropin Human genes 0.000 description 1
- 238000000692 Student's t-test Methods 0.000 description 1
- 108010002687 Survivin Proteins 0.000 description 1
- 102000000763 Survivin Human genes 0.000 description 1
- 101150057140 TACSTD1 gene Proteins 0.000 description 1
- 238000012338 Therapeutic targeting Methods 0.000 description 1
- 102000040945 Transcription factor Human genes 0.000 description 1
- 108091023040 Transcription factor Proteins 0.000 description 1
- 108020004566 Transfer RNA Proteins 0.000 description 1
- 206010070627 Tumour rupture Diseases 0.000 description 1
- FJWGYAHXMCUOOM-QHOUIDNNSA-N [(2s,3r,4s,5r,6r)-2-[(2r,3r,4s,5r,6s)-4,5-dinitrooxy-2-(nitrooxymethyl)-6-[(2r,3r,4s,5r,6s)-4,5,6-trinitrooxy-2-(nitrooxymethyl)oxan-3-yl]oxyoxan-3-yl]oxy-3,5-dinitrooxy-6-(nitrooxymethyl)oxan-4-yl] nitrate Chemical compound O([C@@H]1O[C@@H]([C@H]([C@H](O[N+]([O-])=O)[C@H]1O[N+]([O-])=O)O[C@H]1[C@@H]([C@@H](O[N+]([O-])=O)[C@H](O[N+]([O-])=O)[C@@H](CO[N+]([O-])=O)O1)O[N+]([O-])=O)CO[N+](=O)[O-])[C@@H]1[C@@H](CO[N+]([O-])=O)O[C@@H](O[N+]([O-])=O)[C@H](O[N+]([O-])=O)[C@H]1O[N+]([O-])=O FJWGYAHXMCUOOM-QHOUIDNNSA-N 0.000 description 1
- JLCPHMBAVCMARE-UHFFFAOYSA-N [3-[[3-[[3-[[3-[[3-[[3-[[3-[[3-[[3-[[3-[[3-[[5-(2-amino-6-oxo-1H-purin-9-yl)-3-[[3-[[3-[[3-[[3-[[3-[[5-(2-amino-6-oxo-1H-purin-9-yl)-3-[[5-(2-amino-6-oxo-1H-purin-9-yl)-3-hydroxyoxolan-2-yl]methoxy-hydroxyphosphoryl]oxyoxolan-2-yl]methoxy-hydroxyphosphoryl]oxy-5-(5-methyl-2,4-dioxopyrimidin-1-yl)oxolan-2-yl]methoxy-hydroxyphosphoryl]oxy-5-(6-aminopurin-9-yl)oxolan-2-yl]methoxy-hydroxyphosphoryl]oxy-5-(6-aminopurin-9-yl)oxolan-2-yl]methoxy-hydroxyphosphoryl]oxy-5-(6-aminopurin-9-yl)oxolan-2-yl]methoxy-hydroxyphosphoryl]oxy-5-(6-aminopurin-9-yl)oxolan-2-yl]methoxy-hydroxyphosphoryl]oxyoxolan-2-yl]methoxy-hydroxyphosphoryl]oxy-5-(5-methyl-2,4-dioxopyrimidin-1-yl)oxolan-2-yl]methoxy-hydroxyphosphoryl]oxy-5-(4-amino-2-oxopyrimidin-1-yl)oxolan-2-yl]methoxy-hydroxyphosphoryl]oxy-5-(5-methyl-2,4-dioxopyrimidin-1-yl)oxolan-2-yl]methoxy-hydroxyphosphoryl]oxy-5-(5-methyl-2,4-dioxopyrimidin-1-yl)oxolan-2-yl]methoxy-hydroxyphosphoryl]oxy-5-(6-aminopurin-9-yl)oxolan-2-yl]methoxy-hydroxyphosphoryl]oxy-5-(6-aminopurin-9-yl)oxolan-2-yl]methoxy-hydroxyphosphoryl]oxy-5-(4-amino-2-oxopyrimidin-1-yl)oxolan-2-yl]methoxy-hydroxyphosphoryl]oxy-5-(4-amino-2-oxopyrimidin-1-yl)oxolan-2-yl]methoxy-hydroxyphosphoryl]oxy-5-(4-amino-2-oxopyrimidin-1-yl)oxolan-2-yl]methoxy-hydroxyphosphoryl]oxy-5-(6-aminopurin-9-yl)oxolan-2-yl]methoxy-hydroxyphosphoryl]oxy-5-(4-amino-2-oxopyrimidin-1-yl)oxolan-2-yl]methyl [5-(6-aminopurin-9-yl)-2-(hydroxymethyl)oxolan-3-yl] hydrogen phosphate Polymers Cc1cn(C2CC(OP(O)(=O)OCC3OC(CC3OP(O)(=O)OCC3OC(CC3O)n3cnc4c3nc(N)[nH]c4=O)n3cnc4c3nc(N)[nH]c4=O)C(COP(O)(=O)OC3CC(OC3COP(O)(=O)OC3CC(OC3COP(O)(=O)OC3CC(OC3COP(O)(=O)OC3CC(OC3COP(O)(=O)OC3CC(OC3COP(O)(=O)OC3CC(OC3COP(O)(=O)OC3CC(OC3COP(O)(=O)OC3CC(OC3COP(O)(=O)OC3CC(OC3COP(O)(=O)OC3CC(OC3COP(O)(=O)OC3CC(OC3COP(O)(=O)OC3CC(OC3COP(O)(=O)OC3CC(OC3COP(O)(=O)OC3CC(OC3COP(O)(=O)OC3CC(OC3COP(O)(=O)OC3CC(OC3COP(O)(=O)OC3CC(OC3CO)n3cnc4c(N)ncnc34)n3ccc(N)nc3=O)n3cnc4c(N)ncnc34)n3ccc(N)nc3=O)n3ccc(N)nc3=O)n3ccc(N)nc3=O)n3cnc4c(N)ncnc34)n3cnc4c(N)ncnc34)n3cc(C)c(=O)[nH]c3=O)n3cc(C)c(=O)[nH]c3=O)n3ccc(N)nc3=O)n3cc(C)c(=O)[nH]c3=O)n3cnc4c3nc(N)[nH]c4=O)n3cnc4c(N)ncnc34)n3cnc4c(N)ncnc34)n3cnc4c(N)ncnc34)n3cnc4c(N)ncnc34)O2)c(=O)[nH]c1=O JLCPHMBAVCMARE-UHFFFAOYSA-N 0.000 description 1
- SXEHKFHPFVVDIR-UHFFFAOYSA-N [4-(4-hydrazinylphenyl)phenyl]hydrazine Chemical compound C1=CC(NN)=CC=C1C1=CC=C(NN)C=C1 SXEHKFHPFVVDIR-UHFFFAOYSA-N 0.000 description 1
- 230000003187 abdominal effect Effects 0.000 description 1
- 230000001594 aberrant effect Effects 0.000 description 1
- 101150055123 afp gene Proteins 0.000 description 1
- 125000000266 alpha-aminoacyl group Chemical group 0.000 description 1
- 150000001413 amino acids Chemical class 0.000 description 1
- 238000004873 anchoring Methods 0.000 description 1
- 208000036878 aneuploidy Diseases 0.000 description 1
- 231100001075 aneuploidy Toxicity 0.000 description 1
- 238000000137 annealing Methods 0.000 description 1
- 239000005557 antagonist Substances 0.000 description 1
- 230000002424 anti-apoptotic effect Effects 0.000 description 1
- 239000000427 antigen Substances 0.000 description 1
- 108091007433 antigens Proteins 0.000 description 1
- 102000036639 antigens Human genes 0.000 description 1
- 230000003305 autocrine Effects 0.000 description 1
- 230000008901 benefit Effects 0.000 description 1
- 239000013060 biological fluid Substances 0.000 description 1
- 210000004369 blood Anatomy 0.000 description 1
- 239000008280 blood Substances 0.000 description 1
- 238000009534 blood test Methods 0.000 description 1
- 229940098773 bovine serum albumin Drugs 0.000 description 1
- 210000000481 breast Anatomy 0.000 description 1
- 238000010804 cDNA synthesis Methods 0.000 description 1
- 230000036952 cancer formation Effects 0.000 description 1
- 208000035269 cancer or benign tumor Diseases 0.000 description 1
- 231100000504 carcinogenesis Toxicity 0.000 description 1
- 230000015556 catabolic process Effects 0.000 description 1
- 230000011748 cell maturation Effects 0.000 description 1
- 230000005859 cell recognition Effects 0.000 description 1
- 230000009134 cell regulation Effects 0.000 description 1
- 210000003793 centrosome Anatomy 0.000 description 1
- 230000002490 cerebral effect Effects 0.000 description 1
- 210000000349 chromosome Anatomy 0.000 description 1
- 239000007979 citrate buffer Substances 0.000 description 1
- 238000007635 classification algorithm Methods 0.000 description 1
- 210000001072 colon Anatomy 0.000 description 1
- 230000000052 comparative effect Effects 0.000 description 1
- 238000000205 computational method Methods 0.000 description 1
- 238000002591 computed tomography Methods 0.000 description 1
- 230000001276 controlling effect Effects 0.000 description 1
- 230000001955 cumulated effect Effects 0.000 description 1
- 238000012303 cytoplasmic staining Methods 0.000 description 1
- 210000004292 cytoskeleton Anatomy 0.000 description 1
- DTPCFIHYWYONMD-UHFFFAOYSA-N decaethylene glycol Chemical compound OCCOCCOCCOCCOCCOCCOCCOCCOCCOCCO DTPCFIHYWYONMD-UHFFFAOYSA-N 0.000 description 1
- 230000003247 decreasing effect Effects 0.000 description 1
- 230000007547 defect Effects 0.000 description 1
- 238000006731 degradation reaction Methods 0.000 description 1
- 238000001514 detection method Methods 0.000 description 1
- CDMADVZSLOHIFP-UHFFFAOYSA-N disodium;3,7-dioxido-2,4,6,8,9-pentaoxa-1,3,5,7-tetraborabicyclo[3.3.1]nonane;decahydrate Chemical compound O.O.O.O.O.O.O.O.O.O.[Na+].[Na+].O1B([O-])OB2OB([O-])OB1O2 CDMADVZSLOHIFP-UHFFFAOYSA-N 0.000 description 1
- 238000010494 dissociation reaction Methods 0.000 description 1
- 230000005593 dissociations Effects 0.000 description 1
- 230000036267 drug metabolism Effects 0.000 description 1
- 230000009977 dual effect Effects 0.000 description 1
- 230000013020 embryo development Effects 0.000 description 1
- 210000001671 embryonic stem cell Anatomy 0.000 description 1
- YQGOJNYOYNNSMM-UHFFFAOYSA-N eosin Chemical compound [Na+].OC(=O)C1=CC=CC=C1C1=C2C=C(Br)C(=O)C(Br)=C2OC2=C(Br)C(O)=C(Br)C=C21 YQGOJNYOYNNSMM-UHFFFAOYSA-N 0.000 description 1
- 210000002919 epithelial cell Anatomy 0.000 description 1
- 230000007705 epithelial mesenchymal transition Effects 0.000 description 1
- 210000000981 epithelium Anatomy 0.000 description 1
- 238000012869 ethanol precipitation Methods 0.000 description 1
- 238000010195 expression analysis Methods 0.000 description 1
- 230000003176 fibrotic effect Effects 0.000 description 1
- 238000001914 filtration Methods 0.000 description 1
- 239000012467 final product Substances 0.000 description 1
- 238000011223 gene expression profiling Methods 0.000 description 1
- 230000037442 genomic alteration Effects 0.000 description 1
- 230000012010 growth Effects 0.000 description 1
- 239000000122 growth hormone Substances 0.000 description 1
- 101150072154 hb gene Proteins 0.000 description 1
- 230000003862 health status Effects 0.000 description 1
- 230000010224 hepatic metabolism Effects 0.000 description 1
- 210000002989 hepatic vein Anatomy 0.000 description 1
- 230000003118 histopathologic effect Effects 0.000 description 1
- 238000010191 image analysis Methods 0.000 description 1
- 238000002991 immunohistochemical analysis Methods 0.000 description 1
- AMGQUBHHOARCQH-UHFFFAOYSA-N indium;oxotin Chemical compound [In].[Sn]=O AMGQUBHHOARCQH-UHFFFAOYSA-N 0.000 description 1
- 230000006698 induction Effects 0.000 description 1
- 230000003993 interaction Effects 0.000 description 1
- 230000007154 intracellular accumulation Effects 0.000 description 1
- 238000007912 intraperitoneal administration Methods 0.000 description 1
- 230000009545 invasion Effects 0.000 description 1
- 238000002955 isolation Methods 0.000 description 1
- 210000003734 kidney Anatomy 0.000 description 1
- 229910001629 magnesium chloride Inorganic materials 0.000 description 1
- 239000006249 magnetic particle Substances 0.000 description 1
- 230000036210 malignancy Effects 0.000 description 1
- 230000003211 malignant effect Effects 0.000 description 1
- 238000013507 mapping Methods 0.000 description 1
- 239000003550 marker Substances 0.000 description 1
- 238000004949 mass spectrometry Methods 0.000 description 1
- 239000011159 matrix material Substances 0.000 description 1
- 230000007246 mechanism Effects 0.000 description 1
- 230000001404 mediated effect Effects 0.000 description 1
- 230000002503 metabolic effect Effects 0.000 description 1
- 230000004060 metabolic process Effects 0.000 description 1
- 238000010208 microarray analysis Methods 0.000 description 1
- 230000001617 migratory effect Effects 0.000 description 1
- 230000017205 mitotic cell cycle checkpoint Effects 0.000 description 1
- 230000000394 mitotic effect Effects 0.000 description 1
- 230000004048 modification Effects 0.000 description 1
- 238000012986 modification Methods 0.000 description 1
- 210000003205 muscle Anatomy 0.000 description 1
- 230000000869 mutational effect Effects 0.000 description 1
- 230000001338 necrotic effect Effects 0.000 description 1
- 229920001220 nitrocellulos Polymers 0.000 description 1
- 230000037434 nonsense mutation Effects 0.000 description 1
- 238000012758 nuclear staining Methods 0.000 description 1
- 108010044762 nucleolin Proteins 0.000 description 1
- 230000030648 nucleus localization Effects 0.000 description 1
- 229920001778 nylon Polymers 0.000 description 1
- 238000002966 oligonucleotide array Methods 0.000 description 1
- 210000000056 organ Anatomy 0.000 description 1
- 230000003076 paracrine Effects 0.000 description 1
- 238000001558 permutation test Methods 0.000 description 1
- 210000003240 portal vein Anatomy 0.000 description 1
- 230000037452 priming Effects 0.000 description 1
- 108010028138 prohibitin Proteins 0.000 description 1
- 102000016670 prohibitin Human genes 0.000 description 1
- 238000011158 quantitative evaluation Methods 0.000 description 1
- 108010062212 ran-binding protein 1 Proteins 0.000 description 1
- 108010013519 rat ribosomal protein L8 Proteins 0.000 description 1
- 210000000664 rectum Anatomy 0.000 description 1
- 238000000611 regression analysis Methods 0.000 description 1
- 230000022983 regulation of cell cycle Effects 0.000 description 1
- 230000001105 regulatory effect Effects 0.000 description 1
- 230000004044 response Effects 0.000 description 1
- 238000003757 reverse transcription PCR Methods 0.000 description 1
- 210000003705 ribosome Anatomy 0.000 description 1
- 230000028706 ribosome biogenesis Effects 0.000 description 1
- 150000003839 salts Chemical class 0.000 description 1
- 208000011581 secondary neoplasm Diseases 0.000 description 1
- 230000007781 signaling event Effects 0.000 description 1
- 239000000377 silicon dioxide Substances 0.000 description 1
- 238000011524 similarity measure Methods 0.000 description 1
- 235000010339 sodium tetraborate Nutrition 0.000 description 1
- 230000020347 spindle assembly Effects 0.000 description 1
- 230000024355 spindle assembly checkpoint Effects 0.000 description 1
- 238000013097 stability assessment Methods 0.000 description 1
- 238000013517 stratification Methods 0.000 description 1
- 229940014800 succinic anhydride Drugs 0.000 description 1
- 208000024891 symptom Diseases 0.000 description 1
- 208000011580 syndromic disease Diseases 0.000 description 1
- 230000001225 therapeutic effect Effects 0.000 description 1
- 238000003325 tomography Methods 0.000 description 1
- 108091006105 transcriptional corepressors Proteins 0.000 description 1
- 238000011222 transcriptome analysis Methods 0.000 description 1
- 230000009466 transformation Effects 0.000 description 1
- 108091008578 transmembrane receptors Proteins 0.000 description 1
- 102000027257 transmembrane receptors Human genes 0.000 description 1
- 230000004614 tumor growth Effects 0.000 description 1
- 238000002604 ultrasonography Methods 0.000 description 1
- 238000010200 validation analysis Methods 0.000 description 1
- 239000013598 vector Substances 0.000 description 1
- 238000012800 visualization Methods 0.000 description 1
- XLYOFNOQVPJJNP-UHFFFAOYSA-N water Substances O XLYOFNOQVPJJNP-UHFFFAOYSA-N 0.000 description 1
Images







Classifications
-
- C—CHEMISTRY; METALLURGY
- C12—BIOCHEMISTRY; BEER; SPIRITS; WINE; VINEGAR; MICROBIOLOGY; ENZYMOLOGY; MUTATION OR GENETIC ENGINEERING
- C12Q—MEASURING OR TESTING PROCESSES INVOLVING ENZYMES, NUCLEIC ACIDS OR MICROORGANISMS; COMPOSITIONS OR TEST PAPERS THEREFOR; PROCESSES OF PREPARING SUCH COMPOSITIONS; CONDITION-RESPONSIVE CONTROL IN MICROBIOLOGICAL OR ENZYMOLOGICAL PROCESSES
- C12Q1/00—Measuring or testing processes involving enzymes, nucleic acids or microorganisms; Compositions therefor; Processes of preparing such compositions
- C12Q1/68—Measuring or testing processes involving enzymes, nucleic acids or microorganisms; Compositions therefor; Processes of preparing such compositions involving nucleic acids
- C12Q1/6876—Nucleic acid products used in the analysis of nucleic acids, e.g. primers or probes
- C12Q1/6883—Nucleic acid products used in the analysis of nucleic acids, e.g. primers or probes for diseases caused by alterations of genetic material
- C12Q1/6886—Nucleic acid products used in the analysis of nucleic acids, e.g. primers or probes for diseases caused by alterations of genetic material for cancer
-
- C—CHEMISTRY; METALLURGY
- C12—BIOCHEMISTRY; BEER; SPIRITS; WINE; VINEGAR; MICROBIOLOGY; ENZYMOLOGY; MUTATION OR GENETIC ENGINEERING
- C12Q—MEASURING OR TESTING PROCESSES INVOLVING ENZYMES, NUCLEIC ACIDS OR MICROORGANISMS; COMPOSITIONS OR TEST PAPERS THEREFOR; PROCESSES OF PREPARING SUCH COMPOSITIONS; CONDITION-RESPONSIVE CONTROL IN MICROBIOLOGICAL OR ENZYMOLOGICAL PROCESSES
- C12Q2600/00—Oligonucleotides characterized by their use
- C12Q2600/112—Disease subtyping, staging or classification
-
- C—CHEMISTRY; METALLURGY
- C12—BIOCHEMISTRY; BEER; SPIRITS; WINE; VINEGAR; MICROBIOLOGY; ENZYMOLOGY; MUTATION OR GENETIC ENGINEERING
- C12Q—MEASURING OR TESTING PROCESSES INVOLVING ENZYMES, NUCLEIC ACIDS OR MICROORGANISMS; COMPOSITIONS OR TEST PAPERS THEREFOR; PROCESSES OF PREPARING SUCH COMPOSITIONS; CONDITION-RESPONSIVE CONTROL IN MICROBIOLOGICAL OR ENZYMOLOGICAL PROCESSES
- C12Q2600/00—Oligonucleotides characterized by their use
- C12Q2600/118—Prognosis of disease development
-
- C—CHEMISTRY; METALLURGY
- C12—BIOCHEMISTRY; BEER; SPIRITS; WINE; VINEGAR; MICROBIOLOGY; ENZYMOLOGY; MUTATION OR GENETIC ENGINEERING
- C12Q—MEASURING OR TESTING PROCESSES INVOLVING ENZYMES, NUCLEIC ACIDS OR MICROORGANISMS; COMPOSITIONS OR TEST PAPERS THEREFOR; PROCESSES OF PREPARING SUCH COMPOSITIONS; CONDITION-RESPONSIVE CONTROL IN MICROBIOLOGICAL OR ENZYMOLOGICAL PROCESSES
- C12Q2600/00—Oligonucleotides characterized by their use
- C12Q2600/158—Expression markers
Definitions
- the tumor originates from a patient having a Caucasian origin, in particular European, North American, Australian, New-Zealander or Orientalizers.
- steps carried out for assaying the gene expression must not alter the qualitative or the quantitative expression (number of copies) of the expression product(s) or of the nucleotide target(s), or must not interfere with the subsequent step comprising assaying the qualitative or the quantitative expression of said expression product(s) or nucleotide target(s).
- Additional genes may be selected for the difference of expression observed between the various grades of liver cancer, in particular between a tumor of good prognosis and a tumor of poor prognosis.
- Table 1 symbol Gene name mRNA SEQ ID Accession No Location Function Protein SEQ ID AFP alpha-fetoprotein 1 NM_001134 4q11-q13 plasma protein synthesized by the fetal liver 2 ALDH2 aldehyde dehydrogenase 2 family (mitochondrial) 3 NM_000690 12q24.2 liver enzyme involved in alcohol metabolism 4 APCS amyloid P component, serum 5 NM_001639 1q21-q23 secreted glycoprotein 6 APOC4 apolipoprotein C-IV 7 NM_001646 19q13.2 secreted liver protein 8 AQP9 aquaporin 9 9 NM_020980 15q22.1-22.2 water-selective membrane channel 10 BUB1 BUB1 budding uninhibited by benzimidazoles 1 homolog (yeast)
- Reference samples which can be used for comparison with the gene expression profile of a tumor to be tested are one or several sample(s) representative for tumor with poor prognosis (such as C2), one or several sample(s) representative of tumor with good prognosis (such as C1), one or several sample(s) of a normal adult liver and/or one or several sample(s) of a fetal liver.
- Table 4 lists the level of expression of each gene of Table 1 depending upon the status of the reference sample i . e ., robust tumor with poor prognostic and robust tumor with good prognostic.
- An example of method to identify such robust tumors is provided in the examples, and in particular in paragraphs [140] to [143].
- the various primers when the pairs of primers are used in a simultaneous amplification reaction carried out on the sample, the various primers have the capacity to hybridize with their respective nucleotide targets at the same temperature and in the same conditions.
Landscapes
- Chemical & Material Sciences (AREA)
- Life Sciences & Earth Sciences (AREA)
- Health & Medical Sciences (AREA)
- Organic Chemistry (AREA)
- Proteomics, Peptides & Aminoacids (AREA)
- Engineering & Computer Science (AREA)
- Immunology (AREA)
- Pathology (AREA)
- Analytical Chemistry (AREA)
- Zoology (AREA)
- Genetics & Genomics (AREA)
- Wood Science & Technology (AREA)
- Physics & Mathematics (AREA)
- Biotechnology (AREA)
- Microbiology (AREA)
- Molecular Biology (AREA)
- Hospice & Palliative Care (AREA)
- Biophysics (AREA)
- Oncology (AREA)
- Biochemistry (AREA)
- Bioinformatics & Cheminformatics (AREA)
- General Engineering & Computer Science (AREA)
- General Health & Medical Sciences (AREA)
- Measuring Or Testing Involving Enzymes Or Micro-Organisms (AREA)
Abstract
Description
- The present invention relates to a method to in vitro determine the grade of a liver tumor in a sample previously obtained from a patient, using a molecular signature based on the expression of a set of genes comprising at least 2, especially has or consist of 2 to 16 genes, preferably a set of 16 genes. In a particular embodiment, the method focuses on hepatoblastoma (HB) or hepatocellular carcinoma (HCC), in adults or in children. The invention is also directed to sets of primers, sets of probes, compositions, kits or arrays, comprising primers or probes specific for a set of genes comprising at least 2 genes, especially has or consists of 2 to 16 genes, preferably exactly 16 genes. Said sets, kits and arrays are tools suitable to determine the grade of a liver tumor in a patient.
- The liver is a common site of metastases from a variety of organs such as lung, breast, colon and rectum. However, liver is also a site of different kinds of cancerous tumors that start in the liver (primary liver cancers). The most frequent is the Hepatocellular Carcinoma (HCC) (about 3 out of 4 primary liver cancers are this type) and is mainly diagnosed in adults. In the United States approximately 10,000 new patients are diagnosed with hepatocellular carcinoma each year. Less frequent liver tumours are cholangiocarcinoma (CC) in adults and hepatoblastoma (HB) in children.
- The prognosis and treatment options associated with these different kinds of cancers is difficult to predict, and is dependent in particular on the stage of the cancer (such as the size of the tumor, whether it affects part or all of the liver, has spread to other places in the body or its aggressiveness). Therefore, it is important for clinicians and physicians to establish a classification of primary liver cancers (HCC or HB) to propose the most appropriate treatment and adopt the most appropriate surgery strategy. Some factors are currently used (degree of local invasion, histological types of cancer with specific grading, tumour markers and general status of the patient) but have been found to not be accurate and sufficient enough to ensure a correct classification.
- As far as the HB is concerned, the PRETEXT (pre-treatment extent of disease) system designed by the International Childhood Liver Tumor Strategy Group (SIOPEL) is a non invasive technique commonly used by clinicians, to assess the extent of liver cancer, to determine the time of surgery and to adapt the treatment protocol. This system is based on the division of the liver in four parts and the determination of the number of liver sections that are free of tumor (Aronson et al. 2005; Journal of Clinical Oncology; 23(6): 1245-1252). A revised staging system taking into account other criteria, such as caudate lobe involvement, extrahepatic abdominal disease, tumor focality, tumor rupture or intraperitoneal haemorrhage, distant metastases, lymph node metastases, portal vein involvement and involvement of the IVC (inferior vena cava) and/or hepatic veins, has been recently proposed (Roebuck; 2007; Pediatr Radiol; 37: 123-132). However, the PRETEXT system, even if reproducible and providing good prognostic value, is based on imaging and clinical symptoms, making this system dependent upon the technicians and clinicians. There is thus a need for a system, complementary to the PRETEXT system, based on genetic and molecular features of the liver tumors.
- The present invention concerns a method or process of profiling gene expression for a set of genes, in a sample previously obtained from a patient diagnosed for a liver tumor. In a particular embodiment said method is designed to determine the grade of a liver tumor in a patient.
- By "liver tumor" or "hepatic tumor", it is meant a tumor originating from the liver of a patient, which is a malignant tumor (comprising cancerous cells), as opposed to a benign tumor (non cancerous) which is explicitly excluded. Malignant liver tumors encompass two main kinds of tumors: hepatoblastoma (HB) or hepatocellular carcinoma (HCC). These two tumor types can be assayed for the presently reported molecular signature. However, the present method may also be used to assay malignant liver tumors which are classified as unspecified (non-HB, non-HCC).
- The present method may be used to determine the grade of a liver tumor or several liver tumors of the same patient, depending on the extent of the liver cancer. For convenience, the expression "a liver tumor" will be used throughout the specification to possibly apply to "one or several liver tumor(s)". The term "neoplasm" may also be used as a synonymous of "tumor".
- In a particular embodiment, the tumor whose grade has to be determined is located in the liver. The presence of the tumor(s) in the liver may be diagnosed by ultrasound scan, x-rays, blood test, CT scans (computerised tomography) and/or MRI scans (magnetic resonance imaging).
- In a particular embodiment, the tumor, although originating from the liver, has extended to other tissues or has given rise to metastasis.
- In a particular embodiment, the patient is a child i.e., a human host who is under 20 years of age according to the present application. Therefore, in a particular embodiment, the liver tumor is a paediatric HB or a paediatric HCC. In another embodiment, the liver tumor is an adult HCC.
- A grade is defined as a subclass of the liver tumor, corresponding to prognostic factors, such as tumor status, liver function and general health status. The present method of the invention allows or at least contributes to differentiating liver tumors having a good prognosis from tumors with a bad prognosis, in terms of evolution of the patient's disease. A good prognosis tumor is defined as a tumor with good survival probability for the patient (more than 80% survival at two years for HB and more than50% survival at two years for HCC), low probability of metastases and good response to treatment for the patient. In contrast, a bad prognosis tumor is defined as a tumor with an advanced stage, such as one having vascular invasion or/and extrahepatic metastasis, and associated with a low survival probability for the patient (less than 50% survival et two years).
- The method of the invention is carried out on a sample isolated from the patient who has previously been diagnosed for the tumor(s) and who, optionally, may have been treated by surgery. In a preferred embodiment, the sample is the liver tumor or of one of the liver tumors identified by diagnosis imaging and obtained by surgery or a biopsy of this tumor. The tumor located in the liver tumor is called the primary tumor.
- In another embodiment, the sample is not the liver tumor, but is representative of this tumor. By "representative", it is meant that the sample is regarded as having the same features as the primary tumors, when considering the gene expression profile assayed in the present invention. Therefore, the sample may also consist of metastatic cells (secondary tumors spread into different part(s) of the body) or of a biological fluid containing cancerous cells (such as blood).
- One advantage of the method of the present invention is that, despite the possible heterogeneity of some liver tumors (comprising epithelial tumor cells at different stages of liver differentiation within the same tumor), the assay has proved to be reproducible and efficient on liver tumor biopsies obtained from any part of the whole tumor. Therefore, there is no requirement for the isolation of cells presenting particular features except from the fact that they are obtained from a liver tumor or are representative thereof, to carry out the gene expression profile assay.
- In a particular embodiment, the tumor originates from a patient having a Caucasian origin, in particular European, North American, Australian, New-Zealander or Afrikaners.
- In a first step, the method or process of the invention comprises assaying the expression level of a set of genes in a sample, in order to get an expression profile thereof.
- By "expression of a set of genes" (or "gene expression"), it is meant assaying, in particular detecting, the product or several products resulting from the expression of a gene, this product being in the form of a nucleic acid, especially RNA, mRNA, cDNA, polypeptide, protein or any other formats. In a particular embodiment, the assay of the gene expression profile comprises detecting a set of nucleotide targets, each nucleotide target corresponding to the expression product of a gene encompassed in the set.
- The expression "nucleotide target" means a nucleic acid molecule whose expression must be measured, preferably quantitatively measured. By "expression measured", it is meant that the expression product(s), in particular the transcription product(s) of a gene, are measured. By "quantitative" it is meant that the method is used to determine the quantity or the number of copies of the expression products, in particular the transcription products or nucleotide targets, originally present in the sample. This must be opposed to the qualitative measurement, whose aim is to determine the presence or absence of said expression product(s) only.
- A nucleotide target is in particular a RNA, and most particularly a total RNA. In a preferred embodiment, the nucleotide target is mRNA or transcripts. According to the methods used to measure the gene expression level, the mRNA initially present in the sample may be used to obtain cDNA or cRNA, which is then detected and possibly measured.
- In an embodiment, the expression of the gene is assayed directly on the sample, in particular in the tumor. In an alternative embodiment, the expression products or the nucleotide targets are prepared from the sample, in particular are isolated or even purified. When the nucleotide targets are mRNA, a further step comprising or consisting in the retro-transcription of said mRNA into cDNA (complementary DNA) may also be performed prior to the step of detecting expression. Optionally, the cDNA may also be transcribed in vitro to provide cRNA.
- During the step of preparation, and before assaying the expression, the expression product(s) or the nucleotide target(s) may be labelled, with isotopic (such as radioactive) or non isotopic (such as fluorescent, coloured, luminescent, affinity, enzymatic, magnetic, thermal or electrical) markers or labels.
- It is noteworthy that steps carried out for assaying the gene expression must not alter the qualitative or the quantitative expression (number of copies) of the expression product(s) or of the nucleotide target(s), or must not interfere with the subsequent step comprising assaying the qualitative or the quantitative expression of said expression product(s) or nucleotide target(s).
- The step of profiling gene expression comprises determining the expression of a set of genes. Such a set is defined as a group of genes that must be assayed for one test, and especially performed at the same time, on the same patient's sample. A set comprises at least 2 and has especially from 2 to 16 genes, said 2 to 16 genes being chosen from the 16 following genes: alpha-fetoprotein (AFP), aldehyde dehydrogenase 2 (ALDH2), amyloid P component serum (APCS), apolipoprotein C-IV (APOC4), aquaporin 9 (AQP9), budding uninhibited by benzimidazoles 1 (BUB1), complement componant 1 (C1S), cytochrome p450 2E1 (CYP2E1), discs large homolog 7 (DLG7), dual specificity phosphatase 9 (DUSP9), E2F5 transcription factor (E2F5), growth hormone receptor (GHR), 4-hydroxyphenylpyruvase dioxygenase (HPD), immunoglogulin superfamily member 1 (IGSF1), Notchless homolog 1 (NLE1) and the ribosomal protein L10a (RPL10A) genes.
- A complete description of these 16 genes is given in Table 1. This table lists, from left to right, the symbol of the gene, the complete name of the gene, the number of the SEQ ID provided in the sequence listing, the Accession Number from the NCBI database on June 2008, the human chromosomal location and the reported function (when known).
- A set of genes comprises at least 2 out the 16 genes of Table 1, and particularly at least or exactly 2, 3, 4, 5, 6, 7, 8, 9, 10, 11, 12, 13, 14 or 15 out of the 16 genes of Table 1. In a particular embodiment, the set comprises or consists of the 16 genes of Table 1 i.e., the set of genes comprises or consists of AFP, ALDH2, APCS, APOC4, AQP9, BUB1, C1 S, CYP2E1, DLG7, DUSP9, E2F5, GHR, HPD, IGSF1, NLE1 and RPL10A genes.
- In other particular embodiments, the set of genes comprises or consists of one of the following sets: (a) the E2F5 and HPD genes, (b) the APCS, BUB1, E2F5, GHR and HPD genes, (c) the ALDH2, APCS, APOC4, BUB1, C1S, CYP2E1, E2F5, GHR and HPD genes, (d) the ALDH2, APCS, APOC4, AQP9, BUB1, C1S, DUSP9, E2F5 and RPL10A genes, or (e) the ALDH2, APCS, APOC4, AQP9, C1S, CYP2E1, E2F5, GHR, IGSF1 and RPL10A genes.
- As indicated by the expression "comprises from 2 to 16 genes of Table 1", the set may, besides the specific genes of Table 1, contain additional genes not listed in Table 1. This means that the set must comprises from 2 to 16 genes of Table 1, i.e. 2 to 16 genes of Table 1 (in particular 2, 3, 4, 5, 6, 7, 8, 9, 10, 11, 12, 13, 14, 15, or 16 genes), and optionally comprises one or more additional genes.
- Additional genes may be selected for the difference of expression observed between the various grades of liver cancer, in particular between a tumor of good prognosis and a tumor of poor prognosis.
Table 1 symbol Gene name mRNA SEQ ID Accession No Location Function Protein SEQ ID AFP alpha-fetoprotein 1 NM_001134 4q11-q13 plasma protein synthesized by the fetal liver 2 ALDH2 aldehyde dehydrogenase 2 family (mitochondrial) 3 NM_000690 12q24.2 liver enzyme involved in alcohol metabolism 4 APCS amyloid P component, serum 5 NM_001639 1q21-q23 secreted glycoprotein 6 APOC4 apolipoprotein C-IV 7 NM_001646 19q13.2 secreted liver protein 8 AQP9 aquaporin 9 9 NM_020980 15q22.1-22.2 water-selective membrane channel 10 BUB1 BUB1 budding uninhibited by benzimidazoles 1 homolog (yeast) 11 AF043294 2q14 kinase involved in spindle checkpoint 12 C1S complement component 1, s subcomponent 13 M18767 12p13 component of the cleavage and polyadenylation specificity factor complex 14 CYP2E1 cytochrome P450, family 2, subfamily E, polypeptide 1 15 AF182276 10q24.3-qter cytochrome P450 family member involved in drug metabolism 16 DLG7 discs, large homolog7 (Drosophila) (DLGAP5) 17 NM_014750 14q22.3 cell cycle regulator involved in kinetocore formation 18 DUSP9 dual specificity phosphatase 9 19 NM_001395 Xq28 phosphatase involved in regulation of MAP Kinases 20 E2F5 E2F transcription factor 5, p130-binding 21 U15642 8q21.2 transcription factor involved in cell cycle regulation 22 GHR Growth hormone receptor 23 NM_000163 5p13-p12 transmembrane receptor for growth hormone 24 HPD 4-hydroxyphenylpyruvate dioxygenase 25 NM_002150 12q24-qter enzyme involved in amino-acid degradation 26 IGSF1 immunoglobulin superfamily, member 1 27 NM_001555 Xq25 cell recognition and regulation of cell behavior 28 NLE1 notchless homolog 1 (Drosophila) 29 NM_018096 17q12 unknown 30 RPL10A ribosomal protein L10a 31 NM_007104 6p21.3-p21.2 ribosomal protein of 60S subunit 32 - . The invention also relates to a set of genes comprising or consisting of the 16 genes of Table 1 (i.e., AFP, ALDH2, APCS, APOC4, AQP9, BUB1, C1S, CYP2E1, DLG7, DUSP9, E2F5, GHR, HPD, IGSF1, NLE1 and RPL10A genes), in which 1, 2, 3, 4 or 5 genes out of the 16 genes are substituted by a gene presenting the same features in terms of difference of expression between a tumor of a good prognosis and a tumor of poor prognosis.
- In a particular embodiment, the number of genes of the set does not exceed 100, particularly 50, 30, 20, more particularly 16 and even more particularly is maximum 5, 6, 7, 8, 9 or 10.
- When considering adding or substituting a gene or several genes to the disclosed set, the person skilled in the art will consider one or several of the following features:
- (a) the added gene(s) and/or the substituted gene(s) of Table 1 must present the same features in terms of difference of expression between a tumor of a good prognosis and a tumor of poor prognosis as the genes of Table 1 when taken as a whole. Thus, the expression of the added gene or of the substituted gene in a tumor of a good prognosis is either overexpressed or underexpressed of a factor of at least 2, preferably of at least 5, and more preferably of at least 10, as compared to its expression in a tumor of poor prognosis.
- (b) besides presenting the feature in a), the added gene and/or the substituted gene may also provide, in combination with the other genes of the set, discriminant results with respect to the grade of the liver tumors; this discrimination is reflected by the homogeneity of expression profile of this gene in the tumors of a good prognosis on the one hand, and the tumors of poor prognosis in the other hand; and
- (c) finally, besides features of a) and/or b), the added gene and/or the substituted gene is optionally chosen among genes that are involved in liver differentiation, in particular having a specific expression in fetal liver, or genes that are involved in proliferation, for example in mitosis or associated with ribosomes.
- Examples of genes which can be added or may replace genes of the set may be identified in following Table 2.
Table2: list of genes according to p value. The Accession Numbers of the genes of Table 2, as found in NCBI database in June 2008, are the following: IPO4 (BC136759), CPSF1 (NM_013291), MCM4 (NM_005914.2; NM_182746.1; two accession numbers for the same gene correspond to 2 different isoforms of the gene), EIF3S3 (NM_003756.2), NCL (NM_005381.2), CDC25C (NM_001790.3), CENPA (NM_001809.3; NM_001042426.1), KIF14 (BC113742), IPW (U12897), KNTC2 (AK313184), TMEM48 (NM_018087), BOP1 (NM_015201), EIF3S9 (NM_003751; NM_001037283), PH-4 (NM_177939), SMC4L1 (NM_005496; NM_001002800), TTK (AK315696), LAMA3 (NM_198129), C10orf72 (NM_001031746; NM_144984), TPX2 (NM_012112), MSH2 (NM_000251), DKC1 (NM_001363), STK6 (AY892410), CCT6A (NM_001762; NM_001009186), SULT1C1 (AK313193), ILF3 (NM_012218; NM_004516), IMPDH2 (NM_000884), HIC2 (NM_015094), AFM (NM_001133), MCM7 (NM_005916; NM_182776), CNAP1(AK128354), CBARA1 (AK225695), PLA2G4C (NM_003706), CPSF1 (NM_013291), SNRPN (BC000611), RPL5 (AK314720), C1R (NM_001733), C16orf34 (CH471112), PHB (AK312649), BZW2 (BC017794), ALAS1(AK312566), FLJ20364 (NM_017785), RANBP1 (NM_002882), SKB1 (AF015913), ABHD6 (NM_020676), CCNB1 (NM_031966), NOL5A (NM_006392), RPL8 (NM_000973; NM_033301), BLNK (NM_013314; NM_001114094), BYSL (NM_004053), UBE1L(AY889910), CHD7 (NM_017780), DKFZp762E1312 (mM_018410), NUP210(NM_024923), PLK1(NM_005030), ENPEP(NM_001977), HCAP-G(NM_022346), UGT2B4 (NM_021139), C20orf27 (NM_001039140) and C6orf149 (NM_020408). Gene symbol mean rC1 mean rC2 ratio rC2/rC1 Parametric p-value FDR Description IPO4 123,7 248,3 2,0 2.00E-07 0,00036 importin 4 CPSF1 467,8 1010,7 2,2 2,00E-07 0,00036 cleavage and polyadenylation specific factor 1, 160kDa specific MCM4 25,8 90,7 3,5 1,10E-06 0,00115 MCM4 minichromosome maintenance deficient 4 (S. cerevisiae) EIF3S3 1319 2601,2 2,0 1,20E-06 0,00119 eukaryotic translation initiation factor 3, subunit 3 gamma, 40kDa NCL 1319 2655,6 2,0 1,30E-06 0,00122 nucleolin CDC25C 35,7 99,3 2,8 1,40E-06 0,00124 cell division cycle 25C CENPA 28,2 78,4 2,8 1,50E-06 0,00124 centromere protein A, 17kDa KIF14 24,7 54,2 2,2 1,50E-06 0,00124 kinesin family member 14 IPW 145,7 397,6 2,7 1,90E-06 0,0015 imprinted in Prader-Willi syndrome KNTC2 26,8 65,1 2,4 2,20E-06 0,00157 kinetochore associated 2 TMEM48 26,4 71,7 2,7 2,30E-06 0,00157 transmembrane protein 48 BOP1 87,2 270,9 3,1 2,30E-06 0,00157 block of proliferation 1 EIF3S9 170 372,4 2,2 2,30E-06 0,00157 eukaryotic translation initiation factor 3, subunit 9 eta, 116kDa PH-4 340,9 168,2 0,5 2,40E-06 0,00158 hypoxia-inducible factor prolyl 4-hydroxylase SMC4L1 151,5 359,3 2,4 2,50E-06 0,0016 SMC4 structural maintenance of chromosomes 4-like 1 (yeast) TTK 23,7 74,2 3,1 2,60E-06 0,00161 TTK protein kinase LAMA3 696 136,3 0,2 2,80E-06 0,00168 laminin, alpha 3 C10orf72 192,6 67,7 0,4 2,90E-06 0,00169 Chromosome 10 open reading frame 72 TPX2 73,4 401,5 5,5 3,10E-06 0,00171 TPX2, microtubule-associated, homolog (Xenopus laevis) MSH2 75,5 212.1 2.8 3.20E-06 0,00171 mutS homolog 2, colon cancer, nonpolyposis type 1 (E. coli) DKC1 358,1 833,5 2,3 3,20E-06 0,00171 dyskeratosis congenita 1, dyskerin STK6 86,4 395,3 4,6 3,30E-06 0,00172 serine/threonine kinase 6 CCT6A 200,5 526,6 2,6 3,50E-06 0,00173 chaperonin containing TCP1, subunit 6A (zeta 1) SULT1 C1 67,5 314,8 4,7 3,50E-06 0,00173 sulfotransferase family, cytosolic, 1C, member 1 ILF3 142,3 294,5 2,1 3,70E-06 0,00174 interleukin enhancer binding factor 3, 90kDa IMPDH2 916,9 2385,6 2,6 3,70E-O6 0,00174 IMP (inosine monophosphate) dehydrogenase 2 HIC2 63,4 208,8 3,3 3,90E-06 0,00179 hypermethylated in cancer 2 AFM 1310,3 237,4 0,2 4,10E-06 0,00184 afamin MCM7 187,3 465,3 2,5 4,30E-06 0,00189 MCM7 minichromosome maintenance deficient 7 (S. cerevisiae) CNAP1 70,2 177,5 2,5 4,40E-06 0,00189 chromosome condensation-related SMC-associated protein 1 CBARA1 958 475 0,5 4,60E-06 0,00194 calcium binding atopy-related autoantigen 1 PLA2G4C 123.3 51,2 0,4 4,90E-06 0,00194 phospholipase A2, group IVC (cytosolic, calcium-independent) CPSF1 301,9 616 2,0 5,00E-06 0.00194 cleavage and polyadenylation specific factor 1, 160kDa SNRPN 30,9 100,6 3,3 5,00E-06 0,00194 Small nuclear ribonucleoprotein polypeptide N RPL5 2754,8 4961 1,8 5,20E-06 0,00194 ribosomal protein L5 C1 R 1446,5 366,4 0,3 5,30E-06 0,00194 complement component 1, r subcomponent C160rf34 630,4 1109,6 1,8 5,30E-06 0,00194 chromosome 16 open reading frame 34 PHB 309,3 915,1 3,0 5,30E-06 0,00194 prohibitin BZW2 387,4 946,4 2,4 5,40E-06 0,00194 basic leucine zipper and W2 domains 2 ALAS1 1075,8 466,5 0,4 5,50E-06 0,00194 aminolevulinate, delta-, synthase 1 FLJ20364 48,6 112,4 2,3 5,70E-06 0,00198 hypothetical protein FLJ20364 RANBP1 593,7 1168,1 2,0 5,90E-06 0,00201 RAN binding protein 1 SKB1 354,7 687,4 1,9 6,20E-06 0,00208 SKB1 homolog (S. pombe) ABHD6 402,2 196,9 0,5 6,50E-06 0,00213 abhydrolase domain containing 6 CCNB1 60,4 330 5,5 6,60E-06 0,00213 cyclin B1 NOLSA 246,9 716,2 2,9 7,00E-06 0,00213 nucleolar protein 5A (56kDa with KKE/D repeat) RPL8 3805,7 7390,5 1,9 7,OOE-06 0,00213 ribosomal protein L8 BLNK 211,1 39,8 0,2 7,10E-O6 0,00213 B-celllinker BYSL 269,7 1,6 7,10E-06 0,00213 bystin-like UBE1L 247,6 142,3 0,6 7,20E-06 0,00213 3 ubiquitin-activating enzyme E1-like CHD7 118,6 312 2,6 7,40E-06 0,00215 chromodomain helicase DNA binding protein 7 DKFZp762E1 312 70,2 219,4 3,1 7,60E-06 0,00218 hypothetical protein DKFZp762E1312 (HJURP) NUP210 178,4 284,9 1,6 7,70E-06 0,00218 nucleoporin 210kDa PLK1 72,8 185,2 2,5 7,90E-06 0,0022 polo-like kinase 1 (Drosophila) ENPEP 116,2 29,4 0,3 8,00E-06 0,0022 glutamyl aminopeptidase (aminopeptidase A) HCAP-G 17,7 57,8 3,3 8,40E-06 0,00228 chromosome condensation protein G UGT2B4 1117,8 246,7 0,2 9,20E-06 0,00245 UDP glucuronosyltransferase 2 family, polypeptide B4 C20orf27 129,7 245,3 1,9 9,30E-06 0,00245 chromosome 20 open reading frame 27 C6orf149 178,7 491,1 2,7 9,40E-06 0,00245 chromosome 6 open reading frame 149 (LYRM4) - In a particular embodiment of the invention, the set of genes of the invention is designed to determine the grade of hepatoblastoma, in particular paediatric hepatoblastoma. In another embodiment, the set of genes is designed to determine the grade of hepatocellular carcinoma, in particular paediatric HCC or adult HCC.
- The expression of the genes of the set may be assayed by any conventional methods, in particular any conventional methods known to measure the quantitative expression of RNA, preferably mRNA.
- The expression may be measured after carrying out an amplification process, such as by PCR, quantitative PCR (qPCR) or real-time PCR. Kits designed for measuring expression after an amplification step are disclosed below.
- The expression may be measured using hybridization method, especially with a step of hybridizing on a solid support, especially an array, a macroarray or a microarray or in other conditions especially in solution. Arrays and kits of the invention, designed for measuring expression by hybridization method are disclosed below.
- The expression of a gene may be assayed in two manners:
- to determine absolute gene expression that corresponds to the number of copies of the product of expression of a gene, in particular the number of copies of a nucleotide target, in the sample; and
- to determine the relative expression that corresponds to the number of copies of the product of expression of a gene, in particular the number of copies of a nucleotide target, in the sample over the number of copies of the expression product or the number of copies of a nucleotide target of a different gene (calculation also known as normalisation). This different gene is not one of the genes contained in the set to be assayed. This different gene is assayed on the same sample and at the same time as the genes of the set to be assayed, and is called an invariant gene or a normalizer. The invariant gene is generally selected for the fact that its expression is steady whatever the sample to be tested. The expression "steady whatever the sample" means that the expression of an invariant gene does not vary significantly between a normal liver cell and the corresponding tumor cell in a same patient and/or between different liver tumor samples in a same patient. In the present specification, a gene is defined as invariant when its absolute expression does not vary in function of the grade of the liver tumors, in particular does not vary in function of the grade of the HB or HCC tumor, and/or does not vary between liver tumor and normal liver cells.
- In the present invention, the expression which is assayed is preferably the relative expression of each gene, calculated with reference to at least one (preferably 1, 2, 3 or 4) invariant gene(s). Invariant genes, suitable to perform the invention, are genes whose expression is constant whatever the grade of the liver tumors, such as for example ACTG1, EFF1A1, PNN and RHOT2 genes, whose features are summarized in Table 3. In a particular embodiment, the relative expression is calculated with respect to at least the RHOT2 gene or with respect to the RHOT2 gene. The calculation of the absolute expression or of the relative expression of each gene of the set and of each invariant gene being assayed with the same method from the same sample, preferably at the same time, enables to determine for each sample a gene expression profile.
Table 3: Features of invariant genes. ACTG1, EEF1A1, PNN and RHOT2 proteins are defined in SEQ ID NOs: 34, 36, 38 and 40 respectively. symbol Gene name SEQ ID* Accession No Location Function ACTG1 actin, gamma 133 NM_001614 17q25 cytoplasmic actin cytoskeleton in nonmuscle cells EEF1A1 eukaryotic translation elongation factor 1alpha 135 NM_001402 6q14.1 enzymatic delivery of aminoacyl tRNAs to the ribosome PNN pinin, desmosome associated protein 37 NM_002687 14q21.1 transcriptional corepressor, RNA splicing regulator RHOT2 ras homolog gene family, member T2 39 NM_1 38769 16p13.3 Signaling by Rho mitochondrial protein - An additional step of the method or process comprises the determination of the grade of said liver tumor, referring to the gene expression profile that has been assayed. In a particular embodiment of the invention, the method is designed to determine the grade of hepatoblastoma, in particular paediatric hepatoblastoma. In another embodiment, the method is designed to determine the grade of hepatocellular carcinoma, in particular paediatric HCC or adult HCC.
- In this step of the method, a gene expression profile or a signature (preferably obtained after normalization), which is thus specific for each sample, is compared to the gene expression profile of a reference sample or to the gene expression profiles of each sample of a collection of reference samples (individually tested) whose grade is known, so as to determine the grade of said liver tumor. This comparison step is carried out with at least one prediction algorithm. In a particular embodiment, the comparison step is carried out with 1, 2, 3, 4, 5 or 6 prediction algorithms chosen in the following prediction algorithms: Compound Covariate Predictor (CCP), Linear Discriminator Analysis (LDA), One Nearest Neighbor (1 NN), Three Nearest Neighbor (3NN), Nearest Centroid (NC) and Support Vector Machine (SVM). These six algorithms are part of the "Biometric Research Branch (BRB) Tools" developed by the National Cancer Institut (NCI) and are available on http://linus.nci.nih.gov/BRB-ArrayTools.html. Equivalent algorithms may be used instead of or in addition to the above ones. Each algorithm classifies tumors within either of the two groups, defined as tumors with good prognosis (such as C1) or tumors with bad prognosis (such as C2); each group comprises the respective reference samples used for comparison, and one of these two groups also comprises the tumor to be classified.
- Therefore, when 6 algorithms are used, the grade of a tumor sample may be assigned with certainty to the class of good prognosis or to the class of bad prognosis, when 5 or 6 of the above algorithms classified the tumor sample in the same group. In contrast, when less than 5 of the above algorithms classifie a tumor sample in the same group, it provides an indication of the grade rather than a definite classification.
- Reference samples which can be used for comparison with the gene expression profile of a tumor to be tested are one or several sample(s) representative for tumor with poor prognosis (such as C2), one or several sample(s) representative of tumor with good prognosis (such as C1), one or several sample(s) of a normal adult liver and/or one or several sample(s) of a fetal liver.
- Table 4 lists the level of expression of each gene of Table 1 depending upon the status of the reference sample i.e., robust tumor with poor prognostic and robust tumor with good prognostic. An example of method to identify such robust tumors is provided in the examples, and in particular in paragraphs [140] to [143].
Table 4: Level of expression of the genes of Table 1, with respect to the status of the robust tumors Nucleotide target Expression status in robust tumor with poor prognosis with good prognosis AFP overexpressed underexpressed ALDH2 underexpressed overexpressed APCS underexpressed overexpressed APOC4 underexpressed overexpressed AQP9 underexpressed overexpressed BUB1 overexpressed underexpressed C1S underexpressed overexpressed CYP2E1 underexpressed overexpressed DLG7 overexpressed underexpressed DUSP9 overexpressed underexpressed E2F5 overexpressed underexpressed GHR underexpressed overexpressed HPD underexpressed overexpressed IGSF1 overexpressed underexpressed NLE1 overexpressed underexpressed RPL10A overexpressed underexpressed - Reference samples usually correspond to so-called "robust tumor" for which all the marker genes providing the signature are expressed (either under expressed or overexpressed) as expected i.e., in accordance with the results disclosed in Table 5, when tested in similar conditions, as disclosed in the examples hereafter.
- A robust tumor having an overexpression of one or several gene(s) selected among ALDH2, APCS, APOC4, AQP9, C1S, CYP2E1, GHR and HPD genes, and/or an underexpression of one or several gene(s) selected among AFP, BUB1, DLG7, DUSP9, E2F5, IGSF1, NLE1 and RPL10A genes, is an indicator of a robust liver tumor, in particular of a hepatoblastoma, with a good prognosis. A robust tumor having an overexpression of one or several gene(s) selected among AFP, BUB1, DLG7, DUSP9, E2F5, IGSF1, NLE1 and RPL10A genes, and/or an underexpression of one or several gene(s) among ALDH2, APCS, APOC4, AQP9, C1 S, CYP2E1, GHR and HPD genes, is an indicator of a robust liver tumor, in particular of a hepatoblastoma, with a poor prognosis. In the present application, a gene is said "underexpressed" when its expression is lower than the expression of the same gene in the other tumor grade, and a gene is said "overexpressed" when its expression is higher than the expression of the same gene in the other tumor grade.
- In a particular embodiment, Table 5 provides the gene expression profiles of the 16 genes of Table 1 in 13 samples of hepatoblastoma (HB) including 8 samples that have been previously identified as rC1 subtype and 5 samples that have been previously identified as rC2 subtype. This Table can therefore be used for comparison, to determine the gene expression profile of a HB tumor to be classified, with the robust tumors disclosed (constituting reference samples), for a set of genes as defined in the present application. Said comparison involves using the classification algorithms which are disclosed herein, for both the selected reference samples and the assayed sample.
Table 5: Normalized qPCR data of 16 genes in 13 HB samples including 8 samples of the rC1 subtype and 5 samples of the rC2 subtype (in grey). The qpCR values have been obtained by measuring the expression of the 16 genes in 8 samples of the rC1 subtype and 5 samples of the rC2 subtype by the SYBR green method using the primers as disclosed in Table 6 below and in the conditions reported in the examples, and normalized by the ROTH2 gene (primers in Table 7). HB grade AFP ALDH2 APCS APOC4 AQP9 BUB1 C1S CYP2E1 DLG7 DUSP9 E2F5 GHR HPD IGSF1 NLE RPL10A HB5 rC1 0.22 1.32 1.04 1.23 1.4 -0.11 1.46 0.99 -0.22 0.76 0.37 1.29 1.72 0.04 -0.12 0.78 HB49 rC1 -0.82 1.2 0.6 1.72 0.78 -1.09 0.77 0.89 -1.17 -1.15 -1.21 0.89 1.31 -1.27 -2.06 -0.8 HB59 rC1 -0.57 0.71 0.9 1.09 0.8 0.48 0.32 0.62 0.31 -0.7 -1.28 0.44 0.67 -1.26 -0.73 0.03 HB69 rC1 -1.3 0.42 0.66 0.79 0.48 -1.35 0.23 1.1 -1.1 -1.62 -0.96 0.9 0.53 -1.88 -1.33 -0.26 HB72 rC2 1.19 -2.01 -1.47 -1.05 -1.01 1.22 -1.13 -1.15 1.01 0.8 0.84 -0.71 -1.38 0.64 0.45 0.53 HB73 rC2 0.88 0.24 -0.49 -0.92 -1.23 1.09 -0.43 -0.27 1.17 0.96 0.89 -1.28 -0.19 0.77 0.99 0.72 HB74e rC1 0.52 0.18 -0.58 -0.75 -0.28 -0.06 -0.95 -0.79 0.46 0.62 0.75 -0.65 -0.86 0.63 0.93 0.5 HB74F rC2 -1.11 1.21 0.29 1.37 0.81 -1.36 0.29 0.92 -1.35 -0.78 -1.89 0.68 0.07 -1.74 -0.88 -0.05 HB75 rC1 -0.38 0.45 -0.3 0.62 0.96 -0.74 0.05 0.91 -0.59 0.15 0.4 0.32 0.79 -0.3 -0.35 -0.5 HB80 rC2 1.63 -0.4 -0.26 0.06 -0.99 1.31 -1.26 -0.34 1.37 0.95 0.81 -0.64 -0.87 1.61 1.23 1.11 HB81 rC1 -0.56 0.66 1.1 0.88 0.84 -0.66 1.16 1.32 -0.69 -0.14 -0.1 1.11 1.29 0.06 0.06 0.44 HB83 rC1 -0.73 0.5 0.78 1.04 1.2 -0.24 1.11 -0.21 -0.84 -0.64 -1.41 0.63 0.61 -0.22 -1.09 -1.92 HB86 rC2 1.08 -0.09 -1.29 -0.43 -0.3 1.21 -1.12 -0.25 1.13 1.26 0.88 -0.52 -0.98 1.08 0.46 1.56 - The method of the present invention is also suitable to classify new tumor samples, and to use them as new reference samples. Therefore, the gene expression values of these new reference samples may be used in combination or in place of some of the values reported in Table 5.
- From the 16 genes expressed in liver cells listed in Table 1, a set comprising from 2 to 16 genes (or more generally a set as defined herein) may be used to assay the grade of tumor cells in a tumor originating from the liver. The results obtained, after determining the expression of each of the genes of the set, are then treated for classification according to the steps disclosed herein. The invention relates to each and any combination of genes disclosed in Table 1, to provide a set comprising from 2 to 16 of these genes, in particular a set comprising or consisting of 2, 3, 4, 5, 6, 7, 8, 9, 10, 11, 12, 13, 14, 15 or 16 of these genes. In the designed set, one or many genes of Table 1 may be modified by substitution or by addition of one or several genes as explained above, which also enable to determine the grade of the liver tumor, when assayed in combination with the other genes.
- In a preferred embodiment, the liver tumor is a paediatric HB, and the method or process of the invention enables to distinguish a first class, called C1, qualifying as a good prognosis tumor and a second class, called C2, qualifying as a poor prognosis tumor. The C1 grade is predominantly composed of fetal histotype cells (i.e., well differentiated and non proliferative cells). In contrast, the C2 grade presents cells other than the fetal histotype such as embryonic, atypic (crowded fetal), small cell undifferiantiated (SCUD) and/or macrotrabecular cells.
- The present invention also relates to a kit suitable to determine the grade of a liver tumor from the sample obtained from a patient. This kit is appropriate to carry out the method or process described in the present application.
- In a particular embodiment, the kit comprises a plurality of pairs of primers specific for a set of genes to be assayed, said set comprising from 2 to 16 genes, said 2 to 16 genes being chosen in the group consisting of AFP, ALDH2, APCS, APOC4, AQP9, BUB1, C1S, CYP2E1, DLG7, DUSP9, E2F5, GHR, HPD, IGSF1, NLE1 and RPL10A genes.
- By "plurality", it is mean that the kit comprises at least as many pairs of primers as genes to enable assaying each selected gene, and in particular the nucleotide target of this gene. Accordingly, each gene and in particular its nucleotide target is specifically targeted by a least one of these pairs of primers. In a particular embodiment, the kit comprises the same number of pairs of primers as the number of genes to assay and each primer pair specifically targets one of the genes, and in particular the nucleotide targets of one of these genes, and does not hybridize with the other genes of the set.
- The kits of the invention are defined to amplify the nucleotide targets of the sets of genes as described in the present invention. Therefore, the kit of the invention comprises from 2 to 16 pairs of primers which, when taken as a whole, are specific for said from 2 to 16 genes out of the 16 genes of Table 1. In particular, the kit comprises or consists of 2, 3, 4, 5, 6, 7, 8, 9, 10, 11, 12, 13, 14 or 15 pairs of primers specific for 2, 3, 4, 5, 6, 7, 8, 9, 10, 11, 12, 13, 14 or 15 out of the 16 genes of Table 1. In a particular embodiment, the kit comprises or consists of 16 pairs of primers specific for the 16 genes of Table 1 i.e., a primer pair specific for each of the following genes: AFP, ALDH2, APCS, APOC4, AQP9, BUB1, C1S, CYP2E1, DLG7, DUSP9, E2F5, GHR, HPD, IGSF1, NLE1 and RPL10A genes.
- When the set of genes has been modified by the addition or substitution of at least one gene as described above, the kit is adapted to contain a pair of primers specific for each added or substituted gene(s). As indicated by the term "comprises", the kit may, besides the pairs of primers specific for the genes of Table 1, contain additional pair(s) of primers.
- In a particular embodiment, the kit comprises at least one pair of primers (preferably one) for at least one invariant gene (preferably one or two) to be assayed for the determination of the expression profile of the genes, by comparison with the expression profile of the invariant gene.
- The number of pairs of primers of the kit usually does not exceed 100, particularly 50, 30, 20, more particularly 16, and even more particularly is maximum 5, 6, 7, 8, 9 or 10.
- In the kits of the invention, it is understood that, for each gene, at least one pair of primers and preferably exactly one pair, enabling to amplify the nucleotide targets of this gene, is present. When the kits provide several pairs of primers for the same gene, the gene expression level is measured by amplification with only one pair of primers. It is excluded that amplification may be performed using simultaneously several pairs of primers for the same gene.
- As defined herein, a pair of primers consists of a forward polynucleotide and a backward polynucleotide, having the capacity to match its nucleotide target and to amplify, when appropriate conditions and reagents are brought, a nucleotide sequence framed by their complementary sequence, in the sequence of their nucleotide target.
- The pairs of primers present in the kits of the invention are specific for a gene i.e., each pair of primers amplifies the nucleotide targets of one and only one gene among the set. Therefore, it is excluded that a pair of primers specific for a gene amplifies, in a exponential or even in a linear way, the nucleotide targets of another gene and/or other nucleic acids contained in sample. In this way, the sequence of a primer (whose pair is specific for a gene) is selected to be not found in a sequence found in another gene, is not complementary to a sequence found in this another gene and/or is not able to hybridize in amplification conditions as defined in the present application with the sequence of the nucleotide targets of this another gene.
- In a particular embodiment, the forward and/or backward primer(s) may be labelled, either by isotopic (such as radioactive) or non isotopic (such as fluorescent, biotin, flurorochrome) methods. The label of the primer(s) leads to the labelling of the amplicon (product of amplification), since the primers are incorporated in the final product.
- The design of a pair of primers is well known in the art and in particular may be carried out by reference to Sambrook et al. (Molecular Cloning, A laboratory Manual, Third Edition;
chapter 8 and in particular pages 8.13 to 8.16). Various softwares are available to design pairs of primers, such as Oligo™ or Primer3. - Therefore, each primer of the pair (forward and backward) has, independently from each other, the following features:
- their size is from 10 and 50 bp, preferably 15 to 30 bp; and
- they have the capacity to hybridize with the sequence of the nucleotide targets of a gene.
- In a particular embodiment, when the pairs of primers are used in a simultaneous amplification reaction carried out on the sample, the various primers have the capacity to hybridize with their respective nucleotide targets at the same temperature and in the same conditions.
- Conventional conditions for PCR amplification are well known in the art and in particular in Sambrook et al. An example of common conditions for amplification by PCR is dNTP (200 mM), MgCl2 (0.5 - 3 mM) and primers (100-200 nM).
- In a particular embodiment, the sequence of the primer is 100% identical to one of the strands of the sequence of the nucleotide target to which it must hybridize with, i.e. is 100% complementary to the sequence of the nucleotide target to which it must hybridize. In another embodiment, the identity or complementarity is not 100%, but the similarity is at least 80%, at least 85%, at least 90% or at least 95% with its complementary sequence in the nucleotide target. In a particular embodiment, the primer differs from its counterpart in the sequence of the sequence of the nucleotide target by 1, 2, 3, 4 or 5 mutation(s) (deletion, insertion and/or substitution), preferably by 1, 2, 3, 4 or 5 nucleotide substitutions. In a particular embodiment, the mutations are not located in the last 5 nucleotides of the 3' end of the primer.
- In a particular embodiment, the primer, which is not 100% identical or complementary, keeps the capacity to hybridize with the sequence of the nucleotide target, similarly to the primer that is 100% identical or 100% complementary with the sequence of the nucleotide target (in the hybridization conditions defined herein). In order to be specific, at least one of the primers (having at least 80% similarity as defined above) of the pair specific for a gene can not hybridize with the sequence found in the nucleotide targets of another gene of the set and of another gene of the sample.
- In a particular embodiment, the pairs of primers used for amplifying a particular set of genes are designed, besides some or all of the features explained herein, in order that the amplification products (or amplicons) of each gene have approximately the same size. By "approximately" is meant that the difference of size between the longest amplicon and the shortest amplicon of the set is less than 30% (of the size of the longest amplicon), preferably less than 20%, more preferably less than 10%. As particular embodiments, the size of the amplicon is between 100 and 300 bp, such as about 100, 150, 200, 250 or 300 bp.
- The nucleotide sequences of the 16 genes of Table 1 are provided in the Figures, and may be used to design specific pairs of primers for amplification, in view of the explanations above.
- Examples of primers that may be used to measure the expression of the genes of Table 1, in particular to amplify the nucleotide targets of the genes of Table 1, are the primers having the sequence provided in Table 6 or variant primers having at least 80% similarity (or more as defined above) with the sequences defined in Table 6.
Table 6: Sequence of forward and backward primers of the 16 genes defined in Table 1. These primers may be used in any real-time PCR, in particular the SYBR green technique, except for the Taqman® protocol. Target Product size (bp) Forward primer (5'-3') Reverse primer (5'-3') AFP 151 AACTATTGGCCTGTGGCGAG TCATCCACCACCAAGCTGC ALDH2 151 GTTTGGAGCCCAGTCACCCT GGGAGGAAGCTTGCATGATTC APCS 151 GGCCAGGAATATGAACAAGCC CTTCTCCAGCGGTGTGATCA APOC4 151 GGAGCTGCTGGAGACAGTGG TTTGGATTCGAGGAACCAGG AQP9 151 GCTTCCTCCCTGGGACTGA CAACCAAAGGGCCCACTACA BUB1 152 ACCCCTGAAAAAGTGATGCCT TCATCCTGTTCCAAAAATCCG C1S 141 TTGTTTGGTTCTGTCATCCGC TGGAACACATTTCGGCAGC CYP2E1 151 CAACCAAGAATTTCCTGATCCAG AAGAAACAACTCCATGCGAGC DLG7 151 GCAGGAAGAATGTGCTGAAACA TCCAAGTCTTTGAGAAGGGCC DUSP9 151 CGGAGGCCATTGAGTTCATT ACCAGGTCATAGGCATCGTTG E2F5 151 CCATTCAGGCACCTTCTGGT ACGGGCTTAGATGAACTCGACT GHR 151 CTTGGCACTGGCAGGATCA AGGTGAACGGCACTTGGTG HPD 151 ATCTTCACCAAACCGGTGCA CCATGTTGGTGAGGTTACCCC IGSF1 152 CACTCACACTGAAAAACGCCC GGGTGGAGCAATTGAAAGTCA NLE1 151 ATGTGAAGGCCCAGAAGCTG GAGAACTTCGGGCCGTCTC RPL10A 151 TATCCCCCACATGGACATCG TGCCTTATTTAAACCTGGGCC - The kit of the invention may further comprise one or many pairs of primers specific for one or many invariant genes, in particular specific for ACTG1, EFF1A1, PNN and/or RHOT2 genes. The pair of primers specific for invariant gene(s) may be designed and selected as explained above for the pair of primers specific for the genes of the set of the invention. In a particular embodiment, the pairs of primers of the invariant genes are designed in order that their amplification product (or amplicon) has approximately the same size as the amplicon of the genes of the set to be assayed (the term approximately being defined as above, with respect to the longest amplicon of the set of genes). Examples of primers that may be used to amplify the particular invariant genes are primers having the sequence provided in Table 7 or primers having at least 80% similarity (or more as defined above) with the sequences defined in Table 7.
Table 7: Sequence of forward and backward primers specific for the invariant genes defined in Table 3. These primers may be used in real-time PCR, in particular the SYBR green technique, except for the Taqman® protocol. Target Product size (bp) Forward primer (5'-3') Reverse primer (5'-3') ACTG1 151 GATGGCCAGGTCATCACCAT ACAGGTCTTTGCGGATGTCC EFF1A1 151 TCACCCGTAAGGATGGCAAT CGGCCAACAGGAACAGTACC PNN 151 CCTTTCTGGTCCTGGTGGAG TGATTCTCTTCTGGTCCGACG RHOT2 151 CTGCGGACTATCTCTCCCCTC AAAAGGCTTTGCAGCTCCAC - The kits of the invention may also further comprise, in association with or independently of the pairs of primers specific for the invariant gene(s), reagents necessary for the amplification of the nucleotide targets of the sets of the invention and if any, of the nucleotide targets of the invariant genes.
- The kits of the invention may also comprise probes as disclosed herein in the context of sets of probes, compositions and arrays. In particular, the kits also comprise the four dNTPs (nucleotides), amplification buffer, a polymerase (in particular a DNA polymerase, and more particularly a thermostable DNA polymerase) and/or salts necessary for the activity of the polymerase (such as Mg2+).
- Finally, the kits may also comprise one or several control sample(s) i.e., at least one sample(s) representative of tumor with bad (i.e., poor) prognosis (in particular a HB C2 grade), at least one sample(s) representative of tumor with good prognosis (in particular a HB C1 grade), at least one sample of a normal adult liver and/or at least one sample of a fetal liver.
- The kits may also comprise instructions to carry out the amplification step or the various steps of the method of the invention.
- The invention is also directed to a set of probes suitable to determine the grade of a liver tumor from the sample obtained from a patient. This set of probes is appropriate to carry out the method or process described in the present invention. It may also be part of the kit.
- This set of probes comprises a plurality of probes in particular from 2 to 16 probes, these 2 to 16 probes being specific for genes chosen in the group consisting of AFP, ALDH2, APCS, APOC4, AQP9, BUB1, C1S, CYP2E1, DLG7, DUSP9, E2F5, GHR, HPD, IGSF1, NLE1 and RPL10A genes.
- By "plurality", it is mean that the set of probes comprises at least as many probes as genes to assay. In a particular embodiment, the array comprises the same number of probes as the number of genes to assay.
- The probes of the sets of the invention are selected for their capacity to hybridize to the nucleotide targets of the sets of genes as described in the present invention. Therefore, the set of probes of the invention comprise from 2 to 16 probes specific for 2 to 16 genes out of the 16 genes of Table 1. In particular, the sets of probes comprise or consist of 2, 3, 4, 5, 6, 7, 8, 9, 10, 11, 12, 13, 14 or 15 probes specific of 2, 3, 4, 5, 6, 7, 8, 9, 10, 11, 12, 13, 14 or 15 out of the 16 genes of Table 1. In a particular embodiment, the sets of probes comprise or consist of 16 probes specific for the 16 genes of Table 1 i.e., a probe specific of each of the following genes: AFP, ALDH2, APCS, APOC4, AQP9, BUB1, C1S, CYP2E1, DLG7, DUSP9, E2F5, GHR, HPD, IGSF1, NLE1 and RPL10A genes.
- The specificity of the probes is defined according to the same parameters as those applying to define specific primers.
- When the set of genes has been modified by the addition or substitution of at least one gene as described above, the set of probes is adapted to contain a probe specific for the added or substituted gene(s). As indicated by the term "comprises", the set of probes may, besides the probes specific for the genes of Table 1, contain additional probe(s).
- The number of probes of the set does usually not exceed 100, particularly 50, 30, 20, more particularly 16, and even more particularly is maximum 5, 6, 7, 8, 9 or 10.
- In the set of probes of the invention, it is understood that for each gene corresponds at least one probe to which the nucleotide target of this gene hybridize to. The set of probes may comprise several probes for the same gene, either probes having the same sequence or probes having different sequences.
- As defined herein, a probe is a polynucleotide, especially DNA, having the capacity to hybridize to the nucleotide target of a gene. Hybridization is usually carried out at a temperature ranging from 40 to 60°C in hybridization buffer (see example of buffers below). These probes may be oligonucleotides, PCR products or cDNA vectors or purified inserts. The size of each probe is independently to each other from 15 and 1000 bp, preferably 100 to 500 bp or 15 to 500 bp, more preferably 50 to 200bp or 15 to 100bp. The design of probes is well known in the art and in particular may be carried out by reference to Sambrook et al. (Molecular Cloning, A laboratory Manual, Third Edition;
chapters - The probes may be optionally labelled, either by isotopic (radioactive) or non isotopic (biotin, flurorochrome) methods. Methods to label probes are disclosed in Sambrook et al. (Molecular Cloning, A laboratory Manual, Third Edition;
chapter 8 and in particular page 9.3.). In a particular embodiment, the probes are modified to confer them different physicochemical properties (such as by methylation, ethylation). In another particular embodiment, the probes may be modified to add a functional group (such as a thiol group), and optionally immobilized on bead (preferably glass beads). - In a particular embodiment, the sequence of the probe is 100% identical to a part of one strand of the sequence of the nucleotide target to which it must hybridize, i.e. is 100% complementary to a part of the sequence of the nucleotide target to which it must hybridize. In another embodiment, the identity or complementarity is not 100% and the similarity is at least 80%, at least 85%, at least 90% or at least 95% with a part of the sequence of the nucleotide target. In a particular embodiment, the probe differs from a part of one strand of the sequence of the nucleotide target by 1 to 10 mutation(s) (deletion, insertion and/or substitution), preferably by 1 to 10 nucleotide substitutions. By "a part of", it is meant consecutive nucleotides of the nucleotide target, which correspond to the sequence of the probe.
- In a particular embodiment, the probe, which is not 100% identical or complementary, keeps the capacity to hybridize, in particular to specifically hybridize, to the sequence of the nucleotide target, similarly to the probe which is 100% identical or 100% complementary with the sequence of the nucleotide target (in the hybridization conditions defined herein).
- In a particular embodiment, the size of the probes used to assay a set of genes is approximately the same for all the probes. By "approximately" is meant that the difference of size between the longest probe and the shortest probe of the set is less than 30% (of the size of the longest probe), preferably less than 20%, more preferably less than 10%.
- The set of probes of the invention may further comprise at least one (preferably one) probe specific for at least one invariant gene (preferably one or two), in particular specific for ACTG1, EFF1A1, PNN and/or RHOT2 genes. The probes specific for invariant gene(s) may be designed and selected as explained above for the probes specific for genes of the sets of the invention. In a particular embodiment, the probes specific of the invariant genes have approximately the same size as the probes specific of the genes of the set of be assayed (the term approximately being defined as above, with respect to the longest probes of the set of genes).
- The invention is also directed to an array suitable to determine the grade of a liver tumor from the sample obtained from a patient. This array is appropriate to carry out the method or process described in the present application.
- An array is defined as a solid support on which probes as defined above, are spotted or ommobilized. The solid support may be porous or non-porous, and is usually glass slides, silica, nitrocellulose, acrylamide or nylon membranes or filters.
- The arrays of the invention comprise a plurality of probes specific for a set of genes to be assayed. In particular, the array comprises, spotted on it, a set of probes as defined above.
- The invention also relates to a composition comprising a set of probes as defined above in solution.
- In a first embodiment, the probes (as defined above in the set of probes) may be modified to confer them different physicochemical properties (such as methylation, ethylation). The nucleotide targets (as defined herein and prepared from the sample) are linked to particles, preferably magnetic particles, for example covered with ITO (indium tin oxide) or polymide. The solution of probes is then put in contact with the target nucleotides linked to the particles. The probe/target complexes are then detected, for example by mass spectrometry.
- Alternatively, probes may be modified to add a functional group (such as a thiol group) and immobilized on beads (preferably glass beads). These probes immobilized on beads are put in contact with a sample comprising the nucleotide targets, and the probe/target complexes are detected, for example by capillary reaction.
- The invention is also directed to kits comprising the sets of probes, the compositions or the arrays of the invention and preferably the primer pairs disclosed herein. These kits may also further comprise reagents necessary for the hybridization of the nucleotide targets of the sets of genes and/or of the invariant genes, to the probes (as such, in the compositions or on the arrays) and the washing of the array to remove unbound nucleotides targets.
- In a particular embodiment, the kits also comprise reagents necessary for the hybridization, such as prehybridization buffer (for example containing 5×SSC, 0.1% SDS and 1% bovine serum albumin), hybridization buffer (for example containing 50% formamide, 10×SSC, and 0.2% SDS), low-stringency wash buffer (for example containing 1×SSC and 0.2% SDS) and/or high-stringency wash buffer (for example containing 0.1×SSC and 0.2%SDS).
- The kits may also comprise one or several control sample(s) i.e., at least one sample(s) representative for tumor with poor prognosis, at least one sample(s) representative of tumor with good prognosis, at least one sample of a normal adult liver and/or at least one sample of a fetal liver. Alternatively, it may comprise the representation of a gene expression profile of such tumors.
- Finally, the invention provides a kit as described above further comprising instructions to carry out the method or process of the invention.
- The arrays and/or kits (either comprising pairs of primers or probes or arrays or compositions of the invention or all the components) according to the invention may be used in various aspects, in particular to determine the grade of a liver tumor from a patient, especially by the method disclosed in the present application.
- The arrays and/or kits according to the invention are also useful to determine, depending upon the grade of the liver tumor, the risk for a patient to develop metastasis. Indeed, the classification of a liver tumor in the class with poor prognosis is highly associated with the risk of developing metastasis.
- In another embodiment, the arrays and/or kits according to the invention are also useful to define, depending upon the grade of the liver tumor, the therapeutic regimen to apply to the patient.
- The invention also relates to a support comprising the data identifying the gene expression profile obtained when carrying out the method of the invention.
- BRIEF DESCRIPTION OF THE DRAWINGS
- The colour version of the drawings as filed is available upon request to the European Patent Office.
-
Figure 1 . Identification of two HB subclasses by expression profiling. - (A) Schematic overview of the approach used to identify robust clusters of samples, including two tumor clusters (rC1 and rC2) and one non-tumor cluster (NL) (B) Expression profiles of 982 probe sets (824 genes) that discriminate rC1 and rC2 samples (p < 0.001, two-sample t test). Data are plotted as a heatmap where red and green correspond to high and low expression in log2-transformed scale. (C) Molecular classification of 25 HB samples and status of CTNNB1 gene and β-catenin protein. C1 and C2 classification was based on rC1 and rC2 gene signature by using six different statistical predictive methods (CCP, LDA, 1 NN, 3NN, NC and SVM) and the leave-one-out cross-validation. Black and gray squares indicate mutations of the CTNNB1 and AXIN1 genes. Immunohistochemical analysis of β-catenin in representative C1 and C2 cases is shown. (D) Expression of representative Wnt-related and β-catenin target genes (p < 0.005, two-sample t test) in HB subclasses and non-tumor livers (NL). (E) Classification of hepatoblastoma by expression profile of a 16-gene signature. (F) Classification of normal human livers of children with HB (from 3 months to 6 years of age) (NT) or fetal livers at 17 to 35 weeks of gestation (FL) by expression profile of a 16-gene signature.
-
Figure 2 : Molecular HB subclasses are related to liver development stages. (A) Distinctive histologic and immunostaining patterns of HB subclasses C1 and C2. From top to bottom: numbers indicate the ratio of mixed epithelial-mesenchymal tumors and of tumors with predominant fetal histotype in C1 and C2 subtypes; hematoxylin and eosin (H&E) and immunostaining of Ki-67, AFP and GLUL in representative samples. Magnification, x400. (B) Expression of selected markers of mature hepatocytes and hepatoblast/liver progenitors in HB subclasses and non-tumor livers. -
Figure 3 : Validation of the 16-gene signature by qPCR in an independent set of 41 HBs. Expression profiles of the 16 genes forming the HB classifier are shown as a heatmap that indicates high (red) and low (green) expression according to log2-transformed scale. HB tumors, HB biopsies (b) and human fetal livers (FL) at different weeks (w) of gestation were assigned toclass -
Figure 4 : Gene expression of the 16 genes of the prognostic liver cancer signature assessed by qPCR is presented as box-plot. The boxes represent the 25-75 percentile range, the lines the 10-90 percentile range, and the horizontal bars the median values. -
Figure 5 : Expression level of the 16 liver prognostic signature genes shown case by case in 46 hepatoblastomas and 8 normal livers. C1 tumors (green), C2 tumors (red) and normal liver (white). -
Figure 6 . Correlation between molecular HB subtypes and clinical outcome in 61 patients. (A) Association of clinical and pathological data with HB classification in the complete set of 61 patients. Only significant correlations (Chi-square test) are shown. PRETEXT IV stage indicates tumorous involvement of all liver sections. (B) Kaplan-Meier plots of overall survival for 48 patients that received preoperative chemotherapy. Profiling via the 16-gene expression signature was used to define C1 and C2 subclasses in tumors resected after chemotherapy, and differences between survival curves were assessed with the log-rank test. (C) Overall survival of 17 HB patients for which pretreatment biopsies or primary surgery specimens were available. The signature was applied exclusively to tumor samples without prior therapy. (D) Multivariate analysis including 3 variables associated to patient's survival. The predominant histotype is defined as either fetal or other (including embryonal, crowed-fetal, macrotrabecular or SCUD types). Tumor stage is defined by PRETEXT stage (Perilongo et al., 2000) and/or distant metastasis at diagnosis and/or vascular invasion. HR, Hazard Ratio; CI, Confidence Interval. -
Figure 7 : Clinical, pathological and genetic characteristics of 61 HB cases. SR: standard risk; HR: high risk according to SIOPEL criteria; NA: not available; PRETEXT: pre-treatment extent of disease according to SIOPEL; DOD: dead of disease; *: Vascular invasion was defined by radiological analysis; **: The predominant epithelial histotype variable categorized as "others" included embryonal, crowded fetal, macrotrabecular, and undifferentiated histotypes. -
Figure 8 : Clinical, pathological and genetic characteristics of 66 HB samples; Tumor ID number indicates patient number. When more than one sample from the same patient was analyzed, the representative sample used for statistical analysis of clinical correlations is marked by an asterisk; b: biopsy. HB74F: fetal component of HB74; HB74e: embryonal component of HB74. Gender: M, male; F, female; Y, yes; N, no; NA, not available. Multifocality: S, solitary nodules; M, multiple nodules. Histology: E, epithelial; M, mixed; CF, crowded fetal; F, fetal; E, embryonal; M, macrotrabecular; PF, pure fetal; S, SCUD. PRETEXT β-catenin status : wt, wild-type; Δex3, in-frame deletion of part or allexon 3 sequence; FAP, familial polyposis kindred; AXIN1,Axin 1 nonsense mutation (R533stop, CGA to TGA).stage: I to IV according to SIOPEL (Aronson et al., 2005). Treatment protocol: S, standard risk; H, high risk according to SIOPEL. Outcome: A, alive free of disease; DOD, dead of disease; D, death unrelated to cancer; R, alive with recurrence of disease. -
Figure 9 : Correlation between molecular HB subtypes and clinical outcome in 86 patients. (A) Association of clinical and pathological data with HB classification in the complete set of 86 patients. Only significant correlations (Chi-square test) are shown. PRETEXT IV stage indicates tumorous involvement of all liver sections. (B) Kaplan-Meier plots of overall survival for 73 patients that received preoperative chemotherapy. Profiling via the 16-gene expression signature was used to define C1 and C2 subclasses in tumors resected after chemotherapy, and differences between survival curves were assessed with the log-rank test. (C) Overall survival of 29 HB patients for which pretreatment biopsies or primary surgery specimens were available. The signature was applied exclusively to tumor samples without prior therapy. (D) Multivariate analysis including 3 variables associated to patient's survival. The predominant histotype is defined as either fetal or other (including embryonal, crowed-fetal, macrotrabecular or SCUD types). Tumor stage is defined by PRETEXT stage (Perilongo et al., 2000) and/or distant metastasis at diagnosis and/or vascular invasion. HR, Hazard Ratio; CI, Confidence Interval - A. Patients and tissue samples.
- Sixty-six tumor specimens and biopsies from 61 patients with hepatoblastoma were collected from different hospitals in France (52 cases), Italy (6 cases), United Kingdom (1 case), Switzerland (1 case) and Slovakia (1 case). Forty-eight patients received chemotherapy treatment prior to surgery, most being enrolled in clinical trials of the International Childhood Liver Tumour Strategy Group (SIOPEL) (Perilongo et al., 2000). Samples from fresh tumors avoiding fibrotic and necrotic areas and from adjacent non tumor livers were snap frozen at the time of surgery and stored at -80°C.
Figure 7 describes patient characteristics and clinicopathological parameters. - Patients were children with median age of 2 years, and male: female ratio of 1.5. The median follow-up was 32 months; during this period, 15 patients died from disease. The histology of all tumor specimens was centrally reviewed by expert pathologist according to previously described criteria (Finegold et al., 2007; Zimmermann, 2005). Twenty-five tumors were analyzed on oligonucleotide microarrays and 24 of them, for which DNA was available, were subjected to aCGH analysis, while a second set of 41 tumors was analyzed by qPCR (
Figure 8 ). No difference was observed in significant clinical and pathological data as well as in the percentage of cases carrying β-catenin mutation between the two sets. This study has been approved by the Ethics Committee of Institut Pasteur, and informed consent of the families was obtained at each Medical Center, in accordance with European Guidelines for biomedical research and with national laws in each country. - B. Oligonucleotide microarrays and gene expression data analysis
- Twenty-five HB samples and 4 non-tumor samples including a pool of livers from 3 males and a second from 3 females were analyzed using Affymetrix HG-U133A oligonucleotide arrays. Total RNA was prepared using FastPrep® system (Qbiogene, Strasbourg, France) and RNeasy mini Kit (Qiagen, Courtaboeuf, France). RNA quality was checked with the Agilent 2100 Bioanalyzer (Agilent Technologies, Palo Alto, CA). Microarray experiments were performed according to the manufacturer's instructions. Affymetrix microarray data were normalized using RMA method (Irizarry et al., 2003). Class discovery was done as described elsewhere (Lamant et al., 2007). Pathway and Gene Ontology enrichment analyses were performed using GSEA method (Subramanian et al., 2005) and hypergeometric tests. For supervised tests and class prediction, we used Biometric Research Branch (BRB) ArrayTools v3.2.2 software, developed by R. Simon and A. Peng. Permutations of the measurements are then used to estimate the FDR (the percentage of genes identified by chance). Additionally, mouse fetal livers at E18.5 and postnatal livers at 8 days of birth were profiled on Affymetrix MG-U74A, B v2 arrays. Data were processed and analyzed as aforementioned.
- Except when indicated, transcriptome analysis was carried out using either an assortment of R system software packages (http://www.R-project.org, v2.3.0) including those of Bioconductor v1.8 (Gentleman et al., 2004) or original R code.
- B.1. Normalization
- Raw data from Affymetrix HG-U133A 2.0 GeneChip™ microarrays were normalized in batch using robust multi-array average method (R package affy, v1.10.0) (Irizarry et al., 2003). Probe sets corresponding to control genes or having a "_x_" annotation were masked yielding a total of 19,787 probe sets available for further analyses.
- The variance of each probe set across samples was tested and compared to the median variance of all the probe sets, using the model: ((n-1)×Var(probe set)/ Varmed), where n refers to the number of samples. By using the same filtering tool of BRB ArrayTools software, the P-value for each probe set was obtained by comparison of this model to a percentile of Chi-square distribution with (n-1) degrees of freedom.
- The rCV was calculated for each probe set as follows. After ordering the intensity values of n samples from min to max, we eliminated the min and max values and we calculated the coefficient of variation (CV) for the remaining values.
- Unsupervised selection of probe set lists was based on the two following criteria:
- (i) variance test at P < 0.01,
- (ii) rCV less than 10 and superior to a given rCV percentile. We used eight rCV percentile thresholds (60%; 70%; 80%; 90%; 95%; 97.5%; 99%; 99.5%), which yielded 8 probe set lists.
- Hierarchical clustering was performed by using the 8 rCV-ranked probe sets lists, 3 different linkage methods (average, complete and Ward's), and 1-Pearson correlation as a distance metric (package cluster v1.9.3). This analysis generated 24 dendrograms.
- The intrinsic stability of each of the 24 dendrograms was assessed by comparing each dendrogram to the dendrograms obtained after data "perturbation" or "resampling" (100 iterations). Perturbation stands for the addition of random gaussian noise (µ = 0, σ = 1.5 × median variance calculated from the data set) to the data matrix, and resampling for the random substitution of 5% of the samples by virtual sample's profiles, generated randomly. The comparison between dendrograms across all iterations yielded a mean 'similarity score' (see below). The overall stability was assessed by calculating a mean similarity score, using all pairs of the 24 dendrograms.
- To compare two dendrograms, we compared the two partitions in k clusters (k = 2 to 8) obtained from these two dendrograms. To compare a pair of partitions, we used a similarity measure, which corresponds to the symmetric difference distance (Robinson and Foulds, 1981).
- We identified groups in which any pair of samples was co-classified in at least 22 of the 24 partitions, and considered only groups made of 4 samples or more. Then, for any pair of these groups, we calculated the mean number of co-classification of any sample in the first group with any sample in the second group. We aggregated the groups for which this score was at least 18 (over the 24 partitions).
- B.3. Supervised tests
- We compared gene expression between two classes of samples by using the Student's t test with random variance model option (BRB ArrayTools software, version 3.4.0a, developed by Dr. Richard Simon and Amy Peng Lam, http://linus.nci.nih.gov/BRB-ArrayTools.html). False Discovery Rates were assessed by using 1000 random permutations of labels (Monte Carlo approach).
- B.4. Classification
- To classify samples according to gene expression profile, we used the Class prediction tool of BRB ArrayTools software using all 6 following algorithms: Compound Covariate Predictor (CCP), Linear Discriminant Analysis (LDA), 1-Nearest Neighbor (1NN), 3-Nearest Neighbors (3NN), Nearest Centroid (NC) and Support Vector Machines (SVM). Each sample was classified according to the majority of the 6 algorithms. Samples classified as C2 by at least 3 algorithms were classified accordingly.
- B.5. Gene ontology and pathway analysis
- We used a hypergeometric test to measure the association between a gene (probe set) list and a gene ontology term (GO term), as in GO stats R package (R. Gentleman). To this end, we mapped the gene list and the GO terms to non-redundant Entrez Gene identifiers by using the annotation file HG-U133_Plus_2.annot.csv (hftp://www.affymetrix.com, 12/14/2006). GO terms and their relationships (parent/child) were downloaded from hftp://www.geneontology.org (
version 12/31/2006). The list of proteins associated to GO terms (table gene_association.goa_human) and mapping the Entrez Gene ids (table human.xrefs) were downloaded from ftp://ftp.ebi.ac.uk/pub/databases/GO/goa. - KEGG pathway annotation was done by Onto-tools software (http://vortex.cs.wayne.edu/ontoexpress/servlet/UserInfo). We designated a significance threshold of each hypergeometric test at P < 0.001, and the condition that a GO term or pathway be represented by at least 3 Entrez Gene identifiers.
- B.6. Gene Set Enrichment Analysis (gsea)
- GSEA (Subramanian et al., 2005) was used to evaluate the correlation of a specific gene list with two different sample groups (phenotypes). Briefly, this method calculates an enrichment score after ranking all genes in the dataset based on their correlation with a chosen phenotype and identifying the rank positions of all the members of a defined gene set. We used the signal2noise ratio as a statistic to compare specific and random phenotypes in order to evaluate statistical differences.
- C. Array-based Comparative Genomic Hybridization (aCGH)
- Genomic DNA from 24 HBs and 3 non-tumor liver samples was analyzed using aCGH chips designed by the CIT-CGH consortium. This array contains 3400 sequence-verified PAC/BAC clones spaced at approximately 1 Mb intervals, spotted in triplicate on Ultra Gaps slides (Corning Inc, Corning, NY).
- The aCGH chip was designed by CIT-CGH consortium (Olivier Delattre laboratory, Curie Institute, Paris; Charles Theillet laboratory, CRLC Val d'Aurelle, Montpellier; Stanislas du Manoir laboratory, IGBMC, Strasbourg and the company IntegraGenTM). DNAs were labeled by the random priming method (Bioprime DNA labelling system; Invitrogen, Cergy-Pontoise, France) with cyanine-5 (Perkin-Elmer, Wellesley, MA). Using the same procedure, we labeled control DNAs with cyanine-3. After ethanol-precipitation with 210 µg of Human Cot-1 DNA (Invitrogen), resuspension in hybridization buffer (50% formamide), denaturation at 95°C for 10 minutes and prehybridization at 37°C for 90 minutes, probes were cohybridized on aCGH. The aCGH slides were previously preblocked with a buffer containing 2.6 mg succinic anhydride/118ml N-methyl-2-pyrrolidinone/32ml sodium tetraborate decahydrate, pH 8.0 (Sigma-Aldrich, Lyon, France). After washing, arrays were scanned using a 4000B scan (Axon, Union City, CA). Image analysis was performed with Genepix 5.1 software (Axon) and ratios of Cy5/Cy3 signals were determined. The aCGH data were normalized using lowess per block method (Dudoit et al., 2002). Comparison between groups was done using chi-square test or Fisher's exact test, as appropriate.
- Status assignment (Gain/Loss) was performed using R package GLAD v1.6.0. Computation of recurrent minimal genomic alterations was done using slight modification of a previously described method (Rouveirol et al., 2006). For comparison between groups, we used the Fischer exact test. Complete aCGH data will be published elsewhere.
- D. Mouse microarray analysis
- Murine Genome Affymetrix U74v2 A and B arrays were used to investigate liver expression at embryonic day 18.5 (E18.5) and at 8 days after birth (PN8). Each time point consisted of a pool of livers from 3-5 animals analyzed in triplicate. Microarray experiments were performed according to the manufacturer's instructions.
- Publicly available Affymetrix Mouse Genome (MG) 430 2.0 array liver expression data at embryonic time points E11.5, E12.5, E13.5, E14.5, and E16.5 days of gestation (Otu et al., 2007), were downloaded from the Gene Expression Omnibus (GEO) database (http://www.ncbi.nlm.nih.gov/geo/query/acc.cgi?acc=GSE6998).
- MG-U74v2, MG-430 2.0 and HG-133A 2.0 array intra- and cross-species probeset comparison was achieved by using the Affymetrix NetAffx analysis center and by choosing "Good Match" degree of specificity. Unification of sample replicates, multiple array data standardization and Heatmap visualization was done by using dCHIP v1.6 software. Comparison of fetal liver stages by supervised analysis was performed using BRB ArrayTools software as previously described, by classing E11.5 and E12.5 as "Early" and E14.5 and E16.5 as "Late" fetal liver stage. Supervised signature was applied to HB array data, and intensity cut-off = 60 was chosen in order to remove probesets that did not reach such intensity level in at least one sample.
- E. Quantitative PCR analysis (qPCR)
- For qPCR analysis, we used RNA from 52 tumor samples (including 11 samples analyzed on microarrays, see
Figure 8 ), and from 8 non-tumor livers and 5 human fetal livers (RNAs purchased from BioChain Institute, Hayward, CA). - RNA was extracted by using either Trizol, RNeasy kit (QIAGEN) or miRvana kit (Ambion), then quantified and quality-checked by Agilent technology. For each cDNA preparation, 1µg of RNA was diluted at the final concentration of 100 ng/µl, and reverse transcribed with the Superscript RT kit (Invitrogen, Carlsbad, CA) following the manufacturer's protocol. Random primers (Promega, Charbonnières-les-Bains, France) were added at the final concentration of 30 ng/µl and the final volume was 20 µl.
- The cDNA was diluted 1:25, and 5 µl were used for each qPCR reaction. We added 5 µl of 2XSybr Green Master mix (Applied Biosystems) and 0.3 µl of each specific primer (final concentration 300nM). Each reaction was performed in triplicate. qPCR reactions were run on the Applied Biosystems 7900HT Fast Real-Time PCR System with a 384-well thermo-block, in the following conditions: 2 min at 50°C to activate Uracil-N-glycosylase (UNG)-mediated erase of aspecific reaction; 10 min at 95°C to activate the polymerase and inactivate the UNG; 40 cycles (15 sec at 95°C denaturation step and 1 min at 60°C annealing and extension); and final dissociation step to verify amplicon specificity.
- The lists of primers used for qPCR are provided in Table 6 and Table 7 above.
- F. Immunohistochemistry (IHC)
- IHC was carried out as reported previously (Wei et al., 2000). For antigen retrieval at 95°C, we used 1 mM EDTA (pH 8) for β-catenin and Ki-67 IHC, and 10 mM citrate buffer (pH 6) for AFP and GLUL IHC. We used monoclonal antibodies against β-catenin and GLUL (Cat. Nos. 610154 and 610517; BD Biosciences, Le Pont de Claix, France) and Ki-67 (M7240, Dako, Trappes, France) and polyclonal antibody against AFP (N1501, Dako). Reactions were visualized using the ChemMate Dako Envision Detection kit (Dako) and diaminobenzidine. Subcellular distribution and quantitative evaluation of immunostaining in the different histotypes were assessed by examining at least ten random high-power fields.
- G. Clinical data analysis
- We used the Chi-square test for comparisons between groups. Survival curves were calculated according to the Kaplan-Meier method, using the log-rank test to assess differences between curves. Variables independently related to survival were determined by stepwise forward Cox regression analysis. Follow-up was closed at February 2007 or at time of death. Statistical analysis was done with SPSS software v10.0 (SPSS Inc., Chicago, IL).
- H. Examples of other pairs of primers and probes for the 16 genes of Table 1 and the 4 invariant genes (Table 3) that can be used in the Taqman® method.
- AFP forward primer: GCCAGTGCTGCACTTCTTCA
AFP reverse primer: TGTTTCATCCACCACCAAGCT
AFP probe: ATGCCAACAGGAGGCCATGCTTCA
(for each polynucleotide, the sequence is given from 5' to 3') - ALDH2 forward primer: TGCAGGATGGCATGACCAT
ALDH2 reverse primer: TCTTGAACTTCAGGATCTGCATCA
ALDH2 probe: CCAAGGAGGAGATCTTCGGGCCA
APCS forward primer: AGCTGGGAGTCCTCATCAGGTA
APCS reverse primer: CGCAGACCCTTTTTCACCAA
APCS probe: TGCTGAATTTTGGATCAATGGGACACC - APOC4 forward primer: TGAAGGAGCTGCTGGAGACA
APOC4 reverse primer: CGGGCTCCAGAACCATTG
APOC4 probe: TGGTGAACAGGACCAGAGACGGGTG - AQP9 forward primer: GCCATCGGCCTCCTGATTA
AQP9 reverse primer: GTTCATGGCACAGCCACTGT
AQP9 probe: TGTCATTGCTTCCTCCCTGGGACTG - BUB1 forward primer: ACATCTGGTTTTCAGTGTGTTGAGA
BUB1 reverse primer: GTTGCAGCAACCCCAAAGTAA
BUB1 probe: TCAGCAACAAACCATGGAACTACCAGATCG - C1S forward primer: TCCCAATGACAAGACCAAATTCT
C1S reverse primer: AGAGCCCATAGGTCCCACACT
C1S probe: CGCAGCTGGCCTGGTGTCCTG - CYP2E1 forward primer: CATGAGATTCAGCGGTTCATCA
CYP2E1 reverse primer: GGTGTCTCGGGTTGCTTCA
CYP2E1 probe: CCTCGTGCCCTCCAACCTGCC - DLG7 forward primer: GCTGGAGAGGAGACATCAAGAAC
DLG7 reverse primer: CCTGGTTGTAGAGGTGAAAAAGTAATC
DLG7 probe: TGCCAGACACATTTCTTTTGGTGGTAACC - DUSP9 forward primer: GGCCTACCTCATGCAGAAGCT
DUSP9 reverse primer: GGGAGATGTTAGACTTCTTCCTCTTG
DUSP9 probe: CACCTCTCTCTCAACGATGCCTATGACCTG - E2F5 forward primer: CCTGTTCCCCCACCTGATG
E2F5 reverse primer: TTTCTGTGGAGTCACTGGAGTCA
E2F5 probe: CCTCACACAGCCTTCCTCCCAGTCC - GHR forward primer: CCCAGGTGAGCGACATTACA
GHR reverse primer: CATCCCTGCCTTATTCTTTTGG
GHR probe: CAGCAGGTAGTGTGGTCCTTTCCCCG - HPD forward primer: CCCACGCTCTTCCTGGAA
HPD reverse primer: TTGCCGGCTCCAAAACC
HPD probe: TCATCCAGCGCCACAACCACCA - IGSF1 forward primer: GACCATTGCCCTTGAAGAGTGT
IGSF1 reverse primer: GAGAGGTTGATGAAGGAGAATTGG
IGSF1 probe: ACCAAGAAGGAGAACCAGGCACCCC - NLE1 forward primer: TGCCTCCTTTGACAAGTCCAT
NLE1 reverse primer: CGCGTAGGGAAGCCAGGTA
NLE1 probe: TGGGATGGCAGGACGGGCA - RPL10A forward primer TCGGCCCAGGTTTAAATAAGG
RPL10A reverse primer CCACTTTGGCCACCATGTTT
RPL10A Taqman probe AGTTCCCTTCCCTGCTCACACACAACG - ACTG1 forward primer: GGCGCCCAGCACCAT
ACTG1 reverse primer: CCGATCCACACCGAGTACTTG
ACTG1 probe: ATCAAGATCATCGCACCCCCAGAGC - EEF1A1 forward primer: GCGGTGGGTGTCATCAAAG
EEF1A11 reverse primer: TGGGCAGACTTGGTGACCTT
EEF1A11 probe: AGTGGACAAGAAGGCTGCTGGAGCTG - PNN forward primer: GAATTCCCGGTCCGACAGA
PNN reverse primer: TTTCGGTCTCTTTCACTTCTTGAA
PNN probe: AGAGGTCTATATCAGAGAGTAGTCGATCAGGCAAAAGA - RHOT2 forward primer: CCCAGCACCACCATCTTCAC
RHOT2 reverse primer: CCAGAAGGAAGAGGGATGCA
RHOT2 Taqman probe: CAGCTCGCCACCATGGCCG - Identification of two HB subclasses by gene expression profiling
- For robust unsupervised classification, we generated and screened a series of 24 dendrograms to identify samples that co-clustered whatever the method and the gene list. We obtained two robust subgroups of tumors named robust Cluster 1 (rC1, n=8) and robust Cluster 2 (rC2, n=5) (
Figure 1A ). Comparison of rC1 and rC2 expression profiles identified 824 genes (p < 0.001, false discovery rate (FDR) = 0.02) (Figure 1B ). KEGG pathway analysis pinpointed a strong enrichment of cell cycle related genes (p < 10-11), most being up-regulated in rC2 tumors. These genes were mainly assigned to GO categories including mitosis regulation, spindle checkpoint, nucleotide biosynthesis, RNA helicase activity, ribosome biogenesis, and translational regulation. Evidence that rC2 tumors were faster proliferating than rC1 tumors was further confirmed by Ki-67 immunostaining (seeFigure 2A ). - The remaining tumors were classified into C1 (rC1-related) and C2 (rC2-related) subclasses by applying a predictive approach based on the rC1/rC2 gene signature and using robust samples as training set (
Figure 1C ). Both groups exhibited similar, high rates of β-catenin mutations, and accordingly, immunohistochemistry (IHC) of β-catenin showed cytoplasmic and nuclear staining of the protein in the majority of HBs. However, β-catenin localization was predominantly membranous and cytoplasmic in C1 tumors, whereas it showed frequent loss of membrane anchoring and intense nuclear accumulation in C2 tumors (Figure 1C ). - We observed differential expression of a number of Wnt members and targets between subclasses. C2 tumors showed increased expression of MYCN, BIRGS that encodes the anti-apoptotic factor Survivin, NPM1 (encoding nucleophosmin) and HDAC2. By contrast, most C1 tumors prominently expressed the Wnt antagonist DKK3, BMP4, and genes previously found to be activated in liver tumors carrying mutant β-catenin (Boyault et al., 2007; Renard et al., 2007; Stahl et al., 2005). Remarkably, most genes related to liver functions are expressed in the perivenous area of adult livers, such as GLUL, RHBG, and two members of the cytochrome p450 family: CYP2E1 and GYP1A (Benhamouche et al., 2006; Braeuning et al., 2006) (
Figure 1D ). - Further evidence that the rC1 subclass was enriched in genes assigned to the hepatic perivenous program was provided by Gene Set Enrichment Analysis (GSEA), a computational method for assessing enrichment of a predefined gene list in one class as compared with another (Subramanian et al., 2005). Thus, Wnt/β-catenin signaling appears to activate different transcriptional programs in HB subtypes, likely reflecting different cellular contexts.
- HB subclasses evoke distinct phases of liver development
- Next, we sought to determine whether HB subclasses were associated with specific histological phenotypes. Mixed epithelial-mesenchymal tumors that represented 20% of cases were not significantly associated with C1 and C2 subclasses. By contrast, a tight association was found with the main epithelial component, which defines the cell type occupying more than 50% of tumor cross-sectional areas. Sixteen out of 18 C1 tumors displayed a predominant fetal phenotype, including 4 'pure fetal' cases, whereas all C2 tumors showed a more immature pattern, with prevailing embryonal or crowded-fetal histotypes associated with high proliferation (Finegold, 1994) (p < 0.0001) (
Figure 2A ). Further relationship between molecular subclasses and hepatic developmental stages was provided by the finding that a number of mature hepatocyte markers were markedly downregulated in C2 compared to C1 tumors (Tables 1 and 2). Conversely, C2 tumors showed strong overexpression (35-fold) of the oncofetal AFP gene associated to high protein levels in tumor cells by IHC (Figure 2A ) and in patients' sera (r = 0.79, p < 0.0001). C2 tumors also abundantly expressed hepatic progenitor markers such as KRT19 (encoding cytokeratin 19) and TACSTD1, also known as Ep-CAM (Figure 2B ). - To better define the relationships between HB subclasses and phases of hepatic differentiation, we first generated a liver development-related gene signature by making use of publicly available mouse fetal and adult liver data sets (Otu et al., 2007). When applied to HB samples, this signature was able to distinguish by hierarchical clustering two HB groups closely matching the C1/C2 classification. Next, we integrated HB gene expression data with the orthologous genes expressed in mouse livers at embryonic days (E) 11.5 to 18.5, and at 8 days of birth. In unsupervised clustering, most C2 tumors co-clustered with mouse livers at early stages of embryonic development (E11.5 and E12.5), whereas C1 tumors gathered with mouse livers at late fetal and postnatal stages. Together, these data comfort the notion that tumor cells in C2 and C1 subtypes are arrested at different points of the hepatic differentiation program.
- Identification of a 16-gene signature as HB classifier
- To investigate the relevance of molecular HB classification in an independent set of tumors, we defined a HB classifier signature derived from the top list of genes differentially expressed between rC1 and rC2 clusters. After qPCR assessment, a list of 16 top genes at p ≤ 10-7 was selected to form a class predictor (Table 1). Most of these genes show drastic variations in expression level during liver development, and among them, BUB1 and DLG7 have been repeatedly identified as hESC markers (Assou et al., 2007). The 16-gene expression profile was first investigated in rC1 and rC2 samples used as training set, and it predicted classification with 100% of accuracy in these samples, using either microarray or qPCR data. The robustness of this signature was confirmed by correct classification into C1 and C2 subclasses of all 13 remaining tumors analyzed by microarray (
Figure 1E ). Expression profiles of fetal livers and normal liver for these 16-gene signature were also assayed (Figure 1F ). This signature was therefore employed to classify a new, independent set of 41 HB samples by qPCR (Figures 4 and5 and Table 8), resulting in 21 tumors categorized as C1 and 20 tumors as C2 subtype (Figure 3 ). - Extending our previous observation, C1/C2 classification in this new set of tumors was unrelated to CTNNB1 mutation rate. Using qPCR, we also confirmed enhanced expression in C2 tumors of liver progenitor markers such as AFP, Ep-CAM, and KRT19, as well as MYCN (
Figure 3 ). Moreover, while a similar percentage of C1 and C2 tumors displayed mesenchymal components, a predominant fetal histotype was found in 95% of tumors of the C1 subtype, whereas in 82% of C2 tumors, the major component displayed less differentiated patterns such as embryonal, crowded-fetal, macrotrabecular and SCUD types (p < 0.0001) (Figure 3 ). To further assess the association of HB subclasses with liver development, 5 human fetal livers at different weeks of gestation were included in the qPCR studies. In unsupervised clustering, fetal livers at late (> 35 weeks) and earlier (17 to 26 weeks) developmental stages were classified as C1 and C2 respectively, further supporting that HB subclasses reflect maturation arrest at different developmental phases.Table 8. Gene expression of the prognostic signature for liver cancer by quantitative RT-PCR. NL, non-tumor liver; C1, good prognosis hepatoblastomas; C2, bad prognosis hepatoblastomas. Shown are the median values of 46 hepatoblastomas from 41 patients, the minimal and maximal values in each class, and the fold changes between classes. Data are presented in arbitrary units after normalization of the raw quantitative PCR values with genes (ACTG1, EFF1A1, PNN and RHOT2) that presents highly similar values in all samples. Gene expression of the 16 genes are presented on Figures 4 and 5. C1 C2 NL Fold-change median min max median min max median min max C1/NL C2/NL C2/C1 C1/C2 AFP 0,4 0,0 33,3 30,7 0,0 456,1 0,2 0,0 8,8 2,3 38,1 16,5 0,1 ALDH2 87,1 13,2 356,7 15,0 2,2 74,4 240,4 151,6 387,6 0,3 0,1 0,2 5,2 APCS 61,6 1,1 338,9 1,9 0,0 276,2 158,6 92,7 509,5 0,2 0,0 0,1 19,8 APOC4 21,3 4,3 122,8 1,6 0,1 24,2 47,0 22,3 112,4 0,5 0,0 0,1 16,1 AQP9 60,6 8,0 540,6 2,5 0,1 90,1 46,6 38,0 72,7 1,3 0,1 0,1 18,9 BUB1 0,0 0,0 0,4 0,9 0,1 3,9 0,0 0,0 0,1 1,2 16,1 13,4 0,1 C1S 51,1 14,9 277,2 7,5 1,3 96,0 223,4 129,3 565,3 0,2 0,0 0,2 5,7 CYP2E1 583,2 97,7 3463,0 19,7 0,4 1504,0 1128,6 527,6 1697,0 0,7 0,0 0,0 51,6 DLG7 0,0 0,0 0,0 0,1 0,0 0,5 0,0 0,0 0,0 1,7 12,4 7,3 0,1 DUSP9 1,5 0,4 45,7 19,1 0,0 179,0 0,6 0,2 1,3 4,0 18,3 4,6 0,2 E2F5 0,2 0,0 2,0 1,1 0,1 11,7 0,1 0,0 0,5 1,8 6,5 3,5 0,3 GHR 5,2 0,0 54,0 0,5 0,0 2,4 35,2 20,8 54,5 0,1 0,0 0,1 8,6 HPD 22,9 0,9 182,0 1,2 0,1 23,8 111,5 62,6 165,7 0,2 0,0 0,1 14,0 IGSF1 0,1 0,0 1,7 1,7 0,0 19,8 0,1 0,0 0,1 2,2 22,4 10,2 0,1 NLE 0,4 0,1 4,8 0,8 0,3 5,1 0,4 0,2 0,8 1,2 2,2 1,8 0,5 RPL10A 73,3 12,0 230,4 98,2 11,9 432,8 86,9 54,1 159,9 0,8 1,1 1,5 0,7 - The 16-gene signature as a strong independent prognostic factor
- In a first set of 61 patients
- The clinical impact of HB molecular classification was addressed in a first set of 61 patients (
Figures 7 and8 ), comprising 37 (61 %) C1 and 24 (39%) C2 cases. Besides strong association with predominant immature histotypes, HBs of the C2 subclass were tightly associated with features of advanced tumor stage, such as vascular invasion and extrahepatic metastasis (Figure 6A ). Accordingly, overall survival of these patients was markedly impaired. Kaplan-Meier estimates of overall survival probability at 2-years were 50% for patients with C2 tumors and 90% for patients with C1 tumors (p = 0.0001, log rank test), and similar trends were seen for disease-free survival probabilities (data not shown). Next, we examined whether pre-operative chemotherapy treatment given to 48 patients could affect tumor classification. These cases were evenly distributed among HB subclasses, with no significant association with molecular classification. Of note, available pretreatment biopsies were assigned to the same subclass as matched resected tumors in 3 out of 4 cases (seeFigure 3 ; HB112 and HB112b have been both classified as C1 grade, and HB114 and HB114b have been both classified as C2 grade). We examined the performance of the 16-gene signature on the 48 tumors resected after chemotherapy, and found significant difference in outcome between patients with C1 and C2 type HBs (p = 0.0021, log rank test) (Figure 6B ). Remarkably, Kaplan-Meier analysis confirmed C2 subclass as a poor prognostic group in 17 cases for which pre-treatment biopsies or primary surgery specimens were available (p = 0.0318, log rank test) (Figure 6C ). - We further assessed the prognostic validity of the 16-gene signature for all patients in multivariate analysis, using a Cox proportional hazards model with pathological and clinical variables associated to patients' survival. This analysis identified the signature as an independent prognostic factor, with better performance than tumor stage defined by PRETEXT stage, vascular invasion and extrahepatic metastases (
Figure 6D ). Thus, this signature demonstrated strong prognostic relevance when compared to current clinical criteria. - In a second set of 86 patients
- The clinical impact of HB molecular classification was addressed in a second set of patients (comprising the sample of the first set), comprising 53 (61%) C1 and 33 (39%) C2 cases. Besides strong association with predominant immature histotypes, HBs of the C2 subclass were tightly associated with features of advanced tumor stage, such as vascular invasion and extrahepatic metastasis (
Figure 9A ). Accordingly, overall survival of these patients was markedly impaired. Kaplan-Meier estimates of overall survival probability at 2-years were 60% for patients with C2 tumors and 94% for patients with C1 tumors (p = 0.00001, log rank test), and similar trends were seen for disease-free survival probabilities (Table 9).Table 9: Survival analysis (Kaplan Meier, log rank test); DFS: disease-free survival; Others: dead or alive with recurrent disease. N. of patients 61 C1+25 C2 = 86 P value Survival (all patients) Alive/ Dead C1 50/3 <0.00001 C2 20/13 DFS (all patients) DFS/ others C1 48/5 <0.00001 C2 18/15 Survival (non-treated patients) Alive/ Dead C1 12/0 0.0164 C2 11/6 DFS (non-treated patients) DFS/ others C1 12/0 0.0213 C2 12/6 - Next, we examined whether pre-operative chemotherapy treatment given to 73 patients could affect tumor classification. These cases were evenly distributed among HB subclasses, with no significant association with molecular classification. We examined the performance of the 16-gene signature on the 73 tumors resected after chemotherapy, and found significant difference in outcome between patients with C1 and C2 type HBs (p = 0.0002, log rank test) (
Figure 9B ). Remarkably, Kaplan-Meier analysis confirmed C2 subclass as a poor prognostic group in 29 cases for which pre-treatment biopsies or primary surgery specimens were available (p = 0.0164, log rank test) (Figure 9C). - We further assessed the prognostic validity of the 16-gene signature for all patients in multivariate analysis, using a Cox proportional hazards model with pathological and clinical variables associated to patients' survival. This analysis identified the signature as an independent prognostic factor, with better performance than tumor stage defined by PRETEXT stage, vascular invasion and extrahepatic metastases (Figure 9D).
- Finally, various clinical elements of 103 HB samples from 86 patients were compared with respect to their classification as C1 or C2 grade using the 16-gene signature (Table 10).
Table 10: Clinical correlations. STD : standard risks (cisplatine) - High : high risk (cisplatine/doxorubicine, intensified treatment); Tumor stage (defined as Vasc. Inv and/or metastasis and/or PRETEXT stage IV); metastasis: extrahepatic metastasis (mainly lung); vascular invasion is determined by imagery; Pretext IV (involved an intrahepatic extent of the tumor to all hepatic sections); multifocality (more than 2 tumor nodules); Ep: pure epithelial form - Mixed: mesenchymatous and epithelial mixed form; Fetal: well differentiated; non fetal: embryonic, atypic, SCUD and/or macrotrabecular cells. N. of patients 61+25 = 86 p-value (chi-square) Gender ns Chemotherapy treatment Yes/No C1 47/6 ns C2 26/7 Chemotherapy protocol STD/ High C1 30/13 0.007 C2 9/16 TUMOR STAGE Early/ Advanced C1 32/20 0.005 C2 10/23 Metastasis No/ Yes C1 43/10 0.004 C2 17/16 Vascular Invasion No/ Yes C1 36/15 0.005 C2 13/20 Advanced Pretext stage (IV) No/ Yes C1 42/9 ns C2 24/7 Multifocality C1 No/ Yes 36/17ns C2 18/14 Histology C1 Ep/Mixed 31/21 ns C2 20/13 Main Epith Comp Fetal/ NonFetal C1 48/4 <0.0001 C2 6/22 - The above results carried out on a first set of 61 patients, and on a second completed set of 86 patients, demonstrate that the 16-gene signature, identified in the present application, is a strong prognostic relevance when compared to current clinical criteria.
- The present application demonstrates that, using integrated molecular and genetic studies, hepatoblastoma encompass two major molecular subclasses of tumors that evoke early and late phases of prenatal liver development. Aberrant activation of the canonical Wnt pathway represented a seminal event in both tumor types, with cumulated mutation rates of β-catenin, APC and AXIN over 80%. However, depending on tumor differentiation stage, Wnt signaling activated distinct transcriptional programs involved in tumor growth and invasiveness or in liver metabolism. Further comparisons of immature, embryonal-type HBs with the bulk of more differentiated, fetal-type tumors revealed a tight correlation between stage of hepatic maturation arrest and clinical behavior, notably vascular invasion and metastatic spread, and patients' survival.
- Molecular HB subclasses are determined by liver differentiation stages
- In this study, expression-based classification of HB was achieved through a highly reliable statistical method combining different unsupervised hierarchical clustering approaches. This method led to the selection of two robust tumor subgroups, and this robustness was confirmed using a new, independent set of samples and 16 relevant genes discriminating these tumor subgroups. These results demonstrated that the most significant differences between HB subclasses can be ascribed to distinct hepatic differentiation stages, as defined by comparison with expression profiles of mouse livers at early (E11.5- E12.5) and late (E14.5-E18.5) embryonic stages. These studies also provide biological relevance to early histologic classification that distinguished fetal and embryonal cells as major HB components (Weinberg and Finegold, 1983). The C1 subclass recapitulates liver features at the latest stage of intrauterine life, both by expression profile and by mostly fetal morphologic patterns, while in the C2 subclass, transcriptional program and predominant embryonal histotype resemble earlier stages of liver development. Thus, despite frequent morphological heterogeneity in HB, these expression-based subclasses closely matched the histologic types found to be prevailing after microscopic examination of the entire tumor mass.
- These results, showing that childhood liver tumors recapitulate programs of their developing counterpart, are in line with recent studies using cross-species comparisons. It has been demonstrated that clinically distinct medulloblastoma subtypes can be identified by their similarity with precise stages of murine cerebellar development (Kho et al., 2004). Evidence for conserved mechanisms between development and tumorigenesis was also obtained in Wilms' tumor, the embryonic kidney malignancy, which shares expression of stemness and imprinted genes with murine metanephric blastema (Dekel et al., 2006). It was noticed that HBs, like Wilms' tumors, exhibit robust overexpression of a number of paternally expressed genes like DLK1, IGF2, PEG3, and PEG10 that are involved in growth induction processes and downregulated with differentiation during development.
- Previous studies using stem cell markers and markers of hepatocytic and biliary lineages have described differential patterns among HB components that reflect sequential stages of liver development (Schnater et al., 2003). The present data extent these observations, and indicate that immature C2-type tumor cells evoke hepatic cancer progenitor cells, with distinctive overexpression of highly relevant markers such as
cytokeratin 19 and Ep-CAM (Roskams, 2006). Recently, embryonic stem/progenitor cells have been isolated from human fetal livers, either by enrichment of blast-like cells in primary hepatoblast cultures or by immunoselection of Ep-CAM-positive epithelial cells (Dan et al., 2006; Schmelzer et al., 2007). These cell lines have self-renewal capacity and can differentiate into mature hepatocytes and cholangiocytes, and one of them also gives rise to various mesenchymal lineages (Dan et al., 2006). Whether HBs arise from transformation of these cell types is presently unknown. As malignant mesenchymal derivatives are frequently admixed with epithelial tissues in HB, it is tempting to speculate that this tumor occurs from a multipotent progenitor harboring characteristics of mesenchymal-epithelial transitional cells. Moreover, since no significant differences in gene expression profiles was noted here between pure epithelial and mixed epithelial-mesenchymal HBs, tumor cells likely kept intrinsic capacities to undergo epithelial-mesenchymal transition. - A salient feature of immature HBs is the characteristic interplay of stemness and proliferation found in aggressive tumors (Glinsky et al., 2005). The C2-type expression profile was significantly enriched in hESC markers, including the mitotic cell cycle and spindle assembly checkpoint regulators cyclin B1, BUB1, BUB1 B, and Aurora kinases. These mitotic kinases are centrosomal proteins that ensure proper spindle assembly and faithful chromosome segregation in mitosis. Overexpression of these kinases or other components of the spindle checkpoint induces centrosome amplification and defects in chromosome segregation leading to chromosome number instability and aneuploidy (Marumoto et al., 2005; Zhou et al., 1998). Non-disjunctional events are involved in developmental syndromes (Hassold and Hunt, 2001), and might be responsible for increased rate of chromosomal imbalances evidenced here in C2-type HBs.
- Context-dependent transcriptional programs driven by Wnt signalling
- Mutational activation of β-catenin is a hallmark of HB, and accordingly, we found intracellular accumulation and nuclear localization of the protein in virtually all tumors, albeit with variable frequencies and intensities. Both immature and differentiated tumors overexpressed AXIN2 and DKK1, reflecting an attempt to activate a negative feedback loop aimed at limiting the Wnt signal. However, the two HB subtypes showed significant differences in β-catenin immunoexpression, illustrated by concomitant nuclear accumulation and decreased membranous localization of the protein in poorly differentiated, highly proliferative HBs. Heterogeneous distribution of nuclear β-catenin within colorectal tumors has been linked to different levels of Wnt signaling activity, resulting from differential combinations of autocrine and paracrine factors (Fodde and Brabletz, 2007). Similarly, nuclear β-catenin might be related to the absence of membranous E-cadherin in immature HBs, as we reported previously (Wei et al., 2000), and to cross-talks with growth-stimulating pathways in less differentiated cells. In this context, increased dosage of Wnt signaling might induce migratory and invasive phenotype.
- Major differences between the two HB subtypes were found here in expression levels of Wnt targets involved in liver functions. Recent studies have demonstrated that Wnt/β-catenin signaling governs liver metabolic zonation by controlling positively the perivenous gene expression program and negatively the periportal program (Benhamouche et al., 2006). In our study, overexpression of hepatic perivenous markers such as GLUL was prominent in differentiated HBs, while genes encoding periportal functions like GLS2 were downregulated. This profile is highly similar to those of human and murine HCCs expressing mutant β-catenin (Boyault et al., 2007; Stahl et al., 2005), and corresponds to an hepatic signature of Wnt target genes. Accordingly, the zonation-related profile was lessened in poorly differentiated HBs, and mutant β-catenin was found to activate a different, muscle-related expression program in the pediatric Wilms' tumor (Zirn et al., 2006).
- Clinical implications
- The clinical behavior of many human solid tumors has been related to their differentiation status and proliferative rate. We show that HB does not depart from this rule, with strong correlation of molecular subclasses linked to hepatic differentiation with clinical tumor stage and patient's outcome. This correlation was mainly determined by differences in invasive and metastatic phenotypes between the two subclasses, but not by differences in tumor localization or tumor extension across liver sections, which defines the preoperative staging (PRETEXT) utilized to evaluate tumor resectability (Perilongo et al., 2000). Major differences in expression profiles of the two molecular HB subtypes led us to elucidate a 16-gene signature that proved highly efficient in stratification of HBs as well as normal livers according to hepatic developmental stage. Most importantly, this classifier also discriminated aggressive tumors, exhibited powerful survival predictor capacities in pre-treatment biopsies and surgical specimens, and demonstrated strong prognostic relevance when confronted to current clinical criteria in multivariate analysis. Although immature HBs have been associated to worse clinical outcome as opposed to differentiated HBs (Weinberg and Finegold, 1983), frequent cellular heterogeneity has hampered the use of histopathologic criteria for defining risk groups, excepted for a minority of cases showing 'pure fetal' or SCUD types. The expression signature afforded here enables direct appraisal of the global degree of tumor cell maturation, allowing to bypass these difficulties. Thus, it can improve the outcome prediction and clinical management of hepatoblastoma, by identifying cases with increased risk of developing metastasis, or conversely, by avoiding unnecessary over-treatment.
- In conclusion, the present application identifies a 16-gene signature that distinguishes two HB subclasses and that is able to discriminate invasive and metastatic hepatoblastomas, and predicts prognosis with high accuracy. The identification of this expression signature with dual capacities may be used in recognizing liver developmental stage and in predicting disease outcome. This signature can be applied to improve clinical management of pediatric liver cancer and develop novel therapeutic strategies, and is therefore relevant for therapeutic targeting of tumor progenitor populations in liver cancer.
-
- Assou, S., Le Carrour, T., Tondeur, S., Strom, S., Gabelle, A., Marty, S., Nadal, L., Pantesco, V., Reme, T., Hugnot, J. P., et al. (2007). A meta-analysis of human embryonic stem cells transcriptome integrated into a web-based expression atlas. .
- Boyault, S., Rickman, D. S., de Reynies, A., Balabaud, C., Rebouissou, S., Jeannot, E., Herault, A., Saric, J., Belghiti, J., Franco, D., et al. (2007). Transcriptome classification of HCC is related to gene alterations and to new therapeutic targets. Hepatology 45, 42-52.
- Finegold, M. J., Lopez-Terrada, D. H., Bowen, J., Washington, M. K., and Qualman, S. J. (2007). Protocol for the examination of specimens from pediatric patients with hepatoblastoma. Arch Pathol Lab Med 131, 520-529.
- Fodde, R., and Brabletz, T. (2007). Wnt/beta-catenin signaling in cancer stemness and malignant behavior. Curr .
- Glinsky, G. V., Berezovska, O., and Glinskii, A. B. (2005). Microarray analysis identifies a death-from-cancer signature predicting therapy failure in patients with multiple types of cancer. J Clin Invest 115, 1503-1521.
- Hirschman, B. A., Pollock, B. H., and Tomlinson, G. E. (2005). The spectrum of APC mutations in children with hepatoblastoma from familial adenomatous polyposis kindreds. J Pediatr 147, 263-266.
- Irizarry, R. A., Hobbs, B., Collin, F., Beazer-Barclay, Y. D., Antonellis, K. J., Scherf, U., and Speed, T. P. (2003). Exploration, normalization, and summaries of high density oligonucleotide array probe level data. .
- Lee, J. S., Heo, J., Libbrecht, L., Chu, I. S., Kaposi-Novak, P., Calvisi, D. F., Mikaelyan, A., Roberts, L. R., Demetris, A. J., Sun, Z., et al. (2006). A novel prognostic subtype of human hepatocellular carcinoma derived from hepatic progenitor cells. .
- McLin, V. A., Rankin, S. A., and Zorn, A. M. (2007). Repression of Wnt/β-catenin signaling in the anterior endoderm is essential for liver and pancreas development. Development 134, 2207-2217.
- Perilongo, G., Shafford, E., and Plaschkes, J. (2000). SIOPEL trials using preoperative chemotherapy in hepatoblastoma. .
- Rowland, J. M. (2002). Hepatoblastoma: assessment of criteria for histologic classification. .
- Schnater, J. M., Kohler, S. E., Lamers, W. H., von Schweinitz, D., and Aronson, D. C. (2003). Where do we stand with hepatoblastoma? A review. Cancer 98, 668-678.
- Taniguchi, K., Roberts, L. R., Aderca, I. N., Dong, X., Qian, C., Murphy, L. M., Nagorney, D. M., Burgart, L. J., Roche, P. C., Smith, D. I., et al. (2002). Mutational spectrum of beta-catenin, AXIN1, and AXIN2 in hepatocellular carcinomas and hepatoblastomas. .
- Wei, Y., Fabre, M., Branchereau, S., Gauthier, F., Perilongo, G., and Buendia, M. A. (2000). Activation of beta-catenin in epithelial and mesenchymal hepatoblastomas. .








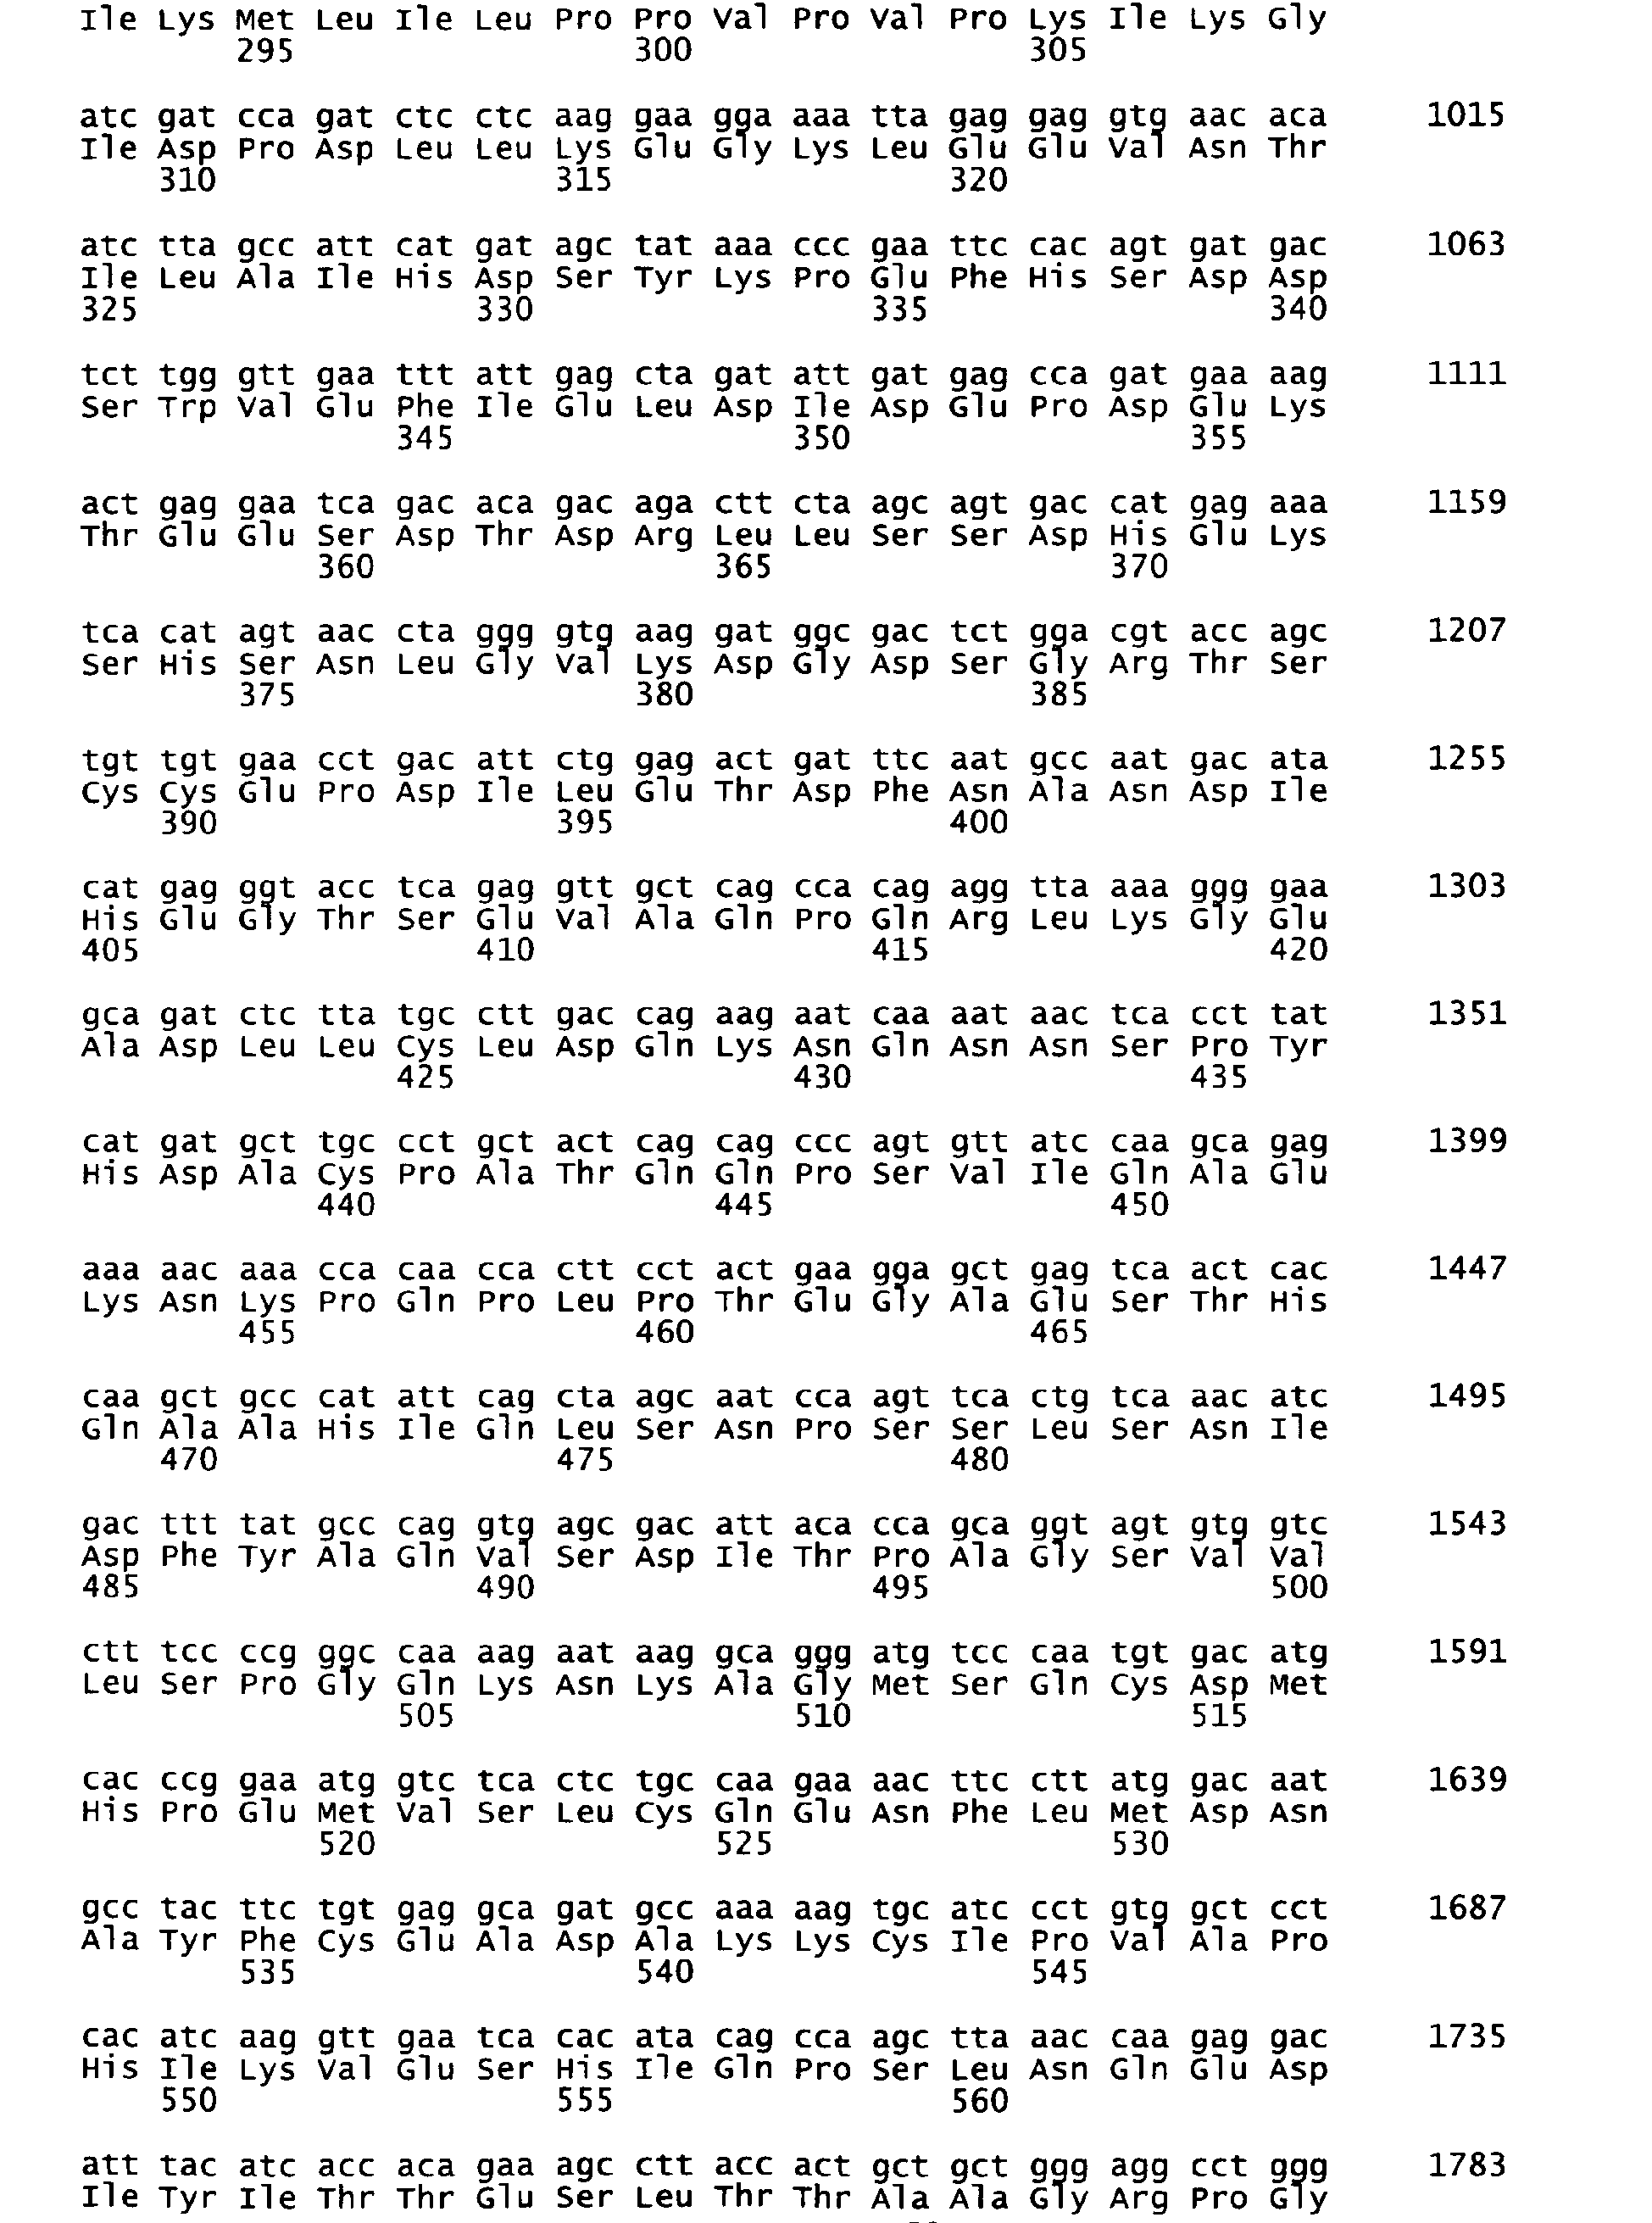


Claims (22)
- Method to determine the gene expression profile on a biological sample, comprising:a. assaying the expression of a set of genes in a sample previously obtained from a patient diagnosed for a liver tumor, wherein said set comprises from 2 to 16 genes or consists of 2 to 16 genes, said 2 to 16 genes being chosen in the group consisting in the alpha-fetoprotein (AFP), aldehyde dehydrogenase 2 (ALDH2), amyloid P component serum (APCS), apolipoprotein C-IV (APOC4), aquaporin 9 (AQP9), budding uninhibited by benzimidazoles 1 (BUB1), complement componant 1 (C1S), cytochrome p450 2E1 (CYP2E1), discs large homolog 7 (DLG7), dual specificity phosphatase 9 (DUSP9), E2F5 transcription factor (E2F5), growth hormone receptor (GHR), 4-hydroxyphenylpyruvase dioxygenase (DHP), immunoglogulin superfamily member 1 (IGSF1), Notchless homolog 1 (NLE1) and the ribosomal protein L10a (RPL10A) genes; andb. determining the gene expression profile of said sample.
- Method according to claim 1, which further comprises determining the grade of the liver tumor providing the sample, for example by comparing the obtained gene expression profile of said sample to the gene expression profile of a reference sample or to the gene expression profiles of a collection of reference samples
- Method according to claim 1 or 2, wherein the assay of the expression of said set of genes comprises a step of detecting nucleotide targets, wherein each nucleotide target is a product resulting from the expression of one of the genes in said set.
- Method according to claim 2, wherein said nucleotide targets are mRNA.
- Method according to any one of claims 1 to 4, wherein the assay of the expression of said set of genes comprises an amplification step, such as performed by qualitative polymerase chain reaction prior to a step of detecting the mRNA of each gene of said set.
- Method according to any one of claims 1 to 5, wherein the assay of the expression of said set of genes comprises a hybridization step, such as one performed by hybridization on a solid or liquid support, especially on an array, prior to a step of detecting the mRNA of each gene of said set.
- Method according to any one of claims 2 to 5, wherein said detected nucleotide targets are quantified with respect to at least one nucleotide target, expression product of an invariant gene, such as ACTG1, EFF1A1, PNN and RHOT2 genes.
- Method according to any one of claims 1 to 7, wherein said liver tumor is a hepatoblastoma (HB) or a hepatocellular carcinoma (HCC).
- Method according to any one of claims 2 to 8, wherein said method comprises, before step a., the preparation of said nucleotide targets from the sample.
- Method according to any one of claims 1 to 9, wherein said set of genes comprises or consists in a set chosen in the group consisting of:(a) E2F5 and HPD genes;(b) APCS, BUB1, E2F5, GHR and HPD genes;(c) ALDH2, APCS, APOC4, BUB1, C1 S, CYP2E1, E2F5, GHR and HPD genes;(d) ALDH2, APCS, APOC4, AQP9, BUB1, C1S, DUSP9, E2F5 and RPL10A genes;(e) ALDH2, APCS, APOC4, AQP9, C1S, CYP2E1, E2F5, GHR, IGSF1 and RPL10A genes; and(f) AFP, ALDH2, APCS, APOC4, AQP9, BUB1, C1S, CYP2E1, DLG7, DUSP9, E2F5, GHR, HPD, IGSF1, NLE1 and RPL10A genes.
- Kit, suitable to carry out the method as defined in any one of claims 1 to 10, comprisinga. a plurality of pairs of primers specific for a set of genes to be assayed, said set comprising 2 to 16 genes or consisting of 2 to 16 genes, said 2 to 16 genes being chosen in the group consisting of AFP, ALDH2, APCS, APOC4, AQP9, BUB1, C1S, CYP2E1, DLG7, DUSP9, E2F5, GHR, HPD, IGSF1, NLE1 and RPL10A genes; andb. optionally reagents necessary for the amplification of the nucleotide targets of these genes by said primers, and optionally reagents for detecting the amplification products.
- Kit according to claim 11, wherein each primer is 10 to 30 bp in length and has at least 80% similarity with its complementary sequence in the nucleotide target, preferably 100%.
- Kit according to claim 11 or 12, wherein said pairs of primers are chosen in the group consisting of:
gene Forward primer (5'-3') Reverse primer (5'-3') AFP AACTATTGGCCTGTGGCGAG TCATCCACCACCAAGCTGC ALDH2 GTTTGGAGCCCAGTCACCCT GGGAGGAAGCTTGCATGATTC APCS GGCCAGGAATATGAACAAGCC CTTCTCCAGCGGTGTGATCA APOC4 GGAGCTGCTGGAGACAGTGG TTTGGATTCGAGGAACCAGG AQP9 GCTTCCTCCCTGGGACTGA CAACCAAAGGGCCCACTACA BUB1 ACCCCTGAAAAAGTGATGCCT TCATCCTGTTCCAAAAATCCG C1S TTGTTTGGTTCTGTCATCCGC TGGAACACATTTCGGCAGC CYP2E1 CAACCAAGAATTTCCTGATCCAG AAGAAACAACTCCATGCGAGC DLG7 GCAGGAAGAATGTGCTGAAACA TCCAAGTCTTTGAGAAGGGCC DUSP9 CGGAGGCCATTGAGTTCATT ACCAGGTCATAGGCATCGTTG E2F5 CCATTCAGGCACCTTCTGGT ACGGGCTTAGATGAACTCGACT GHR CTTGGCACTGGCAGGATCA AGGTGAACGGCACTTGGTG HPD ATCTTCACCAAACCGGTGCA CCATGTTGGTGAGGTTACCCC IGSF1 CACTCACACTGAAAAACGCCC GGGTGGAGCAATTGAAAGTCA NLE1 ATGTGAAGGCCCAGAAGCTG GAGAACTTCGGGCCGTCTC RPL10A TATCCCCCACATGGACATCG TGCCTTATTTAAACCTGGGCC
a modified group of primers with respect to the above, wherein one or more primer(s) is modified, provided said primer(s) has at least 80% similarity with its non-modified version above. - A set of probes, suitable to carry out the method as defined in any one of claims 1 to 10, comprising a plurality of probes specific for a set of genes to assay, said set comprising or having from 2 to 16 genes, said 2 to 16 genes being chosen in the group consisting of AFP, ALDH2, APCS, APOC4, AQP9, BUB1, C1S, CYP2E1, DLG7, DUSP9, E2F5, GHR, HPD, IGSF1, NLE1 and RPL10A genes.
- A set of probes according to claim 14, wherein said probes are 50 to 200 bp in length and have at least 80% similarity to the complementary sequence of the nucleotide target of the gene, preferably 100%.
- A solid support, especially an array comprising a set of probes as defined in claims 14 or 15 linked to a support.
- A composition comprising a set of probes as defined in claim 14 or 15, in solution.
- A kit comprising a set of probes as defined in claim 14 or 15, a solid support as defined in claim 16 or a composition as defined in claim 17, and optionally reagents necessary for the hybridization of said nucleotide targets to said probes.
- Set of probes, solid support, arrays, compositions or kits according to any one of claims 11 to 18, suitable for assaying a set of genes which comprises or consists in a set chosen in the group consisting of:(a) E2F5 and HPD genes;(b) APCS, BUB1, E2F5, GHR and HPD genes;(c) ALDH2, APCS, APOC4, BUB1, C1 S, CYP2E1, E2F5, GHR and HPD genes;(d) ALDH2, APCS, APOC4, AQP9, BUB1, C1S, DUSP9, E2F5 and RPL10A genes;(e) ALDH2, APCS, APOC4, AQP9, C1S, CYP2E1, E2F5, GHR, IGSF1 and RPL10A genes; and(f) AFP, ALDH2, APCS, APOC4, AQP9, BUB1, C1S, CYP2E1, DLG7, DUSP9, E2F5, GHR, HPD, IGSF1, NLE1 and RPL10A genes.
- Use of a set of probes, solid support, arrays, compositions or kits according to any one of claims 11 to 18, to determine the grade of a liver tumor in a sample obtained from a patient.
- Use of a set of probes, arrays, compositions or kits according to any one of claims 11 to 18, to determine, in a patient, the risk of developing metastasis.
- Use of a set of probes, arrays, compositions or kits according to any one of claims 11 to 18, to define the therapeutic regimen to apply to said patient.
Priority Applications (5)
| Application Number | Priority Date | Filing Date | Title |
|---|---|---|---|
| EP08290628A EP2138589A1 (en) | 2008-06-27 | 2008-06-27 | Molecular signature of liver tumor grade and use to evaluate prognosis and therapeutic regimen |
| PCT/IB2009/006450 WO2009156858A1 (en) | 2008-06-27 | 2009-06-26 | Molecular signature of liver tumor grade and use to evaluate prognosis and therapeutic regimen |
| US12/999,907 US9347088B2 (en) | 2008-06-27 | 2009-06-26 | Molecular signature of liver tumor grade and use to evaluate prognosis and therapeutic regimen |
| CA2729554A CA2729554C (en) | 2008-06-27 | 2009-06-26 | Molecular signature of liver tumor grade and use to evaluate prognosis and therapeutic regimen |
| EP09769669.4A EP2307570B1 (en) | 2008-06-27 | 2009-06-26 | Molecular signature of liver tumor grade and use to evaluate prognosis and therapeutic regimen |
Applications Claiming Priority (1)
| Application Number | Priority Date | Filing Date | Title |
|---|---|---|---|
| EP08290628A EP2138589A1 (en) | 2008-06-27 | 2008-06-27 | Molecular signature of liver tumor grade and use to evaluate prognosis and therapeutic regimen |
Publications (1)
| Publication Number | Publication Date |
|---|---|
| EP2138589A1 true EP2138589A1 (en) | 2009-12-30 |
Family
ID=40030289
Family Applications (1)
| Application Number | Title | Priority Date | Filing Date |
|---|---|---|---|
| EP08290628A Withdrawn EP2138589A1 (en) | 2008-06-27 | 2008-06-27 | Molecular signature of liver tumor grade and use to evaluate prognosis and therapeutic regimen |
Country Status (1)
| Country | Link |
|---|---|
| EP (1) | EP2138589A1 (en) |
Cited By (4)
| Publication number | Priority date | Publication date | Assignee | Title |
|---|---|---|---|---|
| CN109259780A (en) * | 2018-07-24 | 2019-01-25 | 南方医科大学南方医院 | The aided assessment system and method that gastric cancer prognosis and chemotherapy based on enhancing CT images group benefit |
| CN112858678A (en) * | 2019-11-12 | 2021-05-28 | 上海奥普生物医药股份有限公司 | Creatine kinase isoenzyme detection kit, preparation method and application |
| CN113517023A (en) * | 2021-05-18 | 2021-10-19 | 柳州市人民医院 | Sex-related liver cancer prognosis marker factor and screening method thereof |
| CN116298286A (en) * | 2022-11-28 | 2023-06-23 | 中国人民解放军海军军医大学第三附属医院 | A biomarker APCS and its application in the treatment of liver cancer |
Citations (4)
| Publication number | Priority date | Publication date | Assignee | Title |
|---|---|---|---|---|
| US20020142981A1 (en) * | 2000-06-14 | 2002-10-03 | Horne Darci T. | Gene expression profiles in liver cancer |
| WO2003010336A2 (en) * | 2001-07-25 | 2003-02-06 | Sabine Debuschewitz | Molecular markers for hepatocellular carcinoma |
| WO2005005601A2 (en) * | 2003-06-09 | 2005-01-20 | The Regents Of The University Of Michigan | Compositions and methods for treating and diagnosing cancer |
| EP1661991A1 (en) * | 2003-08-24 | 2006-05-31 | Nihon University | Hepatocellular cancer-associated gene |
-
2008
- 2008-06-27 EP EP08290628A patent/EP2138589A1/en not_active Withdrawn
Patent Citations (4)
| Publication number | Priority date | Publication date | Assignee | Title |
|---|---|---|---|---|
| US20020142981A1 (en) * | 2000-06-14 | 2002-10-03 | Horne Darci T. | Gene expression profiles in liver cancer |
| WO2003010336A2 (en) * | 2001-07-25 | 2003-02-06 | Sabine Debuschewitz | Molecular markers for hepatocellular carcinoma |
| WO2005005601A2 (en) * | 2003-06-09 | 2005-01-20 | The Regents Of The University Of Michigan | Compositions and methods for treating and diagnosing cancer |
| EP1661991A1 (en) * | 2003-08-24 | 2006-05-31 | Nihon University | Hepatocellular cancer-associated gene |
Non-Patent Citations (25)
| Title |
|---|
| "Affimetrix GeneChip Human Genome U133 Array Set HG-U133A", GEO, 17 February 2002 (2002-02-17), XP002254749 * |
| "Human Genome U95 Set", ANNOUNCEMENT AFFYMETRIX, 1 April 2000 (2000-04-01), pages 1 - 2, XP002284454 * |
| ARONSON ET AL., JOURNAL OF CLINICAL ONCOLOGY, vol. 23, no. 6, 2005, pages 1245 - 1252 |
| ASSOU, S. ET AL.: "A meta- analysis of human embryonic stem cells transcriptome integrated into a web-based expression atlas", STEM CELLS, vol. 25, 2007, pages 961 - 973, XP002735582 |
| BOYAULT, S. ET AL.: "Transcriptome classification of HCC is related to gene alterations and to new therapeutic targets", HEPATOLOGY, vol. 45, 2007, pages 42 - 52, XP002598559, DOI: doi:10.1002/hep.21467 |
| CAIRO S. ET AL.: "Hepatic Stem-like Phenotype and Interplay of Wnt/beta-Catenin and Myc Signaling in Aggressive Childhood Liver Cancer.", CANCER CELL, vol. 14, no. 6, 9 December 2008 (2008-12-09), pages 471 - 484, XP002508978, ISSN: 1535-6108 * |
| FINEGOLD, M. J. ET AL.: "Protocol for the examination of specimens from pediatric patients with hepatoblastoma", ARCH PATHOL LAB MED, vol. 131, 2007, pages 520 - 529 |
| FODDE, R.; BRABLETZ, T.: "Wnt/beta-catenin signaling in cancer sternness and malignant behavior", CURR OPIN CELL BIOL, vol. 19, 2007, pages 150 - 158, XP005931720, DOI: doi:10.1016/j.ceb.2007.02.007 |
| GLINSKY, G. V.; BEREZOVSKA, 0.; GLINSKII, A. B.: "Microarray analysis identifies a death-from-cancer signature predicting therapy failure in patients with multiplectypes of cancer", J CLIN INVEST, vol. 115, 2005, pages 1503 - 1521 |
| HIRSCHMAN, B. A.; POLLOCK, B. H.; TOMLINSON, G. E.: "The spectrum of APC mutations in children with hepatoblastoma from familial adenomatous polyposis kindreds", J PEDIATR, vol. 147, 2005, pages 263 - 266, XP005692264, DOI: doi:10.1016/j.jpeds.2005.04.019 |
| IRIZARRY, R. A. ET AL.: "Exploration, normalization, and summaries of high density oligonucleotide array probe level data", BIOSTATISTICS, vol. 4, 2003, pages 249 - 264, XP002466228, DOI: doi:10.1093/biostatistics/4.2.249 |
| KUROKAWA Y. ET AL.: "Molecular-based prediction of early recurrence in hepatocellular carcinoma", JOURNAL OF HEPATOLOGY, MUNKSGAARD INTERNATIONAL PUBLISHERS, COPENHAGEN, DK, vol. 41, no. 2, 1 August 2004 (2004-08-01), pages 284 - 291, XP004599799, ISSN: 0168-8278 * |
| LEE, J. S. ET AL.: "A novel prognostic subtype of human hepatocellular carcinoma derived from hepatic progenitor cells", NAT MED, vol. 12, 2006, pages 410 - 416, XP002598558, DOI: doi:10.1038/nm1377 |
| LI Y. ET AL.: "Discovery and analysis of hepatocellular carcinoma genes using cDNA microarrays", JOURNAL OF CANCER RESEARCH AND CLINICAL ONCOLOGY, SPRINGER INTERNATIONAL, BERLIN, DE, vol. 128, 1 January 2002 (2002-01-01), pages 369 - 379, XP003013122, ISSN: 0171-5216 * |
| MCLIN, V. A.; RANKIN, S. A.; ZORN, A. M.: "Repression of Wnt/B-catenin signaling in the anterior endoderm is essential for liver and pancreas development", DEVELOPMENT, vol. 134, pages 2207 - 2217, XP002505149 |
| OTU H.H. ET AL.: "Restoration of liver mass after injury requires proliferative and not embryonic transcriptional patterns", JOURNAL OF BIOLOGICAL CHEMISTRY, vol. 282, no. 15, April 2007 (2007-04-01), pages 11197 - 11204, XP002508977, ISSN: 0021-9258 * |
| PERILONGO, G.; SHAFFORD, E.; PLASCHKES, J.: "SIOPEL trials using preoperative chemotherapy in hepatoblastoma", LANCET ONCOL, vol. 1, 2000, pages 94 - 100, XP004814042, DOI: doi:10.1016/S1470-2045(00)00018-8 |
| ROEBUCK, PEDIATR RADIOL, vol. 37, 2007, pages 123 - 132 |
| ROWLAND, J. M.: "Hepatoblastoma: assessment of criteria for histologic classification", MED PEDIATR ONCOL, vol. 39, 2002, pages 478 - 483 |
| SAMBROOK ET AL.: "Molecular Cloning, A laboratory Manual", pages: 10.1 - 10.10 |
| SAMBROOK ET AL.: "Molecular Cloning, A laboratory Manual", pages: 8.13 - 8.16 |
| SCHNATER, J. M. ET AL.: "Where do we stand with hepatoblastoma?", A REVIEW. CANCER, vol. 98, 2003, pages 668 - 678 |
| TANIGUCHI, K. ET AL.: "Mutational spectrum of beta-catenin, AXIN1, and AXIN2 in hepatocellular carcinomas and hepatoblastomas", ONCOGENE, vol. 21, 2002, pages 4863 - 4871, XP002994579, DOI: doi:10.1038/sj.onc.1205591 |
| WEI, Y. ET AL.: "Activation of beta-catenin in epithelial and mesenchymal hepatoblastomas", ONCOGENE, vol. 19, 2000, pages 498 - 504 |
| XU L. ET AL.: "Expression profiling suggested a regulatory role of liver-enriched transcription factors in human hepatocellular carcinoma", CANCER RESEARCH, AMERICAN ASSOCIATION FOR CANCER RESEARCH, BALTIMORE, MD.; US, vol. 61, no. 7, 1 April 2001 (2001-04-01), pages 3176 - 3181, XP002243262 * |
Cited By (5)
| Publication number | Priority date | Publication date | Assignee | Title |
|---|---|---|---|---|
| CN109259780A (en) * | 2018-07-24 | 2019-01-25 | 南方医科大学南方医院 | The aided assessment system and method that gastric cancer prognosis and chemotherapy based on enhancing CT images group benefit |
| CN112858678A (en) * | 2019-11-12 | 2021-05-28 | 上海奥普生物医药股份有限公司 | Creatine kinase isoenzyme detection kit, preparation method and application |
| CN112858678B (en) * | 2019-11-12 | 2023-10-27 | 上海奥普生物医药股份有限公司 | Creatine kinase isoenzyme detection kit, preparation method and application |
| CN113517023A (en) * | 2021-05-18 | 2021-10-19 | 柳州市人民医院 | Sex-related liver cancer prognosis marker factor and screening method thereof |
| CN116298286A (en) * | 2022-11-28 | 2023-06-23 | 中国人民解放军海军军医大学第三附属医院 | A biomarker APCS and its application in the treatment of liver cancer |
Similar Documents
| Publication | Publication Date | Title |
|---|---|---|
| EP2307570B1 (en) | Molecular signature of liver tumor grade and use to evaluate prognosis and therapeutic regimen | |
| JP2018068299A (en) | Method for using gene expression to determine prognosis of prostate cancer | |
| WO2008115419A2 (en) | Gene expression markers for prediction of patient response to chemotherapy | |
| JP2009528825A (en) | Molecular analysis to predict recurrence of Dukes B colorectal cancer | |
| WO2015073949A1 (en) | Method of subtyping high-grade bladder cancer and uses thereof | |
| US20110143946A1 (en) | Method for predicting the response of a tumor in a patient suffering from or at risk of developing recurrent gynecologic cancer towards a chemotherapeutic agent | |
| EP2191020A2 (en) | Gene expression markers of recurrence risk in cancer patients after chemotherapy | |
| CN101960022A (en) | Molecular staging and prognosis of stage II and III colon cancer | |
| WO2022053065A1 (en) | Biomarker used for predicting or evaluating lung cancer patients, detection method, and application | |
| EP3149210A1 (en) | Method and systems for lung cancer diagnosis | |
| US20150344962A1 (en) | Methods for evaluating breast cancer prognosis | |
| US20250137066A1 (en) | Compostions and methods for diagnosing lung cancers using gene expression profiles | |
| US20070059697A1 (en) | Determining cancer-linked genes and therapeutic targets using molecular cytogenetic methods | |
| US20080305493A1 (en) | Determining Cancer-Linked Genes and Therapeutic Targets Using Molecular Cytogenetic Methods | |
| US9410205B2 (en) | Methods for predicting survival in metastatic melanoma patients | |
| EP2425015B1 (en) | A method to assess prognosis and to predict therapeutic success in cancer by determining hormone receptor expression levels | |
| US20200370122A1 (en) | Immune index methods for predicting breast cancer outcome | |
| AU2018244758A1 (en) | Method and kit for diagnosing early stage pancreatic cancer | |
| US20130303400A1 (en) | Multimarker panel | |
| US20220136065A1 (en) | High-grade serous ovarian carcinoma (hgsoc) | |
| EP4689188A2 (en) | Active surveillance and risk stratification for prostate cancer | |
| US20160304961A1 (en) | Method for predicting the response to chemotherapy treatment in patients suffering from colorectal cancer | |
| WO2010076887A1 (en) | Predictive biomarkers useful for cancer therapy mediated by a wee1 inhibitor | |
| HK1138891A (en) | Molecular signature of liver tumor grade and use to evaluate prognosis and therapeutic regimen | |
| HK1238306A1 (en) | Method and systems for lung cancer diagnosis |
Legal Events
| Date | Code | Title | Description |
|---|---|---|---|
| PUAI | Public reference made under article 153(3) epc to a published international application that has entered the european phase |
Free format text: ORIGINAL CODE: 0009012 |
|
| AK | Designated contracting states |
Kind code of ref document: A1 Designated state(s): AT BE BG CH CY CZ DE DK EE ES FI FR GB GR HR HU IE IS IT LI LT LU LV MC MT NL NO PL PT RO SE SI SK TR |
|
| AX | Request for extension of the european patent |
Extension state: AL BA MK RS |
|
| 17P | Request for examination filed |
Effective date: 20100526 |
|
| 17Q | First examination report despatched |
Effective date: 20100622 |
|
| REG | Reference to a national code |
Ref country code: HK Ref legal event code: DE Ref document number: 1138891 Country of ref document: HK |
|
| AKX | Designation fees paid |
Designated state(s): AT BE BG CH CY CZ DE DK EE ES FI FR GB GR HR HU IE IS IT LI LT LU LV MC MT NL NO PL PT RO SE SI SK TR |
|
| STAA | Information on the status of an ep patent application or granted ep patent |
Free format text: STATUS: THE APPLICATION IS DEEMED TO BE WITHDRAWN |
|
| 18D | Application deemed to be withdrawn |
Effective date: 20110111 |
|
| REG | Reference to a national code |
Ref country code: HK Ref legal event code: WD Ref document number: 1138891 Country of ref document: HK |