EP2133808A1 - Model system for diagnosing lipid metabolism - Google Patents
Model system for diagnosing lipid metabolism Download PDFInfo
- Publication number
- EP2133808A1 EP2133808A1 EP08157988A EP08157988A EP2133808A1 EP 2133808 A1 EP2133808 A1 EP 2133808A1 EP 08157988 A EP08157988 A EP 08157988A EP 08157988 A EP08157988 A EP 08157988A EP 2133808 A1 EP2133808 A1 EP 2133808A1
- Authority
- EP
- European Patent Office
- Prior art keywords
- liver
- apoe
- lipolysis
- size
- particle
- Prior art date
- Legal status (The legal status is an assumption and is not a legal conclusion. Google has not performed a legal analysis and makes no representation as to the accuracy of the status listed.)
- Withdrawn
Links
- 230000037356 lipid metabolism Effects 0.000 title description 2
- 239000002245 particle Substances 0.000 claims abstract description 151
- 102000004895 Lipoproteins Human genes 0.000 claims abstract description 99
- 108090001030 Lipoproteins Proteins 0.000 claims abstract description 99
- 230000004130 lipolysis Effects 0.000 claims abstract description 93
- 239000008280 blood Substances 0.000 claims abstract description 56
- 210000004369 blood Anatomy 0.000 claims abstract description 55
- 230000009103 reabsorption Effects 0.000 claims abstract description 42
- 238000004519 manufacturing process Methods 0.000 claims abstract description 30
- UFTFJSFQGQCHQW-UHFFFAOYSA-N triformin Chemical compound O=COCC(OC=O)COC=O UFTFJSFQGQCHQW-UHFFFAOYSA-N 0.000 claims abstract description 17
- 239000000203 mixture Substances 0.000 claims abstract description 15
- 238000004458 analytical method Methods 0.000 claims abstract description 13
- 238000012360 testing method Methods 0.000 claims abstract description 9
- 230000035479 physiological effects, processes and functions Effects 0.000 claims abstract description 6
- 230000035790 physiological processes and functions Effects 0.000 claims abstract description 5
- 210000004185 liver Anatomy 0.000 claims description 94
- 101150037123 APOE gene Proteins 0.000 claims description 77
- 101100216294 Danio rerio apoeb gene Proteins 0.000 claims description 77
- 101150102415 Apob gene Proteins 0.000 claims description 41
- 238000000034 method Methods 0.000 claims description 41
- HVYWMOMLDIMFJA-DPAQBDIFSA-N cholesterol Chemical compound C1C=C2C[C@@H](O)CC[C@]2(C)[C@@H]2[C@@H]1[C@@H]1CC[C@H]([C@H](C)CCCC(C)C)[C@@]1(C)CC2 HVYWMOMLDIMFJA-DPAQBDIFSA-N 0.000 claims description 33
- 230000008569 process Effects 0.000 claims description 26
- 230000001404 mediated effect Effects 0.000 claims description 20
- 102000019267 Hepatic lipases Human genes 0.000 claims description 16
- 108050006747 Hepatic lipases Proteins 0.000 claims description 16
- 235000012000 cholesterol Nutrition 0.000 claims description 16
- 230000004941 influx Effects 0.000 claims description 16
- 208000037265 diseases, disorders, signs and symptoms Diseases 0.000 claims description 15
- 108010013563 Lipoprotein Lipase Proteins 0.000 claims description 14
- 102000043296 Lipoprotein lipases Human genes 0.000 claims description 14
- 201000010099 disease Diseases 0.000 claims description 13
- 230000000694 effects Effects 0.000 claims description 8
- 208000035150 Hypercholesterolemia Diseases 0.000 claims description 6
- 235000019626 lipase activity Nutrition 0.000 claims description 6
- 150000001840 cholesterol esters Chemical class 0.000 claims description 5
- 230000002440 hepatic effect Effects 0.000 claims description 5
- 208000006575 hypertriglyceridemia Diseases 0.000 claims description 5
- 102000054765 polymorphisms of proteins Human genes 0.000 claims description 5
- 238000002560 therapeutic procedure Methods 0.000 claims description 5
- 108010074051 C-Reactive Protein Proteins 0.000 claims description 4
- 102100032752 C-reactive protein Human genes 0.000 claims description 4
- 239000000126 substance Substances 0.000 claims description 4
- 108010076365 Adiponectin Proteins 0.000 claims description 3
- 102000011690 Adiponectin Human genes 0.000 claims description 3
- 208000031226 Hyperlipidaemia Diseases 0.000 claims description 3
- 206010022489 Insulin Resistance Diseases 0.000 claims description 3
- SQVRNKJHWKZAKO-UHFFFAOYSA-N beta-N-Acetyl-D-neuraminic acid Natural products CC(=O)NC1C(O)CC(O)(C(O)=O)OC1C(O)C(O)CO SQVRNKJHWKZAKO-UHFFFAOYSA-N 0.000 claims description 3
- 210000000601 blood cell Anatomy 0.000 claims description 3
- 238000011161 development Methods 0.000 claims description 3
- 230000014509 gene expression Effects 0.000 claims description 3
- 208000020346 hyperlipoproteinemia Diseases 0.000 claims description 3
- 239000002773 nucleotide Substances 0.000 claims description 3
- 150000003904 phospholipids Chemical class 0.000 claims description 3
- SQVRNKJHWKZAKO-OQPLDHBCSA-N sialic acid Chemical compound CC(=O)N[C@@H]1[C@@H](O)C[C@@](O)(C(O)=O)OC1[C@H](O)[C@H](O)CO SQVRNKJHWKZAKO-OQPLDHBCSA-N 0.000 claims description 3
- 206010020961 Hypocholesterolaemia Diseases 0.000 claims description 2
- 208000017170 Lipid metabolism disease Diseases 0.000 claims description 2
- 125000003729 nucleotide group Chemical group 0.000 claims description 2
- 230000001225 therapeutic effect Effects 0.000 claims description 2
- 108010007622 LDL Lipoproteins Proteins 0.000 description 54
- 102000007330 LDL Lipoproteins Human genes 0.000 description 54
- 108010062497 VLDL Lipoproteins Proteins 0.000 description 47
- 150000002632 lipids Chemical class 0.000 description 31
- 230000006870 function Effects 0.000 description 29
- 230000004907 flux Effects 0.000 description 19
- 102000018616 Apolipoproteins B Human genes 0.000 description 13
- 108010027006 Apolipoproteins B Proteins 0.000 description 13
- 102000008055 Heparan Sulfate Proteoglycans Human genes 0.000 description 7
- 108090000054 Syndecan-2 Proteins 0.000 description 7
- 238000005259 measurement Methods 0.000 description 6
- 238000012313 Kruskal-Wallis test Methods 0.000 description 5
- 150000003626 triacylglycerols Chemical class 0.000 description 5
- 230000008859 change Effects 0.000 description 4
- 230000001419 dependent effect Effects 0.000 description 4
- 238000003745 diagnosis Methods 0.000 description 4
- 102000006991 Apolipoprotein B-100 Human genes 0.000 description 3
- 108010008150 Apolipoprotein B-100 Proteins 0.000 description 3
- 102000007592 Apolipoproteins Human genes 0.000 description 3
- 108010071619 Apolipoproteins Proteins 0.000 description 3
- 208000024172 Cardiovascular disease Diseases 0.000 description 3
- 108010001831 LDL receptors Proteins 0.000 description 3
- 102100024640 Low-density lipoprotein receptor Human genes 0.000 description 3
- 239000000470 constituent Substances 0.000 description 3
- 230000001186 cumulative effect Effects 0.000 description 3
- 230000007547 defect Effects 0.000 description 3
- 238000012546 transfer Methods 0.000 description 3
- 201000001320 Atherosclerosis Diseases 0.000 description 2
- 102000004190 Enzymes Human genes 0.000 description 2
- 108090000790 Enzymes Proteins 0.000 description 2
- 238000008214 LDL Cholesterol Methods 0.000 description 2
- 238000005481 NMR spectroscopy Methods 0.000 description 2
- 238000013459 approach Methods 0.000 description 2
- 230000031018 biological processes and functions Effects 0.000 description 2
- 230000003247 decreasing effect Effects 0.000 description 2
- 238000013401 experimental design Methods 0.000 description 2
- 238000002474 experimental method Methods 0.000 description 2
- 230000002068 genetic effect Effects 0.000 description 2
- 238000004128 high performance liquid chromatography Methods 0.000 description 2
- 238000012821 model calculation Methods 0.000 description 2
- 230000009467 reduction Effects 0.000 description 2
- YPMOAQISONSSNL-UHFFFAOYSA-N 8-hydroxyoctyl 2-methylprop-2-enoate Chemical compound CC(=C)C(=O)OCCCCCCCCO YPMOAQISONSSNL-UHFFFAOYSA-N 0.000 description 1
- 102000005666 Apolipoprotein A-I Human genes 0.000 description 1
- 108010059886 Apolipoprotein A-I Proteins 0.000 description 1
- 102000011936 Apolipoprotein A-V Human genes 0.000 description 1
- 108010061118 Apolipoprotein A-V Proteins 0.000 description 1
- 101710095342 Apolipoprotein B Proteins 0.000 description 1
- 102100040202 Apolipoprotein B-100 Human genes 0.000 description 1
- 102000013918 Apolipoproteins E Human genes 0.000 description 1
- 108010025628 Apolipoproteins E Proteins 0.000 description 1
- HTTJABKRGRZYRN-UHFFFAOYSA-N Heparin Chemical compound OC1C(NC(=O)C)C(O)OC(COS(O)(=O)=O)C1OC1C(OS(O)(=O)=O)C(O)C(OC2C(C(OS(O)(=O)=O)C(OC3C(C(O)C(O)C(O3)C(O)=O)OS(O)(=O)=O)C(CO)O2)NS(O)(=O)=O)C(C(O)=O)O1 HTTJABKRGRZYRN-UHFFFAOYSA-N 0.000 description 1
- 206010020772 Hypertension Diseases 0.000 description 1
- 108010028554 LDL Cholesterol Proteins 0.000 description 1
- 208000001145 Metabolic Syndrome Diseases 0.000 description 1
- 102000016611 Proteoglycans Human genes 0.000 description 1
- 108010067787 Proteoglycans Proteins 0.000 description 1
- 108091005487 SCARB1 Proteins 0.000 description 1
- 102100037118 Scavenger receptor class B member 1 Human genes 0.000 description 1
- 208000006011 Stroke Diseases 0.000 description 1
- QAOWNCQODCNURD-UHFFFAOYSA-L Sulfate Chemical compound [O-]S([O-])(=O)=O QAOWNCQODCNURD-UHFFFAOYSA-L 0.000 description 1
- 201000000690 abdominal obesity-metabolic syndrome Diseases 0.000 description 1
- 230000001594 aberrant effect Effects 0.000 description 1
- 230000000923 atherogenic effect Effects 0.000 description 1
- 230000033228 biological regulation Effects 0.000 description 1
- 230000007211 cardiovascular event Effects 0.000 description 1
- 230000015556 catabolic process Effects 0.000 description 1
- 210000004027 cell Anatomy 0.000 description 1
- 150000001841 cholesterols Chemical class 0.000 description 1
- 208000037998 chronic venous disease Diseases 0.000 description 1
- 238000004590 computer program Methods 0.000 description 1
- 238000012937 correction Methods 0.000 description 1
- 206010012601 diabetes mellitus Diseases 0.000 description 1
- 230000002222 downregulating effect Effects 0.000 description 1
- 230000007717 exclusion Effects 0.000 description 1
- 210000003918 fraction a Anatomy 0.000 description 1
- 229960002897 heparin Drugs 0.000 description 1
- 229920000669 heparin Polymers 0.000 description 1
- 238000000126 in silico method Methods 0.000 description 1
- 238000010348 incorporation Methods 0.000 description 1
- 238000011835 investigation Methods 0.000 description 1
- 238000001948 isotopic labelling Methods 0.000 description 1
- 230000008604 lipoprotein metabolism Effects 0.000 description 1
- 238000013507 mapping Methods 0.000 description 1
- 238000013178 mathematical model Methods 0.000 description 1
- 230000004060 metabolic process Effects 0.000 description 1
- MYWUZJCMWCOHBA-VIFPVBQESA-N methamphetamine Chemical compound CN[C@@H](C)CC1=CC=CC=C1 MYWUZJCMWCOHBA-VIFPVBQESA-N 0.000 description 1
- 238000001543 one-way ANOVA Methods 0.000 description 1
- 230000001575 pathological effect Effects 0.000 description 1
- 238000013404 process transfer Methods 0.000 description 1
- 238000012545 processing Methods 0.000 description 1
- 230000002285 radioactive effect Effects 0.000 description 1
- 238000012502 risk assessment Methods 0.000 description 1
- 238000000926 separation method Methods 0.000 description 1
- 238000004088 simulation Methods 0.000 description 1
- 239000007787 solid Substances 0.000 description 1
- 238000001228 spectrum Methods 0.000 description 1
- 239000012798 spherical particle Substances 0.000 description 1
- 229910021653 sulphate ion Inorganic materials 0.000 description 1
- 230000007306 turnover Effects 0.000 description 1
Images




Classifications
-
- G—PHYSICS
- G01—MEASURING; TESTING
- G01N—INVESTIGATING OR ANALYSING MATERIALS BY DETERMINING THEIR CHEMICAL OR PHYSICAL PROPERTIES
- G01N33/00—Investigating or analysing materials by specific methods not covered by groups G01N1/00 - G01N31/00
- G01N33/48—Biological material, e.g. blood, urine; Haemocytometers
- G01N33/50—Chemical analysis of biological material, e.g. blood, urine; Testing involving biospecific ligand binding methods; Immunological testing
- G01N33/92—Chemical analysis of biological material, e.g. blood, urine; Testing involving biospecific ligand binding methods; Immunological testing involving lipids, e.g. cholesterol, lipoproteins, or their receptors
-
- G—PHYSICS
- G16—INFORMATION AND COMMUNICATION TECHNOLOGY [ICT] SPECIALLY ADAPTED FOR SPECIFIC APPLICATION FIELDS
- G16H—HEALTHCARE INFORMATICS, i.e. INFORMATION AND COMMUNICATION TECHNOLOGY [ICT] SPECIALLY ADAPTED FOR THE HANDLING OR PROCESSING OF MEDICAL OR HEALTHCARE DATA
- G16H50/00—ICT specially adapted for medical diagnosis, medical simulation or medical data mining; ICT specially adapted for detecting, monitoring or modelling epidemics or pandemics
- G16H50/50—ICT specially adapted for medical diagnosis, medical simulation or medical data mining; ICT specially adapted for detecting, monitoring or modelling epidemics or pandemics for simulation or modelling of medical disorders
-
- G—PHYSICS
- G16—INFORMATION AND COMMUNICATION TECHNOLOGY [ICT] SPECIALLY ADAPTED FOR SPECIFIC APPLICATION FIELDS
- G16Z—INFORMATION AND COMMUNICATION TECHNOLOGY [ICT] SPECIALLY ADAPTED FOR SPECIFIC APPLICATION FIELDS, NOT OTHERWISE PROVIDED FOR
- G16Z99/00—Subject matter not provided for in other main groups of this subclass
-
- Y—GENERAL TAGGING OF NEW TECHNOLOGICAL DEVELOPMENTS; GENERAL TAGGING OF CROSS-SECTIONAL TECHNOLOGIES SPANNING OVER SEVERAL SECTIONS OF THE IPC; TECHNICAL SUBJECTS COVERED BY FORMER USPC CROSS-REFERENCE ART COLLECTIONS [XRACs] AND DIGESTS
- Y10—TECHNICAL SUBJECTS COVERED BY FORMER USPC
- Y10T—TECHNICAL SUBJECTS COVERED BY FORMER US CLASSIFICATION
- Y10T436/00—Chemistry: analytical and immunological testing
- Y10T436/14—Heterocyclic carbon compound [i.e., O, S, N, Se, Te, as only ring hetero atom]
- Y10T436/142222—Hetero-O [e.g., ascorbic acid, etc.]
- Y10T436/143333—Saccharide [e.g., DNA, etc.]
Definitions
- the mean of the VLDL 2 fraction was derived from the TG to ApoB ratio of the production in these classes presented by Adiels et al. (2005, J. Lipid Res. 46:58-67 ).
- the mean of the VLDL 1 fraction was fitted as a model parameter. Since for IDL and LDL no data were available, the class middle was taken as distribution mean. The standard deviation of the curves was taken as half the distance from the distribution mean to the nearest class border. For the VLDL 1 class this rule applied to the expectation and the square root of the variance of the lognormal production distribution, as specified in the Examples. A correction was applied to ensure all produced particles in each class actually fell inside the specified class.
- liver HSPG's Liver - lipolysis and uptake In the liver the particle first needs to be attached to liver HSPG's. This process is primarily mediated by apoE, so that the attachment does not work for LDL particles without apoE. These LDL particles only contain apoB, which can attach to the LDL receptor and lead to the reabsorption of small particles. Larger particles can either be lipolysed or be reabsorbed.
- the lipolysis in the liver is primarily mediated by hepatic lipase (HL), an enzyme which functions primarily on smaller apoB and apoE-containing lipoproteins such as IDL, and to a lesser extent on VLDL 2 ( Demant, T. et al. 1988, J. Lipid Res. 29:1603-1611 ).
- HL hepatic lipase
- the model's potential for modeling biological polymorphisms was investigated. Two defects were simulated. The first is a polymorphism in the ApoB-related reabsorption which leads to hypercholesterolemia, the second a defect in LpL lipolysis, which leads to hypertriglyceridemia. Data from Patient "19" in Packard et al (2000, J. Lipid Res. 41:305-318 ) was chosen for the in-silico experiment. This patient is in the 'B' category, with low LDL peak size, and higher CVD risk. The profile of the patient was compared with the same profile firstly if the ApoB-related reabsorption activity was halved, corresponding to an LDL-receptor polymorphism.
Landscapes
- Health & Medical Sciences (AREA)
- Engineering & Computer Science (AREA)
- Life Sciences & Earth Sciences (AREA)
- Biomedical Technology (AREA)
- Molecular Biology (AREA)
- Public Health (AREA)
- Hematology (AREA)
- Medical Informatics (AREA)
- Chemical & Material Sciences (AREA)
- General Health & Medical Sciences (AREA)
- Urology & Nephrology (AREA)
- Pathology (AREA)
- Immunology (AREA)
- Databases & Information Systems (AREA)
- Primary Health Care (AREA)
- Biotechnology (AREA)
- Cell Biology (AREA)
- Endocrinology (AREA)
- Biophysics (AREA)
- Microbiology (AREA)
- Data Mining & Analysis (AREA)
- Epidemiology (AREA)
- Food Science & Technology (AREA)
- Medicinal Chemistry (AREA)
- Physics & Mathematics (AREA)
- Analytical Chemistry (AREA)
- Biochemistry (AREA)
- General Physics & Mathematics (AREA)
- Investigating Or Analysing Biological Materials (AREA)
Abstract
The invention relates to a population model for the analysis of blood lipoprotein physiology in a test subject comprising:
a. a submodel for the production of blood lipoproteins;
b. a submodel for the lipolysis of blood lipoproteins;
c. a submodel for the reabsorption of blood lipoproteins; and
d. a submodel relating blood lipoprotein particle size to biochemical composition, more specifically triglyceride content,
thereby providing an analysis of the physiological processes underlying a steady state particle population distribution. Each submodel is given as function, using the size of the lipoprotein particle as the independent variable
a. a submodel for the production of blood lipoproteins;
b. a submodel for the lipolysis of blood lipoproteins;
c. a submodel for the reabsorption of blood lipoproteins; and
d. a submodel relating blood lipoprotein particle size to biochemical composition, more specifically triglyceride content,
thereby providing an analysis of the physiological processes underlying a steady state particle population distribution. Each submodel is given as function, using the size of the lipoprotein particle as the independent variable
Description
- The invention relates to the field of mathematical models for lipid metabolism and use of these models in diagnosis of lipid related disease.
- The importance of accurately measuring lipid levels in blood is well known. High levels of cholesterol in blood are known to increase the risk of a variety of diseases, such as atherosclerosis and related disorders such as cardiovascular events like stroke and high blood pressure, and metabolic syndrome, comprising a multitude of phenomena, like diabetes. In recent years it has appeared that the constitution of the blood lipids plays an important role in the development of and/or risk of lipid-related disorders.
- Lipids are mainly present in the blood in the form of lipoproteins, which are spherical particles that transport cholesterol, triglycerides and other lipids in the bloodstream. Information on the sizes of the lipoprotein constituents is of major importance for a correct diagnosis of lipid-related diseases, but is normally not provided in traditional clinical diagnostics. Currently, several subclasses of lipoproteins are defined: VLDL (very low density lipoprotein) can be divided into 6 subclasses, LDL consists of 4 subclasses (including intermediate-density IDL) and HDL has been divided into 5 subclasses. It has appeared that pathological conditions or the risk theref relate to the amount and distribution of lipids over these subclasses. Based on these findings an 'atherogenic lipoprotein phenotype' has been defined, which takes into account a particle size profile within the LDL class (Austin, M.A. et al., 1990, Circulation 82:495-506). In addition to the cholesterol-based risk factors, apolipoprotein measurements such as the ApoB or the ApoB/ApoA-1 ratio have been found to indicate atherosclerosis risk (Alaupovic, P. 1996, Meth. Enzymol. 263:32-60; Walldius, G. et al., 2006, J. Intern. Med. 259:259-266).
- Further improvements in risk assessment can only result from a more detailed understanding of lipoprotein physiology. To increase quantitative insight various multi-compartmental models have been developed to analyze experiments with radioactive or stable isotope labelled lipoprotein constituents. The first models describe the fluxes of apolipoprotein B between lipoprotein fractions (Fisher, W.R. et al., 1980, J. Lipid Res. 21:760-774), with subsequent refinements allowing better data interpretation (Fisher, W.R. et al., 1991, J. Lipid Res. 32:1823-1836; Packard, C.J. et al., 1995, J. Lipid Res. 36:172-187; Maistrom, R. et al., 1997, Arterioscler. Thromb. Vasc. Biol. 17:1454-1464). Other models describe the fluxes of triglycerides through the lipoprotein fractions (Harris, W.S. et al., 1990, J. Lipid Res. 31:1549-1558; , Barrett, P.H. et al., 1991, J. Lipid Res. 32:743-762; Patterson, B.W. et al., 2002, J. Lipid Res. 43:223-233). Similar models describing other lipoprotein kinetics have also been developed (Campos, H. et al., 2001, J. Lipid Res. 42:1239-1249; Cohn, J.S. et al., 2004, J. Clin. Endocrinol. Metab. 89:3949-3955; Zheng, C. et al., J. Lipid Res. 48:1190-1203). These models were developed to deal with various density-based lipoprotein separation techniques. Now, new measuring techniques such as HPLC and NMR measurements (e.g.
US 5,343,389 ) provide more detailed size-concentration profiles of lipoproteins and their constituents. - The state-of-the art models that have been developed all are based on a so-called compartment model, or reactor model, which is a model in which compartments are defined with their own input and output. There is need for a model that more adequately describes and deals with the biological processes that form the basis of the lipoprotein metabolism.
- The inventors now have developed a system that is able to reproduce a detailed size-concentration profile of blood lipoproteins and also size classes that correspond to experimental measurements. Examples include the classical VLDL1, VLDL2, IDL and LDL density classes. The model output includes steady state particle concentrations, but can also be applied to analyse fluxes of production, lipolysis and reabsorption at each particle size. The model is calculated deterministically, and specifies how the rate of each of the mentioned fluxes depends on the size of the lipoprotein.
- More specifically, the system is presented as a population model for the analysis of blood lipoprotein physiology in a test subject comprising:
- a. a submodel for the production of blood lipoproteins;
- b. a submodel for the lipolysis of blood lipoproteins;
- c. a submodel for the reabsorption of blood lipoproteins; and
- d. a submodel relating blood lipoprotein particle size to biochemical composition, more specifically triglyceride content,
- e. a submodel relating blood lipoprotein particle size to total cholesterol content;
- f. a submodel relating blood lipoprotein particle size to free cholesterol content;
- g. a submodel relating blood lipoprotein particle size to cholesterol ester content;
- h. a submodel relating blood lipoprotein particle size to phospholipid content;
- i. a submodel relating blood lipoprotein particle size to total protein content.
- In more detail, the population model for the presence of blood lipoproteins in a test subject is a model wherein the total steady-state pool of lipoproteins Qss in a diameter range [da db ] is given by:

wherein


wherein d is the particle diameter, τ signifies the residence time of a particle within a size class and
Preferably in said model, the influx into the previous cascade step at particle diameter di-1 is defined as:
Where ku,liver is the particle reabsorption rate, kl is the extrahepatic lipolysis attachment rate, kl,liver is the hepatic lipolysis attachment rate and di-1 indicates the particle radius before the lipolysis step.
Also preferably, the residence time of a particle within a size class is given by
where ka,liver is the rate at which particles are attached to the liver to either be taken up or lipolysed there, kl is the lipolysis attachment rate for extrahepatic lipolysis. - Preferably, in the model of the invention the production of blood lipoproteins is given by the equation

wherein do stands for the particle diameter at production,d stands for the average diameter in a given class, σ is the standard deviation of the distribution curve. Subscripts indicate the class to which the diameter refers, and whether it is a minimum or maximum value for that class. fnor is the corrected normal probability density function, and flognor is the corrected lognormal probability density function as follows:

wherein normpdf (d,d, σ) stands for a normal probability density function with parametersd and σ evaluated at d, while log normpdf (d, u, σ ln) stands for a lognormal probability density function with parameters µ and σln, evaluated at d. - Also preferably, in the model of the invention the lipolysis attachment rate in extra-hepatic tissue is given by the formula

wherein d is the particle diameter, dlmin is the minimum size at which lipolysis occurs, klmax is the maximum lipolysis attachment rate and σl is a shape parameter. - In a similar way, the lipolysis rate in the liver kl,liver can be given by the formula

wherein the liver attachment rate ka,liver is given either by


- In another embodiment, the invention provides a method to determine individual parameters of each submodel using data obtained from a blood sample in a subject comprising:
- j. taking a blood sample from said subject;
- k. providing a data set from said sample comprising either the number of blood lipoprotein particles in a size class or the chemical composition of said particles, wherein at least 6 size classes are provided;
- l. feeding said data to a model according to the invention;
- m. finding parameters for the submodels defined in the model of the invention such that the resulting calculated total steady-state pool of lipoproteins Qss for every diameter d is in agreement with said dataset.
- Preferably in said method additionally from said sample or said subject one or more data are provided, including but not limited to data from the group consisting of the ApoC3 content, the ApoA5 content, insulin sensitivity indexes, the sialic acid content, the lipoprotein lipase activity, the hepatic lipase activity, the content of C-reactive protein, the content of adiponectin, gene expression data in blood cells, relevant single nucleotide polymorphisms and copy number variations.
- In a further embodiment the invention comprises a method to monitor the development of disease or the effect of a therapy in a patient by performing the method of the invention.
Preferably in the above methods said disease is selected from the group of lipid metabolism disorders, including but not limited to hyper-and hypocholesterolemia, hypertriglyceridemia and hyperlipoproteinemia types I, IIa, IIb, III, IV and V.
In a further embodiment, the invention comprises the use of the method according to the invention to choose a patient specific therapeutic intervention, directed at one or more processes that are described by one or more sub models relating to composition, production lipolysis and reabsorption of lipoproteins. -
-
Figure 1 : The model framework consists of three modules. In the Kernel module, a size-structured simulator is used to model the particle population and assess the steady-state model prediction. The first sub-model describes how lipoprotein affinity for the modelled physiological processes depends on particle size. The second sub-model describes how the lipoprotein's biochemical composition depends on particle size. Each module can be modified separately. -
Figure 2 : Representation of the empirical size-composition submodel, based on data from Tuzikov et al. (2002, Voprosy Meditsinskoj Khimii, 48:90-91). From these data the number of triglyceride (*) and cholesterol (·) molecules per lipoprotein particle was calculated. The triglyceride data was fitted with a sixth order polynomial, the cholesterol data with a third order polynomial. -
Figure 3 : How the rate of each process depends on particle size, based on the fitted parameters shown in Table 1. The patient number is indicated above each subfigure. The processes shown are extrahepatic (LpL-mediated) lipolysis (green), liver attachment (black), liver (HL-mediated) lipolysis (red) and liver uptake (blue). Clear differences between patients are observed. -
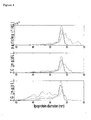
Figure 4 : Average particle, total cholesterol and triglyceride concentrations of model fits based on flux data of VLDL1, VLDL2, IDL and LDL only. The three lines represent averages of the subjects in the three phenotype groups as determined by Packard et al. (2000, J. Lipid Res. 41:305-318). The solid line indicates phenotype 'A' (LDL peak size > 26 nm), the dotted line phenotype 'I' (LDL peak size between 25 and 26 nm) and the striped line phenotype 'B' (LDL peak size< 25 nm). Although the data did not contain any particle size information further than the four mentioned classes, the model does reproduce the peak size shift in the LDL size range. -
Figure 5 : Total Cholesterol and Triglyceride concentration in model fit for patient 19 (white bars), a simulated lipolysis polymorphism reducing the lipolysis affinity (grey bars) and a simulated apoB-related reabsorption polymorphism, reducing the ApoB-related reabsorption affinity (black bar). The lipolysis polymorphism specifically increases VLDL1 triglycerides. The apoB-related reabsorption polymorphism increases LDL cholesterol. Both simulations are in accordance with observed phenotypes. -
Figure 6 : Rate parameter values of two patients estimated based on 6 subclasses derived from measurements by Liposearch. The patients clearly differ in their individual parameters. - The inventors now are proposing a population model for the distribution of blood lipoproteins in which biological processes like production of lipoproteins, reabsorption of lipoproteins and lipolysis influence the size-dependent distribution of lipoproteins. In this way the steady-state values of the lipoprotein content of a certain size class can be predicted. For this, the model consists of a kernel and submodels, shown schematically in
figure 1 . The kernel consists of a size-structured lipoprotein population model which calculates the steady-state lipoprotein levels at different particle sizes. The first submodel (in fact consisting of three submodels) specifies the particle's lifecycle processes of production, lipolysis and reabsorption in a particle-size dependent fashion. The second submodel specifies the relation between particle size and biochemical composition, which is estimated based on empirical data. - The kernel of the model framework, the size-structured lipoprotein population model, calculates the steady-state lipoprotein concentration along the size spectrum of ApoB-containing lipoproteins, which ranges from approximately 10 to 100 nm. The steady-state concentration is calculated using information on the production, lipolysis and reabsorption processes affecting single lipoprotein particles from the first submodel.
Model calculation proceeds as follows. The model uses the production into each class's small size interval as input and calculates the ensuing 'cascades' of lipolysis steps. These steps make the particles successively smaller until the minimum size at which lipolysis can occur is passed. The size of the cascade steps is determined by a model parameter specifying the triglyceride fraction a particle loses during lipolysis. The relation between triglyceride content and particle size is made by the second submodel, described below. During the lipolysis cascade, part of the lipoproteins is lost due to reabsorption processes. Once all the processes are specified, the resulting concentration at each cascade step is calculated and associated to the corresponding average particle size. The final particle concentration in the system is found by summing the concentrations of all the overlapping instances of different cascades that fall within a certain class's size region.
After a particle is produced at a given size, its subsequent sizes are determined by the size step due to lipolysis. Using the assumption that the fraction of triglycerides lost ftg is constant at each step, this is given by:
where ntg (di ) is the initial and ntg (d i+1) the final number of triglyceride molecules in a lipoprotein particle, as a function of particle diameter. The corresponding particle diameter is given by the second submodel below.
The equation for the total steady-state pool Qss in a given diameter range [da db ] is given by: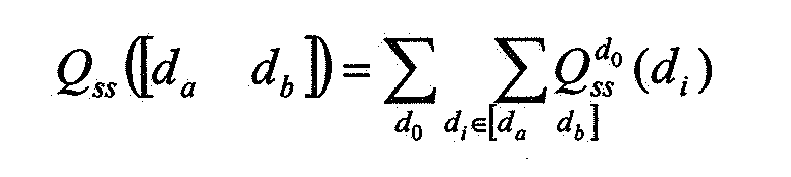
where (di ) at each size d resulting from the particle influx at d0 is given by:

where d is the particle diameter, τ signifies the residence time of a particle within a size class and

- Here ku,liver is the particle reabsorption rate, kl is the extrahepatic lipolysis attachment rate, kl,liver is the hepatic lipolysis attachment rate and d i-1 indicates the particle radius before the lipolysis step. The residence time of a particle within a size class is given by:

Here ka,liver is the rate at which particles are attached to the liver to either be taken up or lipolysed there, kl is the lipolysis attachment rate for extrahepatic lipolysis. The formulae for these diameter-dependent processes are specified by the first submodel, described below. - Model calculation proceeds using a discretisation of the size range into different classes. The mean size of the range of the class is used as a starting point for a cascade, and all subsequent cascade steps are added to the corresponding class. The number of classes can be chosen at will.
The model output can be given in various forms. The model can reproduce a detailed size - concentration profile, but also size classes that correspond to experimental measurements. Examples include the classical VLDL1, VLDL2, IDL and LDL density classes, and concentration - size profiles measured by HPLC or NMR (e.g.US 5,343,389 ). The model output includes steady state particle concentrations, as well as fluxes of production, lipolysis and reabsorption at each particle size. - The size-dependent models for production, reabsorption and lipolysis are based on biological hypotheses. The hypotheses were translated into mathematical equations. The current model can be can be considered a first functional approximation, to which further biological knowledge can be added in order to arrive at more detailed analysis of lipoprotein physiology.
- Production The speed of the production process in each class is based directly on the studied dataset. The size distribution within a size class is based on biological considerations. Production of ApoB-100 VLDL particles is thought to be a two-step process, in which first VLDL2 is produced intercellularly, which can subsequently be fused to a lipid droplet to form VLDL1. This idea was translated to the model by assuming a normal size distribution of secreted particles within the VLDL2, IDL and LDL ranges, since these are expected to vary around a given mean. For the VLDL1 range a lognormal size distribution was assumed, since the size of the fused lipid droplets can vary greatly. The mean of the
VLDL 2 fraction was derived from the TG to ApoB ratio of the production in these classes presented by Adiels et al. (2005, J. Lipid Res. 46:58-67). The mean of theVLDL 1 fraction was fitted as a model parameter. Since for IDL and LDL no data were available, the class middle was taken as distribution mean. The standard deviation of the curves was taken as half the distance from the distribution mean to the nearest class border. For theVLDL 1 class this rule applied to the expectation and the square root of the variance of the lognormal production distribution, as specified in the Examples. A correction was applied to ensure all produced particles in each class actually fell inside the specified class. - Mathematically this can be expressed as:

where d0 stands for the particle diameter at production,d stands for the average diameter in a given class, σ is the standard deviation of the distribution curve. Subscripts indicate the class to which the diameter refers, and whether it is a minimum or maximum value for that class. The different Jin 's are production rates in each class, which are estimated based on data (Packard et al. 2000, J. Lipid Res. 41:305-318). fnor is the corrected normal probability density function, and flognor is the corrected lognormal probability density function starting at d = dVLDL1min . These are cut off at the class borders, and corrected for the fraction falling outside, so that all production falls into the specified class. This was specified as follows for the corrected normal probability density function:

wherein normpdf(d,d ,σ) stands for a normal probability density function and normcdf(d,d ,σ) for a normal cumulative density function with parametersd and σ evaluated at d. While lognormpdf(d,µ,σln) stands for a lognormal probability density function and log normcdf(d, µ, σln) or a lognormal cumulative density function with parameters µ and σln, evaluated at d. - Possible values for
d and σ can be found in the following tableClass d (nm)σ(nm) LDL 

IDL 27.5 1.25 VLDL2 33.54 1.77 VLDL1 41.87 2.94 - The formula for translating the expectation
d VLDL1 and standard deviation σ for theVLDL 1 class particle diameter to the mean (µ) and standard deviation (σln) of a lognormal distribution is given by:

VLDL 1, whileVLDL 2 and IDL are lipolyzed to a subsequently lesser extent (Demant, T. et al., 1993, J. Lipid Res. 34:147-156). The particle binds to cell-surface heparin sulphate proteoglycans (HSPG's) mainly through LpL itself, while apoE modulates the binding affinity (de Beer, F. et al., 1999, Arterioscler. Thromb. Vasc. Biol. 19:633-637). Multiple LpL's which were already bound to the HSPG's can then be transferred to the lipoprotein, and mediate the lipolysis of the particle. What exactly determines the speed of this lipolysis is not known, although the available surface area, apolipoprotein C regulation and the biochemical composition of the particle are all hypothesized to influence the speed (Adiels, M, 2004, PhD thesis, Chalmers Univ. Technol., Göteborg, Sweden). In the model framework the lipolysis process is split into two steps: the first step decides whether a particle is bound to a HSPG for lipolysis, the second how many triglycerides it loses during lipolysis. The first step depends on the particle's attachment affinity to HSPG's, which in turn depends on its apolipoprotein composition. This means that the total affinity of the particle for HSPG increases with particle size, until a maximum is reached. Since the exact change in affinity with particle size is not known, this is approximated by a flexible one-parameter function with a shape similar to what would be expected. For this purpose a cumulative density function of the Rayleigh distribution was chosen. The formula for the lipolysis attachment rate in extrahepatic tissue kl,eht (d) then becomes,
where d is the particle diameter, dlmin is the minimum size at which lipolysis occurs, klmax is the maximum lipolysis attachment rate and σ l is a derived shape parameter. - Liver - lipolysis and uptake In the liver the particle first needs to be attached to liver HSPG's. This process is primarily mediated by apoE, so that the attachment does not work for LDL particles without apoE. These LDL particles only contain apoB, which can attach to the LDL receptor and lead to the reabsorption of small particles. Larger particles can either be lipolysed or be reabsorbed. The lipolysis in the liver is primarily mediated by hepatic lipase (HL), an enzyme which functions primarily on smaller apoB and apoE-containing lipoproteins such as IDL, and to a lesser extent on VLDL 2 (Demant, T. et al. 1988, J. Lipid Res. 29:1603-1611). Reabsorption of larger lipoproteins can take place via LRP. Roles for SRB1 and direct incorporation via HSPGs have also been suggested (Out, R. et al., 2004, J. Biol. Chem. 279:18401-18406; MacArthur, J. et al., 2007, J. Clin. Invest. 117:153-164).
- In the model liver attachment and further processing are again described as a two-step process. First attachment takes place, mainly mediated by apoE, but with a small contribution from apoB. Although small, this contribution is important especially in the LDL size range, where a small uptake affinity combined with large amounts of particles result in a considerable uptake flux. Since attachment increases and can subsequently decrease with particle size, a Rayleigh probability density function is used to describe this pattern. In order to have its maximum at one, it is scaled using the maximum of this same function, which lies at d = σ a,apoE . The liver attachment rate ka,liver can either be given by


- Subsequently, part of the attached lipoproteins are taken up. Since apoB attachment mainly occurs through the LDL receptor all apoB-mediated attachment results in uptake, the part attached through apoE can result in lipolysis. Since HL mainly lipolyses smaller particles the fraction of lipolyzed lipoproteins increases with decreasing particle size. The resulting liver uptake rate ku,liver then becomes.

- The lipolysis rate in the liver kl,liver is then given by:

- In these equations ka,apoEmax is the maximum liver uptake rate due to apoE-mediated reabsorption, ka,apoB is the liver uptake rate due to apoB-mediated reabsorption, d is the particle diameter, da,apoEmin is the minimum particle diameter at which liver lipolysis takes place and σa,apoE and σu,liver are shape parameters. Furthermore, fweibullpdf (d,A,B) is a weibull probability density function evaluated at d with shape parameters A and B, and fweibullpdfmax is the maximum function value attained by this weibull function on the lipoprotein size range. Note that in this case the probability functions are not used as such, but rather to indicate the shape of the rate distribution over lipoprotein particle sizes.
- The relation between particle diameter and both particle cholesterol and triglyceride content was based on a dataset presented by Tuzikov et al. (2002, Voprosy Meditsinskoj Khimii 48:90-91). The size - triglyceride relationship was fitted using a sixth degree polynomial, the size-cholesterol relationship by a third-degree polynomial, shown in
figure 2 . Although it is known that the mapping between particle size and biochemical composition is not always one-one, the current approach gives a solid first approximation which may still be improved in future versions of the model. A second option is to use the same model that Tuzikov et al. presented.
It is further envisaged, that similar submodels for the relation between particle size and total or free cholesterol content, for particle size and cholesterol ester content, for particle size and phospholipid content and for particle size and total protein content can be developed. - As is shown in the Examples the presently proposed model is capable of predicting the size distribution (population) of blood lipoproteins. The model can also analyse a measured size distribution, and derive parameters that indicate the status of the production, lipolysis and reabsorption processes. In practice the model can calculate this output with minimum input data, as compared to the state-of-the-art models.
Clinical data sets are obtained from a blood sample of an individual patient. Each data set should consist of, at least, a size distribution profile of ApoB containing lipoproteins in plasma where the distribution is separated in 6 or more classes and where the size range of each class can be expressed in nm. The distribution profile needs to provide information on either the number of lipoprotein particles per class or on the chemical composition of particles found within the class (such as triglyceride and cholesterol concentration in a class). Advantageously, additional clinical chemical data from the blood sample or from subfractions of the sample can be used to improve the diagnostic parameters of the model, such as the content of ApoC3 and Apo A5, the insulin sensitivity (e.g. HOMA index), the sialic acid content, lipoprotein lipase activity, hepatic lipase activity, C-reactive protein (CRP), adiponectin levels, gene expression data in blood cells and data on genetic background including relevant single-nucleotide polymorphisms (SNP's) and copy number variations. - The model is particularly useful to monitor progress of a disease or a therapy for a disease, where the disease is known to influence the blood lipoprotein distribution and/or content. Such diseases are for instance hypertriglyceridemia, hypercholesteremia and hyperlipoproteinemia types I, IIa, IIb, III, IV and V.
- The model is available in an executable computer program, which can be made functional on any personal computer. As such, a digital carrier with the program instructions forms part of the present invention. This digital carrier can be a diskette, a hard disk, a memory stick and the like.
The program needs as input clinical data form a blood sample of an individual patient, as had been specified above, essentially comprising a size distribution of ApoB containing lipoproteins where the distribution is separated in 6 or more classes. Optionally additional clinical data can be entered. Furthermore, of course, specifics about the sample itself and the patient from who it is derived are registered.
The output of the program is a graph representing the steady-state distribution of blood lipoproteins and optionally the output can comprise a description of any aberrant physical processes that underlie the resulting information, a proposal for a diagnosis and/or a therapy or a comparison on the severity or progress with any previously obtained results from the same patient. Thus, the model can be of great assistance for the clinician in diagnosis and therapy of patients having a disease relating to changes in the blood lipoprotein profile. - Further, the model can be of use in the study of diseases related to blood lipoproteins and factors affecting the metabolism of blood lipoproteins.
- In order to test the model's capability to reproduce measured lipoprotein flux data, the model was fitted to data from a stable isotope labeling study by Packard et al. (2000, J. Lipid Res. 41:305-318).
The individual patient's model outcomes of this study were used as input to the current model. Packard and coworkers divided their subjects into three groups based on the 'LDL peak size'. Phenotype 'A' had an LDL peak size greater than 26 nm, phenotype 'I' an LDL peak size between 25 and 26 nm and phenotype 'B' an LDL peak size smaller than 25 nm. - In Packard et al. (2000, J. Lipid Res. 41:305-3-18) the flux data are analyzed by a multi-compartment model to reveal the pool size of each lipoprotein density fraction, as well as the influx from the previous class into the reported class, here interpreted as the lipolysis flux, and the direct catabolism from the fraction, here presented as reabsorption. Also the direct production into each class is quantified. The dataset was considered to be in steady state when the total influx into each category given by production plus lipolysis influx equals the total efflux given by reabsorption plus lipolysis efflux. Datasets in which a large imbalance between total input and total output in one class were found were disregarded, leading to the exclusion of four patients. This selection is necessary because the current model assumes steady-state, which therefore needs to be present in the data. Since the original paper separated the VLDL1, VLDL2, IDL and LDL categories, the model was adapted to reproduce these size classes.
The deviation between the modelled and measured pool sizes is calculated as an average percent difference per datapoint. For the fluxes, this measure is not possible since the data contain several zero entries. Therefore an alternate measure was devised which sums the deviations of all modelled and measured data points, and divides them by the summed flux of the process, also giving a percentage score. Since the model parameters are most sensitive to an accurate pool size fit, the pool size fit was given double the importance of the average fluxes fit. In formula:
- Where D stands for deviation, n indicates the pool size, superscript d indicating the data and m the model fit. J stands for a flux, superscripts d and m as before, l indicates lipolysis, r indicates reabsorption. Subscript i indexes the different data points of each lipolysis size class.
- The dataset of Packard et al contains estimations for the apoB in lipoprotein pools of the various classes in mg, and turnover speeds in pools per day. These are converted to particle concentrations and particle fluxes respectively. This needs the assumption that only ApoB-100 is present on lipoprotein particles in the fasted state.

- Where n is the number of lipoproteins, MApoB-100 the molar mass of ApoB-100 and Vblood the blood volume of a person (taken to be 5 L).
- The resulting fitted profile can be viewed in as much detail as is required. This allows the comparison of the modelled 'LDL peak size' with the patient's LDL peak size class based on measurements.
- The data from the study by Packard et al. (2000, J. Lipid Res. 41:305-318) were fitted using the Nelder-Mead Simplex Method (implemented in Matlab as the function fminsearch) for optimizing the parameters of the model. The deviation score used is given above. The Simplex was run from sixty-four starting points which were specified by taking two extreme values for each parameter and using a full 'experimental design'. Subsequently the three best fitting parameter sets were selected and the Simplex was applied iteratively to them, until the parameter set did not change. These three final parameter sets were then compared. If the final parameters were found to differ, the whole procedure was repeated using the minima and maxima of each parameter in the set of final parameters as starting points for a new experimental design.
- It is also possible to inspect the differences in fitted parameters between the groups defined by Packard et al. using the nonparametric Kruskal-Wallis test. This test is suitable for small datasets and does not need the normality assumption a one-way Anova would require. It compares the medians of the parameters describing the three groups of patients.
- The fitted model parameters give some information about the processes making up the final lipoprotein profile. To aid interpretation, various process-indicating parameters can be derived from the fitted model parameters. These can either be process indicators, such as the maximum HL activity, the particle size at which it HL affinity is at a maximum and the average apoE-related uptake affinity over the VLDL1 range. They can also be size-class specific indicator parameters of process, age or size averages per particle in that class. For example, the average lipolysis attachment rate per particle in the VLDL1 size class may be calculated. This differs from the 'transfer from VLDL1 to VLDL2' variable presented by Packard and coworkers, since it takes into account all lipolysis steps of VLDL1 particles, also those that do not cause the particle to change class.
- The model's potential for modeling biological polymorphisms was investigated. Two defects were simulated. The first is a polymorphism in the ApoB-related reabsorption which leads to hypercholesterolemia, the second a defect in LpL lipolysis, which leads to hypertriglyceridemia. Data from Patient "19" in Packard et al (2000, J. Lipid Res. 41:305-318) was chosen for the in-silico experiment. This patient is in the 'B' category, with low LDL peak size, and higher CVD risk. The profile of the patient was compared with the same profile firstly if the ApoB-related reabsorption activity was halved, corresponding to an LDL-receptor polymorphism. This was simulated by setting the ka,apoB parameter to half its original value. Secondly the LpL-mediated lipolysis activity was reduced, corresponding to an LpL defect. This was simulated by setting the klmax value to 25% of its original value. The output of the model is reproduced for the LDL, IDL, VLDL1 and VLDL2 size classes.
- Finally, the model was applied to lipoprotein subclass data from a single blood sample. The data were measured by the company Liposearch. The reported cholesterol and triglyceride data at various particle sizes were converted to particle concentrations as follows.


wherein Vcore is the core volume of the lipoprotein particle at average particle size in a class d. Mtg,core is the triglyceride content of the core in a given class, Ctg is the measured triglyceride concentration, ρ tg is the triglyceride density taken to be 0.92 g / cm3, ρ ce is the cholesterol ester density taken to be 0.95 g /cm3 and fce is the fraction of cholesterol ester versus free cholesterol, based on the biochemical submodel presented above. Finally npart is the number of particles in a specified class. - The dimensionality of the data was reduced to six datapoints, by taking together the large VLDL subfractions, the medium and small VLDL subfractions and the very small LDL subfractions and leaving the large medium and small LDL subfractions as reported. The model, using the second option for the liver attachment function, was fitted to this data.
- The pool and flux data were well fitted with the model. In eleven patients the model fit converged to a difference of less then 1% between parameters in the three best fit parameter sets. A difference of less then 10% was found in all but one patient. Only
patient 17 clearly converged to two local minima, which differed only slightly in the deviation score. The minimum with the smallest deviation score was chosen. Table 1 shows the parameters that have been estimated for all subjects from the study by Packard et al. and the corresponding deviations, the definition of which can be found in above.Figure 3 shows how the processes vary with particle size, given these parameters. The deviation ranged from 1.5% to 19.4% with an average of 7%.Patients Subj. Percentage deviation Liver attach-ment min size (nm) d a,apoE min Liver attach-ment shape (nm) σ a,apoE ApoE uptake shape (nm) σ u,apoE apoB reabsorption affinity (particles / fl*day) ku,apoB Liver attachment max rate (particles / fl*day) k a,apoE max LpL attachment max rate (particles / fl*day) k lmax 1 5,5 22,6 198,8 33,1 0,94 149,1 378,8 2 1,5 24,2 34,1 866,5 0,74 27,1 101,6 3 4,1 25,1 37,9 443,4 0,45 14,6 98,8 4 12,9 24,7 30,3 166,7 0,56 3,6 167,8 5 3,1 23,5 58,5 37,8 0,37 26,6 17,2 6 1,7 24,9 33,0 92,8 0,48 9,9 67,5 7 8,9 24,6 148,0 1278,7 0,49 107,5 22,6 8 19,4 25,4 198,4 37,1 0,35 179,5 31,6 9 3,9 24,7 199,2 42,7 0,28 132,4 15,4 11 8,8 24,0 198,8 34,6 0,30 92,0 83,3 12 5,7 24,4 198,0 37,4 0,39 107,9 22,5 14 2,7 24,3 41,8 52,1 0,24 7,0 0,0 17 6,8 21,7 31,6 15083,8 0,38 3,5 55,4 18 16,7 13,3 36,6 48,7 0,36 3,9 61,7 19 5,4 23,4 32,7 37,9 0,33 5,4 48,1 20 5,4 19,4 199,4 38,9 0,27 32,9 16,0 Averages A 24,4 104,2 333,2 0,52 72,2 100,1 I 24,3 146,2 41,4 0,31 69,0 35,3 B 19,4 75,1 3802,3 0,34 11,4 45,3 Significance inter-group difference p 0,016 0,504 0,438 0,073 0,152 0,438 - Table 1: The fitted model parameter values for 16 subjects from Packard et al. (2000, J. Lipid Res. 41:305-318) Only subjects with a data set corresponding to steady-state were selected. The patients were grouped by Packard et al. into three phenotype classes, according to their 'LDL peak size'. Class A had a peak size > 26 nm, class I between 25 and 26 nm and class B < 25 nm. Lower LDL peak size is thought to correspond to a higher risk for cardiovascular disease. The fitted model parameter average for each of these classes is given, and the significance of inter-group difference according to the nonparametric Kruskal-Wallis test.
- The model could simulate detailed particle size profiles, although it is fitted to pools and fluxes of only four density categories (
VLDL 1,VLDL 2, IDL and LDL). These detailed profiles were averaged for all patients in each phenotype class defined by Packard et al. Infigure 4 these averaged profiles are shown. Although the A and I category profiles overlap, a shift towards lower LDL peak sizes was observed as the phenotype changes from A and I to B, corresponding to the peak size shift measured by Packard. This result points to the physiological realism of the model, since with no size data other than an estimation of the particle size ranges of each density category, the model still reproduced a LDL particle size shift.
The peak size shift was also visible in the model parameters. The Kruskal-Wallis test showed that the median of the lipolysis minimum size significantly decreased from group A and I to group B, with p =0,016. This shows that both the modeled size-concentration profiles and the model parameters qualitatively reproduced the LDL peak size shift between the groups. - Table 2 shows the derived parameters that indicate the status of the various physiological processes. Next to the lipolysis minimum size, also the HL peak attachment rate has significantly different medians between the groups.
- Table 3 shows the size-class specific indicator parameters with a significantly changed median between the groups. These include the VLDL1, VLDL2 and LDL average particle age, the IDL and LDL average particle size, the VLDL1 and VLDL2 average lipolysis attachment rate in general and specifically for HL, and the VLDL2 liver attachment rate.
A similar group-comparison analysis was done based on the flux parameters Packard reports in his paper (2000, J. Lipid Res. 41:305-318), and using the same patients as we did. In that case next to the pool sizes, only the transfer rate of VLDL1 to VLDL2 differs significantly between the groups. The model therefore seems to be able to indicate relevant differences in physiology between groups with a differing LDL peak size.Subj. Liver Attachment min size (nm) apoB reabsorption affinity (particles / fl*day) HL peak attachment rate (part/fL*day) HL attachment peak size (nm) average apoE-mediated uptake attachment VLDL1 (part/fL*day) 1 22,6 0,94 8,8 33,1 23,8 2 24,2 0,74 27,1 34,1 0,0 3 25,1 0,45 14,6 37,9 0,0 4 24,7 0,56 3,6 30,3 0,0 5 23,5 0,37 10,1 36,7 12,6 6 24,9 0,48 9,8 33,0 0,1 7 24,6 0,49 89,7 100,0 0,0 8 25,4 0,35 12,1 37,1 20,8 9 24,7 0,28 13,6 42,6 9,9 11 24,0 0,30 5,6 34,6 13,1 12 24,4 0,39 8,0 37,3 12,5 14 24,3 0,24 5,9 39,1 1,4 17 21,7 0,38 3,5 31,6 0,0 18 13,3 0,36 3,2 32,8 1,0 19 23,4 0,33 4,5 31,2 1,1 20 19,4 0,27 3,5 38,8 3,8 Averages A 24,4 0,52 21,0 42,7 7,5 I 24,3 0,31 6,5 37,0 9,0 B 19,4 0,34 3,7 33,6 1,5 Significance inter-group difference p 0,016 0,073 0,007 0,284 0,360 Group means Significance inter-group difference A I B p-value LDL average particle age (days) 1,5 2,4 2,6 0,014 VLDL2 average particle age (days) 0,11 0,19 0,22 0,011 VLDL1 average particle age (days) 0,03 0,06 0,07 0,018 LDL average particle size (nm) 23,2 23,2 20,2 0,024 IDL average particle size (nm) 26,7 26,8 27,2 0,018 Size-specific process indicator parameters VLDL2 average lipolysis attachment rate (part/fL*day) 12,7 6,2 4,4 0,005 VLDL1 average lipolysis attachment rate (part/fL*day) 30,8 13,1 11,5 0,019 VLDL2 liver attachment 'rate' (part/fL*day) 12,5 7,2 4,4 0,025 VLDL2 HL lipolysis rate (part/fL*day) 10,8 5,5 3,5 0,022 VLDL1 HL lipolysis rate (part/fL*day) 11,1 5,8 2,6 0,035 Packard - from published process parameters Transfer from VLDL1 to VLDL2 (pools/day) 16,8 5,9 5,8 0.0144 VLDL 1 toVLDL 2. The current analysis showed five significantly different processes. It more sensitively indicated changes in theVLDL 2 region, as well as indicating a changed HL activity in the whole VLDL range. -
Figure 5 shows the model fit ofpatient 19 and simulated polymorphisms affecting ApoB-mediated reabsorption and LpL lipolysis affinity. The cholesterol and triglyceride concentrations in different size classes for the simulated ApoB-mediated reabsorption reduction show the expected hypercholesterolemia (Guerin, M., P. J. et al. 1995. Arterioscler Thromb Vasc Biol 15:1359-1368). The halved ApoB-related reabsorption affinity results in a 2.2-fold increase of the LDL-cholesterol concentration in the blood.
The modelled lipolysis affinity reduction also reproduces the expected hypertriglyceridemia (Okazaki, M., et al. 2005. Arterioscler Thromb Vasc Biol 25:578-584), although less severely than the hypercholesterolemia induced above. Downregulating the LpL lipolysis affinity (by 75%) results in a 2,2 fold increase of VLDL1-triglyceride concentration in the blood. The modelled genetic variants therefore qualitatively resemble the observed phenotype. -
Figure 6 shows the rate parameter values of two patients estimated based on 6 subclasses as described above. The patients clearly differ in their individual parameters.
Preferably, the population model according to the invention further comprises one or more of the following submodels:
Claims (16)
- Population model for the analysis of blood lipoprotein physiology in a test subject comprising:a. a submodel for the production of blood lipoproteins;b. a submodel for the lipolysis of blood lipoproteins;c. a submodel for the reabsorption of blood lipoproteins; andd. a submodel relating blood lipoprotein particle size to biochemical composition, more specifically triglyceride content,thereby providing an analysis of the physiological processes underlying a steady state particle population distribution.
- Deterministic population model according to claim 1, wherein each submodel is given as function, using the size of the lipoprotein particle as the independent variable.
- Population model according to claim 1-2, wherein in the submodel for the lipolysis two models are contained, one for extra-hepatic tissue mediated lipolysis and one for hepatic lipolysis.
- Population model according to claim 1-3, wherein the submodel for the reabsorption is able to distinguish between apoB and apoE mediated reabsorption.
- Population model according to any of claims 1-4, further comprising one or more of the following submodels:a. a submodel relating blood lipoprotein particle size to total cholesterol content;b. a submodel relating blood lipoprotein particle size to free cholesterol content;c. a submodel relating blood lipoprotein particle size to cholesterol ester content;d. a submodel relating blood lipoprotein particle size to phospholipid content;e. a submodel relating blood lipoprotein particle size to total protein content.
- Population model for the presence of blood lipoproteins in a test subject according to claim 1-5 wherein the total steady-state pool of lipoproteins Qss in a diameter range [da db ] is given by:

wherein


wherein d is the particle diameter, τ signifies the residence time of a particle within a size class and
- Model according to claim 6, wherein the influx into the previous cascade step at particle diameter di-1 is defined as:

where ku,liver is the particle reabsorption rate, kl is the extrahepatic lipolysis attachment rate, kl,liver is the hepatic lipolysis attachment rate and di-1 indicates the particle radius before the lipolysis step. - Model according to claim 6 or 7, in which the residence time of a particle within a size class is given by

where ka,liver is the rate at which particles are attached to the liver to either be taken up or lipolysed there, kl is the lipolysis attachment rate for extrahepatic lipolysis. - Model according to any of claims 6-8, wherein the production of blood lipoproteins is given by the

wherein d0 stands for the particle diameter at production,d stands for the average diameter in a given class, σ is the standard deviation of the distribution curve, subscripts indicate the class to which the diameter refers, and whether it is a minimum or maximum value for that class, fnor is the corrected normal probability density function, and flognor is the corrected lognormal probability density function as follows:

wherein normpdf(d,d ,σ) stands for a normal probability density function with parametersd and σ evaluated at d, while lognormpdf(d,µ,σln) stands for a lognormal probability density function with parameters µ and σln, evaluated at d. - Model according to any of claims 6-9, wherein the lipolysis attachment rate in extra-hepatic tissue is given by the formula

wherein d is the particle diameter, dlmin is the minimum size at which lipolysis occurs, klmax is the maximum lipolysis attachment rate and σ l is a shape parameter. - Model according to any of claims 6-10, wherein the lipolysis rate in the liver kl,liver is given by the formula

wherein the liver attachment rate ka,liver is given either by


wherein ka,apoEmax is the maximum liver uptake rate due to apoE-mediated reabsorption, ka,apoB is the liver uptake rate due to apoB-mediated reabsorption, d is the particle diameter, da,apoEmin is the minimum particle diameter at which liver lipolysis takes place and σa,apoE and σu,liver are shape parameters and where fweibullpdf (d,A,B) is a weibull probability density function evaluated at d with shape parameters A and B, and fweibullpdfmax is the maximum function value attained by this weibull function on the lipoprotein size range from 0 to 200 nm. - Method to determine individual parameters of each submodel using data obtained from a blood sample in a subject comprising:a. taking a blood sample from said subject;b. providing a data set from said sample comprising either the number of blood lipoprotein particles in a size class or the chemical composition of said particles, wherein at least 6 size classes are provided;c. feeding said data to a model as claimed in claims 1-11;d. finding parameters for the submodels defined in claim 1-11 such that the resulting calculated total steady-state pool of lipoproteins Qss for every diameter d is in agreement with said dataset.
- Method according to claim 12 wherein additionally from said sample or said subject one or more data are provided, including but not limited to data from the group consisting of the ApoC3 content, the ApoA5 content, insulin sensitivity indexes, the sialic acid content, the lipoprotein lipase activity, the hepatic lipase activity, the content of C-reactive protein, the content of adiponectin, gene expression data in blood cells, relevant single nucleotide polymorphisms and copy number variations.
- Method to monitor the development of disease or the effect of a therapy in a patient by performing the method of claim 12 or 13.
- Method according to any of claims 12-14, wherein said disease is selected from the group of lipid metabolism disorders, including but not limited to hyper-and hypocholesterolemia, hypertriglyceridemia and hyperlipoproteinemia types I, IIa, IIb, III, IV and V.
- Use the method of any of claims 12-15 to choose a patient specific therapeutic intervention, directed at one or more processes that are described by one or more sub models relating to composition, production lipolysis and reabsorption of lipoproteins.
Priority Applications (4)
| Application Number | Priority Date | Filing Date | Title |
|---|---|---|---|
| EP08157988A EP2133808A1 (en) | 2008-06-10 | 2008-06-10 | Model system for diagnosing lipid metabolism |
| US12/997,430 US20110117566A1 (en) | 2008-06-10 | 2009-06-10 | Model System for Diagnosing Lipid Metabolism |
| EP09762705A EP2304624A1 (en) | 2008-06-10 | 2009-06-10 | Model system for diagnosing lipid metabolism |
| PCT/NL2009/050324 WO2009151324A1 (en) | 2008-06-10 | 2009-06-10 | Model system for diagnosing lipid metabolism |
Applications Claiming Priority (1)
| Application Number | Priority Date | Filing Date | Title |
|---|---|---|---|
| EP08157988A EP2133808A1 (en) | 2008-06-10 | 2008-06-10 | Model system for diagnosing lipid metabolism |
Publications (1)
| Publication Number | Publication Date |
|---|---|
| EP2133808A1 true EP2133808A1 (en) | 2009-12-16 |
Family
ID=39938195
Family Applications (2)
| Application Number | Title | Priority Date | Filing Date |
|---|---|---|---|
| EP08157988A Withdrawn EP2133808A1 (en) | 2008-06-10 | 2008-06-10 | Model system for diagnosing lipid metabolism |
| EP09762705A Withdrawn EP2304624A1 (en) | 2008-06-10 | 2009-06-10 | Model system for diagnosing lipid metabolism |
Family Applications After (1)
| Application Number | Title | Priority Date | Filing Date |
|---|---|---|---|
| EP09762705A Withdrawn EP2304624A1 (en) | 2008-06-10 | 2009-06-10 | Model system for diagnosing lipid metabolism |
Country Status (3)
| Country | Link |
|---|---|
| US (1) | US20110117566A1 (en) |
| EP (2) | EP2133808A1 (en) |
| WO (1) | WO2009151324A1 (en) |
Cited By (1)
| Publication number | Priority date | Publication date | Assignee | Title |
|---|---|---|---|---|
| CN104597248A (en) * | 2015-01-05 | 2015-05-06 | 中南大学湘雅二医院 | Method and kit for detecting biological activity of apolipoprotein ApoA5 non-diagnostically |
Families Citing this family (2)
| Publication number | Priority date | Publication date | Assignee | Title |
|---|---|---|---|---|
| EP2503339A1 (en) | 2011-03-23 | 2012-09-26 | Nederlandse Organisatie voor toegepast -natuurwetenschappelijk onderzoek TNO | Improved prediction of cardiovascular and metabolic disease development |
| WO2014089478A1 (en) * | 2012-12-07 | 2014-06-12 | University Of Tennessee Research Foundation | Methods of numerical analysis for platelet disorders and computer-readable media and systems for performing the same |
Citations (1)
| Publication number | Priority date | Publication date | Assignee | Title |
|---|---|---|---|---|
| WO1993003450A1 (en) * | 1991-07-30 | 1993-02-18 | North Carolina State University | Method and apparatus for measuring blood lipoprotein levels by nmr spectroscopy |
-
2008
- 2008-06-10 EP EP08157988A patent/EP2133808A1/en not_active Withdrawn
-
2009
- 2009-06-10 EP EP09762705A patent/EP2304624A1/en not_active Withdrawn
- 2009-06-10 WO PCT/NL2009/050324 patent/WO2009151324A1/en not_active Ceased
- 2009-06-10 US US12/997,430 patent/US20110117566A1/en not_active Abandoned
Patent Citations (2)
| Publication number | Priority date | Publication date | Assignee | Title |
|---|---|---|---|---|
| WO1993003450A1 (en) * | 1991-07-30 | 1993-02-18 | North Carolina State University | Method and apparatus for measuring blood lipoprotein levels by nmr spectroscopy |
| US5343389A (en) | 1991-07-30 | 1994-08-30 | North Carolina State University | Method and apparatus for measuring classes and subclasses of lipoproteins |
Non-Patent Citations (31)
| Title |
|---|
| ADIELS ET AL., J. LIPID RES., vol. 46, 2005, pages 58 - 67 |
| ADIELS, M, PHD THESIS, CHALMERS UNIV. TECHNOL., 2004 |
| ALAUPOVIC, P., METH. ENZYMOL., vol. 263, 1996, pages 32 - 60 |
| AUSTIN M A ET AL: "ATHEROGENIC LIPOPROTEIN PHENOTYPE A PROPOSED GENETIC MARKER FOR CORONARY HEART DISEASE RISK", CIRCULATION, vol. 82, no. 2, 1990, pages 495 - 506, XP002503623, ISSN: 0009-7322 * |
| AUSTIN, M.A. ET AL., CIRCULATION, vol. 82, 1990, pages 495 - 506 |
| BARRETT, P.H. ET AL., J. LIPID RES., vol. 32, 1991, pages 743 - 762 |
| CAMPOS, H. ET AL., J. LIPID RES., vol. 42, 2001, pages 1239 - 1249 |
| COHN, J.S. ET AL., J. CLIN. ENDOCRINOL. METAB., vol. 89, 2004, pages 3949 - 3955 |
| DE BEER, F. ET AL., ARTERIOSCLER. THROMB. VASC. BIOL., vol. 19, 1999, pages 633 - 637 |
| DEMANT, T. ET AL., J. LIPID RES., vol. 29, 1988, pages 1603 - 1611 |
| DEMANT, T. ET AL., J. LIPID RES., vol. 34, 1993, pages 147 - 156 |
| FISHER, W.R. ET AL., J. LIPID RES., vol. 21, 1980, pages 760 - 774 |
| FISHER, W.R. ET AL., J. LIPID RES., vol. 32, 1991, pages 1823 - 1836 |
| GUERIN, M., P. J. ET AL., ARTERIOSCLER THROMB VASC, vol. 15, 1995, pages 1359 - 1368 |
| HARRIS, W.S. ET AL., J. LIPID RES., vol. 31, 1990, pages 1549 - 1558 |
| J. LIPID RES., vol. 41, 2000, pages 305 - 318 |
| LICHTENSTEIN, L. ET AL., ARTERIOSCLER. THROMB. VASC. BIOL., vol. 27, 2007, pages 2420 - 2427 |
| MACARTHUR, J. ET AL., J. CLIN. INVEST., vol. 117, 2007, pages 153 - 164 |
| MAISTROM, R. ET AL., ARTERIOSCLER. THROMB. VASC. BIOL., vol. 17, 1997, pages 1454 - 1464 |
| MARTIN ADIELS: "PhD thesis: Compartmental Models of Lipoprotein Kinetics", 1 January 2004, CHALMERS UNIVERSITY OF TECHNOLOGY AND GÖTEBORG UNIVERSITY, GÖTEBORG, XP009108560 * |
| OKAZAKI, M. ET AL., ARTERIOSCLER THROMB VASC BIOL, vol. 25, 2005, pages 578 - 584 |
| OUT, R. ET AL., J. BIOL. CHEM., vol. 279, 2004, pages 18401 - 18406 |
| PACKARD C J ET AL: "Apolipoprotein B metabolism and the distribution of VLDL and LDL subfractions", JOURNAL OF LIPID RESEARCH, vol. 41, no. 2, February 2000 (2000-02-01), pages 305 - 317, XP002503621, ISSN: 0022-2275 * |
| PACKARD ET AL., J. LIPID RES., vol. 41, 2000, pages 305 - 3 |
| PACKARD ET AL., J. LIPID RES., vol. 41, 2000, pages 305 - 318 |
| PACKARD, C.J. ET AL., J. LIPID RES., vol. 36, 1995, pages 172 - 187 |
| PATTERSON, B.W. ET AL., J. LIPID RES., vol. 43, 2002, pages 223 - 233 |
| TUZIKOV ET AL., VOPROSY MEDITSINSKOJ KHIMII, vol. 48, 2002, pages 90 - 91 |
| WALLDIUS, G. ET AL., J. INTERN. MED., vol. 259, 2006, pages 259 - 266 |
| ZHENG CHUNYU ET AL: "Rapid turnover of apolipoprotein C-III-containing triglyceride-rich lipoproteins contributing to the formation of LDL subfractions", JOURNAL OF LIPID RESEARCH, vol. 48, no. 5, May 2007 (2007-05-01), pages 1190 - 1203, XP002503622, ISSN: 0022-2275 * |
| ZHENG, C. ET AL., J. LIPID RES., vol. 48, pages 1190 - 1203 |
Cited By (2)
| Publication number | Priority date | Publication date | Assignee | Title |
|---|---|---|---|---|
| CN104597248A (en) * | 2015-01-05 | 2015-05-06 | 中南大学湘雅二医院 | Method and kit for detecting biological activity of apolipoprotein ApoA5 non-diagnostically |
| CN104597248B (en) * | 2015-01-05 | 2016-11-23 | 中南大学湘雅二医院 | The method of a kind of non-diagnostic purpose detection ApoA5 biologic activity and test kit |
Also Published As
| Publication number | Publication date |
|---|---|
| WO2009151324A1 (en) | 2009-12-17 |
| EP2304624A1 (en) | 2011-04-06 |
| US20110117566A1 (en) | 2011-05-19 |
Similar Documents
| Publication | Publication Date | Title |
|---|---|---|
| Tsimikas et al. | NHLBI working group recommendations to reduce lipoprotein (a)-mediated risk of cardiovascular disease and aortic stenosis | |
| Pechlaner et al. | Very-low-density lipoprotein–associated apolipoproteins predict cardiovascular events and are lowered by inhibition of APOC-III | |
| Yin et al. | Lipidomic profiling identifies signatures of metabolic risk | |
| Yetukuri et al. | Bioinformatics strategies for lipidomics analysis: characterization of obesity related hepatic steatosis | |
| Suhre et al. | Metabolic footprint of diabetes: a multiplatform metabolomics study in an epidemiological setting | |
| Orešič et al. | Metabolome in progression to Alzheimer's disease | |
| Langlois et al. | Clinical impact of direct HDLc and LDLc method bias in hypertriglyceridemia. A simulation study of the EAS-EFLM Collaborative Project Group | |
| US20040133358A1 (en) | Clinical and diagnostic database and related methods | |
| US20170083663A1 (en) | Methods, Systems and Computer Programs for Assessing CHD Risk Using Adjusted HDL Particle Number Measurements | |
| WO2016040859A1 (en) | Cardiovascular risk evaluations using a risk parameter that includes an hdl and inflammatory biomarker interaction parameter | |
| Miida et al. | Harmonization of Lipoprotein (a) Immunoassays Using A Serum Panel Value Assigned with The IFCC-Endorsed Mass Spectrometry-Based Reference Measurement Procedure as A First Step Towards Apolipoprotein Standardization | |
| Clark et al. | Leak current, even with gigaohm seals, can cause misinterpretation of stem cell-derived cardiomyocyte action potential recordings | |
| Masana et al. | The apolipoprotein AV gene and diurnal triglyceridaemia in normolipidaemic subjects. | |
| US20110117566A1 (en) | Model System for Diagnosing Lipid Metabolism | |
| Sukhonpanich et al. | Reference range for serum neurofilament light chain: findings from healthy Thai adults | |
| Dubois et al. | Comparison of normalization methods in clinical research applications of mass spectrometry-based proteomics | |
| Li et al. | Population pharmacokinetics of Amisulpride in Chinese patients with schizophrenia with external validation: the impact of renal function | |
| Ding et al. | Association between human blood metabolome and the risk of pre-eclampsia | |
| van Schalkwijk et al. | Improved cholesterol phenotype analysis by a model relating lipoprotein life cycle processes to particle size | |
| Sysi-Aho et al. | Exploring the lipoprotein composition using Bayesian regression on serum lipidomic profiles | |
| Ruhaak et al. | Transferability and Between Laboratory Imprecision of an LC-MS/MS-Based Reference Measurement Procedure for Apolipoproteins | |
| Chen et al. | Characterisation of pregnancy-induced alterations in apolipoproteins and their associations with maternal metabolic risk factors and offspring birth outcomes: a preconception and longitudinal cohort study | |
| Bizzarri et al. | Extreme MetaboHealth scores in three cohort studies associate with plasma protein markers for inflammation and cholesterol transport | |
| Chu et al. | Lipoprotein profiles, not anthropometric measures, correlate with serum lipoprotein (a) values in children: the Taipei children heart study | |
| JP6442482B2 (en) | Lipoprotein analysis method |
Legal Events
| Date | Code | Title | Description |
|---|---|---|---|
| PUAI | Public reference made under article 153(3) epc to a published international application that has entered the european phase |
Free format text: ORIGINAL CODE: 0009012 |
|
| AK | Designated contracting states |
Kind code of ref document: A1 Designated state(s): AT BE BG CH CY CZ DE DK EE ES FI FR GB GR HR HU IE IS IT LI LT LU LV MC MT NL NO PL PT RO SE SI SK TR |
|
| AX | Request for extension of the european patent |
Extension state: AL BA MK RS |
|
| AKY | No designation fees paid | ||
| REG | Reference to a national code |
Ref country code: DE Ref legal event code: 8566 |
|
| STAA | Information on the status of an ep patent application or granted ep patent |
Free format text: STATUS: THE APPLICATION IS DEEMED TO BE WITHDRAWN |
|
| 18D | Application deemed to be withdrawn |
Effective date: 20100617 |