EP2107120A1 - Capture et détection des microbes par des procédés de membrane - Google Patents
Capture et détection des microbes par des procédés de membrane Download PDFInfo
- Publication number
- EP2107120A1 EP2107120A1 EP08168266A EP08168266A EP2107120A1 EP 2107120 A1 EP2107120 A1 EP 2107120A1 EP 08168266 A EP08168266 A EP 08168266A EP 08168266 A EP08168266 A EP 08168266A EP 2107120 A1 EP2107120 A1 EP 2107120A1
- Authority
- EP
- European Patent Office
- Prior art keywords
- membrane
- analyte
- fluid
- particle
- particles
- Prior art date
- Legal status (The legal status is an assumption and is not a legal conclusion. Google has not performed a legal analysis and makes no representation as to the accuracy of the status listed.)
- Withdrawn
Links
- 239000012528 membrane Substances 0.000 title claims abstract description 239
- 238000000034 method Methods 0.000 title claims abstract description 131
- 238000001514 detection method Methods 0.000 title claims abstract description 77
- 239000012530 fluid Substances 0.000 claims abstract description 186
- 238000004458 analytical method Methods 0.000 claims abstract description 50
- 239000002245 particle Substances 0.000 claims description 190
- 239000012491 analyte Substances 0.000 claims description 126
- 239000011148 porous material Substances 0.000 claims description 50
- 229920000936 Agarose Polymers 0.000 claims description 29
- 239000000463 material Substances 0.000 claims description 29
- 238000012800 visualization Methods 0.000 claims description 20
- 239000003795 chemical substances by application Substances 0.000 claims description 18
- 230000003993 interaction Effects 0.000 claims description 16
- 238000007373 indentation Methods 0.000 claims description 13
- 238000005406 washing Methods 0.000 claims description 13
- 239000002952 polymeric resin Substances 0.000 claims description 12
- 229920003002 synthetic resin Polymers 0.000 claims description 12
- XLYOFNOQVPJJNP-UHFFFAOYSA-N water Substances O XLYOFNOQVPJJNP-UHFFFAOYSA-N 0.000 claims description 12
- 210000004369 blood Anatomy 0.000 claims description 11
- 239000008280 blood Substances 0.000 claims description 11
- 239000003995 emulsifying agent Substances 0.000 claims description 11
- 230000008859 change Effects 0.000 claims description 9
- 239000000839 emulsion Substances 0.000 claims description 7
- 239000000203 mixture Substances 0.000 claims description 7
- 239000007864 aqueous solution Substances 0.000 claims description 5
- 241000725303 Human immunodeficiency virus Species 0.000 claims description 4
- 229920000058 polyacrylate Polymers 0.000 claims description 3
- 238000003860 storage Methods 0.000 claims description 3
- 230000000717 retained effect Effects 0.000 claims description 2
- 238000007665 sagging Methods 0.000 claims description 2
- 210000000265 leukocyte Anatomy 0.000 claims 3
- 238000012544 monitoring process Methods 0.000 claims 1
- 239000011324 bead Substances 0.000 description 125
- 210000004215 spore Anatomy 0.000 description 53
- 108020003175 receptors Proteins 0.000 description 51
- 210000004027 cell Anatomy 0.000 description 46
- 239000000243 solution Substances 0.000 description 38
- 241000894006 Bacteria Species 0.000 description 37
- 239000000523 sample Substances 0.000 description 32
- 238000012360 testing method Methods 0.000 description 24
- 238000003556 assay Methods 0.000 description 21
- 239000000428 dust Substances 0.000 description 19
- 239000000126 substance Substances 0.000 description 19
- 230000003287 optical effect Effects 0.000 description 14
- 230000027455 binding Effects 0.000 description 13
- 230000008569 process Effects 0.000 description 13
- 239000013618 particulate matter Substances 0.000 description 11
- 238000011045 prefiltration Methods 0.000 description 11
- 239000007788 liquid Substances 0.000 description 10
- 238000005259 measurement Methods 0.000 description 10
- 239000004005 microsphere Substances 0.000 description 10
- 241000193738 Bacillus anthracis Species 0.000 description 9
- 210000001744 T-lymphocyte Anatomy 0.000 description 9
- 238000000684 flow cytometry Methods 0.000 description 9
- 229920000642 polymer Polymers 0.000 description 9
- 238000002360 preparation method Methods 0.000 description 9
- 238000001228 spectrum Methods 0.000 description 9
- 238000003756 stirring Methods 0.000 description 9
- 108010031480 Artificial Receptors Proteins 0.000 description 8
- FAPWRFPIFSIZLT-UHFFFAOYSA-M Sodium chloride Chemical compound [Na+].[Cl-] FAPWRFPIFSIZLT-UHFFFAOYSA-M 0.000 description 8
- 210000004698 lymphocyte Anatomy 0.000 description 8
- 229920003229 poly(methyl methacrylate) Polymers 0.000 description 8
- 239000004926 polymethyl methacrylate Substances 0.000 description 8
- 238000013459 approach Methods 0.000 description 7
- 238000003491 array Methods 0.000 description 7
- 210000004970 cd4 cell Anatomy 0.000 description 7
- 108090000765 processed proteins & peptides Proteins 0.000 description 7
- 239000011550 stock solution Substances 0.000 description 7
- 238000006073 displacement reaction Methods 0.000 description 6
- 238000011156 evaluation Methods 0.000 description 6
- 238000002474 experimental method Methods 0.000 description 6
- 239000010410 layer Substances 0.000 description 6
- 239000000178 monomer Substances 0.000 description 6
- 239000007764 o/w emulsion Substances 0.000 description 6
- 239000003921 oil Substances 0.000 description 6
- 238000004626 scanning electron microscopy Methods 0.000 description 6
- 230000035945 sensitivity Effects 0.000 description 6
- 238000004627 transmission electron microscopy Methods 0.000 description 6
- 239000007762 w/o emulsion Substances 0.000 description 6
- IJGRMHOSHXDMSA-UHFFFAOYSA-N Atomic nitrogen Chemical compound N#N IJGRMHOSHXDMSA-UHFFFAOYSA-N 0.000 description 5
- XDTMQSROBMDMFD-UHFFFAOYSA-N Cyclohexane Chemical compound C1CCCCC1 XDTMQSROBMDMFD-UHFFFAOYSA-N 0.000 description 5
- VYPSYNLAJGMNEJ-UHFFFAOYSA-N Silicium dioxide Chemical compound O=[Si]=O VYPSYNLAJGMNEJ-UHFFFAOYSA-N 0.000 description 5
- 239000000443 aerosol Substances 0.000 description 5
- 239000000427 antigen Substances 0.000 description 5
- 108091007433 antigens Proteins 0.000 description 5
- 102000036639 antigens Human genes 0.000 description 5
- 239000002585 base Substances 0.000 description 5
- 230000008901 benefit Effects 0.000 description 5
- 239000003153 chemical reaction reagent Substances 0.000 description 5
- 239000003086 colorant Substances 0.000 description 5
- 230000000694 effects Effects 0.000 description 5
- 230000007613 environmental effect Effects 0.000 description 5
- 239000000499 gel Substances 0.000 description 5
- 239000011159 matrix material Substances 0.000 description 5
- 244000005700 microbiome Species 0.000 description 5
- 238000006116 polymerization reaction Methods 0.000 description 5
- 230000002829 reductive effect Effects 0.000 description 5
- 238000012216 screening Methods 0.000 description 5
- 239000011780 sodium chloride Substances 0.000 description 5
- 239000008223 sterile water Substances 0.000 description 5
- QGZKDVFQNNGYKY-UHFFFAOYSA-N Ammonia Chemical compound N QGZKDVFQNNGYKY-UHFFFAOYSA-N 0.000 description 4
- 102000004190 Enzymes Human genes 0.000 description 4
- 108090000790 Enzymes Proteins 0.000 description 4
- PRXRUNOAOLTIEF-ADSICKODSA-N Sorbitan trioleate Chemical compound CCCCCCCC\C=C/CCCCCCCC(=O)OC[C@@H](OC(=O)CCCCCCC\C=C/CCCCCCCC)[C@H]1OC[C@H](O)[C@H]1OC(=O)CCCCCCC\C=C/CCCCCCCC PRXRUNOAOLTIEF-ADSICKODSA-N 0.000 description 4
- 235000013361 beverage Nutrition 0.000 description 4
- 230000015572 biosynthetic process Effects 0.000 description 4
- 238000006243 chemical reaction Methods 0.000 description 4
- 230000009089 cytolysis Effects 0.000 description 4
- 238000011161 development Methods 0.000 description 4
- 230000018109 developmental process Effects 0.000 description 4
- 238000000799 fluorescence microscopy Methods 0.000 description 4
- 235000013305 food Nutrition 0.000 description 4
- 239000011521 glass Substances 0.000 description 4
- 230000002209 hydrophobic effect Effects 0.000 description 4
- 238000011534 incubation Methods 0.000 description 4
- 239000002609 medium Substances 0.000 description 4
- 239000002184 metal Substances 0.000 description 4
- 229910052751 metal Inorganic materials 0.000 description 4
- 108020004707 nucleic acids Proteins 0.000 description 4
- 102000039446 nucleic acids Human genes 0.000 description 4
- 150000007523 nucleic acids Chemical class 0.000 description 4
- 229920001542 oligosaccharide Polymers 0.000 description 4
- 102000004196 processed proteins & peptides Human genes 0.000 description 4
- 102000004169 proteins and genes Human genes 0.000 description 4
- 108090000623 proteins and genes Proteins 0.000 description 4
- 230000011664 signaling Effects 0.000 description 4
- 239000007787 solid Substances 0.000 description 4
- 229910001220 stainless steel Inorganic materials 0.000 description 4
- 239000010935 stainless steel Substances 0.000 description 4
- 238000010557 suspension polymerization reaction Methods 0.000 description 4
- 239000002699 waste material Substances 0.000 description 4
- 244000063299 Bacillus subtilis Species 0.000 description 3
- 108020004414 DNA Proteins 0.000 description 3
- 238000002965 ELISA Methods 0.000 description 3
- 240000004808 Saccharomyces cerevisiae Species 0.000 description 3
- HEMHJVSKTPXQMS-UHFFFAOYSA-M Sodium hydroxide Chemical compound [OH-].[Na+] HEMHJVSKTPXQMS-UHFFFAOYSA-M 0.000 description 3
- 241000700605 Viruses Species 0.000 description 3
- 238000002835 absorbance Methods 0.000 description 3
- 238000010521 absorption reaction Methods 0.000 description 3
- 238000013019 agitation Methods 0.000 description 3
- 150000001413 amino acids Chemical class 0.000 description 3
- 239000003124 biologic agent Substances 0.000 description 3
- 229920001222 biopolymer Polymers 0.000 description 3
- 238000011088 calibration curve Methods 0.000 description 3
- 150000001875 compounds Chemical class 0.000 description 3
- 239000000356 contaminant Substances 0.000 description 3
- 238000010586 diagram Methods 0.000 description 3
- 238000004090 dissolution Methods 0.000 description 3
- 238000005516 engineering process Methods 0.000 description 3
- -1 etc.) Substances 0.000 description 3
- 238000002073 fluorescence micrograph Methods 0.000 description 3
- 229920001109 fluorescent polymer Polymers 0.000 description 3
- 230000036541 health Effects 0.000 description 3
- 238000003018 immunoassay Methods 0.000 description 3
- 238000012092 latex agglutination test Methods 0.000 description 3
- 239000003446 ligand Substances 0.000 description 3
- 230000031700 light absorption Effects 0.000 description 3
- 230000014759 maintenance of location Effects 0.000 description 3
- 238000001000 micrograph Methods 0.000 description 3
- 238000000386 microscopy Methods 0.000 description 3
- 230000000877 morphologic effect Effects 0.000 description 3
- 150000002482 oligosaccharides Chemical class 0.000 description 3
- 238000003752 polymerase chain reaction Methods 0.000 description 3
- 238000012545 processing Methods 0.000 description 3
- 230000008929 regeneration Effects 0.000 description 3
- 238000011069 regeneration method Methods 0.000 description 3
- 238000013207 serial dilution Methods 0.000 description 3
- JQWHASGSAFIOCM-UHFFFAOYSA-M sodium periodate Chemical compound [Na+].[O-]I(=O)(=O)=O JQWHASGSAFIOCM-UHFFFAOYSA-M 0.000 description 3
- 239000002904 solvent Substances 0.000 description 3
- 239000003053 toxin Substances 0.000 description 3
- 231100000765 toxin Toxicity 0.000 description 3
- 108700012359 toxins Proteins 0.000 description 3
- 239000012780 transparent material Substances 0.000 description 3
- 238000001429 visible spectrum Methods 0.000 description 3
- 229920001817 Agar Polymers 0.000 description 2
- 235000014469 Bacillus subtilis Nutrition 0.000 description 2
- 210000001266 CD8-positive T-lymphocyte Anatomy 0.000 description 2
- CURLTUGMZLYLDI-UHFFFAOYSA-N Carbon dioxide Chemical compound O=C=O CURLTUGMZLYLDI-UHFFFAOYSA-N 0.000 description 2
- 229920005123 Celcon® Polymers 0.000 description 2
- 241000223935 Cryptosporidium Species 0.000 description 2
- 241001646719 Escherichia coli O157:H7 Species 0.000 description 2
- 108090001090 Lectins Proteins 0.000 description 2
- 102000004856 Lectins Human genes 0.000 description 2
- 229920001213 Polysorbate 20 Polymers 0.000 description 2
- 238000009825 accumulation Methods 0.000 description 2
- NIXOWILDQLNWCW-UHFFFAOYSA-N acrylic acid group Chemical group C(C=C)(=O)O NIXOWILDQLNWCW-UHFFFAOYSA-N 0.000 description 2
- 239000008272 agar Substances 0.000 description 2
- 229910021529 ammonia Inorganic materials 0.000 description 2
- 229940065181 bacillus anthracis Drugs 0.000 description 2
- 230000001580 bacterial effect Effects 0.000 description 2
- 244000052616 bacterial pathogen Species 0.000 description 2
- 230000002051 biphasic effect Effects 0.000 description 2
- 230000000903 blocking effect Effects 0.000 description 2
- 210000001124 body fluid Anatomy 0.000 description 2
- 229940041514 candida albicans extract Drugs 0.000 description 2
- 238000012512 characterization method Methods 0.000 description 2
- 239000013043 chemical agent Substances 0.000 description 2
- 238000012993 chemical processing Methods 0.000 description 2
- 238000012790 confirmation Methods 0.000 description 2
- 238000001816 cooling Methods 0.000 description 2
- 238000000354 decomposition reaction Methods 0.000 description 2
- 230000007123 defense Effects 0.000 description 2
- 230000001419 dependent effect Effects 0.000 description 2
- WJJMNDUMQPNECX-UHFFFAOYSA-N dipicolinic acid Chemical compound OC(=O)C1=CC=CC(C(O)=O)=N1 WJJMNDUMQPNECX-UHFFFAOYSA-N 0.000 description 2
- 239000006185 dispersion Substances 0.000 description 2
- 239000012153 distilled water Substances 0.000 description 2
- 238000009826 distribution Methods 0.000 description 2
- 239000003814 drug Substances 0.000 description 2
- 229940079593 drug Drugs 0.000 description 2
- 239000000975 dye Substances 0.000 description 2
- 238000001493 electron microscopy Methods 0.000 description 2
- 210000003743 erythrocyte Anatomy 0.000 description 2
- 230000005284 excitation Effects 0.000 description 2
- 239000000835 fiber Substances 0.000 description 2
- 238000005189 flocculation Methods 0.000 description 2
- 230000016615 flocculation Effects 0.000 description 2
- 238000002866 fluorescence resonance energy transfer Methods 0.000 description 2
- 239000007850 fluorescent dye Substances 0.000 description 2
- 239000007789 gas Substances 0.000 description 2
- BBKFSSMUWOMYPI-UHFFFAOYSA-N gold palladium Chemical compound [Pd].[Au] BBKFSSMUWOMYPI-UHFFFAOYSA-N 0.000 description 2
- 238000000227 grinding Methods 0.000 description 2
- 239000001963 growth medium Substances 0.000 description 2
- 238000010191 image analysis Methods 0.000 description 2
- 238000003384 imaging method Methods 0.000 description 2
- 230000000977 initiatory effect Effects 0.000 description 2
- 239000002523 lectin Substances 0.000 description 2
- 238000004519 manufacturing process Methods 0.000 description 2
- 238000012986 modification Methods 0.000 description 2
- 230000004048 modification Effects 0.000 description 2
- 239000003068 molecular probe Substances 0.000 description 2
- 229920000344 molecularly imprinted polymer Polymers 0.000 description 2
- 229910052757 nitrogen Inorganic materials 0.000 description 2
- 230000009871 nonspecific binding Effects 0.000 description 2
- 238000005457 optimization Methods 0.000 description 2
- 230000001717 pathogenic effect Effects 0.000 description 2
- 239000012071 phase Substances 0.000 description 2
- 239000004033 plastic Substances 0.000 description 2
- 229920003023 plastic Polymers 0.000 description 2
- BASFCYQUMIYNBI-UHFFFAOYSA-N platinum Chemical compound [Pt] BASFCYQUMIYNBI-UHFFFAOYSA-N 0.000 description 2
- 108091033319 polynucleotide Proteins 0.000 description 2
- 239000002157 polynucleotide Substances 0.000 description 2
- 102000040430 polynucleotide Human genes 0.000 description 2
- 239000000256 polyoxyethylene sorbitan monolaurate Substances 0.000 description 2
- 235000010486 polyoxyethylene sorbitan monolaurate Nutrition 0.000 description 2
- 235000010482 polyoxyethylene sorbitan monooleate Nutrition 0.000 description 2
- 229920000053 polysorbate 80 Polymers 0.000 description 2
- 229920001343 polytetrafluoroethylene Polymers 0.000 description 2
- 239000004810 polytetrafluoroethylene Substances 0.000 description 2
- 238000001556 precipitation Methods 0.000 description 2
- 238000012673 precipitation polymerization Methods 0.000 description 2
- 238000010791 quenching Methods 0.000 description 2
- 230000000171 quenching effect Effects 0.000 description 2
- 238000011160 research Methods 0.000 description 2
- 239000013545 self-assembled monolayer Substances 0.000 description 2
- 238000000926 separation method Methods 0.000 description 2
- 239000000377 silicon dioxide Substances 0.000 description 2
- 241000894007 species Species 0.000 description 2
- 230000006641 stabilisation Effects 0.000 description 2
- 238000011105 stabilization Methods 0.000 description 2
- 231100000331 toxic Toxicity 0.000 description 2
- 230000002588 toxic effect Effects 0.000 description 2
- 239000012137 tryptone Substances 0.000 description 2
- 238000002604 ultrasonography Methods 0.000 description 2
- 238000011179 visual inspection Methods 0.000 description 2
- 239000012138 yeast extract Substances 0.000 description 2
- 108091032973 (ribonucleotides)n+m Proteins 0.000 description 1
- 239000012099 Alexa Fluor family Substances 0.000 description 1
- PNEYBMLMFCGWSK-UHFFFAOYSA-N Alumina Chemical class [O-2].[O-2].[O-2].[Al+3].[Al+3] PNEYBMLMFCGWSK-UHFFFAOYSA-N 0.000 description 1
- 108091023037 Aptamer Proteins 0.000 description 1
- 101100166427 Arabidopsis thaliana CCD4 gene Proteins 0.000 description 1
- 241000193830 Bacillus <bacterium> Species 0.000 description 1
- OYPRJOBELJOOCE-UHFFFAOYSA-N Calcium Chemical compound [Ca] OYPRJOBELJOOCE-UHFFFAOYSA-N 0.000 description 1
- OKTJSMMVPCPJKN-UHFFFAOYSA-N Carbon Chemical compound [C] OKTJSMMVPCPJKN-UHFFFAOYSA-N 0.000 description 1
- 208000035473 Communicable disease Diseases 0.000 description 1
- 241000195493 Cryptophyta Species 0.000 description 1
- LFQSCWFLJHTTHZ-UHFFFAOYSA-N Ethanol Chemical compound CCO LFQSCWFLJHTTHZ-UHFFFAOYSA-N 0.000 description 1
- 229910001218 Gallium arsenide Inorganic materials 0.000 description 1
- WQZGKKKJIJFFOK-GASJEMHNSA-N Glucose Natural products OC[C@H]1OC(O)[C@H](O)[C@@H](O)[C@@H]1O WQZGKKKJIJFFOK-GASJEMHNSA-N 0.000 description 1
- SXRSQZLOMIGNAQ-UHFFFAOYSA-N Glutaraldehyde Chemical compound O=CCCCC=O SXRSQZLOMIGNAQ-UHFFFAOYSA-N 0.000 description 1
- 108010043121 Green Fluorescent Proteins Proteins 0.000 description 1
- 239000000020 Nitrocellulose Substances 0.000 description 1
- 108091028043 Nucleic acid sequence Proteins 0.000 description 1
- 239000004677 Nylon Substances 0.000 description 1
- 108020005187 Oligonucleotide Probes Proteins 0.000 description 1
- 108010038807 Oligopeptides Proteins 0.000 description 1
- 102000015636 Oligopeptides Human genes 0.000 description 1
- 108010067902 Peptide Library Proteins 0.000 description 1
- 229920012266 Poly(ether sulfone) PES Polymers 0.000 description 1
- 239000004365 Protease Substances 0.000 description 1
- 241000589180 Rhizobium Species 0.000 description 1
- 239000006146 Roswell Park Memorial Institute medium Substances 0.000 description 1
- 241000607768 Shigella Species 0.000 description 1
- BQCADISMDOOEFD-UHFFFAOYSA-N Silver Chemical compound [Ag] BQCADISMDOOEFD-UHFFFAOYSA-N 0.000 description 1
- 229910052771 Terbium Inorganic materials 0.000 description 1
- 238000005411 Van der Waals force Methods 0.000 description 1
- 241000607626 Vibrio cholerae Species 0.000 description 1
- PTFCDOFLOPIGGS-UHFFFAOYSA-N Zinc dication Chemical compound [Zn+2] PTFCDOFLOPIGGS-UHFFFAOYSA-N 0.000 description 1
- DPKHZNPWBDQZCN-UHFFFAOYSA-N acridine orange free base Chemical compound C1=CC(N(C)C)=CC2=NC3=CC(N(C)C)=CC=C3C=C21 DPKHZNPWBDQZCN-UHFFFAOYSA-N 0.000 description 1
- 230000009471 action Effects 0.000 description 1
- 230000004913 activation Effects 0.000 description 1
- 239000000654 additive Substances 0.000 description 1
- 230000004520 agglutination Effects 0.000 description 1
- 230000002776 aggregation Effects 0.000 description 1
- 238000004220 aggregation Methods 0.000 description 1
- 125000003172 aldehyde group Chemical group 0.000 description 1
- 239000003513 alkali Substances 0.000 description 1
- 229910052782 aluminium Inorganic materials 0.000 description 1
- XAGFODPZIPBFFR-UHFFFAOYSA-N aluminium Chemical compound [Al] XAGFODPZIPBFFR-UHFFFAOYSA-N 0.000 description 1
- 125000003277 amino group Chemical group 0.000 description 1
- 230000000798 anti-retroviral effect Effects 0.000 description 1
- 238000011225 antiretroviral therapy Methods 0.000 description 1
- 239000012298 atmosphere Substances 0.000 description 1
- 238000004630 atomic force microscopy Methods 0.000 description 1
- 150000001540 azides Chemical group 0.000 description 1
- 210000004666 bacterial spore Anatomy 0.000 description 1
- DZBUGLKDJFMEHC-UHFFFAOYSA-N benzoquinolinylidene Natural products C1=CC=CC2=CC3=CC=CC=C3N=C21 DZBUGLKDJFMEHC-UHFFFAOYSA-N 0.000 description 1
- 238000010876 biochemical test Methods 0.000 description 1
- 210000000601 blood cell Anatomy 0.000 description 1
- 210000001772 blood platelet Anatomy 0.000 description 1
- 239000012888 bovine serum Substances 0.000 description 1
- 239000000872 buffer Substances 0.000 description 1
- 239000007853 buffer solution Substances 0.000 description 1
- DEGAKNSWVGKMLS-UHFFFAOYSA-N calcein Chemical compound O1C(=O)C2=CC=CC=C2C21C1=CC(CN(CC(O)=O)CC(O)=O)=C(O)C=C1OC1=C2C=C(CN(CC(O)=O)CC(=O)O)C(O)=C1 DEGAKNSWVGKMLS-UHFFFAOYSA-N 0.000 description 1
- 229910052791 calcium Inorganic materials 0.000 description 1
- 239000011575 calcium Substances 0.000 description 1
- 229910052799 carbon Inorganic materials 0.000 description 1
- 239000001569 carbon dioxide Substances 0.000 description 1
- 229910002092 carbon dioxide Inorganic materials 0.000 description 1
- 150000004649 carbonic acid derivatives Chemical class 0.000 description 1
- 230000001413 cellular effect Effects 0.000 description 1
- 229920002301 cellulose acetate Polymers 0.000 description 1
- 238000004587 chromatography analysis Methods 0.000 description 1
- 230000001332 colony forming effect Effects 0.000 description 1
- 230000002860 competitive effect Effects 0.000 description 1
- 230000002596 correlated effect Effects 0.000 description 1
- 230000000875 corresponding effect Effects 0.000 description 1
- 230000008878 coupling Effects 0.000 description 1
- 238000010168 coupling process Methods 0.000 description 1
- 238000005859 coupling reaction Methods 0.000 description 1
- 238000004132 cross linking Methods 0.000 description 1
- 230000003247 decreasing effect Effects 0.000 description 1
- 230000018044 dehydration Effects 0.000 description 1
- 238000006297 dehydration reaction Methods 0.000 description 1
- 238000013461 design Methods 0.000 description 1
- 239000003599 detergent Substances 0.000 description 1
- 239000008121 dextrose Substances 0.000 description 1
- 150000004985 diamines Chemical class 0.000 description 1
- 230000004069 differentiation Effects 0.000 description 1
- 238000009792 diffusion process Methods 0.000 description 1
- 238000007865 diluting Methods 0.000 description 1
- 238000010790 dilution Methods 0.000 description 1
- 239000012895 dilution Substances 0.000 description 1
- 150000002009 diols Chemical group 0.000 description 1
- FPAFDBFIGPHWGO-UHFFFAOYSA-N dioxosilane;oxomagnesium;hydrate Chemical compound O.[Mg]=O.[Mg]=O.[Mg]=O.O=[Si]=O.O=[Si]=O.O=[Si]=O.O=[Si]=O FPAFDBFIGPHWGO-UHFFFAOYSA-N 0.000 description 1
- LOKCTEFSRHRXRJ-UHFFFAOYSA-I dipotassium trisodium dihydrogen phosphate hydrogen phosphate dichloride Chemical compound P(=O)(O)(O)[O-].[K+].P(=O)(O)([O-])[O-].[Na+].[Na+].[Cl-].[K+].[Cl-].[Na+] LOKCTEFSRHRXRJ-UHFFFAOYSA-I 0.000 description 1
- 231100000673 dose–response relationship Toxicity 0.000 description 1
- 238000009510 drug design Methods 0.000 description 1
- 230000005611 electricity Effects 0.000 description 1
- 230000008030 elimination Effects 0.000 description 1
- 238000003379 elimination reaction Methods 0.000 description 1
- 238000004945 emulsification Methods 0.000 description 1
- 230000006353 environmental stress Effects 0.000 description 1
- 229920006335 epoxy glue Polymers 0.000 description 1
- 238000005530 etching Methods 0.000 description 1
- 238000001914 filtration Methods 0.000 description 1
- 239000010419 fine particle Substances 0.000 description 1
- 238000001506 fluorescence spectroscopy Methods 0.000 description 1
- SXXHYAMKYMNIHI-UHFFFAOYSA-N fluoroimino(sulfanylidene)methane Chemical compound FN=C=S SXXHYAMKYMNIHI-UHFFFAOYSA-N 0.000 description 1
- 238000011010 flushing procedure Methods 0.000 description 1
- 239000006260 foam Substances 0.000 description 1
- 239000004088 foaming agent Substances 0.000 description 1
- 239000012634 fragment Substances 0.000 description 1
- 125000000524 functional group Chemical group 0.000 description 1
- 229910052732 germanium Inorganic materials 0.000 description 1
- PCHJSUWPFVWCPO-UHFFFAOYSA-N gold Chemical compound [Au] PCHJSUWPFVWCPO-UHFFFAOYSA-N 0.000 description 1
- 229910052737 gold Inorganic materials 0.000 description 1
- 239000010931 gold Substances 0.000 description 1
- 230000012010 growth Effects 0.000 description 1
- 238000004128 high performance liquid chromatography Methods 0.000 description 1
- 238000009396 hybridization Methods 0.000 description 1
- 239000001257 hydrogen Substances 0.000 description 1
- 229910052739 hydrogen Inorganic materials 0.000 description 1
- 238000010348 incorporation Methods 0.000 description 1
- 230000006698 induction Effects 0.000 description 1
- 230000002401 inhibitory effect Effects 0.000 description 1
- 239000000976 ink Substances 0.000 description 1
- 230000010354 integration Effects 0.000 description 1
- 238000002955 isolation Methods 0.000 description 1
- 238000009533 lab test Methods 0.000 description 1
- 238000002372 labelling Methods 0.000 description 1
- 239000004816 latex Substances 0.000 description 1
- 229920000126 latex Polymers 0.000 description 1
- 238000011068 loading method Methods 0.000 description 1
- 230000033001 locomotion Effects 0.000 description 1
- 230000002934 lysing effect Effects 0.000 description 1
- 238000003760 magnetic stirring Methods 0.000 description 1
- 238000012423 maintenance Methods 0.000 description 1
- 238000002483 medication Methods 0.000 description 1
- QSHDDOUJBYECFT-UHFFFAOYSA-N mercury Chemical compound [Hg] QSHDDOUJBYECFT-UHFFFAOYSA-N 0.000 description 1
- 229910052753 mercury Inorganic materials 0.000 description 1
- 229910044991 metal oxide Inorganic materials 0.000 description 1
- 150000004706 metal oxides Chemical class 0.000 description 1
- 150000002739 metals Chemical class 0.000 description 1
- 238000002493 microarray Methods 0.000 description 1
- 239000011325 microbead Substances 0.000 description 1
- 230000000813 microbial effect Effects 0.000 description 1
- 238000002156 mixing Methods 0.000 description 1
- 210000001616 monocyte Anatomy 0.000 description 1
- 239000013642 negative control Substances 0.000 description 1
- 229920001220 nitrocellulos Polymers 0.000 description 1
- JCXJVPUVTGWSNB-UHFFFAOYSA-N nitrogen dioxide Inorganic materials O=[N]=O JCXJVPUVTGWSNB-UHFFFAOYSA-N 0.000 description 1
- 239000002773 nucleotide Substances 0.000 description 1
- 125000003729 nucleotide group Chemical group 0.000 description 1
- 229920001778 nylon Polymers 0.000 description 1
- 229960002378 oftasceine Drugs 0.000 description 1
- 239000002751 oligonucleotide probe Substances 0.000 description 1
- 239000012074 organic phase Substances 0.000 description 1
- 230000001590 oxidative effect Effects 0.000 description 1
- 244000052769 pathogen Species 0.000 description 1
- 230000002572 peristaltic effect Effects 0.000 description 1
- 239000008363 phosphate buffer Substances 0.000 description 1
- 239000002953 phosphate buffered saline Substances 0.000 description 1
- 238000007747 plating Methods 0.000 description 1
- 229910052697 platinum Inorganic materials 0.000 description 1
- 229920002401 polyacrylamide Polymers 0.000 description 1
- 239000004417 polycarbonate Substances 0.000 description 1
- 229920000515 polycarbonate Polymers 0.000 description 1
- 229920001296 polysiloxane Polymers 0.000 description 1
- 239000000843 powder Substances 0.000 description 1
- 238000009597 pregnancy test Methods 0.000 description 1
- 150000003138 primary alcohols Chemical class 0.000 description 1
- 238000007639 printing Methods 0.000 description 1
- 230000002035 prolonged effect Effects 0.000 description 1
- 238000011002 quantification Methods 0.000 description 1
- 239000000376 reactant Substances 0.000 description 1
- 238000010223 real-time analysis Methods 0.000 description 1
- 230000009467 reduction Effects 0.000 description 1
- 238000006722 reduction reaction Methods 0.000 description 1
- 238000006268 reductive amination reaction Methods 0.000 description 1
- 230000004044 response Effects 0.000 description 1
- 230000002441 reversible effect Effects 0.000 description 1
- 238000012552 review Methods 0.000 description 1
- 238000001878 scanning electron micrograph Methods 0.000 description 1
- 150000003333 secondary alcohols Chemical class 0.000 description 1
- 239000004065 semiconductor Substances 0.000 description 1
- 238000004904 shortening Methods 0.000 description 1
- 229910052710 silicon Inorganic materials 0.000 description 1
- 235000012239 silicon dioxide Nutrition 0.000 description 1
- 229910052709 silver Inorganic materials 0.000 description 1
- 239000004332 silver Substances 0.000 description 1
- 238000004513 sizing Methods 0.000 description 1
- 150000003384 small molecules Chemical class 0.000 description 1
- 238000000527 sonication Methods 0.000 description 1
- 238000001179 sorption measurement Methods 0.000 description 1
- 230000003595 spectral effect Effects 0.000 description 1
- 239000012798 spherical particle Substances 0.000 description 1
- 239000003381 stabilizer Substances 0.000 description 1
- 238000010186 staining Methods 0.000 description 1
- 239000007858 starting material Substances 0.000 description 1
- 230000035882 stress Effects 0.000 description 1
- QAOWNCQODCNURD-UHFFFAOYSA-L sulfate group Chemical group S(=O)(=O)([O-])[O-] QAOWNCQODCNURD-UHFFFAOYSA-L 0.000 description 1
- 239000000725 suspension Substances 0.000 description 1
- 238000010558 suspension polymerization method Methods 0.000 description 1
- 230000002459 sustained effect Effects 0.000 description 1
- 239000000454 talc Substances 0.000 description 1
- 229910052623 talc Inorganic materials 0.000 description 1
- GZCRRIHWUXGPOV-UHFFFAOYSA-N terbium atom Chemical compound [Tb] GZCRRIHWUXGPOV-UHFFFAOYSA-N 0.000 description 1
- HKCRVXUAKWXBLE-UHFFFAOYSA-N terbium(3+) Chemical group [Tb+3] HKCRVXUAKWXBLE-UHFFFAOYSA-N 0.000 description 1
- 238000010998 test method Methods 0.000 description 1
- 230000001225 therapeutic effect Effects 0.000 description 1
- 239000010409 thin film Substances 0.000 description 1
- 230000026683 transduction Effects 0.000 description 1
- 238000010361 transduction Methods 0.000 description 1
- 238000012546 transfer Methods 0.000 description 1
- RYFMWSXOAZQYPI-UHFFFAOYSA-K trisodium phosphate Chemical compound [Na+].[Na+].[Na+].[O-]P([O-])([O-])=O RYFMWSXOAZQYPI-UHFFFAOYSA-K 0.000 description 1
- 229910000406 trisodium phosphate Inorganic materials 0.000 description 1
- 238000012795 verification Methods 0.000 description 1
- 229940118696 vibrio cholerae Drugs 0.000 description 1
- 230000000007 visual effect Effects 0.000 description 1
- 239000011534 wash buffer Substances 0.000 description 1
Images


Classifications
-
- G—PHYSICS
- G01—MEASURING; TESTING
- G01N—INVESTIGATING OR ANALYSING MATERIALS BY DETERMINING THEIR CHEMICAL OR PHYSICAL PROPERTIES
- G01N1/00—Sampling; Preparing specimens for investigation
- G01N1/28—Preparing specimens for investigation including physical details of (bio-)chemical methods covered elsewhere, e.g. G01N33/50, C12Q
- G01N1/40—Concentrating samples
- G01N1/4077—Concentrating samples by other techniques involving separation of suspended solids
-
- C—CHEMISTRY; METALLURGY
- C12—BIOCHEMISTRY; BEER; SPIRITS; WINE; VINEGAR; MICROBIOLOGY; ENZYMOLOGY; MUTATION OR GENETIC ENGINEERING
- C12Q—MEASURING OR TESTING PROCESSES INVOLVING ENZYMES, NUCLEIC ACIDS OR MICROORGANISMS; COMPOSITIONS OR TEST PAPERS THEREFOR; PROCESSES OF PREPARING SUCH COMPOSITIONS; CONDITION-RESPONSIVE CONTROL IN MICROBIOLOGICAL OR ENZYMOLOGICAL PROCESSES
- C12Q1/00—Measuring or testing processes involving enzymes, nucleic acids or microorganisms; Compositions therefor; Processes of preparing such compositions
- C12Q1/02—Measuring or testing processes involving enzymes, nucleic acids or microorganisms; Compositions therefor; Processes of preparing such compositions involving viable microorganisms
- C12Q1/04—Determining presence or kind of microorganism; Use of selective media for testing antibiotics or bacteriocides; Compositions containing a chemical indicator therefor
-
- C—CHEMISTRY; METALLURGY
- C12—BIOCHEMISTRY; BEER; SPIRITS; WINE; VINEGAR; MICROBIOLOGY; ENZYMOLOGY; MUTATION OR GENETIC ENGINEERING
- C12Q—MEASURING OR TESTING PROCESSES INVOLVING ENZYMES, NUCLEIC ACIDS OR MICROORGANISMS; COMPOSITIONS OR TEST PAPERS THEREFOR; PROCESSES OF PREPARING SUCH COMPOSITIONS; CONDITION-RESPONSIVE CONTROL IN MICROBIOLOGICAL OR ENZYMOLOGICAL PROCESSES
- C12Q1/00—Measuring or testing processes involving enzymes, nucleic acids or microorganisms; Compositions therefor; Processes of preparing such compositions
- C12Q1/02—Measuring or testing processes involving enzymes, nucleic acids or microorganisms; Compositions therefor; Processes of preparing such compositions involving viable microorganisms
- C12Q1/22—Testing for sterility conditions
-
- C—CHEMISTRY; METALLURGY
- C12—BIOCHEMISTRY; BEER; SPIRITS; WINE; VINEGAR; MICROBIOLOGY; ENZYMOLOGY; MUTATION OR GENETIC ENGINEERING
- C12Q—MEASURING OR TESTING PROCESSES INVOLVING ENZYMES, NUCLEIC ACIDS OR MICROORGANISMS; COMPOSITIONS OR TEST PAPERS THEREFOR; PROCESSES OF PREPARING SUCH COMPOSITIONS; CONDITION-RESPONSIVE CONTROL IN MICROBIOLOGICAL OR ENZYMOLOGICAL PROCESSES
- C12Q1/00—Measuring or testing processes involving enzymes, nucleic acids or microorganisms; Compositions therefor; Processes of preparing such compositions
- C12Q1/02—Measuring or testing processes involving enzymes, nucleic acids or microorganisms; Compositions therefor; Processes of preparing such compositions involving viable microorganisms
- C12Q1/24—Methods of sampling, or inoculating or spreading a sample; Methods of physically isolating an intact microorganisms
-
- G—PHYSICS
- G01—MEASURING; TESTING
- G01N—INVESTIGATING OR ANALYSING MATERIALS BY DETERMINING THEIR CHEMICAL OR PHYSICAL PROPERTIES
- G01N15/00—Investigating characteristics of particles; Investigating permeability, pore-volume, or surface-area of porous materials
- G01N15/02—Investigating particle size or size distribution
- G01N15/0205—Investigating particle size or size distribution by optical means, e.g. by light scattering, diffraction, holography or imaging
- G01N15/0227—Investigating particle size or size distribution by optical means, e.g. by light scattering, diffraction, holography or imaging using imaging, e.g. a projected image of suspension; using holography
-
- G—PHYSICS
- G01—MEASURING; TESTING
- G01N—INVESTIGATING OR ANALYSING MATERIALS BY DETERMINING THEIR CHEMICAL OR PHYSICAL PROPERTIES
- G01N33/00—Investigating or analysing materials by specific methods not covered by groups G01N1/00 - G01N31/00
- G01N33/48—Biological material, e.g. blood, urine; Haemocytometers
- G01N33/50—Chemical analysis of biological material, e.g. blood, urine; Testing involving biospecific ligand binding methods; Immunological testing
- G01N33/53—Immunoassay; Biospecific binding assay; Materials therefor
- G01N33/569—Immunoassay; Biospecific binding assay; Materials therefor for microorganisms, e.g. protozoa, bacteria, viruses
- G01N33/56911—Bacteria
-
- G—PHYSICS
- G01—MEASURING; TESTING
- G01N—INVESTIGATING OR ANALYSING MATERIALS BY DETERMINING THEIR CHEMICAL OR PHYSICAL PROPERTIES
- G01N1/00—Sampling; Preparing specimens for investigation
- G01N1/28—Preparing specimens for investigation including physical details of (bio-)chemical methods covered elsewhere, e.g. G01N33/50, C12Q
- G01N1/40—Concentrating samples
- G01N1/405—Concentrating samples by adsorption or absorption
-
- G—PHYSICS
- G01—MEASURING; TESTING
- G01N—INVESTIGATING OR ANALYSING MATERIALS BY DETERMINING THEIR CHEMICAL OR PHYSICAL PROPERTIES
- G01N15/00—Investigating characteristics of particles; Investigating permeability, pore-volume, or surface-area of porous materials
- G01N15/02—Investigating particle size or size distribution
- G01N15/0272—Investigating particle size or size distribution with screening; with classification by filtering
-
- G01N2015/019—
Definitions
- the present invention relates to a method and device for the detection of analytes in a fluid. More particularly, the invention relates to the development of a sensor array system capable of discriminating mixtures of analytes, toxins, and/or bacteria in medical, food/beverage, and environmental solutions.
- the taste chip array includes a sensor that has a plurality of chemically sensitive beads, formed in an ordered array, capable of simultaneously detecting many different kinds of analytes rapidly.
- An aspect of the system is that the array may be formed using a microfabrication process, thus allowing the system to be manufactured in an inexpensive manner.
- microbes particularly pathogens such as E. Coli O157:H7, B. anthracis/B. globigii, and Cryptosporidium, that may be used in chemical and biological attacks.
- pathogens such as E. Coli O157:H7, B. anthracis/B. globigii, and Cryptosporidium
- Typical methods of detection used for years by microbiologists, require the growth of single bacteria into bacterial colonies in different types of media, followed by a timely identification process involving morphological and biochemical tests.
- the classification of microorganisms through conventional microbiologal counting and enumeration methods involves the use of nucleic acid stains or cocktails of stains, which are capable of differentiating between gram-positive and gram negative bacteria, and between dead or living organisms.
- nucleic acid stains or cocktails of stains which are capable of differentiating between gram-positive and gram negative bacteria, and between dead or living organisms.
- these procedures suffer from poor specificity and are not easily adapted to online rapid analysis. This series of steps, although often providing very accurate results repose on the expertise of highly trained personnel, and require lengthy and complicated analysis.
- Such techniques include polymerase chain reaction (PCR), electrochemical transduction, optical and microarray detection, flow-through immunofiltration, acoustic sensors, and flow cytometry.
- PCR polymerase chain reaction
- electrochemical transduction optical and microarray detection
- flow-through immunofiltration flow-through immunofiltration
- acoustic sensors flow cytometry
- the system may be used for either liquid or gaseous fluids.
- the system in some embodiments, may generate patterns that are diagnostic for both individual analytes and mixtures of analytes.
- the system in some embodiments, includes a plurality of chemically sensitive particles, formed in an ordered array, capable of simultaneously detecting many different kinds of analytes rapidly.
- a sensor array may contain one or more beads that contain macropores. Microbes such as bacteria, spores, and protozoa in a fluid may be captured in the macropores of the bead.
- receptors including, but not limited to, antibodies or semi-selective ligands such as lectins, may be coupled to a particle in an internal pore region of the bead to create a selective bead.
- a visualization antibody may be introduced that may couple with the captured analyte to yield a colorimetric or fluorescence signature that can be recorded by the CCD detector.
- a series of selective and semi-selective beads may be used in conjunction with the sensor array system described herein.
- a method for detecting microbes may include a multi-stage process wherein a fluid first undergoes a rapid screening and then, if warranted by the results of the screening stage, more specific and/or confirmatory testing.
- a sensor array including a macroporous bead may be used to conduct the specific and/or confirmatory testing.
- a method for preparing a macroporous bead may include adding a dispersion of a hydrophilic emulsifier to an aqueous solution of a polymeric resin to form an oil-in-water emulsion, adding a solution of a hydrophobic emulsifier to the oil-in-water emulsion to form a water-in-oil emulsion; then cooling the water-in-oil emulsion to form a polymeric matrix in which a plurality of oil droplets are dispersed.
- the oil droplets may be washed out of the pores of the polymeric matrix to form a macroporous bead.
- the system may be used for either liquid or gaseous fluids.
- the system in some embodiments, may generate patterns that are diagnostic for both the individual analytes and mixtures of the analytes.
- the system in some embodiments, is made of a plurality of chemically sensitive particles, formed in an ordered array, capable of simultaneously detecting many different kinds of analytes rapidly.
- An aspect of the system is that the array may be formed using a microfabrication process, thus allowing the system to be manufactured in an inexpensive manner.
- the system in some embodiments, includes a light source, a sensor array, and a detector.
- the sensor array in some embodiments, is formed of a supporting member which is configured to hold a variety of chemically sensitive particles (herein referred to as "particles") in an ordered array.
- the particles are, in some embodiments, elements which will create a detectable signal in the presence of an analyte.
- the particles may produce optical (e.g., absorbance or reflectance) or fluorescence/phosphorescent signals upon exposure to an analyte.
- particles include, but are not limited to functionalized polymeric beads, agarous beads, dextrose beads, polyacrylamide beads, control pore glass beads, metal oxides particles (e.g., silicon dioxide (SiO 2 ) or aluminum oxides (Al 2 O 3 )), polymer thin films, metal quantum particles (e.g., silver, gold, platinum, etc.), and semiconductor quantum particles (e.g., Si, Ge, GaAs, etc.).
- a detector e.g., a charge-coupled device "CCD" may be positioned below the sensor array to allow for the data acquisition. In another embodiment, the detector may be positioned above the sensor array to allow for data acquisition from reflectance of the light off of the particles.
- CCD charge-coupled device
- Light originating from the light source may pass through the sensor array and out through the bottom side of the sensor array.
- Light modulated by the particles may pass through the sensor array and onto the proximally spaced detector. Evaluation of the optical changes may be completed by visual inspection or by use of a CCD detector by itself or in combination with an optical microscope.
- a microprocessor may be coupled to the CCD detector or the microscope.
- a fluid delivery system may be coupled to the supporting member of the sensor array. The fluid delivery system, in some embodiments, is configured to introduce samples into and out of the sensor array.
- the sensor array system includes an array of particles.
- the particles may include a receptor molecule coupled to a polymeric bead.
- the receptors in some embodiments, are chosen for interacting with analytes. This interaction may take the form of a binding/association of the receptors with the analytes.
- the supporting member may be made of any material capable of supporting the particles, while allowing the passage of the appropriate wavelengths of light.
- the supporting member may include a plurality of cavities. The cavities may be formed such that at least one particle is substantially contained within the cavity.
- the sensor array may include a cover layer. A cover layer may be positioned at a distance above the surface of the sensor array, such that a channel is formed between the sensor array surface and the cover layer.
- the cover layer may be placed at a distance such that the cover layer inhibits dislodgement of the particles from the cavities in the sensor array, while allow fluid to enter the cavities through the channel formed between the sensor array and the cover layer.
- the cavities may be configured to allow fluid to pass through the cavity during use, while the cavity is configured to retain the particle in the cavity as the fluid passes through the cavity.
- the optical detector may be integrated within the bottom of the supporting member, rather than using a separate detecting device.
- the optical detectors may be coupled to a microprocessor to allow evaluation of fluids without the use of separate detecting components.
- a fluid delivery system may also be incorporated into the supporting member. Integration of detectors and a fluid delivery system into the supporting member may allow the formation of a compact and portable analyte sensing system.
- a high sensitivity CCD array may be used to measure changes in optical characteristics which occur upon binding of the biological/chemical agents.
- the CCD arrays may be interfaced with filters, light sources, fluid delivery and micromachined particle receptacles, so as to create a functional sensor array. Data acquisition and handling may be performed with existing CCD technology.
- CCD detectors may be configured to measure white light, ultraviolet light or fluorescence. Other detectors such as photomultiplier tubes, charge induction devices, photo diodes, photodiode arrays, and microchannel members may also be used.
- a particle in some embodiments, possess both the ability to bind the analyte of interest and to create a modulated signal.
- the particle may include receptor molecules which posses the ability to bind the analyte of interest and to create a modulated signal.
- the particle may include receptor molecules and indicators.
- the receptor molecule may posses the ability to bind to an analyte of interest. Upon binding the analyte of interest, the receptor molecule may cause the indicator molecule to produce the modulated signal.
- the receptor molecules may be naturally occurring or synthetic receptors formed by rational design or combinatorial methods. Some examples of natural receptors include, but are not limited to, DNA, RNA, proteins, enzymes, oligopeptides, antigens, and antibodies. Either natural or synthetic receptors may be chosen for their ability to bind to the analyte molecules in a specific manner.
- a naturally occurring or synthetic receptor is bound to a polymeric bead in order to create the particle.
- the particle in some embodiments, is capable of both binding the analyte(s) of interest and creating a detectable signal. In some embodiments, the particle will create an optical signal when bound to an analyte of interest.
- the synthetic receptors may come from a variety of classes including, but not limited to, polynucleotides (e.g., aptamers), peptides (e.g., enzymes and antibodies), synthetic receptors, polymeric unnatural biopolymers (e.g., polythioureas, polyguanidiniums), and imprinted polymers.
- Polynucleotides are relatively small fragments of DNA which may be derived by sequentially building the DNA sequence.
- Peptides include natural peptides such as antibodies or enzymes or may be synthesized from amino acids.
- Unnatural biopolymers are chemical structure which are based on natural biopolymers, but which are built from unnatural linking units.
- polythioureas and polyguanidiniums have a structure similar to peptides, but may be synthesized from diamines (i.e., compounds which include at least two amine functional groups) rather than amino acids.
- Synthetic receptors are designed organic or inorganic structures capable of binding various analytes.
- a large number of chemical/biological agents of interest to the military and civilian communities may be sensed readily by the described array sensors.
- Bacteria may also be detected using a similar system.
- the cell surface of one bacteria may be differentiated from other bacteria, or genomic material may be detected using oligonucleic receptors.
- One method of accomplishing this differentiation is to target cell surface oligosaccharides (i.e., sugar residues).
- the use of synthetic receptors which are specific for oligosaccharides may be used to determine the presence of specific bacteria by analyzing for cell surface oligosaccharides.
- a receptor may be coupled to a polymeric resin.
- the receptor may undergo a chemical reaction in the presence of an analyte such that a signal is produced.
- Indicators may be coupled to the receptor or the polymeric bead.
- the chemical reaction of the analyte with the receptor may cause a change in the local microenvironment of the indicator to alter the spectroscopic properties of the indicator.
- This signal may be produced using a variety of signalling protocols. Such protocols may include absorbance, fluorescence resonance energy transfer, and/or fluorescence quenching.
- Receptor-analyte combination may include, but are not limited to, peptides-proteases, polynucleotides-nucleases, and oligosaccharides- oligosaccharide cleaving agents.
- a receptor and an indicator may be coupled to a polymeric resin.
- the receptor may undergo a conformational change in the presence of an analyte such that a change in the local microenvironment of the indicator occurs. This change may alter the spectroscopic properties of the indicator.
- the interaction of the receptor with the indicator may be produce a variety of different signals depending on the signalling protocol used. Such protocols may include absorbance, fluorescence resonance energy transfer, and/or fluorescence quenching.
- the sensor array system includes an array of particles.
- the particles may include a receptor molecule coupled to a polymeric bead.
- the receptors in some embodiments, are chosen for interacting with analytes. This interaction may take the form of a binding/association of the receptors with the analytes.
- the supporting member may be made of any material capable of supporting the particles, while allowing the passage of the appropriate wavelengths of light.
- the supporting member may include a plurality of cavities. The cavities may be formed such that at least one particle is substantially contained within the cavity.
- a vacuum may be coupled to the cavities. The vacuum may be applied to the entire sensor array. Alternatively, a vacuum apparatus may be coupled to the cavities to provide a vacuum to the cavities.
- a vacuum apparatus is any device capable of creating a pressure differential to cause fluid movement.
- the vacuum apparatus may apply a pulling force to any fluids within the cavity.
- the vacuum apparatus may pull the fluid through the cavity.
- Examples of vacuum apparatuss include pre-sealed vacuum chamber, vacuum pumps, vacuum lines, or aspirator-type pumps.
- a membrane based flow sensor was prepared which is configured to accommodate the capture of microbes with a filter placed within the fluidics device. Microbes, whose size is larger than the pores of the filter, are captured in the flow cell assembly. The captured microbes may be analyzed directly or may be treated with visualization compounds.
- microbes may be captured and analyzed using a membrane based flow sensor as described herein.
- “microbe” refers to any microorganism, including but not limited to, a bacteria, spore, protozoan, yeast, virus, and algae. Some microbes that are of particular interested for detection include a variety of toxic bacteria. Examples of bacteria that may be detected using a membrane based flow sensor include, but are not limited to Escherichia coli O157:H7, Cryptosporidium, Vibrio cholerae, Shigella, Legionnella, Lysteria, Bacillus globigii , and Bacillus anthracis (anthrax). Viruses may also be detected using a membrane, including the HIV virus.
- FIG. 1 Shown in FIG. 1 is an exploded view of a membrane based flow sensor 100.
- Flow sensor 100 includes a membrane 110 that is sandwiched between at least two members 140 and 150.
- Members 140 and 150 are configured to allow fluid to flow to and through membrane 110.
- Members 140 and 150 are also configured to allow detection of analytes, after the analytes have been captured on membrane 110.
- a variety of different materials may be used for membrane 110, including, but not limited to, Nuclepore ® track-etched membranes, nitrocellulose, nylon, and cellulose acetate.
- the material used for membrane 110 should have resistance to non-specific binding of antibodies and stains used during the visualization and detection processes.
- membrane 110 is composed of a material that is inert to a variety of reagents, buffers, and solvents.
- Membrane 110 may include a plurality of sub-micron pores that are fairly evenly distributed. The use of membranes having an even distribution of pores allows better control of fluid flow and control of the isolation of analytes.
- Members 140 and 150 are composed of a material that is substantially transparent to wavelengths of light that are used to perform the analyte detection.
- member 140 should be composed of a material that is substantially transparent to ultraviolet light.
- Member 140 may be composed of any suitable material meeting the criteria of the detection method.
- a transparent material that may be used to form member 140 includes, but is not limited to, glass, quartz glass, and polymers such as acrylate polymers (e.g., polymethylmethacrylate).
- both top member 140 and bottom member 150 are composed of transparent materials. The use of transparent materials for the top member and the bottom member allow detection to be performed through the membrane based flow sensor.
- membrane 110 is sandwiched between top member 140 and bottom member 150.
- Bottom member 150 and/or top member 140 may include indentations configured to hold a membrane.
- bottom member 150 includes an indentation 152 that is configured to receive membrane 110, along with any other accompanying pieces that are used to support or seal membrane 110. Indentations or cavities may be etched into top member 140 and/or bottom member 150 using standard etching techniques.
- bottom member 150 includes a first indentation 152, which is configured to receive a membrane support 130.
- Bottom member also includes a second indentation 154.
- Second indentation is configured such that membrane support 130 is inhibited from entering the second indentation.
- Second indentation may include a ridge disposed near the membrane support 130 such that membrane support 130 rests upon the ridge.
- second indentation may be to may have a size that is smaller than the size of membrane support 130. In either case, when assembled, membrane support 130 is inhibited from entering second indentation 154, thus creating a cavity under membrane support 130.
- Cavity 154 may be used to collect fluids that pass through the membrane support 130 prior to exiting the system.
- Membrane support 130 is configured to provide support to membrane 110 during use.
- Membrane support 130 may be formed from a porous material that allows fluid to pass through the membrane support.
- the pores of membrane support 130 should have a size that allows fluid to pass through membrane support 130 at a speed that is equal to or greater than the speed that fluid passes through membrane 110.
- pores of membrane support 130 are larger than pores in membrane 110. The pores, however, cannot be too large.
- One function of membrane support 130 is to provide support to membrane 110. Therefore, pores in membrane support 130 should be sufficiently small enough to inhibit sagging of membrane 110 during use.
- Membrane support 130 may be formed of a variety of materials including, but not limited to, polymeric materials, metals, and glass.
- a polymeric material e.g., celcon acrylic
- membrane support 130 helps to keep the membrane planar during use. Keeping the membrane planar simplifies detection of the analytes by allowing the capture and detection of the analytes on a single focal plane.
- Membrane 110 may rest upon membrane support 130 when the membrane based flow sensor 100 is assembled.
- a gasket 120 may be positioned on top of membrane 110.
- a gasket may be used to provide a fluid resistant seal between members 130 and 140 and membrane 110. Gasket may inhibit the leakage of fluid from the system during use.
- Top member 140 may include a fluid inlet 160. Fluids for analysis may be introduced into device 100 via fluid inlet 160. Fluid inlet 160 may pass through a portion of top member 140. In some embodiments, a channel 162 may be formed in top member 140 such that tubing 164 may be inserted into channel 162. Channel 162 may turn near the center of the top member to deliver the fluids to an upper surface of membrane 110.
- Bottom member 150 may include a fluid outlet 170. Fluids that are introduced into the device 100 via fluid inlet 160 pass through top member 140 and through membrane 110. The fluids are then collected in cavity 154. A fluid outlet 170 may pass through a portion of bottom member 150. In some embodiments, a channel 172 may be formed in bottom member 150 such that tubing 174 may be inserted into channel 172. Channel 172 may be positioned to receive fluids that are collected in cavity 154 during use.
- a washing fluid outlet 180 may be formed in top member 140.
- Washing fluid outlet 180 is configured to receive fluids that pass through or over membrane 110 during a washing operation. Washing fluid outlet 180 may pass through a portion of top member 140.
- a channel 182 may be formed in top member 140 such that tubing 184 may be inserted into channel 182. Channel 182 may be positioned to receive fluids that are used to wash membrane 110 during use.
- Membrane 110 is selected from a material capable of filtering the analytes of interest from a fluid stream.
- the filter should be capable of removing microbes from a fluid stream.
- a suitable membrane may include a plurality of pores that have a size significantly less than the size of the analyte of interest.
- the membrane may be configured to capture microbes that have a diameter of greater than about 1 ⁇ m.
- Membranes may be formed from a variety of materials known in the art.
- membrane 110 may be a track-etched Nuclepore TM polycarbonate membrane.
- a Nuclepore membrane is available from Whatman plc.
- Membrane 110 may be about 5-10 microns in thickness.
- Membrane 110 includes a plurality of pores. Pores may range from about 0.2 ⁇ m in diameter up to about 12 ⁇ m in diameter to capture potentially dangerous microbes.
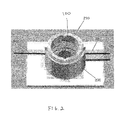
- Fig. 2 depicts an embodiment of a membrane based flow sensor disposed in housing 200.
- Top member 140, gasket 120, membrane 110, membrane support 130, and bottom member 150 may be assembled and placed inside housing 200.
- Housing 200 may encompass membrane based fluid sensor.
- a cap 210 may be used to retain membrane based fluid sensor within housing 200. Cap 210 may include a window to allow viewing of membrane 110.
- fluid inlet 160, fluid outlet 170 and washing fluid outlet 180 extend from housing 200 to allow easy access to the membrane based fluid sensor 100.
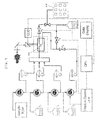
- FIG. 3 A schematic of a complete membrane based analysis system is shown in FIG. 3 .
- Analysis system includes a plurality of pumps (p 1 , p 2 , p 3 and p 4 ). Pumps are configured to deliver samples (p 1 ), visualization reagents (p 2 and p 3 ) and membrane washing fluids (p 4 ) to the membrane based fluid sensor 100 during use. Reagents, washing fluids, and visualization agents are passed through pre-filters (f 1 , f 2 , f 3 , and f 4 ) before the fluids are sent to membrane based fluid sensor 100. Pre-filters are used to screen out large particulate matter that may clog membrane 110.
- each pre-filter may be optimized in order to satisfy efficient capture of large dust particles or particulate matter aggregates while resisting clogging.
- Pre-filter f1 is configured to filter samples before the samples reach the membrane based fluid sensor 100.
- Pre-filter f1 is configured to allow the analyte of interest to pass through while inhibiting some of the particles that are not related to the analyte of interest. For example, spores, whose size is smaller than the pores of the pre-filter f 1 , are passed through the pre-filter and captured in the membrane based fluid sensor 100.
- fluids are passed through a manifold.
- membrane based fluid sensor 100 includes a single input line. The manifold couples the different fluid lines to the single input line of the membrane based fluid sensor 100.
- a detector 250 is used to determine if any analytes have been captured by the membrane based fluid sensor 100.
- a detector may be placed over a portion of membrane based fluid sensor 100 such that the detector may capture an image of the membrane.
- detector may be placed such that images of the membrane may be taken through a window in the membrane based fluid sensor 100.
- Detector 250 may be used to acquire an image of the particulate matter captured on membrane 110. Image acquisition may include generating a "digital map" of the image.
- detector 250 may include a high sensitivity CCD array.
- the CCD arrays may be interfaced with filters, light sources, fluid delivery, so as to create a functional sensor array.
- Data acquisition and handling may be performed with existing CCD technology.
- the light is broken down into three-color components, red, green and blue.
- Evaluation of the optical changes may be completed by visual inspection (e.g., with a microscope) or by use of a microprocessor ("CPU") coupled to the detector.
- a filter may be placed between detector 250 and membrane 110 to remove the excitation wavelength.
- the microprocessor may also be used to control pumps and valves as depicted in FIG. 3 .
- the analyte detection system may be operated in different modes based on which valves are opened and closed.
- a configuration of a system in a "flow through” mode is depicted in FIG. 3 .
- fluid is passed from the manifold to the membrane based fluid sensor 100 to allow capture of analytes or the addition of development agents.
- Fluids for analysis may be introduced into membrane based fluid sensor 100 via fluid inlet 160.
- valve V 1 is placed in a closed position to inhibit the flow of fluid through wash fluid outlet 180.
- the fluids may, therefore, be forced to pass through membrane based fluid sensor 100 exit the sensor via fluid outlet 170.
- Valve V 2 is placed in an open position to allow the flow of fluid to the waste receptacle.
- Valve V 3 is placed in a closed position to inhibit the flow of fluid into the wash fluid supply line.
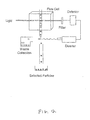
- the analyte detection system may also be operated in a "lateral membrane wash” mode, as depicted in FIG. 4 .
- the membrane is cleared by the passage of a fluid across the collection surface of the membrane. This allows the membrane to be reused for subsequent testing.
- Fluids for washing the membrane may be introduced into sensor 100 via fluid inlet 160.
- outlet valves V 2 and V 3 are placed in a closed position to inhibit the flow of fluid through fluid outlet 170.
- the closure of outlet valves V 2 and V 3 also inhibits the flow of fluid through the membrane of sensor 100.
- the fluids entering sensor 100 may, therefore, be forced to exit sensor 100 through washing fluid outlet 180.
- Valve V 2 is placed in an open position to allow the flow of fluid through washing fluid outlet 180 and into the waster receptacle. Since fluid is inhibited from flowing through the membrane, any analytes and other particles collected by the membrane may be "washed" from the membrane to allow further use.
- the analyte detection system may also be operated in a "backwash" mode, as depicted in FIG. 5 .
- fluid outlet 170 is used to introduce a fluid into the analyte detection system
- wash fluid outlet 180 is used to allow the fluid to exit the device. This "reverse" flow of fluid through the cell allows the membrane to be cleared.
- valves may be configured as depicted FIG. 5 , with the washing fluid being introduced through fluid outlet 170. Specifically, valves V1 and V3 are open, while valve V2 is closed.
- Either a lateral membrane wash or a back flush treatment may be used to clear analytes and other particles from a membrane. Both methods of clearing the membrane surface may be enhanced by the use of ultrasound or mechanical agitation.
- analytes in the fluid sample are trapped by the membrane since the analytes are bigger than the openings in the membrane. The analytes tend to be randomly distributed across the membrane after use. Analytes that occupy positions on the membrane that are between the positions of pores may be harder to remove them analytes that are position on or proximate to a pore in the membrane. Analytes that occupy positions on the membrane that is between the positions of pores may be more difficult to remove, since the force of the backwash fluid may not contact the analytes.
- removal of trapped analytes may be enhanced by the use of ultrasound of mechanical agitation. Both methods cause the analytes to move across the membrane surface, increasing the chances that the analyte will encounter a column of washing fluid passing through one of the pores.
- Analyte detection system may be used to determine the presence of analytes in a fluid system.
- a process for determining analytes in a fluid sample is depicted in the flow chart of FIG. 7 .
- a background sample may be collected and analyzed.
- Solid analytes are typically collected and stored in a liquid fluid.
- the liquid fluid that is used to prepare the samples may be analyzed to determine if any analytes are present in the fluid.
- a sample of the liquid fluid used to collect the solid analytes is introduced into an analyte detection device to determine the background "noise" contributed by the fluid.
- any particles collected by the membrane during the background collection are viewed to determine the level of particulate matter in the liquid fluid.
- particles collected by the membrane during the collection stage may be treated with a visualization agent to determine if any analytes are present in the liquid fluid.
- the information collected from the background check may be used during the analysis of collected samples to reduce false positive indications.
- the membrane may be cleared using either a back flush wash or a lateral wash, as described herein.
- the system may be used to analyze samples for solid analytes (e.g., microbes).
- microbes refers to a variety of living organisms including bacteria, spores, viruses, and protozoa.
- the porous membrane traps any particles that have a size that is greater than the size of the pores in the porous membrane. Collection of particles may be continued for a predetermined time, or until all of the collected sample has been passed through the membrane.
- the particles collected by the membrane may be analyzed using a detector.
- the detector may be a camera that will capture an image of the membrane.
- a detector may be a CCD camera.
- Analysis of the particles captured by the membrane may be performed by analyzing the size and/or shape of the particles. By camparing the size and/or shape of the particles captured by the membrane to the size and shape of known particles the presence of a predetermined analyte may be indicated.
- microbe analytes will react to a variety of visualization agents (e.g., colored and fluorescent dyes).
- the detection of microbe analytes may be aided by the staining of the microbe with a visualization agent.
- the visualization agent will induce a known color change or impart fluarescence to a microbe.
- particles captured by the membrane are stained and the particles analyzed using an appropriate detector.
- the presence of particles that have the appropriate color and/or fluorescence may indicate the presence of the analyte being tested for.
- non-microbe particles e.g., dust
- the visualization agent may include a "cocktail" mixture of semi-specific dyes, which may be designed to mark microbes of interest.
- Selection of the mixture may be based on the capacity of the dye chromophore to create an optical fingerprint that can be recognized by a detector and associated imaging software as being associated with specific pathogenic bacteria or spores, while at the same time distinguishing from the signal exhibited by dust and other background particulate matter.
- the analysis of the particles may indicate that an analyte of interest is present in the sample.
- the particles may be flushed from the membrane and sent out of the system for further testing. Further testing may include techniques such as cultures or ELISA techniques that may allow more accurate determination of the specific analytes present.
- the particles may be sent to a sensor array, as described herein, for further testing. If no significant amounts of analytes are found on the membrane, the membrane may be washed and other samples analyzed.
- user-defined threshold criteria may be established to indicate a probability that one or more specific microbes are present on the membrane.
- the criteria may be based on one or more of a variety of characteristics of the image.
- the criteria may be based on pixel or color fingerprints established in advance for specific microbes.
- the characteristics that may be used include, but are not limited to, the size, shape, or color of portions of matter on the image, the aggregate area represented by the matter, or the total fluorescent intensity of the matter.
- the system may implement an automated counting procedure developed for one or more pathogenic and non-pathogenic bacteria.
- the membrane system may include a computer system (not shown).
- Computer system may include one or more software applications executable to to process a digital map of the image generated using detector.
- a software application available on the computer system may be used to compare the test image to a pre-defined optical fingerprint.
- a software application available on computer system may be used to determine if a count exceeds a pre-defined threshold limit.
- a detector may be used to acquire an image of the analytes and other particulate matter captured on a membrane.
- Microbes may collect on a membrane along with dust and other particulate matter and be captured in an image produced from a detector.
- the image acquired by the detector may be analyzed based on a pre-established criteria.
- a positive result may indicate the presence of a microbe.
- the test criteria may be based on a variety of characteristics of the image, including, but not limited to, the size, shape, aspect ratio, or color of a portion or portions of the image. Applying test criteria may allow microbes to be distinguished from dust and other particulate matter.
- the flow of sample through from a fluid delivery system may be continued.
- a positive result may create a presumption that the fluid contains a particular analyte. If the image yields a positive result with respect to the test criteria, a sample of the fluid may be subjected to a confirmatory or specific testing. On the other hand, if the image yields a negative result with respect to the test criteria, membrane may be rinsed and the preceding method may be carried out for fluid from another sample.
- a sample may be introduced into the analyte detection device.
- a trigger parameter may be measured to determine when to introduce the visualization agent into the analyte detection device. Measurement of the trigger parameter may be continuous or may be initiated by a user. Alternatively, the stain may be introduced into the analyte detection device immediately after the sample is introduced.
- the trigger parameter may be the time elapsed since initiation of introducing the fluid into an analyte detection device at a controlled flow rate.
- the stain may be introduced 20 seconds after initiation of introducing the fluid sample into an analyte detection device at a flow rate of 1 milliliter per minute.
- the trigger parameter may be the pressure drop across the membrane. The pressure drop across the membrane may be determined using a pressure transducer located on either side of the membrane.
- the trigger parameter may be the autofluorescence of analytes captured by the membrane.
- a detector may be switched on until a pre-defined level of signal from the autofluorescence of the analytes has been reached.
- filtering software may be used to create a data map of the autofluorescence of the matter on the membrane that excludes any pixels that contain color in a blue or red spectral range. The data map may be used to compute a value for particles that are autofluorescent only in the "pure green" portion of the visible spectrum.
- a presumptive positive result may be inferred if the trigger parameter exceeds a certain value without applying a stain.
- a presumptive positive result may be inferred where the autofluorescence value is more than twice the value that would indicate application of a stain. In such a case, the application of a stain may be dispensed with and a confirmatory test may be conducted for the sample.
- a stain may be introduced into an analyte detection device.
- Collecting a sample of a fluid may include gathering a sample from a solid, liquid, or gas.
- the sample may be derived from collecting air from a target environment in an aerosol form, then converting aerosol into a hydrosol. For example, particles from 500 liters of an air sample may be collected deposited into about 0.5 milliliters of liquid.
- U.S. Patent No. 6,217,636 to McFarland entitled “TRANSPIRATED WALL AEROSOL COLLECTION SYSTEM AND METHOD,” which is incorporated herein by reference as if fully set forth herein, describes a system for collecting particulate matter from a gas flow into a liquid using a porous wall.
- a system as described above may be used to determine the presence of anthrax spores or bacteria. Collection of air samples in a potentially contaminated area may be concentrated in a fluid sample using an airsol collector. The fluid sample may be passed through a membrane based detector system as described herein. The membrane based detection system may collect any particle collected by the airsol collector. The particles collected may be treated with a visualization agent that includes stains that are specific for anthrax bacteria. Such visualization agents are know to one of ordinary skill in the art. The presence of particles that exhibit the appropriate color/fluorescence may indicate that anthrax is presence. The indication of anthrax may be further determined by additional confirmation testing.
- the flow cell assembly was created from a 3-piece stainless steel cell holder consisting of a base, a support and a screw-on cap.
- Two circular polymethylmethacrylate (PMMA) inserts house the nuclepore® membrane. These two PMMA inserts have been drilled along their edge and side to allow for passage of the fluid to and from the chip through stainless steel tubing (#304-H-19.5, Microgroup, Medway, MA).
- the tubes, which were fixed with epoxy glue in the drilled PMMA inserts had an outer diameter of 0.039" (19.5 gauge), and a 0.0255-0.0285" inner-diameter.
- the basic components of the flow cell are two disc-shaped PMMA "inserts”.
- the bottom PMMA insert is modified in order to feature a drain and to contain a plastic screen disc (Celcon acrylic) that acts as a support for the filter.
- a plastic screen disc (Celcon acrylic) that acts as a support for the filter.
- Each insert features a length of stainless steel tubing, which enters a hole in the side of the PMMA disk.
- the top insert also features an additional outlet which is used when regeneration of the filter is needed. Silicone tubing is snapped on the stainless steel tubing, and as such is readily compatible with a wide range of fluidic accessories (i.e., pumps, valves, etc.) and solvents.
- the flow cell was shown to be resistant to leaks and pressures generated by flow rates as high as 20 mL/min.
- the complete analysis system shown in FIGS. 3 , 4 , and 5 includes a fluidics system composed of four peristaltic pumps (p 1 , p 2 , p 3 , and p 4 ), dedicated to the delivery of the analyte collected from the air, antibody, wash buffer to the flow cell, and clean-up off the flow cell in the regeneration mode. Its integrated software was used to assure fluid delivery to the chip, and accommodate wash cycles through the proper use of valves.
- the sample, antibody, PBS, and regeneration lines are also filtered (pre-filters f 1 , f 2 , f 3 , and f 4 ) to screen out large particulate matter.
- Pre-filter f 1 is a nuclepare® filter with a pore size of 5 ⁇ m.
- Pre-filters f 2 , f 3 , f 4 are 0.4 ⁇ m nuclepore® filters. Spores which size is smaller than the pores of pre-filter f 1 are passed through the filter and captured in the analysis flow cell, positioned on the motorized stage of a modified compound BX2 Olympus microscope. The microscope is equipped with various objectives, optical filters, and a charged-coupled device (CCD) camera which operation can be automated.
- CCD charged-coupled device
- a Mercury lamp was used as the light source. Fluorescence images shown in this report were obtained with a FTTC filter cube (fluoroisothiocyanate, 480 nm excitation, 505 long pass beam splitter dichroic mirror, and 535 ⁇ 25 nm emission), and captured by a DVC 1312C (Digital Video Company, Austin, TX) charge-coupled device (CCD) mounted on the microscope and interfaced to Image Pro Plus 4.0 software (Media Cybernetics). Areas of interest of the images of the array for were selected in an automated fashion and used to extract numerical values of the red, green, and blue (RGB) pixel intensities.
- FTTC filter cube fluoroisothiocyanate, 480 nm excitation, 505 long pass beam splitter dichroic mirror, and 535 ⁇ 25 nm emission
- DVC 1312C Digital Video Company, Austin, TX
- CCD charge-coupled device
- Phosphate buffer saline pH 7.4, was purchased from Pierce(# 28374, 0.008M Na 3 PO 4 , 0.14M NaCl, 0.01M KCl).
- the content of the pre-weighted pack was dissolved in 500 mL dI water. After complete dissolution, the buffer solution was filtered using a 60 mL disposable syringe (Becton Dickinson #309654) and a 0.2 mm pore size syringe filter (Whatman 25 mm, 0.2mm Polyethersulfone (PES) filters #6896-2502).
- Tween-20 Polyoxyethylene-Sorbitan Monolaurate (Tween-20) and Bovine Serum Albumine (BSA) were purchased from Sigma (# P-1379, and # A-0281).
- the anti- bg antibody was generously given to us by Tetracore, and tagged with a fluorophore.
- the naked Antibody was labeled according to the protocol described in the Alexa Fluor® 488 Protein labeling kit from Molecular Probes (# A-10235), and stored at 4°C. The fiinal concentration of the labeled anti- bg was 0.5 mg/mL.
- the antibody When prepared for the assay the antibody was diluted 50 times in a filtered (3 mL Disposable Syringes from Becton Dickinson # 309574; Syringe Filters from Pall Gelman 13mm, 0.2 ⁇ m Acrodisc CR Polytetrafluoroethylene PTFE # 4423) solution of 1% BSA/PBS (0.01g of BSA per mL of PBS).
- the spore preparations were given to us by Edgewood / Dugway Proving Grounds. For their evaluation, the spores were memberd onto Petri dishes and grown with Luria Bertani plating medium .
- the medium is composed of Bacto Tryptone, Bacto Yeast Extract, Agar Technical purchased from Difco (# 211705, # 212750, # 281230 respectively), and NaCl purchased from EM (# SX0420-1). Distilled Water, de-ionized with a Barnstead Nanopure Column was autoclaved for 30min. at 121°C to sterilize it.
- the fluorescent polymer green microspheres were purchased from Duke Scientific Corporation (Palo Alto, CA).
- a bead stock solution was prepared by diluting several drops of the original bead solution in 500 mL of dI water.
- a bright line counting chamber, or hemacytometer was used to determine the exact concentration of this solution.
- the concentration of a solution is typically obtained from the average of several measurements following a well established protocol.
- the concentration of our stock solution was found to be 1,883,750 beads/mL ⁇ 8539 or a relative standard deviation of 0.45 %.
- a 1 mg/mL spore stock solution (A) was prepared in sterile water by suspending x mg of spores in x mL of sterile water.
- Solutions B, C, D, E, F, G, H and I with respective concentrations af 10e-1, 10e-2, 10e-3, 10e-4, 10e-5, 10e-6, 10e-7, and 10e-8 mg/mL were obtained by serial dilution of the stock solution A.
- the concentration of spores per mg of preparation was evaluated by growing colonies in a Luria Bertani culture media and expressed in Colonies Formation Unit (CFU) per mg of spore.
- CFU Colonies Formation Unit
- 15g of Bacto Tryptone, 7.5g of Bacto Yeast Extract and 15g of NaCl were dissolved in 1.5L of sterile water.
- the pH was adjusted to 7.6 (Fisher Accumet pHmeter 620) using a 0.1N NaOH solution. 22.5g of Agar technical were then added to the preparation.
- the solution was heated in a microwave to allow completed dissolution and autoclaved for 30min. at 121 °C. After cooling, the media was poured in disposable sterile culture members (Fisher brand #08-757-12). The members were left until the media had totally solidified and then wrapped with parafilm for storage.
- the number of CFU per mg of the Bg spore Preparation was evaluated as follows: 100 ⁇ L of solutions A to I were memberd in the culture media at 37°C for 24hrs. After incubation, colonies had grown enough to be counted. Only members with a statistical number of colonies (between 30 and 300) were used to calculate the number of CFU per mg of spore preparation. Solutions A to E had too numerous counts (TNC) and solution H and I had not enough counts (under 30). In addition, sterile water was also memberd as a negative control and gave 0 CFU. The average concentration was determined from the remaining members as 3 x 10 8 CFU/mg of spore preparation.
- Tetracore antibody for Bg spores was confirmed first by in-tube reactions and subsequent evaluation with fluorescence microscopy of stained spores on glass slides. The same antibody was then employed for the detection of Bg spores captured on the filter membrane of our system. A series of tests were performed in order to identify those conditions resulting in the highest signal to noise ratio for this on-line assay. Parameters evaluated included: a) the effect of pre-treating the system's tubing and filter membrane with BSA (i.e. blocking of non-specific binding sites for the detecting antibody), b) varying the rate (i.e.
- spore solutions were prepared in a similar fashion as described previously with PBS instead of sterile water. Briefly, a 1mg/mL (or 3 x 10 8 CFU/mL) spore stock solution A was prepared by suspending 1 mg of spores in 1 mL of PBS. Solutions B, C, D, E, F and G were obtained from stock solution A by serial dilution, resulting in concentrations of 3 x 10 8 , 3 x 10 7 , 3 x 10 6 , 3 x 10 5 , 3 x 10 4 , 3 x 10 3 , 3 x 10 2 CFU/mL respectively for solutions A, B, C, D, E, F, and G.
- concentrations cover the range from 1 ng/mL to 1 mg/mL.
- an assay was conducted through execution of the following steps. The solution is introduced through pump 1 for 60 s at a flow rate of 1mL/mn, and followed by a 60 s PBS wash through pump 2 with the same flow rate. The antibody is then slowly (0.3 mL/mn) passed through pump 3 to the flow cell. A final 90 s wash ensures the removal of any unbound or non-specifically attached antibody.
- the background signal was evaluated through five independent measurements of the signal obtained from the passage of antibody in five different spore-free flow cells. The limit of detection was chosen as 3 times the standard deviation obtained from the average of these five measurements.
- the calibration curve was built from the measurement of four different spore solutions accounting for 900, 3000, 9000, and 30000 spores.
- a fluorescent micrograph of the signal remaining after the final wash was recorded and the signal expressed as the density of green intensity per pixel.
- the average green density per pixel was plotted as a function of spore count determining a limit of detection of 900 spores.
- Correlative light and electron microscopy was accomplished by placing a 5 ⁇ L aliquot of antibody-stained spores on a Formvar-coated TEM grid (Maxtaform H2 finder grids, Ted Pella, Inc). Due to the thick walls of the spores, it was possible to avoid more complex dehydration regimens and simply allow the spore suspension to air dry. After a suitable area was located and photographed with fluorescence microscopy, the grid was placed in a Philips 420 TEM and the same grid square was photographed. The grid was then affixed to an aluminum stub with carbon tape and sputter-coated with gold palladium. Using a Leo 1530 SEM, images were captured from the area of interest.
- Bg Bacillus globigii
- Ba Bacillus anthracis
- pixel analysis methods may be used in the analysis of an image of a fluid or captured matter.
- pixel analysis may be used to discriminate microbes from dust and other particulate matter captured on a membrane.
- Pixel analysis may include analyzing characteristics of an image to determine whether a microbe is present in the imaged fluid.
- Pixel analysis may be based on characteristics including, but not limited to, the size, shape, color, and intensity ratios of an image or portions of an image.
- the total area that emits light in an image may be used to conduct analysis.
- the green fluorescent intensity of an image may be used to conduct analysis.
- an "optical fingerprint" for a specific microbe or set of microbes may be established for use in pixel analysis.
- pixel analysis may be based on ratios between values, such as an aspect ratio of an element of matter captured on an image. In other embodiments, pixel analysis may be based on threshold values.
- a visualization agent may cause different particles to emit different wavelengths of light depending on the nature of the particle.
- a user may be able to determine if a particular analyte is present based on the color of the particle. For example, a green particle may indicate the presence of an analyte of interest. Any other colored particles may not be of interest to a user.
- a person may be able to discern between colors, it is desirable for a computer system to also be able to discern different colors from a membrane sample.
- Many detectors can only discern specific colors when analyzing an image. For example, many CCD detectors can only discern red, blue and green colors.
- a CCD detector may not be able to discern the difference between a particle that emits both blue and green light and a particle that just emits green light, although the color difference may be apparent to a person using the system.
- a method of subtracting out particles having the "wrong" color may be used.
- pixels of an image that do not fall within a color range specified by a user may be discarded from the image.
- a fluid may be stained to cause a microbe of interest to emit light in only the green portion of the visible spectrum.
- dust and other particles contained in the fluid may emit light in combinations of green, blue, and red portions of the visible spectrum in the presence of the stain.
- binary masks may be created to eliminate light emissions caused by non-microbial matter from the image.
- FIG. 8A shows an image of all particles captured by a membrane.
- particles 500 having the no fill pattern, exhibit a green color; particles having a fill pattern identical to the fill pattern of particle 510 have a red color; particles having the a fill pattern identical to the fill pattern of particle 520 have both green and blue light absorption; particles having a fill pattern identical to the fill pattern of particle 530 have both red and blue light absorption; and particles having a fill pattern identical to the fill pattern of particle 540 have a blue color.
- these color assignments are for illustrative purposes only. In the current example, the goal of the analysis is to find all of the green particles.
- FIG. 8B depict the particles that would remain if such a filter is used. All of the particles shown in FIG. 8B have a green light absorption, however, not all of the particles that are depicted in FIG. 8B would exhibit a green color only. Particles 520 absorb both green and blue light. Since the detector can't differentiate between the two types of particles, a false positive may result.
- images of particles that absorb blue and red are also analyzed using appropriate filters.
- a process of elimination may be used to determine how many green particles are present.
- an image is then captured of only the particles that exhibit color in the red portion of the spectrum (See FIG. 8C ).
- the image of "red" particles is used to create a mask that may be compared to the full spectrum view of the particles. Since the analytes of interest only exhibit color in the green portion of the spectrum, any particle with color in the red portion of the spectrum may be removed from the original image.
- FIG. 8D shows the original image but with the particles that appear in the red portion of the spectrum subtracted from the image. The remaining particles are potential particles that may be the analyte of interest.
- FIG. 8E shows a binary mask that may be used to mask any pixels that include a blue component.
- An image is captured of only the particles that exhibit color in the blue portion of the spectrum (See FIG. 8E ).
- the image of "blue" particles is used to create a mask that may be compared to the full spectrum view of the particles. Since the analytes of interest only exhibit color in the green portion of the spectrum, any particle with color in the blue portion of the spectrum may be removed from the original image.
- FIG. 8F shows the original image but with the red binary mask and blue binary mask applied so that pixels including a red or blue component are excluded. The particles that remain in the image are thus particles that only exhibit a green color.
- the method may be used to produce an image that includes only "pure green” such an may be analyzed to detect the presence of a microbe by eliminating particles that are not relevant. It should be understood that while the above recited example is directed to determining the presence of green particles it should be understood that the process can be modified to determine blue particles only, red particles only, or particles that exhibit combinations of colors (e.g., red and blue, red and green, blue and green, or red, blue and green).
- colors e.g., red and blue, red and green, blue and green, or red, blue and green.
- pixel analysis may be used in combination with the membrane method for detecting a microbe described herein. Pixel analysis may be conducted either before or after the application of a stain. In an embodiment, pixel analysis may be used to determine when to apply a stain.
- the particles captured by the membrane may be transferred to a sensor array as described in any of the following U.S. Patent Applications: U.S. Patent Application Serial No. 09/287,248 entitled “Fluid Based Analysis of Multiple Analytes by a Sensor Array”; U.S. Patent Application Serial No. 09/354,882 entitled “Sensor Arrays for the Measurement and Identification of Multiple Analytes in Solutions”; U.S. Patent Application Serial No. 09/616,355 entitled "Detection System Based on an Analyte Reactive Particle”; U.S. Patent Application Serial No.
- FIG. 9 depicts a system in which a particle sensor array detector 600 is coupled to a membrane analyte detection device 100.
- Membrane based analyte detection device may be part of an analyte detection system as previously described. After a sample is passed through a membrane, the particles collected by the membrane may be subjected to an additional test to further identify the analytes. In one embodiment, the analytes may be washed from the surface o the membrane and transferred to a sensor based analyte detection system, as described in any of the previously referenced patent applications. The analytes extracted from the sample may react with beads that are placed in a sensor array. The reaction of the analytes with the sensor array beads may allow confirmation (or further identification) of the analytes. Methods of detecting microbes using a sensor array system are described in further detail in the above-referenced patent applications.
- microbes may not react with a bead of a sensor array. Large microbes may be unable to make proper contact with the bead and therefore are not detected by the bead.
- the microbes are subjected to a treatment that allows better detection by a bead based detection system.
- the particles may be subjected to lysis conditions. Lysis of microbes will cause the disintegration or dissolution of the microbe. For bacteria, lysis may be induced by treatment with an alkali base or by use of enzymes. Lysis of the bacteria allows portions of the material contained by the bacteria to be released and analyzed. Typically, either proteins or nucleic acids released from the bacteria may be analyzed.
- Microbes such as bacteria, spores, and protozoa in a fluid may be captured in the macropores of the beads.
- receptors including, but not limited to, elective antibodies or semi-selective ligands such as lectins, may be coupled to a particle in an internal pore region of the particle to create a selective bead. Suitable receptors may be selected using the methods described herein.
- a visualization antibody may be introduced that may coupled with the captured analyte. The visual antibody may yield a colorimetric or fluorescence signature that can be recorded by the CCD detector.
- a series of selective and semi-selective beads may be used in conjunction with the sensor array system described herein.
- an agent that is known to bind or interact with a microbe may be introduced into a fluid prior to the time that the microbes are placed in proximity with a sensor array.
- agents may have characteristics that facilitate capture of a microbe by a particle in the sensor array.
- a particle having macropores may be formed of agarose. A depiction of such a particle is shown in FIG. 10 .
- a particle may be in the form of a spherical bead.
- the particle may include a plurality of macropores on its surface and interior.
- agarose may be used as a starting material for a macroporous particle because it is biocompatible and may be capable of interacting with biomolecules and living organisms.
- Activated agarose may demonstrate an affinity interaction with bacteria and microorganisms.
- specific properties on particles may be used to target specific microorganisms or cells.
- Processed agarose in which sulfate groups have been eliminated from the agarose chain, may consist of an uncharged hydrophilic matrix with primary and secondary alcohols that can be used for activation and attachment.
- the chemical surface of particles may be modified by oxidizing adjacent diols into aldehyde groups. Using sodium meta-periodate (NaIO 4 ) aliphatic aldehydes may be obtained that can be used in reductive amination coupling procedures.
- macroporous particles may be formed by suspension polymerization using a gel. Size, shape, and uniformity of the particle may depend on the hydrophilic or hydrophobic additives used to stabilize the emulsion. Pore size may be determined by agarose concentration of the gel. Mechanical properties, such as gel strength, may be affected by the molecular weight of the agarose. In one embodiment, suspension polymerization may be accomplished using a biphasic system containing the agarose monomer and emulsion stabilizers.
- a dispersion of a hydrophilic emulsifier (such as TWBBN 85) in cyclohexane may be added to a stirring aqueous solution of agarose at 60°C for 5 min to produce an oil-in-water emulsion. Fine particles of agarose stabilized by the emulsifier may be formed in this step.
- a solution of a hydrophobic emulsifier such as SPAN 85
- the water-in-emulsion may be cooled to room temperature. Polymeric particles may appear at about 40°C.
- the aggregation of droplets which may be referred to as flocculation, may form a matrix with oil droplets that will form pores or conduits in the beads.
- the particles may be washed with distilled water and alcohol, sized with industrial sieves, and preserved in water.
- Emulsifiers added to the hydrophilic and/or hydrophilic phases and the concentration of the agarose solution may influence the quality of the beads. Additionally, mixing speed, nature of the agitation, and temperature during the preparation process may be important. The stability of the solutions may depend on the selected emulsifiers and the solvents used.
- a particle may be of a substantially spherical shape. Particles with spherical geometry may enhance the available area for surface interaction with the analytes. Creating pores within the particles may also increase surface area. Particles may have large connecting flow pores in addition to normal diffusion pores. A macroporous particle may have improved mass transfer properties compared to a non-macroporous particle.
- a particle may have a diameter of between about 250-300 microns. Macropores in a particle may be less than about 1 micron. Different pore sizes and shapes may allow for the entrapment and detection of a variety of analytes, including, but not limited to, cells, bacteria, DNA oligomers, proteins/antibodies, and small molecules.
- An alternative process to suspension polymerization may be the use of a foaming agent to vary the porosity of the particles.
- the decomposition of azides or carbonates during polymerization may allow incorporation of nitrogen or carbon dioxide "bubbles" into the particles. Because the gelling point for agarose is 40°C, the decomposition reaction should be performed at low temperatures.
- Another alternative to suspension polymerization may be the use of molecular imprinting.
- the imprinting of particles may occur by non-covalent and covalent methods.
- Non-covalent imprinting may be based on non-covalent interactions such hydrogen bonds, ionic bonds, and Van der Waals forces between functional monomer and a temmember.
- the stability of the monomer-temmember complex prior to polymerization may depend on the affinity constants between the temmember and the functional monomers.
- the bonds formed between the functional monomer and the temmember may be cleaved once the polymerized matrix is obtained.
- molecular imprinted polymers there may be different methods for making molecular imprinted polymers.
- One approach may involve grinding the imprinted polymer to reduce their size to approximately 25 ⁇ m and expose the imprinted surfaces.
- Another technique, which may be referred to as 'surface temmember polymerization,' uses water and oil.
- the water-soluble temmember may interact with the functional monomer at the water-oil interface.
- the complex monomer-temmember in the organic phase may be polymerized yielding a polymer-imprinted surface. This technique may allow the imprinting of water-soluble substances like zinc ions.
- Molecular imprinting on microgel spheres may be a convenient procedure for imprinting agarose because the imprinted gel does not need to be reduced in size by grinding as in conventional molecular imprinting.
- Discrete imprinted microgels and imprinted microspheres may be synthesized by cross-linking polymerization of the monomer in the presence of the temmember, a process known as "precipitation polymerization.”
- Surface temmember polymerization and precipitation polymerization may be suitable alternative techniques to chemical surface modification of regular particles. Both techniques may be suitable for printing agarose with such temmembers as bacterial spores.
- a chromatography column mounted with imprinted beads may be a fast method for evaluating the efficacy of the imprinted beads. For example, bacteria may be re-bound, exposed to the fluorescent calcium-sensitive indicator known as calcein, and detected by fluorescence spectroscopy.
- Molecular imprinting may allow the exploitation of organisms as reactors.
- the pores in the particle may facilitate feeding of entrapped microorganism reactants and cause them to produce a desired product.
- Molecular imprinting may be used for encapsulating bacteria such as the Rhizobium organisms into agarose. These bacteria may convert nitrogen from the atmosphere into ammonia. By "feeding" these bacteria nitrogen, ammonia may be produced.
- the pores encapsulating the bacteria may retain an imprint of the organism for morphologic studies of the bacteria's surface.
- High-performance liquid chromatography and fluorescent assays may be a valuable tool for studying the molecularly imprinted polymers.
- the fluorescent dye acridine orange may stain agarose beads so they may be morphologically analyzed with confocal scanning laser microscopy. Other morphological studies include atomic force microscopy, scanning electron microscopy, and microtome techniques. Characterization of the surface area of the beads, may be achieved by measuring the adsorption isotherm and using the Brunauer, Emmet, and Teller equation.
- the surface of a particle may be chemically modified.
- chemical functionality including, but not limited to non-specific (i.e., functional groups) and highly specific (i.e., bio-ligands such as antibodies) may be localized into the confines of the pore region. Chemical functionality may facilitate the entrapment of a variety of analytes.
- a particle may include a receptor that includes a particular metal.
- the metal may be capable of binding a material that is characteristic of a particular analyte.
- a particle may be formed that includes terbium (III).
- Terbium (III) forms a luminescent complex with dipicolinic acid, a substance unique to spores.
- Macroporous beads were prepared using the method for biphasic suspension polymerization method described herein.
- the beads so obtained were analyzed using light and fluorescence microscopy.
- the transparency of the agarose beads permitted the visualization of the fluorescent beads in different sections of the agarose beads.
- the presence of pores was confirmed by adding 1 ⁇ m fluorescent beads.
- the beads accumulated into voids present in the bead, probably the ends of conduits.
- Sensor arrays that use beads (either non-porous or porous) can be used to determine the presence of a variety of analytes.
- the beads include a receptor that binds to an analyte.
- the receptor may also bind to an indicator.
- the indicator typically produces a signal in the presence of an analyte that is different from a signal produced in the absence of an analyte.
- the selection of beads for use with a particular analyte may be important to the success of the sensor array.
- a bead should have a high affinity for the analyte and produce an easily detectable signal.
- a method is described herein which may be used to determine an optimal receptor for a given analyte and indicator.
- a displacement assay One method used to determine the presence of an analyte is a displacement assay.
- a displacement assay a bead that includes a receptor is preloaded with an indicator.
- the indicator interacts (e.g., is bound to) the receptor such that the bead appears to have a specific color or fluorescence due to the indicator.
- the analyte may displace the indicator from the receptor. This displacement may cause a loss of color or fluorescence of the bead since the indicator is no longer associated with the bead.
- the presence of an analyte may be determined.
- an assay for determining the presence of an analyte is dependent, in part, on the interaction of the receptor with the analyte and the indicator.
- the bead should show a maximum color and fluorescence when an indicator is bound to the receptor, however, the indicator should be easily displaced by the analyte.
- a plurality of beads having a variety of receptors may be produced.
- the receptors may be formed from a variety of different receptor types.
- the beads may have similar receptors.
- techniques are well known to create libraries of peptide, peptide mimics, or nucleotides upon polymeric beads.
- peptide libraries up to 20 n different beads may be produced in a library, where n is the number of amino acids in the peptide chain.
- Nucleic acid libraries may have up to 4 n different beads where n is the number of nucleic acid bases. Because of the large number of different beads in these libraries, the testing of each individual bead is very difficult.
- FIG. 11 depicts a schematic drawing of a method for optimizing a receptor on a bead.
- a bead is depicted that includes a receptor X.
- Receptor X is composed of 6 subparts that extend from a base.
- the base is coupled to the bead.
- the bead is first contacted with an indicator, denoted as the stars in FIG. 11A .
- the indicator interacts with each of the beads in the library, binding to the receptors.
- FIG. 11B shows the indicator coupled to the receptor of the bead.
- the color or fluorescence of the bead is altered due to the interaction of the indicator with the receptor.
- the change in color or fluorescence of the bead indicates that the bead is capable of interacting with the indicator.
- the indicator When a plurality of beads is used, the indicator will bind to the beads at various strengths. The strength of binding is typically associated with the degree of color or fluorescence produced by the bead. A bead that exhibits a strong color or fluorescence in the presence of the indicator has a receptor that binds with the indicator. A bead that exhibits a weak or no color or fluorescence has a receptor that only weakly binds the indicator. Ideally, the beads which have the best binding with the indicator should be selected for use over beads that have weak or no binding with the indicator.
- FIG. 12 depicts a schematic of a flow cytometer which may be used to separate beads based on the intensity of color or fluorescence of the bead.
- a flow cytometer allows analysis of each individual bead.
- the beads may be passed through a flow cell that allows the intensity of color or fluorescence of the bead to be measured. Depending on the measured intensity, the bead may be collected or sent to a waste collection vessel, as indicated in FIG. 12 .
- the flow cytometer may be set up to accept only beads having an color or fluorescence above a certain threshold. Beads that do not meet the selected threshold, (ie., beads that have weak or no binding with the indicator) are not collected and removed from the screening process.
- Flow cytometers are commercially available from a number of sources.
- the beads that have been collected represent a reduced population of the originally produced beads. If the population of beads is too large, additional screening may be done by raising the intensity threshold. Now that the beads that exhibit optimal interaction with a receptor have been identified, the remaining beads are optimized for displacement of the indicator by the analyte of interest. Thus, the remaining beads are treated with a fluid that includes the analyte of interested, as depicted in FIG. 11C .
- the analyte is represented by the circle. For some beads, the analyte will cause displacement of the indicator, causing the color or fluorescence of the bead to be reduced, as depicted in FIG. 11D .
- the intensity of the color or fluorescence of the bead after it interacts with an analyte will be based on how the competitive displacement of the indicator.
- a bead that exhibits weak or no color or fluorescence when treated with an analyte is the most desirable. Such beads show that the analyte is readily bound by the receptor and can readily displace the indicator from the receptor.
- a flow cytometer may be used to determine the optimal beads for use in an assay.
- a library of beads that have been optimized for interaction with an indicator are treated with a fluid that includes an analyte.
- the treated beads are passed through a flow cytometer and the beads are separated based on intensity of color or fluorescence.
- the beads that exhibit a color or fluorescence below a predetermined intensity are collected, while beads that show a color or fluorescence above the predetermined intensity are sent to a waste collection.
- the collected beads represent the optimal beads for use with the selected analyte and indicator.
- the identity of the receptor coupled to the bead may be determined using known techniques. After the receptor is identified, the bead may be reproduced and used for analysis of samples.
- CD4 counts are essential for evaluating HN-infected patients.
- CD4 counts expressed as either absolute numbers of CD4 cells per milliliter of blood, a percentage of total T lymphocytes, or as the ratio of CD4:CD8 T lymphocytes, have enormous prognostic and therapeutic implications, and form the basis for most treatment decisions.
- CD4 counts are performed using flow cytometers, which use lasers to excite fluorescent antibody probes specific for CD4 and other T cell markers. The emitted light is collected by a series of photomultiplier tubes, and these signals are analyzed to differentiate CD4+ T cells from CD8+ T cells and other cellular components of blood.
- Costs for flow cytometers range from $30,000 to $100,000 per machine. This expense, as well as their need for high wattage electricity, regular maintenance and costly reagents, makes flow cytometers impractical, and unsustainable in resource-scarce settings.
- a microporous lymphocyte capture membrane was used in a membrane based flow sensor as previously described.
- CD4 cells were purified by immunomagnetic separation from buffy coats obtained from healthy donors. All CD4 preparations were greater than 98% pure by flow cytometric analysis.
- CD4 cells labeled with Alexa488-conjugated anti-CD4 antibodies were introduced to the flow cell in amounts ranging from 0 to 200,000 cells in 1 ml of cell media, and washed with 2 to 5 milliliters of phosphate-buffered saline (PBS).
- PBS phosphate-buffered saline
- the membrane based flow sensor was immobilized on the stage of a microscope system equipped with a medium-pressure mercury lamp as a light source.
- a total of five non-overlapping regions of the lymphocyte capture membrane in the floor of the microchamber were imaged using a digital camera (DVC, Austin, Texas) attached to the workstation.
- DVC digital camera
- Each region was imaged twice, once under a red wavelength absorption filter (for detection of Alexa-488 fluorescence) and once under a green wavelength absorption filter (for detection of Alexa-647 fluorescence). Except for the preliminary studies, these two images were merged to produce a single image prior to analysis.
- Blood was obtained by venipuncture from healthy volunteers or HIV-infected subjects at the Massachusetts General Hospital. Samples were processed in parallel by flow cytometry at either the MGH clinical laboratories or at the research facility, using standard 4-color protocols on a FACScalibur flow cytometer. The study was approved by the Institutional Review Board at the Massachusetts General Hospital, and informed consent was obtained from all study subjects.
- Results obtained by the automated microchip method were compared directly with results obtained by flow cytometry for each of the study subjects, and correlated using a standard statistical software package.
- microchip immunoassays using antibody-coupled microbeads immobilized in an inverted pyramidal microchamber. This design has proven extremely effective as a microELISA platform for antigen and antibody detection.
- flow chambers were re-engineered with a floor that consisted of a porous plastic grid, upon which rests a disposable lymphocyte capture membrane filter. These filters have a predetermined pore size ranging from 0.2 to 30 microns. In preliminary studies, pore sizes of between 2 and 5 microns proved optimal for microfluidics of the flow chamber, and for retention of lymphocytes. The unwanted red blood cells and platelets pass through the pores and out of the flow chamber prior to imaging, significantly reducing background fluorescence and improving image quality.
- Alexa488-conjugated antibodies label the CD4 cells green
- Alexa647-conjugated antibodies to CD3 label all T lymphocytes red.
- Automatic merging of the images allows the distinction between the CD3+CD4+ T lymphocytes of interest, which appear yellow, the CD4+CD3- monocytes (green), and CD3+CD4- T cells (red).
- five non-overlapping images are obtained, increasing the size of the sample cell population and improving accuracy.
- results for CD4 percentages (number of CD4+CD3+ cells/number of total CD3+ cells) and CD4:CD8 ratios (CD4 percentage/CD8 percentage) obtained from the microchip system were compared with results obtained by flow cytometry for each of the study subjects. Comparisons of the microchip method with flow cytometry for CD4:CD8 ratios gave good correlations.
Applications Claiming Priority (6)
| Application Number | Priority Date | Filing Date | Title |
|---|---|---|---|
| US39832402P | 2002-07-24 | 2002-07-24 | |
| US39831402P | 2002-07-24 | 2002-07-24 | |
| US39814802P | 2002-07-24 | 2002-07-24 | |
| US39823502P | 2002-07-24 | 2002-07-24 | |
| US39820302P | 2002-07-24 | 2002-07-24 | |
| EP03765999A EP1546367A4 (fr) | 2002-07-24 | 2003-07-24 | Capture et detection de microbes au moyen de methodes membranaires |
Related Parent Applications (1)
| Application Number | Title | Priority Date | Filing Date |
|---|---|---|---|
| EP03765999A Division EP1546367A4 (fr) | 2002-07-24 | 2003-07-24 | Capture et detection de microbes au moyen de methodes membranaires |
Publications (1)
| Publication Number | Publication Date |
|---|---|
| EP2107120A1 true EP2107120A1 (fr) | 2009-10-07 |
Family
ID=30773752
Family Applications (2)
| Application Number | Title | Priority Date | Filing Date |
|---|---|---|---|
| EP03765999A Ceased EP1546367A4 (fr) | 2002-07-24 | 2003-07-24 | Capture et detection de microbes au moyen de methodes membranaires |
| EP08168266A Withdrawn EP2107120A1 (fr) | 2002-07-24 | 2003-07-24 | Capture et détection des microbes par des procédés de membrane |
Family Applications Before (1)
| Application Number | Title | Priority Date | Filing Date |
|---|---|---|---|
| EP03765999A Ceased EP1546367A4 (fr) | 2002-07-24 | 2003-07-24 | Capture et detection de microbes au moyen de methodes membranaires |
Country Status (6)
| Country | Link |
|---|---|
| US (2) | US20060073585A1 (fr) |
| EP (2) | EP1546367A4 (fr) |
| JP (1) | JP2005533502A (fr) |
| AU (1) | AU2003256742A1 (fr) |
| CA (1) | CA2494727A1 (fr) |
| WO (1) | WO2004009840A1 (fr) |
Cited By (21)
| Publication number | Priority date | Publication date | Assignee | Title |
|---|---|---|---|---|
| CN102207444A (zh) * | 2011-03-17 | 2011-10-05 | 上海理工大学 | 一种图像法颗粒分析仪 |
| US9423234B2 (en) | 2012-11-05 | 2016-08-23 | The Regents Of The University Of California | Mechanical phenotyping of single cells: high throughput quantitative detection and sorting |
| US9610546B2 (en) | 2014-03-12 | 2017-04-04 | Lockheed Martin Corporation | Separation membranes formed from perforated graphene and methods for use thereof |
| US9744617B2 (en) | 2014-01-31 | 2017-08-29 | Lockheed Martin Corporation | Methods for perforating multi-layer graphene through ion bombardment |
| US9834809B2 (en) | 2014-02-28 | 2017-12-05 | Lockheed Martin Corporation | Syringe for obtaining nano-sized materials for selective assays and related methods of use |
| US9833748B2 (en) | 2010-08-25 | 2017-12-05 | Lockheed Martin Corporation | Perforated graphene deionization or desalination |
| US9844757B2 (en) | 2014-03-12 | 2017-12-19 | Lockheed Martin Corporation | Separation membranes formed from perforated graphene and methods for use thereof |
| US9870895B2 (en) | 2014-01-31 | 2018-01-16 | Lockheed Martin Corporation | Methods for perforating two-dimensional materials using a broad ion field |
| US10005038B2 (en) | 2014-09-02 | 2018-06-26 | Lockheed Martin Corporation | Hemodialysis and hemofiltration membranes based upon a two-dimensional membrane material and methods employing same |
| US10017852B2 (en) | 2016-04-14 | 2018-07-10 | Lockheed Martin Corporation | Method for treating graphene sheets for large-scale transfer using free-float method |
| US10118130B2 (en) | 2016-04-14 | 2018-11-06 | Lockheed Martin Corporation | Two-dimensional membrane structures having flow passages |
| US10201784B2 (en) | 2013-03-12 | 2019-02-12 | Lockheed Martin Corporation | Method for forming perforated graphene with uniform aperture size |
| US10203295B2 (en) | 2016-04-14 | 2019-02-12 | Lockheed Martin Corporation | Methods for in situ monitoring and control of defect formation or healing |
| US10213746B2 (en) | 2016-04-14 | 2019-02-26 | Lockheed Martin Corporation | Selective interfacial mitigation of graphene defects |
| US10376845B2 (en) | 2016-04-14 | 2019-08-13 | Lockheed Martin Corporation | Membranes with tunable selectivity |
| US10418143B2 (en) | 2015-08-05 | 2019-09-17 | Lockheed Martin Corporation | Perforatable sheets of graphene-based material |
| US10471199B2 (en) | 2013-06-21 | 2019-11-12 | Lockheed Martin Corporation | Graphene-based filter for isolating a substance from blood |
| US10500546B2 (en) | 2014-01-31 | 2019-12-10 | Lockheed Martin Corporation | Processes for forming composite structures with a two-dimensional material using a porous, non-sacrificial supporting layer |
| US10653824B2 (en) | 2012-05-25 | 2020-05-19 | Lockheed Martin Corporation | Two-dimensional materials and uses thereof |
| US10696554B2 (en) | 2015-08-06 | 2020-06-30 | Lockheed Martin Corporation | Nanoparticle modification and perforation of graphene |
| US10980919B2 (en) | 2016-04-14 | 2021-04-20 | Lockheed Martin Corporation | Methods for in vivo and in vitro use of graphene and other two-dimensional materials |
Families Citing this family (85)
| Publication number | Priority date | Publication date | Assignee | Title |
|---|---|---|---|---|
| ATE436015T1 (de) | 2004-02-26 | 2009-07-15 | Thomsen Bioscience As | Verfahren, chip, vorrichtung und integriertes system zum nachweis biologischer partikel |
| DK1730276T3 (da) | 2004-02-26 | 2010-09-20 | Delta Dansk Elektronik Lys Og | Fremgangsmåde, chip, indretning og system til ekstraktion af biologiske materialer |
| US7932024B2 (en) | 2004-02-26 | 2011-04-26 | Delta, Dansk Elektronik, Lys & Akustik | Method, chip, device and system for collection of biological particles |
| US8105849B2 (en) * | 2004-02-27 | 2012-01-31 | Board Of Regents, The University Of Texas System | Integration of fluids and reagents into self-contained cartridges containing sensor elements |
| US7781226B2 (en) * | 2004-02-27 | 2010-08-24 | The Board Of Regents Of The University Of Texas System | Particle on membrane assay system |
| US8101431B2 (en) * | 2004-02-27 | 2012-01-24 | Board Of Regents, The University Of Texas System | Integration of fluids and reagents into self-contained cartridges containing sensor elements and reagent delivery systems |
| US20050221418A1 (en) * | 2004-04-06 | 2005-10-06 | U.S. Army Research Laboratory | Enhanced bacterial endospore detection method and system |
| JP4429069B2 (ja) * | 2004-05-06 | 2010-03-10 | 三洋電機株式会社 | 微生物の検出装置および方法 |
| WO2006018839A2 (fr) * | 2004-08-16 | 2006-02-23 | Bacterioscan | Detection de bacteries dans des fluides |
| US8053214B2 (en) * | 2004-09-09 | 2011-11-08 | Microfluidic Systems, Inc. | Apparatus and method of extracting and optically analyzing an analyte from a fluid-based sample |
| CA2583498A1 (fr) * | 2004-09-09 | 2006-03-16 | Microfluidic Systems Inc. | Dispositif microfluidique manuel et portable servant a la preparation automatique d'acides nucleiques pour analyse |
| US7785868B2 (en) * | 2004-12-02 | 2010-08-31 | Microfluidic Systems, Inc. | Apparatus to automatically lyse a sample |
| US7307721B2 (en) * | 2005-04-13 | 2007-12-11 | Brightwell Technologies | Particle imaging system with a varying flow rate |
| FR2885140B1 (fr) * | 2005-04-29 | 2010-12-31 | Millipore Corp | Procede de detection et de caracterisation de microorgarnismes sur une membrane. |
| US8377398B2 (en) | 2005-05-31 | 2013-02-19 | The Board Of Regents Of The University Of Texas System | Methods and compositions related to determination and use of white blood cell counts |
| US20060275852A1 (en) | 2005-06-06 | 2006-12-07 | Montagu Jean I | Assays based on liquid flow over arrays |
| JP4690787B2 (ja) * | 2005-06-14 | 2011-06-01 | 株式会社日立製作所 | 微生物検知チップ及び微生物検知システム並びに微生物検知方法 |
| CA2613078A1 (fr) * | 2005-06-24 | 2007-01-04 | Board Of Regents, The University Of Texas System | Systemes et procedes faisant appel a des cartouches autonomes comprenant des systemes de detection et des systemes de distribution de fluides |
| JP2007006709A (ja) * | 2005-06-28 | 2007-01-18 | Matsushita Electric Ind Co Ltd | 発光物の判別方法 |
| GB0601302D0 (en) * | 2006-01-23 | 2006-03-01 | Semikhodskii Andrei | Diagnostic methods and apparatus |
| JP2007209223A (ja) * | 2006-02-08 | 2007-08-23 | Hitachi Ltd | 微生物検知システム |
| FR2897873B1 (fr) * | 2006-02-24 | 2008-05-30 | Millipore Corp | Procede d'analyse microbiologique rapide. |
| US20080038738A1 (en) * | 2006-05-10 | 2008-02-14 | The Board Of Regents Of The University Of Texas System | Detecting tumor biomarker in oral cancer |
| US20080050830A1 (en) * | 2006-05-10 | 2008-02-28 | The Board Of Regents Of The University Of Texas System | Detecting multiple types of leukocytes |
| CA2651872A1 (fr) * | 2006-05-10 | 2007-11-22 | Board Of Regents, The University Of Texas System | Detection de plusieurs types de leucocytes |
| EP2027587A4 (fr) * | 2006-05-18 | 2010-09-15 | Hitachi Chemical Co Ltd | Matériaux présentant des propriétés électriques variables s'appuyant sur des stimuli environnementaux |
| JP4748724B2 (ja) * | 2006-06-12 | 2011-08-17 | ハイモ株式会社 | ピッチコントロール剤あるいは凝結剤の評価方法 |
| US7633606B2 (en) * | 2006-08-24 | 2009-12-15 | Microfluidic Systems, Inc. | Integrated airborne substance collection and detection system |
| US7858366B2 (en) * | 2006-08-24 | 2010-12-28 | Microfluidic Systems, Inc | Integrated airborne substance collection and detection system |
| US7705739B2 (en) * | 2006-08-24 | 2010-04-27 | Microfluidic Systems, Inc. | Integrated airborne substance collection and detection system |
| ITBO20070163A1 (it) * | 2007-03-12 | 2008-09-13 | Ali Spa | Macchina e metodo per la produzione e l'erogazione di prodotti di consumo alimentari liquidi o semiliquidi. |
| FR2915487B1 (fr) | 2007-04-26 | 2009-06-05 | Millipore Corp | Ensemble et procede pour analyse microbiologique |
| DE102007021387A1 (de) | 2007-05-04 | 2008-11-06 | Eads Deutschland Gmbh | Detektionsvorrichtung zur Detektion von biologischen Mikropartikeln wie Bakterien, Viren, Sporen, Pollen oder biologische Toxine, sowie Detektionsverfahren |
| FR2917095B1 (fr) * | 2007-06-07 | 2009-07-17 | Biomerieux Sa | Dispositif de lyse de microorganismes presents dans un echantillon environnemental ou clinique et d'extraction des acides nucleiques desdits microorganismes aux fins d'analyse. |
| US20110045470A1 (en) * | 2007-08-01 | 2011-02-24 | Hitachi Chemical Co., Ltd. | Pathogen detection in large-volume particulate samples |
| JP5252176B2 (ja) * | 2007-11-29 | 2013-07-31 | 株式会社日立プラントテクノロジー | 捕集担体、捕集ユニット、捕集装置及び捕集・検査方法 |
| US8393198B2 (en) * | 2008-01-09 | 2013-03-12 | OronoSpectral Solutions, Inc. | Apparatus and method for determining analyte content in a fluid |
| US8105499B2 (en) * | 2008-07-14 | 2012-01-31 | International Business Macines Corporation | Transmission electron microscopy sample etching fixture |
| US8133451B2 (en) * | 2008-08-28 | 2012-03-13 | Microfluidic Systems, Inc. | Sample preparation apparatus |
| WO2010080643A1 (fr) * | 2008-12-18 | 2010-07-15 | Biovigilant Systems, Inc. | Collecteur microbien intégré |
| JP2011083214A (ja) * | 2009-10-14 | 2011-04-28 | Sharp Corp | 微生物検出装置および検出方法 |
| JP5515636B2 (ja) * | 2009-10-30 | 2014-06-11 | Tdk株式会社 | 捕集器具、検出装置、及び、捕集方法 |
| JP2011097861A (ja) * | 2009-11-05 | 2011-05-19 | Sharp Corp | 微生物検出装置および検出方法 |
| WO2011061270A2 (fr) * | 2009-11-18 | 2011-05-26 | Pneuma Pure I.P. Limited | Améliorations d'une literie hygiénique et relatives à celle-ci comprenant des soupapes de détection microbienne et des dispositifs amortisseurs et/ou de literie de contrôle d'infections comprenant lesdites soupapes de détection microbienne |
| US20120266753A1 (en) * | 2009-11-18 | 2012-10-25 | Pneuma Pure I.P. Limited | Hygienic bedding including microbial detection valves and infection controls cushioning and/or bedding devices comprising said microbial detection valves |
| JP4924909B2 (ja) * | 2010-01-12 | 2012-04-25 | 株式会社日立プラントテクノロジー | 捕集担体溶液濾過時の吸引エアリーク防止機構および捕集担体溶液濾過時の吸引エアリーク防止方法 |
| US20130130272A1 (en) * | 2010-07-31 | 2013-05-23 | Advanced Biomedical Limited | Method, reagent, and apparatus for detecting a chemical chelator |
| FR2964980B1 (fr) * | 2010-09-22 | 2014-05-16 | Commissariat Energie Atomique | Dispositif de detection et d'imagerie d'elements biocontaminants |
| WO2012065025A2 (fr) | 2010-11-12 | 2012-05-18 | William Marsh Rice University | Diagnostic sur les lieux de soin du cancer de la prostate |
| WO2012065117A2 (fr) | 2010-11-12 | 2012-05-18 | William Marsh Rice University | Diagnostics hors laboratoire de cancer de la bouche |
| CA2826544C (fr) * | 2011-02-04 | 2020-06-30 | Cytonome/St, Llc | Appareil et procede de triage de particules |
| CA2836061A1 (fr) | 2011-05-12 | 2012-11-15 | William Marsh Rice University | Nano-biopuces pour depistage systematique de drogues sur place |
| JP5963159B2 (ja) * | 2012-01-05 | 2016-08-03 | 日立化成株式会社 | 細胞捕捉デバイス |
| US9170178B2 (en) | 2012-04-16 | 2015-10-27 | Edward Sobek | Composition, device, and method for biological air sampling |
| WO2013187910A1 (fr) * | 2012-06-15 | 2013-12-19 | Empire Technology Development Llc | Lentille auto-nettoyante |
| JP6218185B2 (ja) * | 2012-07-03 | 2017-10-25 | コニカミノルタ株式会社 | 細胞展開用デバイスおよび希少細胞の検出方法 |
| CN104470635B (zh) * | 2012-07-03 | 2017-04-12 | 默克专利股份公司 | 样品制备装置 |
| JP5738244B2 (ja) * | 2012-08-01 | 2015-06-17 | 株式会社日立製作所 | 検査方法 |
| JP5512768B2 (ja) * | 2012-09-05 | 2014-06-04 | 株式会社日立製作所 | 被検出物捕集具及びその使用方法 |
| JP5860175B2 (ja) | 2013-01-29 | 2016-02-16 | 株式会社日立製作所 | 気中物質検知装置及びそれに用いるカートリッジ |
| JP6031372B2 (ja) * | 2013-02-12 | 2016-11-24 | アズビル株式会社 | 粒子検出システム及び粒子検出方法 |
| WO2014151177A1 (fr) * | 2013-03-15 | 2014-09-25 | 3M Innovative Properties Company | Concentrateur d'échantillon et méthode d'utilisation |
| CN103323590B (zh) * | 2013-06-08 | 2015-05-06 | 上海云泽生物科技有限公司 | 一种基于纤维膜捕集分离的定量检测装置及其检测方法 |
| EP3031903A4 (fr) * | 2013-08-09 | 2017-04-26 | Hitachi Chemical Co., Ltd. | Dispositif de piégeage de cellules, système de piégeage de cellules, et procédé de production du dispositif de piégeage de cellules |
| JP6329164B2 (ja) | 2013-10-03 | 2018-05-23 | 株式会社日立製作所 | 気中物質検知装置用のカートリッジ及び気中物質検知装置 |
| US20170067807A1 (en) * | 2014-02-28 | 2017-03-09 | Lockheed Martin Corporation | Separation and assay of target entities using filtration membranes comprising a perforated two-dimensional material |
| JP6393492B2 (ja) * | 2014-03-07 | 2018-09-19 | 国立大学法人 東京大学 | 試料台及び走査型プローブ顕微鏡 |
| SG11201607970YA (en) * | 2014-03-27 | 2016-11-29 | Hitachi Chemical Co Ltd | Cell capture device, cell capture filter, cell capture apparatus, and method for manufacturing cell capture device |
| US20170137769A1 (en) * | 2014-03-28 | 2017-05-18 | Hitachi Chemical Company, Ltd. | Cell capturing apparatus, cell capturing device provided with pre-processing part, and pre-processing part |
| EP3172336B1 (fr) * | 2014-07-02 | 2020-06-17 | Siemens Healthcare Diagnostics Inc. | Commande à asservissement permettant une détection améliorée de cellules rares |
| KR20170066512A (ko) * | 2014-10-08 | 2017-06-14 | 히타치가세이가부시끼가이샤 | 세포 포착 디바이스 |
| JP6650772B2 (ja) * | 2016-02-04 | 2020-02-19 | オルガノ株式会社 | 微粒子捕捉装置および微粒子測定方法 |
| US10190961B2 (en) | 2016-03-18 | 2019-01-29 | Shenzhen Mindray Bio-Medical Electronics Co., Ltd. | Sample analyzer and sample analyzing method thereof |
| KR101674018B1 (ko) * | 2016-05-16 | 2016-11-08 | (주)글로리바이오텍 | Cd4, cd8 세포 정보를 이용한 hiv 진단 방법 |
| FR3067110A1 (fr) * | 2017-06-01 | 2018-12-07 | Centre National De La Recherche Scientifique (Cnrs) | Dispositif et procede de detection et d'imagerie d’elements biocontaminants |
| US11380438B2 (en) | 2017-09-27 | 2022-07-05 | Honeywell International Inc. | Respiration-vocalization data collection system for air quality determination |
| US11446663B2 (en) | 2018-01-26 | 2022-09-20 | Aincobio Llc | Method and apparatus for isolating and detecting biological and other particles |
| US10794810B1 (en) * | 2019-08-02 | 2020-10-06 | Honeywell International Inc. | Fluid composition sensor device and method of using the same |
| US11221288B2 (en) | 2020-01-21 | 2022-01-11 | Honeywell International Inc. | Fluid composition sensor device and method of using the same |
| US11391613B2 (en) | 2020-02-14 | 2022-07-19 | Honeywell International Inc. | Fluid composition sensor device and method of using the same |
| US11181456B2 (en) | 2020-02-14 | 2021-11-23 | Honeywell International Inc. | Fluid composition sensor device and method of using the same |
| US11333593B2 (en) | 2020-02-14 | 2022-05-17 | Honeywell International Inc. | Fluid composition sensor device and method of using the same |
| US11835432B2 (en) | 2020-10-26 | 2023-12-05 | Honeywell International Inc. | Fluid composition sensor device and method of using the same |
| US20220364973A1 (en) * | 2021-05-13 | 2022-11-17 | Honeywell International Inc. | In situ fluid sampling device and method of using the same |
| KR102436854B1 (ko) * | 2021-12-07 | 2022-08-26 | (주) 제타푸드랩 | 바이오 센싱 전처리 방법 |
Citations (20)
| Publication number | Priority date | Publication date | Assignee | Title |
|---|---|---|---|---|
| US72800A (en) | 1867-12-31 | Eben m | ||
| US287248A (en) | 1883-10-23 | Stalk-cutter | ||
| US354882A (en) | 1886-12-28 | Thomas w | ||
| US616355A (en) | 1898-12-20 | Locomotive-coaling device | ||
| US616731A (en) | 1898-12-27 | Friedrich ludwig albert riemann | ||
| US616482A (en) | 1898-12-27 | Toy cue | ||
| US775048A (en) | 1902-07-14 | 1904-11-15 | Charles W Stevenson | Fruit-box. |
| US775342A (en) | 1903-12-08 | 1904-11-22 | Ernst Abee | Cardiac truss. |
| US775343A (en) | 1904-02-02 | 1904-11-22 | John Alexander Cook | Traveling bag, case, &c. |
| US775340A (en) | 1902-07-09 | 1904-11-22 | John Howard Mcelroy | Locked-seam-can-body machine. |
| US775353A (en) | 1904-02-23 | 1904-11-22 | Zeiss Carl | Lens combination for producing virtual images. |
| US775344A (en) | 1904-02-12 | 1904-11-22 | William R Bradford | Buggy-boot spring. |
| US4317726A (en) * | 1981-02-12 | 1982-03-02 | The United States Of America As Represented By The Secretary Of The Army | Microbial filter assembly |
| FR2677664A1 (fr) * | 1991-06-13 | 1992-12-18 | Millipore Sa | Dispositif et procede de controle microbiologique des liquides sous pression. |
| US5905038A (en) * | 1995-05-25 | 1999-05-18 | Severn Trent Water Limited | Filtration and culture methods and apparatus |
| WO2000004372A1 (fr) * | 1998-07-16 | 2000-01-27 | The Board Of Regents, The University Of Texas System | Mosaique de capteurs permettant de mesurer et d'identifier des analytes multiples dans les solutions |
| NL1007489C2 (nl) * | 1996-11-08 | 2000-10-24 | Konink Grolsch N V | Werkwijze en inrichting voor het in een medium aantonen van micro-organismen. |
| US6217636B1 (en) | 1998-03-13 | 2001-04-17 | The Texas A&M University System | Transpirated wall aerosol collection system and method |
| US20020045272A1 (en) | 2000-01-31 | 2002-04-18 | Mcdevitt John T. | Method and apparatus for the delivery of samples to a chemical sensor array |
| US7280002B2 (en) | 2005-03-03 | 2007-10-09 | Avago Technologies General Ip Pte Ltd | Method and apparatus for biasing a metal-oxide-semiconductor capacitor for capacitive tuning |
Family Cites Families (82)
| Publication number | Priority date | Publication date | Assignee | Title |
|---|---|---|---|---|
| US2923669A (en) * | 1954-11-22 | 1960-02-02 | Millipore Filter Corp | Method of bacterial analysis |
| US3844895A (en) * | 1972-01-03 | 1974-10-29 | Millipore Corp | Filtration and incubation apparatus |
| CA923621A (en) * | 1972-10-16 | 1973-03-27 | W. Moll Edward | Multi-stage queuer system |
| US3925017A (en) * | 1973-05-01 | 1975-12-09 | Wisconsin Alumni Res Found | Preparation of dry, porous gel particles having high water regain for liquid sampling |
| JPS5659802A (en) * | 1979-10-23 | 1981-05-23 | Shinroihi Kk | Microspherical polymer particle and production thereof |
| US5310674A (en) * | 1982-05-10 | 1994-05-10 | Bar-Ilan University | Apertured cell carrier |
| SE8206708D0 (sv) * | 1982-11-16 | 1982-11-25 | Gambro Ab | Kolonn for anvendning i samband med skordning av antikroppar |
| US4734372A (en) * | 1983-02-04 | 1988-03-29 | Brown University Research Foundation | Cell culturing methods and apparatus |
| US4493815A (en) * | 1983-07-28 | 1985-01-15 | Bio-Rad Laboratories, Inc. | Supporting and filtering biochemical test plate assembly |
| JPH0823558B2 (ja) * | 1984-11-27 | 1996-03-06 | オ−ジエニクス リミテツド | 検定装置 |
| US4795698A (en) * | 1985-10-04 | 1989-01-03 | Immunicon Corporation | Magnetic-polymer particles |
| US4988618A (en) * | 1987-11-16 | 1991-01-29 | Gene-Trak Systems | Magnetic separation device and methods for use in heterogeneous assays |
| US4874499A (en) * | 1988-05-23 | 1989-10-17 | Massachusetts Institute Of Technology | Electrochemical microsensors and method of making such sensors |
| US5252294A (en) * | 1988-06-01 | 1993-10-12 | Messerschmitt-Bolkow-Blohm Gmbh | Micromechanical structure |
| US5156810A (en) * | 1989-06-15 | 1992-10-20 | Biocircuits Corporation | Biosensors employing electrical, optical and mechanical signals |
| US5480804A (en) * | 1989-06-28 | 1996-01-02 | Kirin Beverage Corporation | Method of and apparatus for detecting microorganisms |
| US5156951A (en) * | 1989-07-13 | 1992-10-20 | Becton Dickinson And Company | Detecting immunological changes in HIV infected patient samples |
| JP3127449B2 (ja) * | 1989-07-28 | 2001-01-22 | 三菱化学株式会社 | 抗体の測定法 |
| CA2024548C (fr) * | 1989-09-05 | 2002-05-28 | David Issachar | Capteur chimique specifique de certains analytes |
| US5541057A (en) * | 1989-09-18 | 1996-07-30 | Biostar, Inc. | Methods for detection of an analyte |
| US5137833A (en) * | 1989-09-21 | 1992-08-11 | Russell Anthony P | Method for detecting polyhydroxyl compounds |
| US5547682A (en) * | 1989-12-22 | 1996-08-20 | Bioquest, Incorporated | Preparation and use of novel injectable RES avoiding inorganic particles for medical application |
| US5183740A (en) * | 1990-02-23 | 1993-02-02 | The United States Of America As Represented By The Secretary Of The Navy | Flow immunosensor method and apparatus |
| US5223393A (en) * | 1990-06-12 | 1993-06-29 | Microgenics Corporation | Detection of analytes having binding sites for at least two binding moieties |
| US5235028A (en) * | 1990-08-31 | 1993-08-10 | University Of Minnesota | Polyethylene glycol derivatives for solid-phase applications |
| US5837552A (en) * | 1991-07-22 | 1998-11-17 | Medifor, Ltd. | Surface-enhanced analytical procedures and substrates |
| US5846708A (en) * | 1991-11-19 | 1998-12-08 | Massachusetts Institiute Of Technology | Optical and electrical methods and apparatus for molecule detection |
| US5262127A (en) * | 1992-02-12 | 1993-11-16 | The Regents Of The University Of Michigan | Solid state chemical micro-reservoirs |
| US5391272A (en) * | 1992-03-06 | 1995-02-21 | Andcare, Inc. | Electrochemical immunoassay methods |
| US5248742A (en) * | 1992-04-27 | 1993-09-28 | Gencorp Inc. | Unsaturated polyester-epoxy resin network composition |
| US5587128A (en) * | 1992-05-01 | 1996-12-24 | The Trustees Of The University Of Pennsylvania | Mesoscale polynucleotide amplification devices |
| NL9200902A (nl) * | 1992-05-21 | 1993-12-16 | Cornelis Johannes Maria Van Ri | Keramisch membraan voor microfiltratie, alsmede werkwijze ter vervaardiging van een dergelijk membraan. |
| FR2710410B1 (fr) * | 1993-09-20 | 1995-10-20 | Bio Merieux | Procédé et dispositif pour la détermination d'un analyte dans un échantillon . |
| WO1995011755A1 (fr) * | 1993-10-28 | 1995-05-04 | Houston Advanced Research Center | Dispositif a microstructure poreuse assurant un ecoulement permettant la detection des reactions de liaison |
| US6054287A (en) * | 1994-05-27 | 2000-04-25 | Methodist Hospital Of Indiana, Inc. | Cell-type-specific methods and devices for the low temperature preservation of the cells of an animal species |
| US5583162A (en) * | 1994-06-06 | 1996-12-10 | Biopore Corporation | Polymeric microbeads and method of preparation |
| AUPM807094A0 (en) * | 1994-09-09 | 1994-10-06 | Commonwealth Scientific And Industrial Research Organisation | Polymer beads and method for preparation thereof |
| US5585069A (en) * | 1994-11-10 | 1996-12-17 | David Sarnoff Research Center, Inc. | Partitioned microelectronic and fluidic device array for clinical diagnostics and chemical synthesis |
| EP0791238B1 (fr) * | 1994-11-10 | 2004-09-22 | Orchid BioSciences, Inc. | Systeme de distribution de liquide |
| US5603351A (en) * | 1995-06-07 | 1997-02-18 | David Sarnoff Research Center, Inc. | Method and system for inhibiting cross-contamination in fluids of combinatorial chemistry device |
| US5616790A (en) * | 1994-11-18 | 1997-04-01 | California Institute Of Technology | Lipid-based metal sensor |
| US5550373A (en) * | 1994-12-30 | 1996-08-27 | Honeywell Inc. | Fabry-Perot micro filter-detector |
| US5608519A (en) * | 1995-03-20 | 1997-03-04 | Gourley; Paul L. | Laser apparatus and method for microscopic and spectroscopic analysis and processing of biological cells |
| US5856174A (en) * | 1995-06-29 | 1999-01-05 | Affymetrix, Inc. | Integrated nucleic acid diagnostic device |
| US6168948B1 (en) * | 1995-06-29 | 2001-01-02 | Affymetrix, Inc. | Miniaturized genetic analysis systems and methods |
| US5690807A (en) * | 1995-08-03 | 1997-11-25 | Massachusetts Institute Of Technology | Method for producing semiconductor particles |
| US5714122A (en) * | 1995-11-22 | 1998-02-03 | Minnesota Mining And Manufacturing Company | Emulsion for robust sensing |
| US6127139A (en) * | 1996-01-04 | 2000-10-03 | Nederlands Organisatle Voor Toegepast-Natuurwetenschappelijk Onderzoek (Tno) | Method for assaying proteolytic enzymes using fluorescence-quenched substrates |
| US5747349A (en) * | 1996-03-20 | 1998-05-05 | University Of Washington | Fluorescent reporter beads for fluid analysis |
| US5840256A (en) * | 1996-04-09 | 1998-11-24 | David Sarnoff Research Center Inc. | Plate for reaction system |
| US5788814A (en) * | 1996-04-09 | 1998-08-04 | David Sarnoff Research Center | Chucks and methods for positioning multiple objects on a substrate |
| US5942443A (en) * | 1996-06-28 | 1999-08-24 | Caliper Technologies Corporation | High throughput screening assay systems in microscale fluidic devices |
| US6103479A (en) * | 1996-05-30 | 2000-08-15 | Cellomics, Inc. | Miniaturized cell array methods and apparatus for cell-based screening |
| US5770370A (en) * | 1996-06-14 | 1998-06-23 | David Sarnoff Research Center, Inc. | Nuclease protection assays |
| US5854684A (en) * | 1996-09-26 | 1998-12-29 | Sarnoff Corporation | Massively parallel detection |
| US5872623A (en) * | 1996-09-26 | 1999-02-16 | Sarnoff Corporation | Massively parallel detection |
| US6083761A (en) * | 1996-12-02 | 2000-07-04 | Glaxo Wellcome Inc. | Method and apparatus for transferring and combining reagents |
| US5779907A (en) * | 1996-12-06 | 1998-07-14 | Systems Research Laboratories, Inc. | Magnetic microplate separator |
| JP4663824B2 (ja) * | 1996-12-31 | 2011-04-06 | ハイ スループット ジェノミクス インコーポレイテッド | 多重化分子分析装置および方法 |
| US5827748A (en) * | 1997-01-24 | 1998-10-27 | The United States Of America As Represented By The Secretary Of The Navy | Chemical sensor using two-dimensional lens array |
| US6023540A (en) * | 1997-03-14 | 2000-02-08 | Trustees Of Tufts College | Fiber optic sensor with encoded microspheres |
| US6171780B1 (en) * | 1997-06-02 | 2001-01-09 | Aurora Biosciences Corporation | Low fluorescence assay platforms and related methods for drug discovery |
| US5985120A (en) * | 1997-06-12 | 1999-11-16 | University Of Massachusetts | Rapid analysis of analyte solutions |
| US5922617A (en) * | 1997-11-12 | 1999-07-13 | Functional Genetics, Inc. | Rapid screening assay methods and devices |
| US6074616A (en) * | 1998-01-05 | 2000-06-13 | Biosite Diagnostics, Inc. | Media carrier for an assay device |
| JP3468750B2 (ja) * | 1998-01-22 | 2003-11-17 | ルミネックス コーポレイション | 多数の蛍光シグナルを有する微小粒子 |
| US6210910B1 (en) * | 1998-03-02 | 2001-04-03 | Trustees Of Tufts College | Optical fiber biosensor array comprising cell populations confined to microcavities |
| JP3944996B2 (ja) * | 1998-03-05 | 2007-07-18 | 株式会社日立製作所 | Dnaプローブアレー |
| US6692696B1 (en) * | 1998-06-18 | 2004-02-17 | ARETé ASSOCIATES | Biosensor |
| US6151973A (en) * | 1999-01-29 | 2000-11-28 | Glaxo Wellcome Inc. | Bead picking apparatus and method |
| CN1185492C (zh) * | 1999-03-15 | 2005-01-19 | 清华大学 | 可单点选通式微电磁单元阵列芯片、电磁生物芯片及应用 |
| US6485690B1 (en) * | 1999-05-27 | 2002-11-26 | Orchid Biosciences, Inc. | Multiple fluid sample processor and system |
| US6219566B1 (en) * | 1999-07-13 | 2001-04-17 | Photonics Research Ontario | Method of measuring concentration of luminescent materials in turbid media |
| US6514415B2 (en) * | 2000-01-31 | 2003-02-04 | Dexter Magnetic Technologies, Inc. | Method and apparatus for magnetic separation of particles |
| DK1349958T3 (da) * | 2000-09-26 | 2009-09-21 | Boston Probes Inc | Prober, probesæt, fremgangsmåder og kits til at opnå påvisning, identifikation og/eller tælling af bakterier |
| US6591124B2 (en) * | 2001-05-11 | 2003-07-08 | The Procter & Gamble Company | Portable interstitial fluid monitoring system |
| EP2311934B1 (fr) * | 2001-09-06 | 2013-06-05 | Rapid Micro Biosystems, Inc. | Détection rapide de cellules proliférantes |
| US6709868B2 (en) * | 2002-05-20 | 2004-03-23 | Portascience Inc. | Method and apparatus for measuring white blood cell count |
| US20060257991A1 (en) * | 2004-02-27 | 2006-11-16 | Mcdevitt John T | Integration of fluids and reagents into self-contained cartridges containing particle-based sensor elements and membrane-based sensor elements |
| US20060257854A1 (en) * | 2004-02-27 | 2006-11-16 | Mcdevitt John T | Membrane assay system including preloaded particles |
| US8101431B2 (en) * | 2004-02-27 | 2012-01-24 | Board Of Regents, The University Of Texas System | Integration of fluids and reagents into self-contained cartridges containing sensor elements and reagent delivery systems |
| US8105849B2 (en) * | 2004-02-27 | 2012-01-31 | Board Of Regents, The University Of Texas System | Integration of fluids and reagents into self-contained cartridges containing sensor elements |
-
2003
- 2003-07-24 WO PCT/US2003/023131 patent/WO2004009840A1/fr active Application Filing
- 2003-07-24 EP EP03765999A patent/EP1546367A4/fr not_active Ceased
- 2003-07-24 AU AU2003256742A patent/AU2003256742A1/en not_active Abandoned
- 2003-07-24 JP JP2004523376A patent/JP2005533502A/ja active Pending
- 2003-07-24 EP EP08168266A patent/EP2107120A1/fr not_active Withdrawn
- 2003-07-24 CA CA002494727A patent/CA2494727A1/fr not_active Abandoned
-
2005
- 2005-01-24 US US10/470,646 patent/US20060073585A1/en not_active Abandoned
- 2005-01-24 US US10/522,499 patent/US20060079000A1/en not_active Abandoned
Patent Citations (20)
| Publication number | Priority date | Publication date | Assignee | Title |
|---|---|---|---|---|
| US287248A (en) | 1883-10-23 | Stalk-cutter | ||
| US354882A (en) | 1886-12-28 | Thomas w | ||
| US616355A (en) | 1898-12-20 | Locomotive-coaling device | ||
| US616731A (en) | 1898-12-27 | Friedrich ludwig albert riemann | ||
| US616482A (en) | 1898-12-27 | Toy cue | ||
| US72800A (en) | 1867-12-31 | Eben m | ||
| US775340A (en) | 1902-07-09 | 1904-11-22 | John Howard Mcelroy | Locked-seam-can-body machine. |
| US775048A (en) | 1902-07-14 | 1904-11-15 | Charles W Stevenson | Fruit-box. |
| US775342A (en) | 1903-12-08 | 1904-11-22 | Ernst Abee | Cardiac truss. |
| US775343A (en) | 1904-02-02 | 1904-11-22 | John Alexander Cook | Traveling bag, case, &c. |
| US775344A (en) | 1904-02-12 | 1904-11-22 | William R Bradford | Buggy-boot spring. |
| US775353A (en) | 1904-02-23 | 1904-11-22 | Zeiss Carl | Lens combination for producing virtual images. |
| US4317726A (en) * | 1981-02-12 | 1982-03-02 | The United States Of America As Represented By The Secretary Of The Army | Microbial filter assembly |
| FR2677664A1 (fr) * | 1991-06-13 | 1992-12-18 | Millipore Sa | Dispositif et procede de controle microbiologique des liquides sous pression. |
| US5905038A (en) * | 1995-05-25 | 1999-05-18 | Severn Trent Water Limited | Filtration and culture methods and apparatus |
| NL1007489C2 (nl) * | 1996-11-08 | 2000-10-24 | Konink Grolsch N V | Werkwijze en inrichting voor het in een medium aantonen van micro-organismen. |
| US6217636B1 (en) | 1998-03-13 | 2001-04-17 | The Texas A&M University System | Transpirated wall aerosol collection system and method |
| WO2000004372A1 (fr) * | 1998-07-16 | 2000-01-27 | The Board Of Regents, The University Of Texas System | Mosaique de capteurs permettant de mesurer et d'identifier des analytes multiples dans les solutions |
| US20020045272A1 (en) | 2000-01-31 | 2002-04-18 | Mcdevitt John T. | Method and apparatus for the delivery of samples to a chemical sensor array |
| US7280002B2 (en) | 2005-03-03 | 2007-10-09 | Avago Technologies General Ip Pte Ltd | Method and apparatus for biasing a metal-oxide-semiconductor capacitor for capacitive tuning |
Non-Patent Citations (1)
| Title |
|---|
| CHRISTODOULIDES N ET AL: "A microchip-based multianalyte assay system for the assessment of cardiac risk", ANALYTICAL CHEMISTRY 20020701 AMERICAN CHEMICAL SOCIETY US, vol. 74, no. 13, 1 July 2002 (2002-07-01), pages 3030 - 3036, XP002531646 * |
Cited By (24)
| Publication number | Priority date | Publication date | Assignee | Title |
|---|---|---|---|---|
| US9833748B2 (en) | 2010-08-25 | 2017-12-05 | Lockheed Martin Corporation | Perforated graphene deionization or desalination |
| CN102207444B (zh) * | 2011-03-17 | 2012-10-03 | 上海理工大学 | 一种图像法颗粒分析仪 |
| CN102207444A (zh) * | 2011-03-17 | 2011-10-05 | 上海理工大学 | 一种图像法颗粒分析仪 |
| US10653824B2 (en) | 2012-05-25 | 2020-05-19 | Lockheed Martin Corporation | Two-dimensional materials and uses thereof |
| US9423234B2 (en) | 2012-11-05 | 2016-08-23 | The Regents Of The University Of California | Mechanical phenotyping of single cells: high throughput quantitative detection and sorting |
| US10302408B2 (en) | 2012-11-05 | 2019-05-28 | The Regents Of The University Of California | Mechanical phenotyping of single cells: high throughput quantitative detection and sorting |
| US10201784B2 (en) | 2013-03-12 | 2019-02-12 | Lockheed Martin Corporation | Method for forming perforated graphene with uniform aperture size |
| US10471199B2 (en) | 2013-06-21 | 2019-11-12 | Lockheed Martin Corporation | Graphene-based filter for isolating a substance from blood |
| US10500546B2 (en) | 2014-01-31 | 2019-12-10 | Lockheed Martin Corporation | Processes for forming composite structures with a two-dimensional material using a porous, non-sacrificial supporting layer |
| US9744617B2 (en) | 2014-01-31 | 2017-08-29 | Lockheed Martin Corporation | Methods for perforating multi-layer graphene through ion bombardment |
| US9870895B2 (en) | 2014-01-31 | 2018-01-16 | Lockheed Martin Corporation | Methods for perforating two-dimensional materials using a broad ion field |
| US9834809B2 (en) | 2014-02-28 | 2017-12-05 | Lockheed Martin Corporation | Syringe for obtaining nano-sized materials for selective assays and related methods of use |
| US9610546B2 (en) | 2014-03-12 | 2017-04-04 | Lockheed Martin Corporation | Separation membranes formed from perforated graphene and methods for use thereof |
| US9844757B2 (en) | 2014-03-12 | 2017-12-19 | Lockheed Martin Corporation | Separation membranes formed from perforated graphene and methods for use thereof |
| US10005038B2 (en) | 2014-09-02 | 2018-06-26 | Lockheed Martin Corporation | Hemodialysis and hemofiltration membranes based upon a two-dimensional membrane material and methods employing same |
| US10418143B2 (en) | 2015-08-05 | 2019-09-17 | Lockheed Martin Corporation | Perforatable sheets of graphene-based material |
| US10696554B2 (en) | 2015-08-06 | 2020-06-30 | Lockheed Martin Corporation | Nanoparticle modification and perforation of graphene |
| US10376845B2 (en) | 2016-04-14 | 2019-08-13 | Lockheed Martin Corporation | Membranes with tunable selectivity |
| US10213746B2 (en) | 2016-04-14 | 2019-02-26 | Lockheed Martin Corporation | Selective interfacial mitigation of graphene defects |
| US10203295B2 (en) | 2016-04-14 | 2019-02-12 | Lockheed Martin Corporation | Methods for in situ monitoring and control of defect formation or healing |
| US10118130B2 (en) | 2016-04-14 | 2018-11-06 | Lockheed Martin Corporation | Two-dimensional membrane structures having flow passages |
| US10017852B2 (en) | 2016-04-14 | 2018-07-10 | Lockheed Martin Corporation | Method for treating graphene sheets for large-scale transfer using free-float method |
| US10980919B2 (en) | 2016-04-14 | 2021-04-20 | Lockheed Martin Corporation | Methods for in vivo and in vitro use of graphene and other two-dimensional materials |
| US10981120B2 (en) | 2016-04-14 | 2021-04-20 | Lockheed Martin Corporation | Selective interfacial mitigation of graphene defects |
Also Published As
| Publication number | Publication date |
|---|---|
| EP1546367A4 (fr) | 2006-08-16 |
| WO2004009840A9 (fr) | 2004-05-13 |
| US20060079000A1 (en) | 2006-04-13 |
| EP1546367A1 (fr) | 2005-06-29 |
| AU2003256742A1 (en) | 2004-02-09 |
| JP2005533502A (ja) | 2005-11-10 |
| US20060073585A1 (en) | 2006-04-06 |
| WO2004009840A1 (fr) | 2004-01-29 |
| CA2494727A1 (fr) | 2004-01-29 |
Similar Documents
| Publication | Publication Date | Title |
|---|---|---|
| EP2107120A1 (fr) | Capture et détection des microbes par des procédés de membrane | |
| US7781226B2 (en) | Particle on membrane assay system | |
| US8101431B2 (en) | Integration of fluids and reagents into self-contained cartridges containing sensor elements and reagent delivery systems | |
| US8105849B2 (en) | Integration of fluids and reagents into self-contained cartridges containing sensor elements | |
| EP1735618A2 (fr) | Systeme et procede d'integration de fluides et de reactifs dans des cartouches autonomes contenant des detecteurs de membrane et de particules | |
| US20060257854A1 (en) | Membrane assay system including preloaded particles | |
| CA2759764C (fr) | Procedes et algorithmes pour le comptage de cellules dans un cytometre peu onereux | |
| US20060257941A1 (en) | Integration of fluids and reagents into self-contained cartridges containing particle and membrane sensor elements | |
| US20060257991A1 (en) | Integration of fluids and reagents into self-contained cartridges containing particle-based sensor elements and membrane-based sensor elements | |
| JP6336496B2 (ja) | アコースティックフローサイトメトリーのための装置、システム、方法、およびコンピュータ読み取り可能な媒体 | |
| EP1558934B1 (fr) | Procede d'evaluation de particules | |
| US6225046B1 (en) | Method for detecting microorganisms | |
| JP4782844B2 (ja) | 少なくとも2つの細胞集団を区別する方法及び応用 | |
| US20230194522A1 (en) | Methods and kits for assaying a large fluid volume using flow cytometry | |
| Neikirk et al. | Integration of fluids and reagents into self-contained cartridges containing sensor elements |
Legal Events
| Date | Code | Title | Description |
|---|---|---|---|
| PUAI | Public reference made under article 153(3) epc to a published international application that has entered the european phase |
Free format text: ORIGINAL CODE: 0009012 |
|
| AC | Divisional application: reference to earlier application |
Ref document number: 1546367 Country of ref document: EP Kind code of ref document: P |
|
| AK | Designated contracting states |
Kind code of ref document: A1 Designated state(s): AT BE BG CH CY CZ DE DK EE ES FI FR GB GR HU IE IT LI LU MC NL PT RO SE SI SK TR |
|
| 17P | Request for examination filed |
Effective date: 20100406 |
|
| 17Q | First examination report despatched |
Effective date: 20100518 |
|
| AKX | Designation fees paid |
Designated state(s): AT BE BG CH CY CZ DE DK EE ES FI FR GB GR HU IE IT LI LU MC NL PT RO SE SI SK TR |
|
| STAA | Information on the status of an ep patent application or granted ep patent |
Free format text: STATUS: THE APPLICATION IS DEEMED TO BE WITHDRAWN |
|
| 18D | Application deemed to be withdrawn |
Effective date: 20101130 |