EP2106536B1 - Spectrometric investigation of heterogeneity - Google Patents
Spectrometric investigation of heterogeneity Download PDFInfo
- Publication number
- EP2106536B1 EP2106536B1 EP08705498.7A EP08705498A EP2106536B1 EP 2106536 B1 EP2106536 B1 EP 2106536B1 EP 08705498 A EP08705498 A EP 08705498A EP 2106536 B1 EP2106536 B1 EP 2106536B1
- Authority
- EP
- European Patent Office
- Prior art keywords
- particles
- particle
- spectrometer
- image
- operative
- Prior art date
- Legal status (The legal status is an assumption and is not a legal conclusion. Google has not performed a legal analysis and makes no representation as to the accuracy of the status listed.)
- Active
Links
Images











Classifications
-
- G—PHYSICS
- G01—MEASURING; TESTING
- G01J—MEASUREMENT OF INTENSITY, VELOCITY, SPECTRAL CONTENT, POLARISATION, PHASE OR PULSE CHARACTERISTICS OF INFRARED, VISIBLE OR ULTRAVIOLET LIGHT; COLORIMETRY; RADIATION PYROMETRY
- G01J3/00—Spectrometry; Spectrophotometry; Monochromators; Measuring colours
- G01J3/02—Details
-
- G—PHYSICS
- G01—MEASURING; TESTING
- G01J—MEASUREMENT OF INTENSITY, VELOCITY, SPECTRAL CONTENT, POLARISATION, PHASE OR PULSE CHARACTERISTICS OF INFRARED, VISIBLE OR ULTRAVIOLET LIGHT; COLORIMETRY; RADIATION PYROMETRY
- G01J3/00—Spectrometry; Spectrophotometry; Monochromators; Measuring colours
- G01J3/02—Details
- G01J3/0205—Optical elements not provided otherwise, e.g. optical manifolds, diffusers, windows
- G01J3/021—Optical elements not provided otherwise, e.g. optical manifolds, diffusers, windows using plane or convex mirrors, parallel phase plates, or particular reflectors
-
- G—PHYSICS
- G01—MEASURING; TESTING
- G01J—MEASUREMENT OF INTENSITY, VELOCITY, SPECTRAL CONTENT, POLARISATION, PHASE OR PULSE CHARACTERISTICS OF INFRARED, VISIBLE OR ULTRAVIOLET LIGHT; COLORIMETRY; RADIATION PYROMETRY
- G01J3/00—Spectrometry; Spectrophotometry; Monochromators; Measuring colours
- G01J3/02—Details
- G01J3/0289—Field-of-view determination; Aiming or pointing of a spectrometer; Adjusting alignment; Encoding angular position; Size of measurement area; Position tracking
-
- G—PHYSICS
- G01—MEASURING; TESTING
- G01J—MEASUREMENT OF INTENSITY, VELOCITY, SPECTRAL CONTENT, POLARISATION, PHASE OR PULSE CHARACTERISTICS OF INFRARED, VISIBLE OR ULTRAVIOLET LIGHT; COLORIMETRY; RADIATION PYROMETRY
- G01J3/00—Spectrometry; Spectrophotometry; Monochromators; Measuring colours
- G01J3/28—Investigating the spectrum
- G01J3/2823—Imaging spectrometer
-
- G—PHYSICS
- G01—MEASURING; TESTING
- G01N—INVESTIGATING OR ANALYSING MATERIALS BY DETERMINING THEIR CHEMICAL OR PHYSICAL PROPERTIES
- G01N15/00—Investigating characteristics of particles; Investigating permeability, pore-volume or surface-area of porous materials
- G01N15/10—Investigating individual particles
- G01N15/14—Optical investigation techniques, e.g. flow cytometry
- G01N15/1429—Signal processing
- G01N15/1433—Signal processing using image recognition
-
- G—PHYSICS
- G01—MEASURING; TESTING
- G01N—INVESTIGATING OR ANALYSING MATERIALS BY DETERMINING THEIR CHEMICAL OR PHYSICAL PROPERTIES
- G01N15/00—Investigating characteristics of particles; Investigating permeability, pore-volume or surface-area of porous materials
- G01N15/10—Investigating individual particles
- G01N15/14—Optical investigation techniques, e.g. flow cytometry
- G01N2015/1486—Counting the particles
-
- G—PHYSICS
- G01—MEASURING; TESTING
- G01N—INVESTIGATING OR ANALYSING MATERIALS BY DETERMINING THEIR CHEMICAL OR PHYSICAL PROPERTIES
- G01N15/00—Investigating characteristics of particles; Investigating permeability, pore-volume or surface-area of porous materials
- G01N15/10—Investigating individual particles
- G01N15/14—Optical investigation techniques, e.g. flow cytometry
- G01N2015/1497—Particle shape
Definitions
- This invention pertains to instrumentation, including particle image analyzers with spectrometric capabilities.
- Particle image analyzers are well-known instruments that can use image analysis techniques to allow users to automatically acquire and analyze images of a large number of particles. These instruments can then provide statistical information about the size and shape of particles.
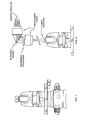
- Fig. 1 shows one example of such a system, the Morphologi® Particle Image Analyzer available from Malvern Instruments, Inc. of Malvern UK. This system is described in a section of the specification of this document.
- Spectral imaging techniques have also been applied to the analysis of large numbers of particles. These systems can provide statistical information about the distribution of chemical species in the particles. Systems of this type are described in more detail in US published application no 20060282223 .
- EP 0 780 671 discloses a spectrophotometer with a camera for taking a picture of the sample surface. The picture is shown on a screen, and an operator manually uses a window to select a place (spot or area) for a spectrophotometric measurement.
- US 2003/0147066 discloses a method for analysing pharmaceutical specimens by producing an image of the sample (e.g. by environmental scanning electron microscope) and using the image to select a position, at which scattered radiation at the position is detected to determine molecular data.
- WO 2006/044861 discloses a method of obtaining information about a heterogeneous pharmaceutical specimen. The method involves staining the sample, and then identifying locations by microscopy, based on colour, for further analysis by a spectrometer (e.g. Raman, near infra-red (NIR), mid-IR).
- a spectrometer e.g. Raman, near infra-red (NIR), mid-IR.
- EP 1 526 373 discloses a biomolecule analyser, comprising means for obtaining an image of the sample, designation means for designating a point on the image, arrangement means for arranging the point for measurement, measurement means for measuring a signal at the point, and analysis means for analysing the measured signal.
- the imaging means may be a scanning confocal microscope, and the analysing means may be a fluorescence correlation spectroscope.
- the designation may be based on an observer discovering fluorescent light emitted during imaging.
- US 7 061 606 discloses a chemical imaging system which illuminates an area of a sample with light in the visible waveband and NIR waveband. A multitude of spatially resolved spectra of transmitted, reflected, emitted or scattered NIR light are collected and imaged. The visible light is simultaneously detected, thereby providing simultaneous visible imaging and NIR chemical analysis.
- WO 2004/086503 discloses a method of generating intra-particle crystallographic parameter maps and histograms of a chemically pure particulate substance.
- Spectral imaging in particular focus-fusion multi-layer spectral imaging, combined with pattern recognition and classification analysis are performed on individual particles for forming sets of single-particle spectral fingerprint data, characterised by single-particle spectral fingerprint data.
- Pattern recognition and classification analysis is performed on spectral fingerprint data for each particle to classify the particle.
- WO 03/060442 discloses a spectrometric process monitoring apparatus that includes an array of detector elements. The elements are responsive to incident radiation to produce an output signal that includes information from the incident radiation. A spectrally sensitive element is located in an optical path between the radiation sources and the array with an analysis module operative to analyse spatial distribution of spectral information received by the array.
- the invention features a particle analyser comprising spectroscopic apparatus for investigating heterogeneity of a sample area as defined in claim 1 as well as a spectroscopic method as defined in claim 9.
- the apparatus includes an image acquisition system operative to acquire images of a plurality of individual particles in the sample area and a particle selection interface. operative to receive a selection designating one of the particles for which an image has been obtained.
- a spectrometer has a field of view and is operative to acquire a spectrum of at least part of one of the particles in its field of view, and a positioning mechanism is responsive to the particle selection interface and operative to position the field of view of the spectrometer relative to the sample area based on a received selection.
- the positioning mechanism can include electromechanical elements.
- the positioning mechanism can include an x-y stage responsive to x-y coordinate information from the particle selection interface.
- the apparatus can further include analysis logic operative to analyze the images acquired by the image acquisition system.
- the particle selection interface is responsive to the analysis logic to select particles having predetermined morphological characteristics.
- the analysis logic can include statistical analysis logic, sorting logic, and/or contaminant detection logic.
- the spectrometer can be an infrared spectrometer.
- the spectrometer can be a Raman spectrometer.
- the area is an area of dispersed particles with the sub-areas being individual particles in the area of dispersed particles.
- the image acquisition system can operate in the visible range.
- the apparatus can further include a mapping module responsive to the image acquisition system and to the spectrometer and operative to create a map that presents spectral information for each of the sub-areas from the spectrometer at a location from which it was received.
- the mapping module can be operative to superimpose the spectral information onto an image from the image acquisition system.
- the mapping module can map point measurement values to larger areas having matching physical characteristics.
- the mapping module can also be operative to indicate statistical properties of mapped areas.
- the method can further include the steps of deriving physical information about the one of the sub-areas, and setting a spectral range of the step of acquiring in response to the physical information.
- Systems according to the invention can be advantageous in that they allow for spectrometric imaging and screening without the expense and time that may be required by array-based infrared chemical imaging systems.
- an illustrative system 10 includes a spectrometer 22 in addition to the microscope body 12, x-y stage 14, and camera 16.
- the spectrometer can use the same microscope optics as the camera either by swapping them or using an optical switch to alternate between them.
- a laser source can also pass its beam through the same optics, such as through the use of a beam splitter 24.
- Results from the camera and computer are also preferably analyzed and presented on a same computer (e.g., a PC workstation).
- a system employing macroscopic optics could be used instead of microscopic optics.
- the camera could acquire its images in a variety of ways, such as by using a Charge Coupled Device (CCD) to acquire grayscale or color images in the visible wavelength range.
- CCD Charge Coupled Device
- These apparatuses can also employ any type of spectrometric detection, such as methods based on gratings or interference.
- NIR spectrometry other types of spectrometry could be used as well, such as mid-infrared spectrometry, Raman spectrometry, or fluorescence spectrometry.
- the system first acquires a visible image of a sample area, such as a dry dispersion of particles from a pharmaceutical raw material.
- the system can then provide the user a series of images of individual particles. This can allow the user to select one of the particles and then cause the system to obtain a spectrum of that particle by moving the x-y to position the selected particle in a field of view of the spectrometer (see Fig. 3B ).
- a visible image of a sample area such as a dry dispersion of particles from a pharmaceutical raw material.
- the system can then provide the user a series of images of individual particles. This can allow the user to select one of the particles and then cause the system to obtain a spectrum of that particle by moving the x-y to position the selected particle in a field of view of the spectrometer (see Fig. 3B ).
- Other types of mechanisms for moving the sample relative to the spectrometer's field of view are possible, such as by moving mirrors, or even moving the spectrometer itself. Some can
- the system can also select particles automatically.
- Results of statistical or other types of image or numerical analysis can be used to determine which particles to select based on morphological differences. For example, the smallest, largest, most spherical, darkest, or lightest particles could be selected automatically (e.g., compare Figs. 3A and 3B with Figs. 4A and 4B ). Combinations of morphological, physical, colorimetric, or other attributes could be used as well.
- the system can also be applied to other types of samples, such as coarse or fine particulates and heterogeneous liquids or surfaces. More specific examples can include items such as manufactured products, seeds, cattle feed, biological cells or other bounded biological entities such as spores, organelles, or bacteria. Other types of operations can also be applied to selected areas by the system. A particle could be mechanically extracted for disposal or further processing, for example.
- particles having different transparencies could be processed by the system.
- most particles are semi-transparent and produce low intensity images, while some are darker and result in higher contrast images (see Fig. 6A ).
- Fig. 6B statistical processing by the system can reveal that the transparency distribution for this sample has two peaks-one large one for the most common, more transparent, particles and one small one for the less common, darker, particles.
- the system can then produce one or more spectra for a variety of salient points in this distribution, such as at the centroids of its peaks or their outlying edges (see Fig. 6C ).
- spectra can then be displayed to the user or compared to known spectra in a spectral library or processed by a variety of multivariate or chemometrics means. These processing operations can derive information about the chemical origin or identification of the selected object or more fundamental information about the molecular or crystal structure.
- systems according to the invention can also use a sparse image information acquisition and/or mapping mode.
- the system can obtain a first image of a sample area in which information of interest is relatively sparse.
- This image may include a sparse set of entities of interest separated by background space, such as the dispersed pharmaceutical formulation shown in Fig. 8 , or it may include any other type of image in which only a small number of image sub-areas are of interest.
- one traditional prior art method of acquiring spectral information for a sample area is to acquire a full spectrum for every point to derive a full spectral hyperspectral data cube for the sample.
- This data cube includes an x-y image of the sample at each of a series of wavelengths X, with a vector v in the wavelength axis corresponding to a single point spectrum.
- Much effort has been expended to build highspeed imaging spectrometers that can create full hyperspectral data cubes quickly.
- Systems according to the invention operate differently. These systems first employ a preliminary imaging detection subsystem to select particles of interest. This step can be automatic or semi-automatic, and can be based on a variety of information about the sample, such as morphology, colorimetry, statistical properties, or pattern recognition. It is also preferably quick and/or inexpensive to perform, because it operates at visible wavelengths, for example.
- the particles selected by the preliminary imaging subsystem are identified to a spectrometry system, such as in the form of a list of particle centroids communicated electronically.
- the system can cause the spectrometer to obtain one or more spectra for each of the particles of interest by moving the position of an x-y stage to the selected particles in a field of view of the spectrometer.
- the spectrometer can even operate passively, such as by gravity or convection.
- the values from the spectrometer are mapped to locations in a sparse hyperspectral data cube that correspond to the respective locations of sub-areas of interest, such as particles.
- This mapping can take a variety of forms, such a single-sample, geometric map, in which each sub-area is represented by a geometrically accurate sub-area shape exhibiting a single representational treatment (e.g., a color or a hatching pattern).
- Each shape in this type of map corresponds to a single spectral measurement of a single particle, such as one taken at its centroid (see Fig. 10A ).
- each shape has a perimeter that matches the perimeter of its respective particle and is located in the image at a location that corresponds to its location in the sample area.
- the result is a map that can resemble a map derived from a full spectral scan of the sample area, but includes little or no data outside the regions of interest.
- the different types of particles in the formulation could be mapped to different colors on a white background. Or they could be mapped to different hatching patterns, as shown in Fig. 11 .
- a multi-sample, geometric map can be used as well, in which each sub-area is actually a small spectral image of the sample with a plurality of pixels each corresponding to one of several differently located spectral measurements for different parts of the sub-area.
- Multi-sample maps can also display a single treatment for each sub-area, where the treatment is defined by the results of multiple samples (see Fig. 10B ). For example, a median wavelength response for a series of measurements taken over different parts of a sub-area could be computed and displayed as a color.
- Suitable techniques used for obtaining multiple samples for a sub-area, including statistical techniques, are described, for example, in copending application no.. 60/860,345 , entitled SPECTROMETRIC CHARACTERIZATION OF PHARMACEUTICAL HETEROGENEITY, filed on November 20, 2006.
- the system can produce maps in a variety of ways. It may produce them by superimposing results from the spectrometer onto the image produced by the preliminary imaging system, for example, or it may produce them using the results of the preliminary imaging system as a starting point for a mask. They maps can also be produced based only on the location and/or morphology information received from the preliminary imaging system.
- the data sets can be stored in a variety of ways. They can be stored in much the same way would be a full hyperspectral data cube, except that non-sampled areas would be represented as empty, such as through the use of an IEEE 754 floating point NaN symbol (Not a Number). They can also be stored in a more compact format to reduce data storage requirments. This format could include a data structure that holds the received spectra and their coordinates, for example, or it could employ one of more of a variety of known data compression methods suitable for encoding sparse data sets, such as Run Length Encoding (RLE). To display a map or image plane from a compactly stored data cube, the system would have to decompress or otherwise reconstruct the map or image.
- RLE Run Length Encoding
- the maps and data sets may also be spatially compressed. If each sub-area only corresponds to a single measurement, for example, the data could be presented and stored at a much lower resolution that that of the preliminary imaging system. And in some applications, it may be suitable to represent each sub-area with a representation that does not conform to the shape of the sub-areas, such as an individual pixel, or even a symbol. All of the above techniques can permit faster acquisition times, processing times, and/or storage requirements by reducing redundant or unimportant operations and/or spatial data.
- the data sets, maps, and spectral measurements may also exhibit spectral sparseness.
- the selections presented by the preliminary imaging system can define which wavelengths should be used for different sub-areas of a sample area, for example, such as by adjusting an excitation frequency (e.g., selecting a laser frequency) or selecting a sensitivity range for the spectrometer. This approach can further reduce acquisition times, processing times, and/or storage requirements by reducing redundant or unimportant operations and/or spectral data.
- Once maps have been created, they can be displayed, stored, or serve as the basis for further investigation or processing.
- Systems according to the invention can be created using a specially programmed general purpose computer, dedicated hardware, or a combination of both.
- the system is based on a Microsoft Windows® -based computer system, but other platforms could be used as well.
- the following section describes a particle analyzer suitable for use in connection with embodiments of the invention.
- This analyzer is sold under the name "Morpohologi G2" by Malvern Instruments Limited of Malvern, Worcestershire UK.
- the Morphologi G2 high sensitivity particle analyzer is more than just a microscope. It brings together the very best hardware and software in a single integrated package and provides the very highest level of automation and validation of results. It provides repeatable and routine characterization of particle size, shape and count.
- the Morphologi G2 is equipped with the renowned Nikon CFI 60 optical system coupled with a high resolution digital camera for high definition aberration-free images. Microscope-quality images and statistically significant histograms offer both qualitative and quantitative information which can eliminate operator bias and saves precious man-hours. In R&D, process analysis or quality control, the Morphologi G2 delivers reliable, repeatable and validated results in minutes. It can analyze 100s of thousands of particles at the push of a button, provide particle shape and count as well as size information, record high resolution images of every particle, automatically select optics, focus and light intensity control, provide technical compliance with 21CFR Part 11, and provide a dedicated sample preparation device. Usage of the system is illustrated Table 1, with reference to Figs. 13-17 . Table 1 Step Description Comments Fig.
- Method Development Generate basic information on sample such as size range.
- a "manual microscope” mode is available to quickly move around and view the sample in order to check basics such a dispersion quality or the approximate size rage. It employs a virtual joystick and focus, light and magnification controls.
- 13 Optimize sample dispersion conditions.
- Standard Operating Procedure (SOP) Creation Optimize and select all software and hardware variables.
- a "wizard” assists in the generation of SOPs.
- a mouse-controlled scan area selection tool is available.
- 14 All variables captured in a single file that can be emailed around the world.
- Sample Measurement The software selects the magnification and calibrates against a grating. During data acquisition, status messages keep the operator informed of progress.
- a settings icon allows for modification of SOP settings.
- Quick start icon and status message bar are also provided along with a live view of the measurement frame.
- 15 - Light intensity and focus position are all controlled by software.
- Result Viewing/editing View information on each individual particle or the statistics of whole distribution
- Images of all particles are recorded and can be sorted and filtered on any shape parameter and new records created with the filtered data. Particles can be sorted and filtered on any parameter.
- a sidebar shows a morphological parameter list for a highlighted particle.
- 16 Sort and filter particles and create new records with certain particles excluded.
- the Report Designer can be used to customize the contents of these reports. Any morphological parameter can be plotted on the x-axis. The user can choose frequency, undersize, or oversize graph types, and can add specific parameters or logos or other graphics.
- 17 - Report Designer can be used to customize the style and content
- Table 2 Parameter Example value Definition ID 516 Unique ID of the particle - allocated in the order that the particles are detected Magnification 2.50 Magnification used to make the measurement CE diameter ( ⁇ m) 904.14
- the diameter of a circle with the same area as the particle Length ( ⁇ m) 1306.35 All possible lines from one point of the perimeter to another point on the perimeter are projected on the major axis (axis of minimum rotational energy). The maximum length of these projections is the length of the object.
- Width ( ⁇ m) 678.54 All possible lines from one point of the perimeter to another point on the perimeter are projected on the minor axis. The maximum length of these projections is the width of the object. Max.
- shape parameters such as Circularity, Convexity and Elongation provide the user with a series of highly sensitive tools in order to identify and quantify subtle variations in particle shape and provide a "fingerprint" of each sample.
- Each parameter is usually normalized between 0 and 1 in order to provide quick and easy comparability.
- Traditional qualitative human descriptions such as “jugged”, “smooth” or “needlelike” can be accurately quantified and hence correlated against important process or end-product variables such as flowability, active area and grinding efficiency.
- Circularity is a measure of the closeness to a perfect circle. Circularity is sensitive to both changes in overall form and surface roughness. Convexity is a measure of the surface roughness of a particle. Convexity is sensitive to changes in surface roughness but not overall form. Elongation is a measure of the length-width relationship. Elongation is unaffected by surface roughness - a smooth ellipse has a similar elongation as a apiky ellipse of smaller aspect ratio.
- the Morphologi G2 includes high quality hardware to provide high quality images. It includes a high-resolution digital camera, and a motorized objective revolver that provides automatic magnification change over. It also includes a precision XY stage for sample scanning, a motorized Z axis actuator for automatic focusing, and two light sources for reflected (episcopic) and transmitted (diascopic) illumination.
- the system is supplied with two flat screen monitors, one for software and the other for a live video view. A range of sample holders are available to suit different samples and different sample preparation types.
- the Morphologi G2 is built upon the acclaimed Nikon CFI 60 optical system which achieves both higher Numerical Apertures (NA) and longer working distances.
- NA Numerical Apertures
- a precision XY stage and calibration grating ensure that data is precise, secure and validated at all times.
- both axial and lateral chromatic aberration have been corrected independently in the objective and the tube lens. This geometry produces images that are crisp and clear with high contrast and minimal flare.
- the precision engineered XY stage uses high accuracy, ground ball-screws to provide smooth and maintenance free motion with zero-backlash.
- the quiet and precise stepper motors ensure accurate positioning of the stage while the use of micro-stepping provides smooth motion at low speeds.
- Precision etched chrome-on-glass gratings are built into the XY stage for calibration purposes.
- the gratings are certified and traceable to the National Physical Laboratory.
- the system automatically calibrates before every measurement to guarantee validated, secure data.
- Morphologi G2 delivers the benefits listed in Table 3.
- Table 3 Objectives Features Repeatability and automation
- SOP Standard Operating Procedure
- the tried and tested SOP (Standard Operating Procedure) methodology records all software and hardware variables in a single file.
- the system selects and calibrates the required magnification, the light intensity and focus before scanning a defined area.
- Sensitivity to shape Particles are fully characterized by morphological parameters including circle equivalent diameter, circularity and convexity. This high quality information can be used to distinguish between materials that appear identical to a conventional microscope or traditional particle sizer.
- High quality optics Nikon's acclaimed CFI60 optics offer longer working distances and high N.A.s and allow high contrast imaging with a minimum of flare.
- the Morphologi G2 can be used for pharmaceuticals. In this application, even subtle differences in particle size or shape can significantly affect bioavailability, flowability, stability, blending and tabletting efficiency. Manufacturing processing steps including crystallization, drying, milling, blending, filtering can all introduce variability into the product and have to be precisely controlled. The extra sensitivity and resolution available in the Morphologi G2 instrument provides users with the ability to identify, measure and monitor those process variables which are critical to product quality.
- the Morphologi G2 provides high sensitivity to fine particles. Image analysis proceeds on a 'number-basis' where the contribution each particle makes to the distribution is the same--a very small particle has exactly the same weighting as a very large particle. For diagnostic or trouble-shooting purposes the presence of fines could be critical to understand any given manufacturing process (see Fig. 20 ).
- the Morphologi G2 is also suitable for use in foreign particle detection.
- Image analysis is an ideal technology for detecting the presence of very small numbers of foreign particles or confirming phenomena such as agglomeration.
- foreign particles can be detected and quantified.
- needles or fibers can be detected using the circularity shape descriptor.
- Table 4 Size, shape and count measurement of particulate samples Size measurement Size range 0.5 ⁇ m - 1000 ⁇ m (depending upon material properties and dispersion conditions) Shape measurement Multiple shape parameters calculated for each particle and distribution generated on each parameter. Parameters include: circle equivalent diameter, Length, Width, Perimeter, Area, Aspect ratio, Circularity, Convexity, Solidity, Elongation, Intensity. Optical configurations Optical system Nikon CFI 60 Brightfield/Darkfield system Magnification (at camera) 2.5X 5X 10X 20X 50X Approx.
Landscapes
- Physics & Mathematics (AREA)
- Spectroscopy & Molecular Physics (AREA)
- General Physics & Mathematics (AREA)
- Chemical & Material Sciences (AREA)
- Dispersion Chemistry (AREA)
- Signal Processing (AREA)
- Engineering & Computer Science (AREA)
- Health & Medical Sciences (AREA)
- Life Sciences & Earth Sciences (AREA)
- Analytical Chemistry (AREA)
- Biochemistry (AREA)
- General Health & Medical Sciences (AREA)
- Immunology (AREA)
- Pathology (AREA)
- Investigating Or Analysing Materials By Optical Means (AREA)
Description
- This invention pertains to instrumentation, including particle image analyzers with spectrometric capabilities.
- Particle image analyzers are well-known instruments that can use image analysis techniques to allow users to automatically acquire and analyze images of a large number of particles. These instruments can then provide statistical information about the size and shape of particles.
Fig. 1 shows one example of such a system, the Morphologi® Particle Image Analyzer available from Malvern Instruments, Inc. of Malvern UK. This system is described in a section of the specification of this document. - Spectral imaging techniques have also been applied to the analysis of large numbers of particles. These systems can provide statistical information about the distribution of chemical species in the particles. Systems of this type are described in more detail in
US published application no 20060282223 . -
EP 0 780 671 -
US 2003/0147066 discloses a method for analysing pharmaceutical specimens by producing an image of the sample (e.g. by environmental scanning electron microscope) and using the image to select a position, at which scattered radiation at the position is detected to determine molecular data. -
WO 2006/044861 discloses a method of obtaining information about a heterogeneous pharmaceutical specimen. The method involves staining the sample, and then identifying locations by microscopy, based on colour, for further analysis by a spectrometer (e.g. Raman, near infra-red (NIR), mid-IR). -
EP 1 526 373 -
US 7 061 606 discloses a chemical imaging system which illuminates an area of a sample with light in the visible waveband and NIR waveband. A multitude of spatially resolved spectra of transmitted, reflected, emitted or scattered NIR light are collected and imaged. The visible light is simultaneously detected, thereby providing simultaneous visible imaging and NIR chemical analysis. -
WO 2004/086503 discloses a method of generating intra-particle crystallographic parameter maps and histograms of a chemically pure particulate substance. Spectral imaging, in particular focus-fusion multi-layer spectral imaging, combined with pattern recognition and classification analysis are performed on individual particles for forming sets of single-particle spectral fingerprint data, characterised by single-particle spectral fingerprint data. Pattern recognition and classification analysis is performed on spectral fingerprint data for each particle to classify the particle. -
WO 03/060442 - Several aspects of the invention are presented in this application. In one general aspect, the invention features a particle analyser comprising spectroscopic apparatus for investigating heterogeneity of a sample area as defined in
claim 1 as well as a spectroscopic method as defined in claim 9. The apparatus includes an image acquisition system operative to acquire images of a plurality of individual particles in the sample area and a particle selection interface. operative to receive a selection designating one of the particles for which an image has been obtained. A spectrometer has a field of view and is operative to acquire a spectrum of at least part of one of the particles in its field of view, and a positioning mechanism is responsive to the particle selection interface and operative to position the field of view of the spectrometer relative to the sample area based on a received selection. - In preferred embodiments, the positioning mechanism can include electromechanical elements. The positioning mechanism can include an x-y stage responsive to x-y coordinate information from the particle selection interface. The apparatus can further include analysis logic operative to analyze the images acquired by the image acquisition system. The particle selection interface is responsive to the analysis logic to select particles having predetermined morphological characteristics.
- The analysis logic can include statistical analysis logic, sorting logic, and/or contaminant detection logic. The spectrometer can be an infrared spectrometer. The spectrometer can be a Raman spectrometer. The area is an area of dispersed particles with the sub-areas being individual particles in the area of dispersed particles. The image acquisition system can operate in the visible range. The apparatus can further include a mapping module responsive to the image acquisition system and to the spectrometer and operative to create a map that presents spectral information for each of the sub-areas from the spectrometer at a location from which it was received. The mapping module can be operative to superimpose the spectral information onto an image from the image acquisition system. The mapping module can map point measurement values to larger areas having matching physical characteristics. The mapping module can also be operative to indicate statistical properties of mapped areas.
- The method can further include the steps of deriving physical information about the one of the sub-areas, and setting a spectral range of the step of acquiring in response to the physical information.
- Systems according to the invention can be advantageous in that they allow for spectrometric imaging and screening without the expense and time that may be required by array-based infrared chemical imaging systems.
-
-
Fig. 1 is an image of a prior art particle image analyzer; -
Fig. 2 is an image of a system according to the invention employing the analyzer ofFig. 1 ; -
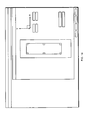
Fig. 3A is an illustration of a screen shot particle record view that can be provided by the system ofFig. 2 for a first type of particle in an illustrative sample; -
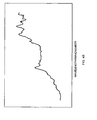
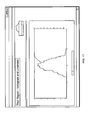
Fig. 3B is a spectrum for one of the particles shown in the screen shot ofFig. 3A , which can be provided by the system ofFig. 2 ; -
Fig. 4A is an illustration of a screen shot particle record view that can be provided by the system ofFig. 2 for a second type of particle in an illustrative sample; -
Fig. 4B is a spectrum for one of the particles shown in the screen shot ofFig. 4A , which can be provided by the system ofFig. 2 ; -
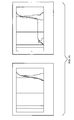
Fig. 5 is a series of images illustrating a sequence of screen shots that can be produced by the system ofFig. 2 for an illustrative sample; -
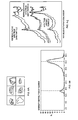
Fig. 6A is a series of selected images of samples from an illustrative sample for use with the system ofFig. 2 ; -
Fig. 6B is a graph illustrating the intensity distribution of transparency in the illustrative sample forFig. 6A ; -
Fig. 6C is a plot showing a family of spectra for different types of samples in the illustrative sample; -
Fig. 7 is a block diagram of a system according to the invention that employs a sparse image information acquisition mode; -
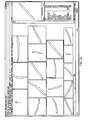
Fig. 8 is an acquired grayscale image of a pharmaceutical formulation with two active ingredients and one inactive ingredient dispersed onto a surface using a standard metered-dose inhaler; -
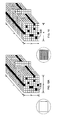
Fig. 9 is a diagram illustrating a blank hypercube data set for the image ofFig. 7 ; -
Fig. 10A is a diagram illustrating a populated sparse hypercube data set that employs image areas that each correspond an individual spectrum; -
Fig. 10B is a diagram illustrating a populated sparse hypercube data set that employs image areas that each correspond to a plurality of spectra; -
Fig. 11 is a map of the type that can be produced with a system such as the system ofFig. 7 based on the sample for which an acquired image is shown inFig. 8 . -
Figs. 12-20 illustrate a particle analyzer. - Referring to
Fig. 2 , anillustrative system 10 according to the invention includes a spectrometer 22 in addition to themicroscope body 12,x-y stage 14, andcamera 16. The spectrometer can use the same microscope optics as the camera either by swapping them or using an optical switch to alternate between them. In Raman implementations, a laser source can also pass its beam through the same optics, such as through the use of a beam splitter 24. - Results from the camera and computer are also preferably analyzed and presented on a same computer (e.g., a PC workstation). The principles of the invention can be applied to a variety of types of apparatuses, methods, and applications. For example, a system employing macroscopic optics could be used instead of microscopic optics. The camera could acquire its images in a variety of ways, such as by using a Charge Coupled Device (CCD) to acquire grayscale or color images in the visible wavelength range. These apparatuses can also employ any type of spectrometric detection, such as methods based on gratings or interference. And while the illustrative embodiment uses NIR spectrometry, other types of spectrometry could be used as well, such as mid-infrared spectrometry, Raman spectrometry, or fluorescence spectrometry.
- In operation, referring to
Fig. 3A , the system first acquires a visible image of a sample area, such as a dry dispersion of particles from a pharmaceutical raw material. The system can then provide the user a series of images of individual particles. This can allow the user to select one of the particles and then cause the system to obtain a spectrum of that particle by moving the x-y to position the selected particle in a field of view of the spectrometer (seeFig. 3B ). Note that other types of mechanisms for moving the sample relative to the spectrometer's field of view are possible, such as by moving mirrors, or even moving the spectrometer itself. Some can also operate passively, such as by gravity or convection. The field of view of the spectrometer is preferably smaller than the size of a particle. - The system can also select particles automatically. Results of statistical or other types of image or numerical analysis can be used to determine which particles to select based on morphological differences. For example, the smallest, largest, most spherical, darkest, or lightest particles could be selected automatically (e.g., compare
Figs. 3A and3B withFigs. 4A and4B ). Combinations of morphological, physical, colorimetric, or other attributes could be used as well. - The system can also be applied to other types of samples, such as coarse or fine particulates and heterogeneous liquids or surfaces. More specific examples can include items such as manufactured products, seeds, cattle feed, biological cells or other bounded biological entities such as spores, organelles, or bacteria. Other types of operations can also be applied to selected areas by the system. A particle could be mechanically extracted for disposal or further processing, for example.
- Referring to
Figs. 5-6 , in one example, particles having different transparencies could be processed by the system. In this example, most particles are semi-transparent and produce low intensity images, while some are darker and result in higher contrast images (seeFig. 6A ). As shown inFig. 6B , statistical processing by the system can reveal that the transparency distribution for this sample has two peaks-one large one for the most common, more transparent, particles and one small one for the less common, darker, particles. The system can then produce one or more spectra for a variety of salient points in this distribution, such as at the centroids of its peaks or their outlying edges (seeFig. 6C ). These spectra can then be displayed to the user or compared to known spectra in a spectral library or processed by a variety of multivariate or chemometrics means. These processing operations can derive information about the chemical origin or identification of the selected object or more fundamental information about the molecular or crystal structure. - Referring to
Figs. 7-8 , systems according to the invention can also use a sparse image information acquisition and/or mapping mode. In this mode, the system can obtain a first image of a sample area in which information of interest is relatively sparse. This image may include a sparse set of entities of interest separated by background space, such as the dispersed pharmaceutical formulation shown inFig. 8 , or it may include any other type of image in which only a small number of image sub-areas are of interest. - Referring to
Fig. 9 , one traditional prior art method of acquiring spectral information for a sample area is to acquire a full spectrum for every point to derive a full spectral hyperspectral data cube for the sample. This data cube includes an x-y image of the sample at each of a series of wavelengths X, with a vector v in the wavelength axis corresponding to a single point spectrum. Much effort has been expended to build highspeed imaging spectrometers that can create full hyperspectral data cubes quickly. - Systems according to the invention operate differently. These systems first employ a preliminary imaging detection subsystem to select particles of interest. This step can be automatic or semi-automatic, and can be based on a variety of information about the sample, such as morphology, colorimetry, statistical properties, or pattern recognition. It is also preferably quick and/or inexpensive to perform, because it operates at visible wavelengths, for example. The particles selected by the preliminary imaging subsystem are identified to a spectrometry system, such as in the form of a list of particle centroids communicated electronically.
- As in the embodiment presented above in connection with
Fig. 2 , the system can cause the spectrometer to obtain one or more spectra for each of the particles of interest by moving the position of an x-y stage to the selected particles in a field of view of the spectrometer. Note that other types of mechanisms for moving the sample relative to the spectrometer's field of view are also possible, such as by moving mirrors, or even moving the spectrometer itself. Some can even operate passively, such as by gravity or convection. - Referring to
Figs. 10A-10B , the values from the spectrometer are mapped to locations in a sparse hyperspectral data cube that correspond to the respective locations of sub-areas of interest, such as particles. This mapping can take a variety of forms, such a single-sample, geometric map, in which each sub-area is represented by a geometrically accurate sub-area shape exhibiting a single representational treatment (e.g., a color or a hatching pattern). Each shape in this type of map corresponds to a single spectral measurement of a single particle, such as one taken at its centroid (seeFig. 10A ). And each shape has a perimeter that matches the perimeter of its respective particle and is located in the image at a location that corresponds to its location in the sample area. The result is a map that can resemble a map derived from a full spectral scan of the sample area, but includes little or no data outside the regions of interest. In the case of the pharmaceutical formulation, for example, the different types of particles in the formulation could be mapped to different colors on a white background. Or they could be mapped to different hatching patterns, as shown inFig. 11 . - A multi-sample, geometric map can be used as well, in which each sub-area is actually a small spectral image of the sample with a plurality of pixels each corresponding to one of several differently located spectral measurements for different parts of the sub-area. Multi-sample maps can also display a single treatment for each sub-area, where the treatment is defined by the results of multiple samples (see
Fig. 10B ). For example, a median wavelength response for a series of measurements taken over different parts of a sub-area could be computed and displayed as a color. Suitable techniques used for obtaining multiple samples for a sub-area, including statistical techniques, are described, for example, in copending application no..60/860,345 - The system can produce maps in a variety of ways. It may produce them by superimposing results from the spectrometer onto the image produced by the preliminary imaging system, for example, or it may produce them using the results of the preliminary imaging system as a starting point for a mask. They maps can also be produced based only on the location and/or morphology information received from the preliminary imaging system.
- The data sets can be stored in a variety of ways. They can be stored in much the same way would be a full hyperspectral data cube, except that non-sampled areas would be represented as empty, such as through the use of an IEEE 754 floating point NaN symbol (Not a Number). They can also be stored in a more compact format to reduce data storage requirments. This format could include a data structure that holds the received spectra and their coordinates, for example, or it could employ one of more of a variety of known data compression methods suitable for encoding sparse data sets, such as Run Length Encoding (RLE). To display a map or image plane from a compactly stored data cube, the system would have to decompress or otherwise reconstruct the map or image.
- The maps and data sets may also be spatially compressed. If each sub-area only corresponds to a single measurement, for example, the data could be presented and stored at a much lower resolution that that of the preliminary imaging system. And in some applications, it may be suitable to represent each sub-area with a representation that does not conform to the shape of the sub-areas, such as an individual pixel, or even a symbol. All of the above techniques can permit faster acquisition times, processing times, and/or storage requirements by reducing redundant or unimportant operations and/or spatial data.
- The data sets, maps, and spectral measurements may also exhibit spectral sparseness. The selections presented by the preliminary imaging system can define which wavelengths should be used for different sub-areas of a sample area, for example, such as by adjusting an excitation frequency (e.g., selecting a laser frequency) or selecting a sensitivity range for the spectrometer. This approach can further reduce acquisition times, processing times, and/or storage requirements by reducing redundant or unimportant operations and/or spectral data. Once maps have been created, they can be displayed, stored, or serve as the basis for further investigation or processing.
- Systems according to the invention can be created using a specially programmed general purpose computer, dedicated hardware, or a combination of both. In one embodiment, the system is based on a Microsoft Windows® -based computer system, but other platforms could be used as well.
- Techniques presented in this application such as the sparse acquisition techniques can also be applied to high throughput systems, such as are described in
US Pat. No. 6,483,112 , entitled HIGH-THROUGHPUT INFRARED SPECTROSCOPY. They may also be applied to high-volume on-line spectroscopic composition testing of manufactured pharmaceutical dosage units such as are described inUS Pat. No. 6,690,464 , entitled HIGH-VOLUME ON-LINE SPECTROSCOPIC COMPOSITION TESTING OF MANUFACTURED PHARMACEUTICAL DOSAGE UNITS. And they may be applied to HPLC and other techniques described inUS Apl. No. 10/328,713 - In addition to combining the teachings of this application with the above-referenced documents, it is contemplated that they could also be combined with the teachings of
US application no. 11/499,390 US application no. 60/860,345 US application no. 60/879,306 - The following section describes a particle analyzer suitable for use in connection with embodiments of the invention. This analyzer is sold under the name "Morpohologi G2" by Malvern Instruments Limited of Malvern, Worcestershire UK. Referring to
Fig. 12 , the Morphologi G2 high sensitivity particle analyzer is more than just a microscope. It brings together the very best hardware and software in a single integrated package and provides the very highest level of automation and validation of results. It provides repeatable and routine characterization of particle size, shape and count. - The Morphologi G2 is equipped with the renowned Nikon CFI 60 optical system coupled with a high resolution digital camera for high definition aberration-free images. Microscope-quality images and statistically significant histograms offer both qualitative and quantitative information which can eliminate operator bias and saves precious man-hours. In R&D, process analysis or quality control, the Morphologi G2 delivers reliable, repeatable and validated results in minutes. It can analyze 100s of thousands of particles at the push of a button, provide particle shape and count as well as size information, record high resolution images of every particle, automatically select optics, focus and light intensity control, provide technical compliance with 21CFR Part 11, and provide a dedicated sample preparation device. Usage of the system is illustrated Table 1, with reference to
Figs. 13-17 .Table 1 Step Description Comments Fig. Method Development - Generate basic information on sample such as size range. A "manual microscope" mode is available to quickly move around and view the sample in order to check basics such a dispersion quality or the approximate size rage. It employs a virtual joystick and focus, light and magnification controls. 13 - Optimize sample dispersion conditions. Standard Operating Procedure (SOP) Creation - Optimize and select all software and hardware variables. A "wizard" assists in the generation of SOPs. A mouse-controlled scan area selection tool is available. 14 - All variables captured in a single file that can be emailed around the world. Sample Measurement - The software selects the magnification and calibrates against a grating. During data acquisition, status messages keep the operator informed of progress. A settings icon allows for modification of SOP settings. Quick start icon and status message bar are also provided along with a live view of the measurement frame. 15 - Light intensity and focus position are all controlled by software. Result Viewing/editing - View information on each individual particle or the statistics of whole distribution Images of all particles are recorded and can be sorted and filtered on any shape parameter and new records created with the filtered data. Particles can be sorted and filtered on any parameter. A sidebar shows a morphological parameter list for a highlighted particle. 16 - Sort and filter particles and create new records with certain particles excluded. Report Creation - Display distribution, tables and result statistics. A range of reports is supplied to display distribution, tables and results statistics. The Report Designer can be used to customize the contents of these reports. Any morphological parameter can be plotted on the x-axis. The user can choose frequency, undersize, or oversize graph types, and can add specific parameters or logos or other graphics. 17 - Report Designer can be used to customize the style and content of reports. - Why is Shape Analysis Important? Manual microscopy and traditional particle sizing techniques are often not sufficiently sensitive to distinguish subtle differences in raw materials. Batches of samples may differ by such a small amount that this difference is lost during the translation to a circle-equivalent or spherical-equivalent diameter. Calculating shape parameters like the ones shown in Table 2 below allow even the most subtle differences to be identified and quantified (see
Fig. 18 ).Table 2 Parameter Example value Definition ID 516 Unique ID of the particle - allocated in the order that the particles are detected Magnification 2.50 Magnification used to make the measurement CE diameter (µm) 904.14 The diameter of a circle with the same area as the particle Length (µm) 1306.35 All possible lines from one point of the perimeter to another point on the perimeter are projected on the major axis (axis of minimum rotational energy). The maximum length of these projections is the length of the object. Width (µm) 678.54 All possible lines from one point of the perimeter to another point on the perimeter are projected on the minor axis. The maximum length of these projections is the width of the object. Max. Distance (µm) 1318.07 Largest distance between any two pixels in particle Perimeter (µm) 3619.42 Actual perimeter of particle Major axis 105.52 Axis of minimum rotational energy Area (µm2) 371550.78 Actual area of particle in sq. microns Area (pixels) 215018 Number of pixels in particle Circularity 0.785 Circumference of equivalent area circle divided by the actual perimeter of the particle = 2√ (π Area)/Perimeter HS Circularity 0.616 High sensitivity circularity (circularity squared) =4 πArea/perimeter2 Convexity 0.919 Convex hull perimeter divided by actual particle perimeter Solidity 0.905 Actual particle area divided by convex hull area Aspect ratio 0.519 Width divided by length Elongation 0.461 1 - aspect ratio Intensity mean 61.310 Average of all the greyscale values of every pixel in the particle Intensity standard deviation 29.841 Standard deviation of all the greyscale values of every pixel in the particle Center x position (µm) 6898271.5 x co-ordinate of center of mass of particle Center y position (µm) 1797186.3 y coordinate of center of mass of particle - Referring to
Fig. 19 , shape parameters such as Circularity, Convexity and Elongation provide the user with a series of highly sensitive tools in order to identify and quantify subtle variations in particle shape and provide a "fingerprint" of each sample. Each parameter is usually normalized between 0 and 1 in order to provide quick and easy comparability. Traditional qualitative human descriptions such as "jugged", "smooth" or "needlelike" can be accurately quantified and hence correlated against important process or end-product variables such as flowability, active area and grinding efficiency. - Circularity is a measure of the closeness to a perfect circle. Circularity is sensitive to both changes in overall form and surface roughness. Convexity is a measure of the surface roughness of a particle. Convexity is sensitive to changes in surface roughness but not overall form. Elongation is a measure of the length-width relationship. Elongation is unaffected by surface roughness - a smooth ellipse has a similar elongation as a apiky ellipse of smaller aspect ratio.
- The Morphologi G2 includes high quality hardware to provide high quality images. It includes a high-resolution digital camera, and a motorized objective revolver that provides automatic magnification change over. It also includes a precision XY stage for sample scanning, a motorized Z axis actuator for automatic focusing, and two light sources for reflected (episcopic) and transmitted (diascopic) illumination. The system is supplied with two flat screen monitors, one for software and the other for a live video view. A range of sample holders are available to suit different samples and different sample preparation types.
- The Morphologi G2 is built upon the acclaimed Nikon CFI 60 optical system which achieves both higher Numerical Apertures (NA) and longer working distances. A precision XY stage and calibration grating ensure that data is precise, secure and validated at all times. In these revolutionary optics, both axial and lateral chromatic aberration have been corrected independently in the objective and the tube lens. This geometry produces images that are crisp and clear with high contrast and minimal flare.
- The precision engineered XY stage uses high accuracy, ground ball-screws to provide smooth and maintenance free motion with zero-backlash. The quiet and precise stepper motors ensure accurate positioning of the stage while the use of micro-stepping provides smooth motion at low speeds.
- Precision etched chrome-on-glass gratings are built into the XY stage for calibration purposes. The gratings are certified and traceable to the National Physical Laboratory. The system automatically calibrates before every measurement to guarantee validated, secure data.
- Morphologi G2 delivers the benefits listed in Table 3.
Table 3 Objectives Features Repeatability and automation The tried and tested SOP (Standard Operating Procedure) methodology records all software and hardware variables in a single file. At the click of a mouse the system selects and calibrates the required magnification, the light intensity and focus before scanning a defined area. Sensitivity to shape Particles are fully characterized by morphological parameters including circle equivalent diameter, circularity and convexity. This high quality information can be used to distinguish between materials that appear identical to a conventional microscope or traditional particle sizer. High quality optics Nikon's acclaimed CFI60 optics offer longer working distances and high N.A.s and allow high contrast imaging with a minimum of flare. Statistical significance Large numbers of particles (typically 5,000 - 500,000) are captured and analyzed in minutes or even seconds. Images you can see All images are saved for future reference including the x-y coordinates of each particle. If desired, one can precisely move the camera back to any position for a more detailed visual analysis. Controlled orientation To avoid errors due to random orientation, particles are dispersed onto a flat glass plate. This achieves consistency of orientation with the largest area facing the camera. Regulatory compliance The Morphologi G2 has a full validation documentation package available and provides technical compliance with the requirements of 21 CFR part 11. - At any point in a manufacturing process from early research and development, through process-analysis, manufacturing trouble-shooting and root-cause analysis to final product quality control, this instrument provides an unprecedented level of product and process understanding. It is suitable for use in a number of areas.
- The Morphologi G2 can be used for pharmaceuticals. In this application, even subtle differences in particle size or shape can significantly affect bioavailability, flowability, stability, blending and tabletting efficiency. Manufacturing processing steps including crystallization, drying, milling, blending, filtering can all introduce variability into the product and have to be precisely controlled. The extra sensitivity and resolution available in the Morphologi G2 instrument provides users with the ability to identify, measure and monitor those process variables which are critical to product quality.
- The Morphologi G2 provides high sensitivity to fine particles. Image analysis proceeds on a 'number-basis' where the contribution each particle makes to the distribution is the same--a very small particle has exactly the same weighting as a very large particle. For diagnostic or trouble-shooting purposes the presence of fines could be critical to understand any given manufacturing process (see
Fig. 20 ). - The Morphologi G2 is also suitable for use in foreign particle detection. Image analysis is an ideal technology for detecting the presence of very small numbers of foreign particles or confirming phenomena such as agglomeration. Using single parameters or combinations of parameters, foreign particles can be detected and quantified. For example, needles or fibers can be detected using the circularity shape descriptor.
- An overview of the Morphologi G2 system specifications is presented in table 4 below.
Table 4 Size, shape and count measurement of particulate samples Size measurement Size range 0.5µm - 1000µm (depending upon material properties and dispersion conditions) Shape measurement Multiple shape parameters calculated for each particle and distribution generated on each parameter. Parameters include: circle equivalent diameter, Length, Width, Perimeter, Area, Aspect ratio, Circularity, Convexity, Solidity, Elongation, Intensity. Optical configurations Optical system Nikon CFI 60 Brightfield/Darkfield system Magnification (at camera) 2.5X 5X 10X 20X 50X Approx. total magnification (at 17" screen) 120X 240X 480X 960X 2400X Min particle size (µm) 20 10 5 3 0.5 Max particle size (µm) 1000 430 210 100 40 Numerical aperture 0.075 0.15 0.30 0.40 0.55 Focal depth (total) (µm) 97.78 24.44 6.11 3.44 1.82 Working distance (mm) 8.80 18.00 15.00 13.00 9.80 Camera system Camera type 1/1/8" Global shutter progressive scan CCD Connection protocol type IEEE 1 394a (Firewire™) Number of pixels 1624 x 1236 (2 MegaPixel) Pixel size 4.4µm x 4.4µm Sensor size 7.15mm x 5.44mm Minimum PC specification (Supplied with system) DELL Mini Tower PC, Windows XP SP2, 3.0GHz Intel Pentium IV Processor, 1Gb RAM, 160Gb-HDD, DVD +/-R/RW, complete with mouse, keyboard and 2 x 17" Flat Panel Monitors (1 for software and 1 for live video feed) Weight and dimensions Weight (with stage fitted) 50kg Overall dimensions (with stage fitted) 550(w) x 850(d) x 680(h) mm Suggested deskspace (with PC and 2 screens) 850(d) x 2500(w) Site requirements Power requirements AC 1 00-240V, 50-60Hz Ambient operating temp. 1 0°C - 35°C Humidity 10-90% non-condensing Location Normal laboratory conditions - out of direct sunlight - The present invention has now been described in connection with a number of specific embodiments thereof. However, numerous modifications which are contemplated as falling within the scope of the present invention should now be apparent to those skilled in the art. It is therefore intended that the scope of the present invention be limited only by the scope of the claims appended hereto. In addition, the order of presentation of the claims should not be construed to limit the scope of any particular term in the claims.
Claims (11)
- A particle analyzer, operable to characterize particle size, shape, and count in a sample area of dispersed particles, comprising spectroscopic apparatus for investigating heterogeneity of the sample area, the spectroscopic apparatus comprising:an image acquisition system operative to acquire an image of a plurality of individual particles in the sample area,a particle selection interface operative to receive a selection designating one of the particles of the image,a spectrometer having a field of view and being operative to acquire a spectrum of at least part of one of the particles in its field of view, anda positioning mechanism responsive to the particle selection interface and operative to position the field of view of the spectrometer relative to the sample area based on a received selection;characterized by analysis logic operative to analyze the image, wherein the particle selection interface is responsive to the analysis logic, to automatically select a series of individual particles having predetermined morphological characteristics and to operate the positioning mechanism and spectrometer to acquire a spectrum of the selected individual particles.
- The apparatus of claim 1 wherein the analysis logic includes statistical analysis logic, sorting logic, and/or contaminant detection logic.
- The apparatus of any previous claim wherein the analysis logic is operative to detect agglomeration, and/or foreign particles including needles and/or fibres.
- The apparatus of any previous claim further including a mapping module responsive to the image acquisition system and to the spectrometer and operative to create a map that presents spectral information for each of the particles from the spectrometer at a location from which it was received.
- The apparatus of claim 4, wherein the mapping module is operative to superimpose the spectral information onto an image from the image acquisition system and/or wherein the mapping module can map point measurement values to larger areas having matching physical characteristics.
- The apparatus of any previous claim wherein the spectrometer is an infrared spectrometer, wherein the spectrometer is a Raman spectrometer, and/or wherein the image acquisition system operates in the visible range.
- The apparatus of any previous claim wherein the positioning mechanism includes electromechanical elements, or wherein the positioning mechanism includes an x-y stage responsive to x-y coordinate information from the particle selection interface.
- The apparatus of any previous claim wherein the positioning mechanism further includes a motorized z-axis actuator for automatic focusing.
- A spectroscopic method for investigating heterogeneity of a sample area, comprising:acquiring an image of a plurality of dispersed particles in the sample area using an image acquisition system,characterized by analyzing the image to identify morphological characteristics of each particle,automatically selecting a series of particles having predetermined morphological characteristics, based on the analysis,for each particle in the series of particles:using a positioning mechanism to automatically position a field of view of a spectrometer relative to the sample area so as to place at least part of the selected particle in the field of view, andacquiring a spectrum of the selected particle.
- The method of claim 9 further including the steps of deriving physical information about one of the particles in the series of particles, and setting a spectral range of the step of acquiring in response to the physical information.
- The method of claim 9 or claim 10, wherein the method is performed using the apparatus of any of claims 1 to 8.
Applications Claiming Priority (3)
| Application Number | Priority Date | Filing Date | Title |
|---|---|---|---|
| US87930607P | 2007-01-05 | 2007-01-05 | |
| US95833707P | 2007-07-05 | 2007-07-05 | |
| PCT/US2008/000155 WO2008085914A1 (en) | 2007-01-05 | 2008-01-04 | Spectrometric investigation of heterogeneity |
Publications (3)
| Publication Number | Publication Date |
|---|---|
| EP2106536A1 EP2106536A1 (en) | 2009-10-07 |
| EP2106536A4 EP2106536A4 (en) | 2013-11-06 |
| EP2106536B1 true EP2106536B1 (en) | 2015-08-12 |
Family
ID=39608997
Family Applications (1)
| Application Number | Title | Priority Date | Filing Date |
|---|---|---|---|
| EP08705498.7A Active EP2106536B1 (en) | 2007-01-05 | 2008-01-04 | Spectrometric investigation of heterogeneity |
Country Status (3)
| Country | Link |
|---|---|
| US (2) | US8111395B2 (en) |
| EP (1) | EP2106536B1 (en) |
| WO (1) | WO2008085914A1 (en) |
Families Citing this family (18)
| Publication number | Priority date | Publication date | Assignee | Title |
|---|---|---|---|---|
| US20090204338A1 (en) * | 2008-02-13 | 2009-08-13 | Nordic Bioscience A/S | Method of deriving a quantitative measure of the instability of calcific deposits of a blood vessel |
| EP2431729A1 (en) * | 2010-01-15 | 2012-03-21 | Malvern Instruments Limited | Spectrometric characterisation of heterogeneity |
| RU2015101834A (en) | 2012-06-22 | 2016-08-10 | Малверн Инструментс Лимитед | DETERMINATION OF CHARACTERISTICS OF HETEROGENEOUS FLUID SAMPLES |
| US10509976B2 (en) | 2012-06-22 | 2019-12-17 | Malvern Panalytical Limited | Heterogeneous fluid sample characterization |
| US20150301323A1 (en) * | 2012-11-15 | 2015-10-22 | Shimadzu Corporation | System for setting analysis target region |
| JP5979064B2 (en) * | 2013-04-02 | 2016-08-24 | 横河電機株式会社 | Recorder |
| CN103245415B (en) * | 2013-04-02 | 2015-02-18 | 清华大学 | Light transmission composition analysis method based on sparse representation |
| CN104154994B (en) * | 2013-11-27 | 2016-06-08 | 中国计量科学研究院 | The multifunctional light spectrometer of a kind of modular design |
| DE102014105222A1 (en) * | 2014-04-11 | 2015-10-15 | Jenoptik Optical Systems Gmbh | Camera with integrated spectrometer |
| US9383190B1 (en) * | 2014-12-10 | 2016-07-05 | Carl Zeiss Industrielle Messtechnik Gmbh | Measuring apparatus and method for determining dimensional characteristics of a measurement object |
| US11130686B2 (en) | 2017-01-10 | 2021-09-28 | Vermeer Manufacturing Company | Systems and methods for dosing slurries to remove suspended solids |
| EP3803293A4 (en) | 2018-05-30 | 2022-06-15 | Pendar Technologies, LLC | METHODS AND DEVICES FOR GAP DIFFERENTIAL RAMAN SPECTROSCOPY WITH INCREASED OCULAR SAFETY AND REDUCED RISK OF EXPLOSION |
| EP3924719A4 (en) * | 2019-02-14 | 2023-03-22 | ChemImage Corporation | EXTENDED PARTICULATE SWARM BAND SELECTION |
| JP2022031142A (en) * | 2020-08-07 | 2022-02-18 | 住友化学株式会社 | Solid catalyst component for olefin polymerization |
| CN112699756B (en) * | 2020-12-24 | 2023-08-25 | 中国农业科学院农业信息研究所 | Hyperspectral image-based tea origin identification method and system |
| CN115615544A (en) * | 2021-07-16 | 2023-01-17 | 华为技术有限公司 | Spectrum measuring device and measuring method thereof |
| EP4552549A1 (en) * | 2023-11-13 | 2025-05-14 | OPTOPOL Technology Spolka z ograniczona Odpowiedzialnoscia | A device for measuring the characteristics of the human eye using oct technology |
| CN118758429B (en) * | 2024-09-06 | 2024-11-01 | 四川意龙科纺集团股份有限公司 | An online detection system, method and medium for color difference in printing and dyeing |
Family Cites Families (23)
| Publication number | Priority date | Publication date | Assignee | Title |
|---|---|---|---|---|
| US5923430A (en) * | 1993-06-17 | 1999-07-13 | Ultrapointe Corporation | Method for characterizing defects on semiconductor wafers |
| US5991470A (en) * | 1995-06-07 | 1999-11-23 | Computer Identics, Inc. | One-dimensional scanner system for two-dimensional image acquisition |
| US5706083A (en) | 1995-12-21 | 1998-01-06 | Shimadzu Corporation | Spectrophotometer and its application to a colorimeter |
| US6037772A (en) * | 1998-01-06 | 2000-03-14 | Arch Development Corp. | Fast spectroscopic imaging system |
| US6002476A (en) * | 1998-04-22 | 1999-12-14 | Chemicon Inc. | Chemical imaging system |
| US6067154A (en) * | 1998-10-23 | 2000-05-23 | Advanced Micro Devices, Inc. | Method and apparatus for the molecular identification of defects in semiconductor manufacturing using a radiation scattering technique such as raman spectroscopy |
| US6734962B2 (en) | 2000-10-13 | 2004-05-11 | Chemimage Corporation | Near infrared chemical imaging microscope |
| DE19946110C1 (en) | 1999-09-17 | 2001-02-01 | Apsys Advanced Particle System | Optical particle characterisation method for clean room for electronics industry has sampled air fed to light dispersion measuring device triggering particle identification unit using monochromatic light |
| JP3741602B2 (en) * | 1999-11-26 | 2006-02-01 | 日本電子株式会社 | Micro Raman spectroscopy system |
| US7595878B2 (en) * | 2000-10-13 | 2009-09-29 | Chemimage Corporation | Spectroscopic methods for component particle analysis |
| US7326938B2 (en) * | 2001-08-23 | 2008-02-05 | D.N.R. Imaging Systems Ltd. | Optical system and method for inspecting fluorescently labeled biological specimens |
| EP1495292A4 (en) * | 2001-12-21 | 2012-05-09 | Malvern Instr Inc | Spectrometric process monitoring |
| AU2002235851A1 (en) | 2002-01-19 | 2003-07-30 | Agilent Technologies, Inc. | Gas-filled optical fiber for wavelength calibration or measurement |
| US6654118B2 (en) * | 2002-02-04 | 2003-11-25 | Ortho-Mcneil Pharmaceutical, Inc. | Method and apparatus for obtaining molecular data from a pharmaceutical specimen |
| CN1662810A (en) | 2002-06-21 | 2005-08-31 | 奥林巴斯株式会社 | Biomolecular Analysis Device |
| CA2520551C (en) | 2003-03-27 | 2013-10-15 | Green Vision Systems Ltd. | Generating intra-particle crystallographic parameter maps and histograms of a chemically pure crystalline particulate substance |
| US7697576B2 (en) * | 2004-05-05 | 2010-04-13 | Chem Image Corporation | Cytological analysis by raman spectroscopic imaging |
| US7532320B2 (en) * | 2004-06-30 | 2009-05-12 | Chemimage Corporation | Multimodal method for identifying hazardous agents |
| US20060063989A1 (en) * | 2004-08-19 | 2006-03-23 | Hogan Josh N | Compact non-invasive analysis system |
| EP1812079A4 (en) | 2004-10-15 | 2012-07-25 | Spectral Dimensions Inc | Pharmaceutical mixture evaluation |
| US20060170916A1 (en) * | 2005-01-31 | 2006-08-03 | Voigt Thomas C | Method and apparatus for variable-field illumination |
| US7679740B2 (en) * | 2005-07-14 | 2010-03-16 | Chemimage Corporation | Method and apparatus for multimodal detection |
| US7463345B2 (en) * | 2005-09-27 | 2008-12-09 | Chemimage Corporation | Method for correlating spectroscopic measurements with digital images of contrast enhanced tissue |
-
2008
- 2008-01-04 EP EP08705498.7A patent/EP2106536B1/en active Active
- 2008-01-04 WO PCT/US2008/000155 patent/WO2008085914A1/en not_active Ceased
- 2008-01-04 US US12/006,677 patent/US8111395B2/en active Active
-
2012
- 2012-02-06 US US13/367,359 patent/US8564774B2/en active Active
Also Published As
| Publication number | Publication date |
|---|---|
| US20080180660A1 (en) | 2008-07-31 |
| EP2106536A4 (en) | 2013-11-06 |
| US20130010105A1 (en) | 2013-01-10 |
| WO2008085914A1 (en) | 2008-07-17 |
| EP2106536A1 (en) | 2009-10-07 |
| US8564774B2 (en) | 2013-10-22 |
| US8111395B2 (en) | 2012-02-07 |
Similar Documents
| Publication | Publication Date | Title |
|---|---|---|
| US8564774B2 (en) | Spectrometric investigation of heterogeneity | |
| Koehler et al. | Near infrared spectroscopy: the practical chemical imaging solution | |
| ElMasry et al. | Principles of hyperspectral imaging technology | |
| US6734962B2 (en) | Near infrared chemical imaging microscope | |
| US5329352A (en) | Spectroscopically correlated light scanning microscopy | |
| Gowen et al. | Recent applications of chemical imaging to pharmaceutical process monitoring and quality control | |
| Lewis et al. | Near-infrared chemical imaging and the PAT initiative | |
| US20120197541A1 (en) | Pharmaceutical mixture evaluation | |
| US20070206185A1 (en) | System and method for fiber array spectral translator based polymorph screening | |
| Chlebda et al. | Assessment of hyperspectral imaging system for colour measurement | |
| US20120041689A1 (en) | System and method for particle detection in spectral domain | |
| Qiu et al. | Evaluation of the color measurement based on a microscopic hyperspectral imaging system | |
| US8213011B2 (en) | Spatial imaging/imaging spectroscopy system and method | |
| Al Ktash | Development of a UV hyperspectral imaging prototype for industrial applications | |
| US12025562B2 (en) | Method for optical monitoring and/or determination of properties of sample | |
| Lewis et al. | NIR chemical imaging—near infrared spectroscopy on steroids | |
| Ma et al. | Optimisation of magnification levels for near infrared chemical imaging of blending of pharmaceutical powders | |
| Quintana et al. | Instrumentation Evaluation for Hyperspectral Microscopy Targeting Enhanced Medical Histology | |
| Sedman et al. | Infrared Imaging: principles and practices | |
| Lewis et al. | Near‐infrared spectral imaging with focal plane array detectors | |
| Roggo et al. | Chemical imaging and chemometrics: useful tools for process analytical technology | |
| JP2025080670A (en) | Spectroscopic measurement device and method for displaying spectroscopic measurement results | |
| CN116593389A (en) | Infrared Raman Microscopy | |
| Blanch et al. | Report 2 Evaluation of portable microscope in combination with hyperspectral imaging as a particle exposure assessment tool |
Legal Events
| Date | Code | Title | Description |
|---|---|---|---|
| PUAI | Public reference made under article 153(3) epc to a published international application that has entered the european phase |
Free format text: ORIGINAL CODE: 0009012 |
|
| 17P | Request for examination filed |
Effective date: 20090804 |
|
| AK | Designated contracting states |
Kind code of ref document: A1 Designated state(s): AT BE BG CH CY CZ DE DK EE ES FI FR GB GR HR HU IE IS IT LI LT LU LV MC MT NL NO PL PT RO SE SI SK TR |
|
| DAX | Request for extension of the european patent (deleted) | ||
| A4 | Supplementary search report drawn up and despatched |
Effective date: 20131007 |
|
| RIC1 | Information provided on ipc code assigned before grant |
Ipc: G01J 3/02 20060101ALI20130930BHEP Ipc: G01J 3/00 20060101AFI20130930BHEP |
|
| 17Q | First examination report despatched |
Effective date: 20140715 |
|
| RAP1 | Party data changed (applicant data changed or rights of an application transferred) |
Owner name: MALVERN INSTRUMENTS INCORPORATED |
|
| RIN1 | Information on inventor provided before grant (corrected) |
Inventor name: LEWIS, NEIL, E. |
|
| REG | Reference to a national code |
Ref country code: DE Ref legal event code: R079 Ref document number: 602008039489 Country of ref document: DE Free format text: PREVIOUS MAIN CLASS: G01J0003000000 Ipc: G01J0003020000 |
|
| RIC1 | Information provided on ipc code assigned before grant |
Ipc: G01N 15/14 20060101ALI20150205BHEP Ipc: G01J 3/28 20060101ALI20150205BHEP Ipc: G01J 3/02 20060101AFI20150205BHEP |
|
| GRAP | Despatch of communication of intention to grant a patent |
Free format text: ORIGINAL CODE: EPIDOSNIGR1 |
|
| INTG | Intention to grant announced |
Effective date: 20150522 |
|
| GRAS | Grant fee paid |
Free format text: ORIGINAL CODE: EPIDOSNIGR3 |
|
| GRAA | (expected) grant |
Free format text: ORIGINAL CODE: 0009210 |
|
| AK | Designated contracting states |
Kind code of ref document: B1 Designated state(s): AT BE BG CH CY CZ DE DK EE ES FI FR GB GR HR HU IE IS IT LI LT LU LV MC MT NL NO PL PT RO SE SI SK TR |
|
| RAP1 | Party data changed (applicant data changed or rights of an application transferred) |
Owner name: MALVERN INSTRUMENTS INCORPORATED |
|
| REG | Reference to a national code |
Ref country code: GB Ref legal event code: FG4D |
|
| REG | Reference to a national code |
Ref country code: CH Ref legal event code: EP |
|
| REG | Reference to a national code |
Ref country code: AT Ref legal event code: REF Ref document number: 742584 Country of ref document: AT Kind code of ref document: T Effective date: 20150815 |
|
| REG | Reference to a national code |
Ref country code: IE Ref legal event code: FG4D |
|
| REG | Reference to a national code |
Ref country code: DE Ref legal event code: R096 Ref document number: 602008039489 Country of ref document: DE |
|
| REG | Reference to a national code |
Ref country code: FR Ref legal event code: PLFP Year of fee payment: 9 |
|
| REG | Reference to a national code |
Ref country code: LT Ref legal event code: MG4D |
|
| REG | Reference to a national code |
Ref country code: AT Ref legal event code: MK05 Ref document number: 742584 Country of ref document: AT Kind code of ref document: T Effective date: 20150812 |
|
| REG | Reference to a national code |
Ref country code: NL Ref legal event code: MP Effective date: 20150812 |
|
| PG25 | Lapsed in a contracting state [announced via postgrant information from national office to epo] |
Ref country code: LT Free format text: LAPSE BECAUSE OF FAILURE TO SUBMIT A TRANSLATION OF THE DESCRIPTION OR TO PAY THE FEE WITHIN THE PRESCRIBED TIME-LIMIT Effective date: 20150812 Ref country code: NO Free format text: LAPSE BECAUSE OF FAILURE TO SUBMIT A TRANSLATION OF THE DESCRIPTION OR TO PAY THE FEE WITHIN THE PRESCRIBED TIME-LIMIT Effective date: 20151112 Ref country code: FI Free format text: LAPSE BECAUSE OF FAILURE TO SUBMIT A TRANSLATION OF THE DESCRIPTION OR TO PAY THE FEE WITHIN THE PRESCRIBED TIME-LIMIT Effective date: 20150812 Ref country code: GR Free format text: LAPSE BECAUSE OF FAILURE TO SUBMIT A TRANSLATION OF THE DESCRIPTION OR TO PAY THE FEE WITHIN THE PRESCRIBED TIME-LIMIT Effective date: 20151113 Ref country code: LV Free format text: LAPSE BECAUSE OF FAILURE TO SUBMIT A TRANSLATION OF THE DESCRIPTION OR TO PAY THE FEE WITHIN THE PRESCRIBED TIME-LIMIT Effective date: 20150812 |
|
| PG25 | Lapsed in a contracting state [announced via postgrant information from national office to epo] |
Ref country code: PT Free format text: LAPSE BECAUSE OF FAILURE TO SUBMIT A TRANSLATION OF THE DESCRIPTION OR TO PAY THE FEE WITHIN THE PRESCRIBED TIME-LIMIT Effective date: 20151214 Ref country code: SE Free format text: LAPSE BECAUSE OF FAILURE TO SUBMIT A TRANSLATION OF THE DESCRIPTION OR TO PAY THE FEE WITHIN THE PRESCRIBED TIME-LIMIT Effective date: 20150812 Ref country code: ES Free format text: LAPSE BECAUSE OF FAILURE TO SUBMIT A TRANSLATION OF THE DESCRIPTION OR TO PAY THE FEE WITHIN THE PRESCRIBED TIME-LIMIT Effective date: 20150812 Ref country code: PL Free format text: LAPSE BECAUSE OF FAILURE TO SUBMIT A TRANSLATION OF THE DESCRIPTION OR TO PAY THE FEE WITHIN THE PRESCRIBED TIME-LIMIT Effective date: 20150812 Ref country code: IS Free format text: LAPSE BECAUSE OF FAILURE TO SUBMIT A TRANSLATION OF THE DESCRIPTION OR TO PAY THE FEE WITHIN THE PRESCRIBED TIME-LIMIT Effective date: 20151212 Ref country code: HR Free format text: LAPSE BECAUSE OF FAILURE TO SUBMIT A TRANSLATION OF THE DESCRIPTION OR TO PAY THE FEE WITHIN THE PRESCRIBED TIME-LIMIT Effective date: 20150812 Ref country code: AT Free format text: LAPSE BECAUSE OF FAILURE TO SUBMIT A TRANSLATION OF THE DESCRIPTION OR TO PAY THE FEE WITHIN THE PRESCRIBED TIME-LIMIT Effective date: 20150812 |
|
| PG25 | Lapsed in a contracting state [announced via postgrant information from national office to epo] |
Ref country code: NL Free format text: LAPSE BECAUSE OF FAILURE TO SUBMIT A TRANSLATION OF THE DESCRIPTION OR TO PAY THE FEE WITHIN THE PRESCRIBED TIME-LIMIT Effective date: 20150812 |
|
| PG25 | Lapsed in a contracting state [announced via postgrant information from national office to epo] |
Ref country code: EE Free format text: LAPSE BECAUSE OF FAILURE TO SUBMIT A TRANSLATION OF THE DESCRIPTION OR TO PAY THE FEE WITHIN THE PRESCRIBED TIME-LIMIT Effective date: 20150812 Ref country code: IT Free format text: LAPSE BECAUSE OF FAILURE TO SUBMIT A TRANSLATION OF THE DESCRIPTION OR TO PAY THE FEE WITHIN THE PRESCRIBED TIME-LIMIT Effective date: 20150812 Ref country code: CZ Free format text: LAPSE BECAUSE OF FAILURE TO SUBMIT A TRANSLATION OF THE DESCRIPTION OR TO PAY THE FEE WITHIN THE PRESCRIBED TIME-LIMIT Effective date: 20150812 Ref country code: DK Free format text: LAPSE BECAUSE OF FAILURE TO SUBMIT A TRANSLATION OF THE DESCRIPTION OR TO PAY THE FEE WITHIN THE PRESCRIBED TIME-LIMIT Effective date: 20150812 Ref country code: SK Free format text: LAPSE BECAUSE OF FAILURE TO SUBMIT A TRANSLATION OF THE DESCRIPTION OR TO PAY THE FEE WITHIN THE PRESCRIBED TIME-LIMIT Effective date: 20150812 |
|
| REG | Reference to a national code |
Ref country code: DE Ref legal event code: R097 Ref document number: 602008039489 Country of ref document: DE |
|
| PG25 | Lapsed in a contracting state [announced via postgrant information from national office to epo] |
Ref country code: BE Free format text: LAPSE BECAUSE OF NON-PAYMENT OF DUE FEES Effective date: 20160131 Ref country code: RO Free format text: LAPSE BECAUSE OF FAILURE TO SUBMIT A TRANSLATION OF THE DESCRIPTION OR TO PAY THE FEE WITHIN THE PRESCRIBED TIME-LIMIT Effective date: 20150812 |
|
| PLBE | No opposition filed within time limit |
Free format text: ORIGINAL CODE: 0009261 |
|
| STAA | Information on the status of an ep patent application or granted ep patent |
Free format text: STATUS: NO OPPOSITION FILED WITHIN TIME LIMIT |
|
| 26N | No opposition filed |
Effective date: 20160513 |
|
| PG25 | Lapsed in a contracting state [announced via postgrant information from national office to epo] |
Ref country code: LU Free format text: LAPSE BECAUSE OF FAILURE TO SUBMIT A TRANSLATION OF THE DESCRIPTION OR TO PAY THE FEE WITHIN THE PRESCRIBED TIME-LIMIT Effective date: 20160104 Ref country code: SI Free format text: LAPSE BECAUSE OF FAILURE TO SUBMIT A TRANSLATION OF THE DESCRIPTION OR TO PAY THE FEE WITHIN THE PRESCRIBED TIME-LIMIT Effective date: 20150812 |
|
| REG | Reference to a national code |
Ref country code: CH Ref legal event code: PL |
|
| PG25 | Lapsed in a contracting state [announced via postgrant information from national office to epo] |
Ref country code: MC Free format text: LAPSE BECAUSE OF FAILURE TO SUBMIT A TRANSLATION OF THE DESCRIPTION OR TO PAY THE FEE WITHIN THE PRESCRIBED TIME-LIMIT Effective date: 20150812 |
|
| PG25 | Lapsed in a contracting state [announced via postgrant information from national office to epo] |
Ref country code: CH Free format text: LAPSE BECAUSE OF NON-PAYMENT OF DUE FEES Effective date: 20160131 Ref country code: LI Free format text: LAPSE BECAUSE OF NON-PAYMENT OF DUE FEES Effective date: 20160131 |
|
| REG | Reference to a national code |
Ref country code: IE Ref legal event code: MM4A |
|
| REG | Reference to a national code |
Ref country code: FR Ref legal event code: PLFP Year of fee payment: 10 |
|
| PG25 | Lapsed in a contracting state [announced via postgrant information from national office to epo] |
Ref country code: BE Free format text: LAPSE BECAUSE OF FAILURE TO SUBMIT A TRANSLATION OF THE DESCRIPTION OR TO PAY THE FEE WITHIN THE PRESCRIBED TIME-LIMIT Effective date: 20150812 |
|
| PG25 | Lapsed in a contracting state [announced via postgrant information from national office to epo] |
Ref country code: IE Free format text: LAPSE BECAUSE OF NON-PAYMENT OF DUE FEES Effective date: 20160104 |
|
| PG25 | Lapsed in a contracting state [announced via postgrant information from national office to epo] |
Ref country code: MT Free format text: LAPSE BECAUSE OF FAILURE TO SUBMIT A TRANSLATION OF THE DESCRIPTION OR TO PAY THE FEE WITHIN THE PRESCRIBED TIME-LIMIT Effective date: 20150812 |
|
| REG | Reference to a national code |
Ref country code: FR Ref legal event code: PLFP Year of fee payment: 11 |
|
| PG25 | Lapsed in a contracting state [announced via postgrant information from national office to epo] |
Ref country code: HU Free format text: LAPSE BECAUSE OF FAILURE TO SUBMIT A TRANSLATION OF THE DESCRIPTION OR TO PAY THE FEE WITHIN THE PRESCRIBED TIME-LIMIT; INVALID AB INITIO Effective date: 20080104 Ref country code: CY Free format text: LAPSE BECAUSE OF FAILURE TO SUBMIT A TRANSLATION OF THE DESCRIPTION OR TO PAY THE FEE WITHIN THE PRESCRIBED TIME-LIMIT Effective date: 20150812 |
|
| PG25 | Lapsed in a contracting state [announced via postgrant information from national office to epo] |
Ref country code: MT Free format text: LAPSE BECAUSE OF FAILURE TO SUBMIT A TRANSLATION OF THE DESCRIPTION OR TO PAY THE FEE WITHIN THE PRESCRIBED TIME-LIMIT Effective date: 20160131 Ref country code: TR Free format text: LAPSE BECAUSE OF FAILURE TO SUBMIT A TRANSLATION OF THE DESCRIPTION OR TO PAY THE FEE WITHIN THE PRESCRIBED TIME-LIMIT Effective date: 20150812 |
|
| PG25 | Lapsed in a contracting state [announced via postgrant information from national office to epo] |
Ref country code: BG Free format text: LAPSE BECAUSE OF FAILURE TO SUBMIT A TRANSLATION OF THE DESCRIPTION OR TO PAY THE FEE WITHIN THE PRESCRIBED TIME-LIMIT Effective date: 20150812 |
|
| P01 | Opt-out of the competence of the unified patent court (upc) registered |
Effective date: 20230727 |
|
| PGFP | Annual fee paid to national office [announced via postgrant information from national office to epo] |
Ref country code: GB Payment date: 20251220 Year of fee payment: 19 |
|
| PGFP | Annual fee paid to national office [announced via postgrant information from national office to epo] |
Ref country code: FR Payment date: 20251217 Year of fee payment: 19 |
|
| PGFP | Annual fee paid to national office [announced via postgrant information from national office to epo] |
Ref country code: DE Payment date: 20251217 Year of fee payment: 19 |