EP2102685B1 - Method and apparatus for tissue equivalent solid state microdosimetry - Google Patents
Method and apparatus for tissue equivalent solid state microdosimetry Download PDFInfo
- Publication number
- EP2102685B1 EP2102685B1 EP07845402.2A EP07845402A EP2102685B1 EP 2102685 B1 EP2102685 B1 EP 2102685B1 EP 07845402 A EP07845402 A EP 07845402A EP 2102685 B1 EP2102685 B1 EP 2102685B1
- Authority
- EP
- European Patent Office
- Prior art keywords
- detectors
- microdosimeter
- dose
- tissue equivalent
- spectrum
- Prior art date
- Legal status (The legal status is an assumption and is not a legal conclusion. Google has not performed a legal analysis and makes no representation as to the accuracy of the status listed.)
- Active
Links
- 238000000034 method Methods 0.000 title claims description 23
- 239000007787 solid Substances 0.000 title description 19
- 238000001228 spectrum Methods 0.000 claims description 77
- 230000005855 radiation Effects 0.000 claims description 34
- 231100000987 absorbed dose Toxicity 0.000 claims description 29
- 239000002245 particle Substances 0.000 claims description 26
- 239000004065 semiconductor Substances 0.000 claims description 21
- 229910052710 silicon Inorganic materials 0.000 claims description 19
- 239000010703 silicon Substances 0.000 claims description 19
- XUIMIQQOPSSXEZ-UHFFFAOYSA-N Silicon Chemical compound [Si] XUIMIQQOPSSXEZ-UHFFFAOYSA-N 0.000 claims description 18
- 239000000463 material Substances 0.000 claims description 10
- 239000011163 secondary particle Substances 0.000 claims description 8
- 230000001419 dependent effect Effects 0.000 claims description 7
- 239000012212 insulator Substances 0.000 claims description 6
- 230000003321 amplification Effects 0.000 claims description 5
- 238000003199 nucleic acid amplification method Methods 0.000 claims description 5
- 229920003229 poly(methyl methacrylate) Polymers 0.000 claims description 5
- 239000004926 polymethyl methacrylate Substances 0.000 claims description 5
- 238000012545 processing Methods 0.000 claims description 3
- 210000001519 tissue Anatomy 0.000 description 37
- 238000005259 measurement Methods 0.000 description 18
- 238000009826 distribution Methods 0.000 description 17
- XLYOFNOQVPJJNP-UHFFFAOYSA-N water Substances O XLYOFNOQVPJJNP-UHFFFAOYSA-N 0.000 description 12
- 238000000151 deposition Methods 0.000 description 10
- 150000002500 ions Chemical class 0.000 description 10
- 238000003491 array Methods 0.000 description 9
- 238000006243 chemical reaction Methods 0.000 description 9
- 230000008021 deposition Effects 0.000 description 9
- 238000004611 spectroscopical analysis Methods 0.000 description 8
- 238000004980 dosimetry Methods 0.000 description 7
- 238000005516 engineering process Methods 0.000 description 7
- 238000013459 approach Methods 0.000 description 6
- 230000000694 effects Effects 0.000 description 6
- 230000000693 radiobiological effect Effects 0.000 description 6
- 230000008901 benefit Effects 0.000 description 4
- 230000001413 cellular effect Effects 0.000 description 4
- 230000005684 electric field Effects 0.000 description 4
- 238000009204 fast neutron therapy Methods 0.000 description 4
- 238000002661 proton therapy Methods 0.000 description 4
- 239000004698 Polyethylene Substances 0.000 description 3
- NIXOWILDQLNWCW-UHFFFAOYSA-N acrylic acid group Chemical group C(C=C)(=O)O NIXOWILDQLNWCW-UHFFFAOYSA-N 0.000 description 3
- 230000008859 change Effects 0.000 description 3
- 230000006735 deficit Effects 0.000 description 3
- 238000009792 diffusion process Methods 0.000 description 3
- -1 polyethylene Polymers 0.000 description 3
- 229920000573 polyethylene Polymers 0.000 description 3
- 238000003672 processing method Methods 0.000 description 3
- 238000005215 recombination Methods 0.000 description 3
- 230000006798 recombination Effects 0.000 description 3
- 230000004044 response Effects 0.000 description 3
- 238000000926 separation method Methods 0.000 description 3
- 238000012546 transfer Methods 0.000 description 3
- 206010060862 Prostate cancer Diseases 0.000 description 2
- 208000000236 Prostatic Neoplasms Diseases 0.000 description 2
- LBDSXVIYZYSRII-IGMARMGPSA-N alpha-particle Chemical compound [4He+2] LBDSXVIYZYSRII-IGMARMGPSA-N 0.000 description 2
- 238000012512 characterization method Methods 0.000 description 2
- 238000007405 data analysis Methods 0.000 description 2
- 238000009795 derivation Methods 0.000 description 2
- 238000013461 design Methods 0.000 description 2
- 238000005530 etching Methods 0.000 description 2
- 238000007667 floating Methods 0.000 description 2
- 230000006870 function Effects 0.000 description 2
- 238000002513 implantation Methods 0.000 description 2
- 230000003993 interaction Effects 0.000 description 2
- 238000004519 manufacturing process Methods 0.000 description 2
- 230000000191 radiation effect Effects 0.000 description 2
- 230000011218 segmentation Effects 0.000 description 2
- 229910004613 CdTe Inorganic materials 0.000 description 1
- 229910001218 Gallium arsenide Inorganic materials 0.000 description 1
- 238000000342 Monte Carlo simulation Methods 0.000 description 1
- XAGFODPZIPBFFR-UHFFFAOYSA-N aluminium Chemical compound [Al] XAGFODPZIPBFFR-UHFFFAOYSA-N 0.000 description 1
- 229910052782 aluminium Inorganic materials 0.000 description 1
- 239000004411 aluminium Substances 0.000 description 1
- 238000004458 analytical method Methods 0.000 description 1
- 239000013590 bulk material Substances 0.000 description 1
- 231100000504 carcinogenesis Toxicity 0.000 description 1
- 230000005779 cell damage Effects 0.000 description 1
- 208000037887 cell injury Diseases 0.000 description 1
- 230000017075 cellular response to radiation Effects 0.000 description 1
- 238000004891 communication Methods 0.000 description 1
- 230000000052 comparative effect Effects 0.000 description 1
- 238000011109 contamination Methods 0.000 description 1
- 238000012937 correction Methods 0.000 description 1
- 238000013480 data collection Methods 0.000 description 1
- 238000011161 development Methods 0.000 description 1
- 230000018109 developmental process Effects 0.000 description 1
- 230000005281 excited state Effects 0.000 description 1
- 238000002474 experimental method Methods 0.000 description 1
- XUFQPHANEAPEMJ-UHFFFAOYSA-N famotidine Chemical compound NC(N)=NC1=NC(CSCCC(N)=NS(N)(=O)=O)=CS1 XUFQPHANEAPEMJ-UHFFFAOYSA-N 0.000 description 1
- 238000009472 formulation Methods 0.000 description 1
- 239000012634 fragment Substances 0.000 description 1
- 238000003384 imaging method Methods 0.000 description 1
- 238000000338 in vitro Methods 0.000 description 1
- 230000002779 inactivation Effects 0.000 description 1
- 238000011835 investigation Methods 0.000 description 1
- 238000002955 isolation Methods 0.000 description 1
- MYWUZJCMWCOHBA-VIFPVBQESA-N methamphetamine Chemical compound CN[C@@H](C)CC1=CC=CC=C1 MYWUZJCMWCOHBA-VIFPVBQESA-N 0.000 description 1
- 238000004377 microelectronic Methods 0.000 description 1
- 230000003278 mimic effect Effects 0.000 description 1
- 239000000203 mixture Substances 0.000 description 1
- 238000010606 normalization Methods 0.000 description 1
- 238000004958 nuclear spectroscopy Methods 0.000 description 1
- 239000012188 paraffin wax Substances 0.000 description 1
- 230000008569 process Effects 0.000 description 1
- 238000001959 radiotherapy Methods 0.000 description 1
- 230000009467 reduction Effects 0.000 description 1
- 238000012552 review Methods 0.000 description 1
- 208000011571 secondary malignant neoplasm Diseases 0.000 description 1
- 238000004088 simulation Methods 0.000 description 1
- 210000004872 soft tissue Anatomy 0.000 description 1
- 238000006467 substitution reaction Methods 0.000 description 1
- 230000004083 survival effect Effects 0.000 description 1
- 230000035899 viability Effects 0.000 description 1
Images


Classifications
-
- G—PHYSICS
- G01—MEASURING; TESTING
- G01T—MEASUREMENT OF NUCLEAR OR X-RADIATION
- G01T1/00—Measuring X-radiation, gamma radiation, corpuscular radiation, or cosmic radiation
- G01T1/02—Dosimeters
- G01T1/026—Semiconductor dose-rate meters
-
- H—ELECTRICITY
- H10—SEMICONDUCTOR DEVICES; ELECTRIC SOLID-STATE DEVICES NOT OTHERWISE PROVIDED FOR
- H10F—INORGANIC SEMICONDUCTOR DEVICES SENSITIVE TO INFRARED RADIATION, LIGHT, ELECTROMAGNETIC RADIATION OF SHORTER WAVELENGTH OR CORPUSCULAR RADIATION
- H10F39/00—Integrated devices, or assemblies of multiple devices, comprising at least one element covered by group H10F30/00, e.g. radiation detectors comprising photodiode arrays
- H10F39/10—Integrated devices
- H10F39/107—Integrated devices having multiple elements covered by H10F30/00 in a repetitive configuration, e.g. radiation detectors comprising photodiode arrays
Definitions
- the invention relates to a method and apparatus for tissue equivalent solid state microdosimetry, of particular but by no means exclusive application in predicting the probability of cell damage in a radiation field and for predicting Single Event Upsets (SEUs) in microelectronics and dose equivalent measurement.
- SEUs Single Event Upsets
- LET Linear Energy Transfer
- deterministic energy deposition becomes stochastic and depends on the target size and spatial pattern of energy deposited by radiation (by charged particles). It limits the correlation of the LET approach with radiobiological effects.
- delta ray energy distribution and its relationship to spatial dose distribution are not adequately considered. Particles with different velocities and charges can have the same LET but it is the particle velocity that largely determines the energy distribution of delta rays. In microscopic volumes, the delta ray distribution may be a significant factor in the spatial distribution of energy, particularly at higher ion energies and small site sizes.
- LET being a non-stochastic average quantity, does not account for the random fluctuations in energy deposition which manifest as clustering of energy deposition and range straggling.
- the variance due to straggling may exceed the path length variations at high ion energies and small site sizes.
- Lineal energy is commonly presented in units of keV ⁇ m -1 .
- V is the volume of the microscopic sensitive volume-target (SV) and S is the surface area of the SV.
- SV microscopic sensitive volume-target
- the dose distribution relationship reflects the fact that higher lineal energies deposit a higher dose.
- microdosimetric spectra is traditionally displayed as a log-linear plot with the ordinate multiplied by y, such that the area under the curve delimited by two values of y is proportional to the fraction of events (for f(y)) or the fraction of dose(for d(y)) delivered by events in this range of lineal energy values.
- This representation accommodates the wide lineal energy range often observed in microdosimetric spectra (from 0.01 keV/ ⁇ m to several hundred keV/ ⁇ m) but requires further scaling to preserve the dose to area correspondence.
- Microdosimetry requires instrumentation for measurements of energy ⁇ deposited in a cellular (or sub cellular) SV of interest (whether tissue or water), event-by-event from secondary particles generated in the medium of interest by the radiation field.
- a cellular (or sub cellular) SV of interest whether tissue or water
- event-by-event from secondary particles generated in the medium of interest by the radiation field was the development in the early 1950s of the low-pressure gas proportional counter, also referred to as the Rossi counter. Adjustment of sensitive volume up to 1 micron is possible by changing of the gas pressure in a counter.
- Tissue-Equivalent Proportional Counters (TEPCs) of this type (which are tissue equivalent owing to the tissue equivalence of the gas and surrounding walls) have several shortcomings:
- Microdosimetric spectra can be converted to radiobiological characteristics of the radiation field by convolution with a quality coefficient Q over the range of lineal energies, which reflects increasing probability of cell inactivation with increasing lineal event energy.
- the coefficient Q is determined by the ICRU (the International Commission on Radiation Units and Measurements) and based on experimental in vitro cell survival measurements; its analytical values are tabulated in Table 1 as a function of L, the unrestricted linear energy transfer in water.
- Table 1 Quality coefficient Q ( L ) L (keV ⁇ m -1 ) Q ( L ) ⁇ 10 1 10 - 100 0.32 L - 2.2 > 100 300/ L 0.5
- Q is thus a measure of the main difference between absorbed dosimetry and equivalent (radiobiological) dosimetry of radiation fields.
- Solid state detectors are very good owing to their small SV size; this is why in some situations minidosimetry is used instead of microdosimetry.
- minidosimetry the small SV of the detector is used to measure absorbed dose or dose rate but with high spatial resolution.
- MOSFET detectors which have a very small SV of micron or submicron size
- the output signal instead represents the integral of many events depositing energy in the SV. This occurs with many solid state detectors, such as dosimetric diodes working in current mode, TLDs (thermoluminescent dosimeters) and film.
- passive solid state detectors can be used to some extend in microdosimetry.
- glow peaks in some TLDs are sensitive to LET of particles that are associated with energy deposition on the micron and submicron level.
- These detectors are not a suitable substitution for TEPCs, as do not have proper LET resolution and cannot be used in real time dosimetry.
- Another passive microdosimetry detector device - disclosed in U.S. Patent No. 5,596,199 - records the energy deposition of incident radiation using an array of microstructure non-volatile memory devices.
- the charge from incident charge particles is stored in an electrically insulated (floating) gate, micron or submicron scale SV, of a FAMOS transistor.
- floating floating gate
- micron or submicron scale SV micron or submicron scale SV
- U.S. Patent No. 5,256,879 discloses a microdosimetry device for qualitatively and quantitatively analyzing a complex radiation field, the device having an array of microstructure parallel p-n junctions each defining a sensitive volume within which a voltage pulse is produced responsive to incident radiation. Circuitry in communication with the array generates digital pulse signals representative of the voltage pulses induced within the sensitive volumes responsive to incident radiation, and provides a summation of the digital pulses occurring at particular energies. The summations of digital pulses are compared to known energies generated by known ionizing particles in comparable sensitive volumes to generate an dose equivalent estimate.
- Solid state microdosimetry Nucl. Instr. and Meth. in Phys., B184 (2001) 135-157 disclose a review of solid state microdosimetry with an emphasis on silicon-based devices, including the historical foundations and basics of microdosimetry and a comparison between the performance characteristics of a proportional gas counter and a silicon microdosimeter.
- micron scale Si detectors p-n junctions
- reverse biased Si detectors with micron scale silicon SVs - comparable in size to biological cells - are connected to a nuclear spectroscopy setup.
- the small area of the array of p-n junctions allows pile up to be avoided, provided that charge is generated in a single SV only (which is true in most situations). This condition does not hold, however, if the charged particle traverses an SV in a direction substantially parallel to the surface of the chip. In such cases energy can be deposited in two cells simultaneously, providing a greater charge than if it were deposited in a single SV.
- Spectroscopy information can be converted to dose equivalent using a weighting factor recommended by the ICRU.
- This technique has been demonstrated using planar arrays of p-n junctions of NMOS and CMOS SRAM with an SV size of 44 ⁇ 44 ⁇ 3 microns. Applications of such planar arrays of p-n junctions for regional microdosimetry are limited owing to uncertainty in the average chord, charge collection efficiency within the SV, overlayers and shape of the SV. Increasing the total area of the p-n junction array leads to increases in the noise owing to an increase in capacitance that reduces the minimal LET detected by the microdosimeter. A segmentation approach with several parallel readout spectroscopy channels has been suggested to reduce the noise of the microdosimeter; this method has been demonstrated in the separation of gamma-neutron field without any qualitative or quantitative (dose equivalent) characterization of the radiation field.
- a solid state silicon microdosimeter based on a parallel array of p-n junctions for measurements of tissue equivalent microdosimetric spectra has also been investigated.
- the viability of measuring integral dose and microdosimetric spectra simultaneously at the same point in a water phantom in fast neutron therapy beam has been demonstrated.
- a new generation solid state microdosimeter with an array of parallel p-n junctions manufactured on SOI (Silicon-on-Insulator) with SV thicknesses of 2, 5 and 10 ⁇ m have been produced and investigated.
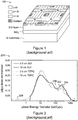
- FIG. 1 is a schematic view of such an SV at 100, comprising a 3D-fragment of an SOI p-n junction array.
- the SOI p-n junction array has a better defined SV than have arrays of p-n junctions on a bulk material or commercial SRAM.
- Figure 2 is a plot 200 of microdosimetric spectra obtained with gas TEPC and 10 ⁇ m SOI 4800 parallel cell microdosimeter using developed conversion, at depths of 2.5 and 10 cm in a water phantom on an FNT (Fast Neutron Therapy) beam after TE conversion. These spectra were obtained in a water phantom at the FNT facility, Harper Hospital, Detroit, USA.
- the tissue equivalent microdosimetric spectrum obtained with an SOI microdosimeter at depth 2.5 cm in water is shown at 202 and at depth 10 cm in water at 204; the tissue equivalent microdosimetric spectrum obtained by TEPC at depth 2.5 cm in water is shown at 206 and at depth 10 cm in water at 208.
- Figures 3A, 3B and 3C are charge collection images, obtained with 3 MeV ⁇ -particle scanning microbeam in 30 x 30 ⁇ m planar RPP SVs in a 10 ⁇ m SOI microdosimeter.
- Figure 3A corresponds to a p-n junction bias of 0 V
- Figure 3B to a p-n junction bias of 5 V
- Figure 3C to a p-n junction bias of 10 V.
- Charge collection is almost 100% in the central part of the SV under the N + P p-n junction and diminishes laterally from the central axis of the SV owing to the lessening electrical field.
- Losses of charge in a planar P-N junction cell due to recombination prevents the accurate measurement of energy deposited in a cell from a single event, thus reducing the accuracy of equivalent dosimetry.
- This is a disadvantage of the current design of solid state microdosimeters with planar p-n junction. Also, reducing the size of the SV to reduce the charge deficit reduces the energy deposited in the SV, and this technique is also limited by the noise of the detector.
- Two charged particles with the same LET can have different delta electron track structures, which are dependent on the speed of the charged particle.
- high energy delta electrons can be deposited in neighbouring cells (viz. SVs) and will be accepted as single events in an SV owing to the parallel connection of the p-n junctions. This produces an error in the determination of the cluster of deposited energy in a single SV. This effect is typical for high energy heavy ions in deep space radiation with delta electron energies up to 1 MeV.
- the present invention provides a microdosimeter, as set forth in independent claim 1, and comprising:
- the detectors are micron scale detectors.
- nano-dosimetry submicron scale detectors
- the detectors are cylindrical or near-cylindrical, or frusta-conical.
- the detectors may be produced in other shapes, such as cubes or rectangular prisms.
- the core comprises a rod-like p+ region within a Si SV.
- a strong electrical field can be achieved with a low bias voltage (of, for example, 10-15'V).
- the tissue equivalent medium comprises polymethylmethacrylate (which is also known as acrylic).
- microdosimeter is its essentially 100% collection of charges produced by charged particles owing to the absence of lateral diffusion (which occurs with planar p-n junctions in existing arrangements). It allows accurate determinations of deposited energy event by event, and allows error reductions in the determination of dose equivalents.
- each of the detectors is an avalanche detector for amplification of the deposited charge.
- the amplification is controllable with p-n junction bias.
- the detectors are connected such that each of the detectors is not connected to at least one of its immediately neighbouring detectors of the detectors. This allows the more accurate observation of the pattern of charge particle track produced by ⁇ -electrons and the use of more sophisticated approaches in the determination of dose equivalent.
- the present invention provides a method for performing microdosimetry, comprising:
- each of the cores of the detectors (402; 500 ; 600) comprises a rod-like p+ region (502; 602) within a Si sensitive volume (504; 604) or a rod-like n+ region within a Si sensitive volume (504; 604).
- the detectors are connected such that each of said detectors is not connected to at least one of its immediately neighbouring detectors of said detectors.
- the method includes:
- a method for processing data generated with the microdosimeter of the invention, to convert spectra of charge deposited in Si to tissue dose equivalent, comprising:
- the converting of the spectrum to a lineal energy spectrum typically employs a tissue equivalent average chord (such as determined from an average SV chord).
- the lineal energy dependent quality coefficient is typically Q(y).
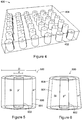
- FIG. 4 is a schematic isometric view (though simplified, including by the omission of electrical connections) of a solid state microdosimeter 400 according to an embodiment of the present invention.
- the microdosimeter 400 comprises a micron or submicron array of cylindrical or near-cylindrical three-dimensional - and hence non-planar - SVs (each a silicon detector) 402.
- the illustrated example comprises a 6 ⁇ 6 array, but this is purely for illustrative purposes; in practice the microdosimeter may comprise an array of 4800 or more SVs, and it will be understood that arrays of other sizes may be employed according to this embodiment; the arrays are commonly square but need not be.
- the array of 3D SVs is manufactured from an SOI wafer, such as with isolation technology (e.g. mesa etching technology).
- the 3D SVs - once manufactured - are embedded in PMMA (or acrylic) 404 by any known, suitable technique.
- the PMMA 404 is a tissue equivalent medium for the generation of secondary charged particles, as in tissue in the case of neutron irradiation and also for electronic equilibrium in the case of photon radiation.
- the thickness of the PMMA 404 can be selected according to application, as will be appreciated by those skilled in this art.
- the microdosimeter 400 has internal (avalanche) amplification. In use microdosimeter 400 is covered with the tissue equivalent material of interest or inserted into an object of interest for measurements of dose equivalent produced by secondary particle in the material of interest.
- FIG. 5 is a schematic view of an ideal form 500 of an SV 402 of microdosimeter 400.
- the SVs 402 are cylindrical (as depicted in this figure), but manufacturing constraints will make most practical SVs according to this embodiment near-cylindrical frusta-conical.
- the SVs 402 are produced using SOI technology. Each comprises a core p+ inner diffusion or implantation layer 502 (of diameter d), surrounded by an active silicon layer 504, and a n + outer layer 506 (of outer diameter D).
- the fixed thickness active silicon layer 504 of the SOI and of the surface of each SV allows SVs of well defined and uniform shape to be manufactured.
- the p+ core 502 and n+ outer layer 506 produce a well defined electrical field allowing substantially 100% charge collection.
- the small radial size of the p+ core 502 (and SV 402 overall) provides a sufficiently strong electrical field near the core 502 with reasonable values of applied reverse bias (for example, 5-10 V) for the avalanche process.
- Such structures were produced by 0.18 ⁇ m technology. Spatial separation of the SVs is achieved with, for example, mesa-etching technology on a depth of active layer SOI.
- SV 402 could instead have a n+ core and p+ outer layer.
- Figure 6 is a schematic view of a near-cylindrical and hence more realistic SV 600 suitable for microdosimeter 400.
- SV 600 is also produced using SOI technology, and comprises a core p+ inner diffusion or implantation layer 502, surrounded by an active silicon layer 604, and a n + outer layer 606.
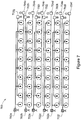
- Figure 7 is a schematic view of the array layout 700 of SVs 402, 600 (comprising 3D p-n junctions) of microdosimeter 400.
- Array layout 700 comprises a number of groups of SVs connected to separate channels of the readout electronics (not shown), the readout electronics operating in spectroscopy mode.
- the outer layer of each p-n junction is shown as a circle, and the inner core as a central dot.
- each group of SVs comprises five SVs arranged generally horizontally (as shown in this figure) and interleaved with another group of SVs. Consequently, the (partial) array layout 700 includes 12 output pads 702a, 702b, 702c, 702d, 702e, 702f, 702g, 702h, 702i, 702j, 702k, 7021, each coupled to a separate channel of the readout electronics.
- the SVs are connected with thin aluminium traces; the cores of each group are connected together, while the outer layers of all the SVs in the array are connected together.
- the cores of the odd SVs are connected to output pad A 702a, and the cores of the even SVs to output pad B 702g.
- the cores of the odd SVs are connected to output pad B 702h, and the cores of the even SVs to output pad A 702b.
- All outer layers of the p-n junctions are connected to a pad G (or ground) 704a, 704b, 704c, 704d, 704e, 704f.
- each SV is generally surrounded by four other SVs with different outputs from that of the first SV.
- each SV with an electrical output pad B (clear) is surrounded by four SVs with output pads A (shaded).
- independent readouts of output pads A and output pads B allow coincidence measurements, which are important for observing track structures.
- the radial distribution of a deposited energy event can be measured while the efficient sensitive total area of the microdosimeter is the same as in the case of a parallel p-n junction array.
- the ratio of the deposited energies in a the first SV and the surrounding four SVs, measured in coincidence, provides important radiobiological information in measurements of the RBE of a radiation field, in additional to the usual microdosimetry information.
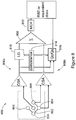
- Figure 8 is a readout schematic of a portion of the array layout 700 of Figure 7 .
- Exemplary "core” SV 802 and four “surrounding” SVs 804 are shown, connected to two separate readout charge spectroscopy channels 806a, 806b respectively, whose outputs are summed 808.
- each segment corresponding to a plurality of parallel rows of the array (cf. Figure 7 ). This is achieved by connecting pluralities of output pads A, B and G (respectively).
- the first channel 806a (hence the output of the core SV 802) is passed through a linear gate 810, providing conventional MCA spectra (of energy deposited in the SVs by secondary charged particles in the medium of interest) at MCA 812.
- a coincidence signal is generated 814 that blocks the second channel 806b (i.e. the outputs of the surrounding SVs 804) and charge is acquired to the MCA 812 from the core or first channel 806a.
- Qc and Qs provide 2D plots of energy distribution between the two channels, that is, the track structure of high energy events, without reducing the sensitive area of the microdosimeter 400.
- the spectrum of Qc/Qs ratio is a radiobiological parameter that extends the utility of the microdosimeter, including in the prediction of the cellular response to radiation fields in terms of track structure theory.
- Significant levels of coincidence events are expected in, for example, deep space radiation fields with high energy ions (such as Fe, Ti and C) with energies of the order of 1 GeV/u.
- the solid state microdosimeter 400 and associated, front-end electronics 800 in both channels 806a, 806b are provided in a single chip produced on SOI electronics.
- the MCA spectra and coincidence data obtained therewith are processed with a microprocessor (or other suitable computing device) with output being dose equivalent H in Sv.
- information on track structure can be used in predicting risk of cancer induction.
- the response of an SOI microdosimeter of the background art (cf. Figure 1 ) in a mixed gamma/neutron field produced from a 238Pu-Be radioisotope neutron source was measured.
- the source was located in a general purpose neutron irradiation facility of floor area 7.5 m 2 ; the facility was surrounded by walls 400 mm thick and 1.75 m high of borated paraffin and concrete.
- the source activity was 325 GBq with an estimated neutron emission rate of 2 ⁇ 10 7 neutrons in 4 ⁇ .
- the average energy of fast neutrons was approximately 4 MeV with a maximum energy of about 10 MeV.
- the dominant gamma component was a 4.4 MeV emission associated with the decay of the bound excited state of 12C* produced in the Be( ⁇ ,n) reaction within the 238Pu-Be source.
- the 5 ⁇ m thick SOI microdosimeter with 4800 planar parallel p-n junctions was mounted at a distance of approximately 2.6 cm from the source.
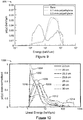
- Figure 9 is an example of a set of plots 900 of TE microdosimetric spectra derived from experimentally measured MCA spectra, in response to the mixed gamma/neutron radiation field with and without the presence of a polyethylene converter layer, obtained according to the above Steps 1 to 4 of the data analysis method of this embodiment.
- the solid line (for the bare SOI microdosimeter) has been scaled up 100 times for ease of comparison and related to event interaction of neutron in Si material. The contribution to simulated dose equivalent is negligible (less then 1%).
- Microdosimetric spectra match the shape of spectra obtained with TEPC well, supporting the validity of the method of this embodiment.
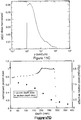
- Figure 10 is a set of plots 1000 of TE microdosimetric spectra obtained from the MCA spectra with a background art 10 ⁇ m SOI microdosimeter comparable to that of Figure 1 in a water phantom at different depths in the water phantom along the proton Bragg peak. Proton energy was 190 MeV; the range was 26 cm. For clarity, the individual spectra - according to data collection position - are labelled as follows:
- neutron dose equivalent was measured 5 cm laterally from the field edge of the proton field along the Spread Out Bragg Peak (SOBP) in an acrylic phantom.
- Proton energy was 250 MeV.
- the data demonstrate the applicability of this approach for dose equivalent measurements in tissue.
- the equivalent neutron doses are in a good agreement with that measured with Bonner spheres and TEPC.
- Another advantage of the SOI microdosimeter is that its spatial resolution is superior to other methods that allow measurements to be made in any point in a phantom.
- Figure 11A is a plot of MCA spectra f(E) versus deposited energy (keV), obtained with a background art SOI microdosimeter comparable to that of Figure 1 (cf. Step 1).
- Step 2 the areas under the MCA spectra and total mass of Si sensitive volumes are used to obtain the absorbed dose in Si. Absorbed dose in Si is converted to TE dose. Ratio of stoping powers used was 0.63.
- Steps 3 and 4 comprise the conversion of the MCA spectra (f(E) versus energy) to the lineal energy spectra f(y) versus y; the result is plotted in Figure 11B .
- Step 5 normalized microdosimetry spectra are obtained, as shown in Figure 11C (in which, as a result, the area under the curve is 1).
- Steps 6 and 7 produce a simulation of dose equivalent by convolution of spectra on Figure 11C and Q(y) of Table 1.
- Figure 11D a plot of the derived distribution of neutron dose equivalent, expressed in mSv (millisiverts) per 1 Gy of proton absorbed dose. For clarity the proton dose distribution is also shown.
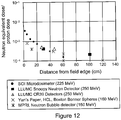
- Figure 12 is a comparison of neutron dose equivalent dose equivalent of neutrons in a particular location outside the treatment volume per 1 Gy absorbed dose of protons delivered to the target, measured in similar conditions from other proton therapy facilities using TE detectors and Bonner Spheres.
- the plotted data show good agreement with dose equivalent measured with SOI microdosimeter of this embodiment processed with Steps 1 to 7 (above).
- the SOI microdosimeter with 3D avalanche SVs thus appears to improve dynamic range and accuracy owing to the avoidance of pile up artefacts in microdosimetric spectra and the ability to analyse the track structure of high energy ions.
- This microdosimeter is free of at least some of the shortcomings of existing silicon microdosimeters but takes advantage of the best features of gas TEPCs, and hence can measure LET to less than 1 keV/ ⁇ m.
Landscapes
- Physics & Mathematics (AREA)
- Health & Medical Sciences (AREA)
- Life Sciences & Earth Sciences (AREA)
- General Physics & Mathematics (AREA)
- High Energy & Nuclear Physics (AREA)
- Molecular Biology (AREA)
- Spectroscopy & Molecular Physics (AREA)
- Measurement Of Radiation (AREA)
Description
- This application is based on and claims the benefit of the filing date of
AU application no. 2006907071 filed 19 December 2006 - The invention relates to a method and apparatus for tissue equivalent solid state microdosimetry, of particular but by no means exclusive application in predicting the probability of cell damage in a radiation field and for predicting Single Event Upsets (SEUs) in microelectronics and dose equivalent measurement.
- Classical radiation absorbed dosimetry operates to determine the average energy deposited per unit mass, J/kg, but cannot predict the radiobiological effects in biological tissue for all types of radiation.
- Early attempts at understanding cellular radiation effects recognized that knowledge of the energy distribution at a scale comparable to the structures affected by irradiation ("ending point") was essential, and hence on a cellular level or DNA level. Consequently, the study of radiation effects on living cells is termed microdosimetry.
- One of the factors affecting local energy deposition is Linear Energy Transfer (LET), that is, the loss of energy per unit distance along the path of a charged particle. With smaller targets, deterministic energy deposition becomes stochastic and depends on the target size and spatial pattern of energy deposited by radiation (by charged particles). It limits the correlation of the LET approach with radiobiological effects.
There are several reasons for the limitations in the LET concept. Firstly, delta ray energy distribution and its relationship to spatial dose distribution are not adequately considered. Particles with different velocities and charges can have the same LET but it is the particle velocity that largely determines the energy distribution of delta rays. In microscopic volumes, the delta ray distribution may be a significant factor in the spatial distribution of energy, particularly at higher ion energies and small site sizes. - Finally, LET, being a non-stochastic average quantity, does not account for the random fluctuations in energy deposition which manifest as clustering of energy deposition and range straggling. The variance due to straggling may exceed the path length variations at high ion energies and small site sizes.
These limitations in LET lead to the formulation of a set of measurable stochastic quantities that provide the fundamental basis for the field of microdosimetry. The two principal quantities are specific energy z=ε/m (where ε is energy deposited in a volume by a single energy deposition event and m is a mass of the sensitive volume-target, SV) and lineal energy y, which is defined as the ratio of ε tol , the mean chord length in that volume. Hence:
- Lineal energy is commonly presented in units of keV µm-1. The mean chord length in a volume is the mean length of randomly orientated chords in that volume, that is

- It is the goal of experimental microdosimetry to measure these quantities in well-defined microscopic volumes, and is hence referred to as regional microdosimetry. Regional microdosimetry is concerned with the measurement of energy deposition in sites and it is the principal objective of experimental microdosimetry. There is a link between microdosimetric experimental quantities and the observed effects of radiation on biological cells.
- The probability distribution of lineal energy f(y) or as a dose distribution d(y) (fraction of energy versus event size) are fundamental functions in regional microdosimetry. The relationship between f(y) and d(y) is :

y F is the average lineal energy for a particular radiation field and secondary charged particle in a medium of interest, and:
- The dose distribution relationship reflects the fact that higher lineal energies deposit a higher dose.
- From the single event lineal energy distribution and the site geometry one may calculate all microdosimetric distributions of interest using the formulae presented above. The representation of these fundamental microdosimetric spectra is traditionally displayed as a log-linear plot with the ordinate multiplied by y, such that the area under the curve delimited by two values of y is proportional to the fraction of events (for f(y)) or the fraction of dose(for d(y)) delivered by events in this range of lineal energy values. This representation accommodates the wide lineal energy range often observed in microdosimetric spectra (from 0.01 keV/µm to several hundred keV/µm) but requires further scaling to preserve the dose to area correspondence.
- Microdosimetry requires instrumentation for measurements of energy ε deposited in a cellular (or sub cellular) SV of interest (whether tissue or water), event-by-event from secondary particles generated in the medium of interest by the radiation field. Of use in such measurements was the development in the early 1950s of the low-pressure gas proportional counter, also referred to as the Rossi counter. Adjustment of sensitive volume up to 1 micron is possible by changing of the gas pressure in a counter. Tissue-Equivalent Proportional Counters (TEPCs) of this type (which are tissue equivalent owing to the tissue equivalence of the gas and surrounding walls) have several shortcomings:
- 1. TEPCs require a gas supply system that are inconvenient in many applications;
- 2. TEPCs are large, up to 1 to 2 cm in diameter, which limits their use where spatial resolution is required;
- 3. TEPCs require high voltage biases, up to 2 kV; and
- 4. TEPCs suffer from the "wall effect" and other physical size related effects, being much larger than the cell structures, leading to artefacts in microdosimetric spectra.
- Microdosimetric spectra can be converted to radiobiological characteristics of the radiation field by convolution with a quality coefficient Q over the range of lineal energies, which reflects increasing probability of cell inactivation with increasing lineal event energy. The coefficient Q is determined by the ICRU (the International Commission on Radiation Units and Measurements) and based on experimental in vitro cell survival measurements; its analytical values are tabulated in Table 1 as a function of L, the unrestricted linear energy transfer in water.
Table 1: Quality coefficient Q(L) L (keV µm-1) Q(L) < 10 1 10 - 100 0.32L - 2.2 > 100 300/L 0.5 - Q is thus a measure of the main difference between absorbed dosimetry and equivalent (radiobiological) dosimetry of radiation fields.
- Solid state detectors are very good owing to their small SV size; this is why in some situations minidosimetry is used instead of microdosimetry. In minidosimetry the small SV of the detector is used to measure absorbed dose or dose rate but with high spatial resolution. For example, MOSFET detectors (which have a very small SV of micron or submicron size) are able to measure absorbed doses with 1 micron spatial resolution, but cannot distinguish the energy deposited in the SV due to a particular event. The output signal instead represents the integral of many events depositing energy in the SV. This occurs with many solid state detectors, such as dosimetric diodes working in current mode, TLDs (thermoluminescent dosimeters) and film.
- However, passive solid state detectors can be used to some extend in microdosimetry. For example, glow peaks in some TLDs are sensitive to LET of particles that are associated with energy deposition on the micron and submicron level. These detectors are not a suitable substitution for TEPCs, as do not have proper LET resolution and cannot be used in real time dosimetry.
- Another passive microdosimetry detector device - disclosed in
U.S. Patent No. 5,596,199 - records the energy deposition of incident radiation using an array of microstructure non-volatile memory devices. The charge from incident charge particles is stored in an electrically insulated (floating) gate, micron or submicron scale SV, of a FAMOS transistor. When this charge exceeds the threshold level the state of the memory cell changes, so the number of cells that have changed state is equal to the number of events that have deposited energy above the threshold. A predetermined initial charge is stored in each cell, which makes the charge increment required to change the state of the cells variable. This is claimed to provide a spectroscopy of the deposited energies, but it is a discreet spectroscopy rather than analogue or real spectroscopy. There can be uncertainty in the change of state of a memory cell, as - rather than resulting from a single event in the SV - a change of state can be due to several consecutive events, thereby giving an incorrect indication of the radiation field. Owing to the passive mode of operation, the charge deposited in the SV is therefore less than on a floating gate. The charge deficit due to recombination depends on the LET of the particle. - Recombination of charge in the gate oxide is well known in MOSFET detectors, and reduces the utility of MOSFET detectors for dosimetry in proton and heavy ions fields (even in an active mode). This microdosimeter is designed principally to distinguish the gamma and neutron components of a radiation field, but it can only with difficultly obtain dose equivalent using the weighting coefficient Q in arbitrary radiation fields as recommended by the ICRU.
-
U.S. Patent No. 5,256,879 discloses a microdosimetry device for qualitatively and quantitatively analyzing a complex radiation field, the device having an array of microstructure parallel p-n junctions each defining a sensitive volume within which a voltage pulse is produced responsive to incident radiation. Circuitry in communication with the array generates digital pulse signals representative of the voltage pulses induced within the sensitive volumes responsive to incident radiation, and provides a summation of the digital pulses occurring at particular energies. The summations of digital pulses are compared to known energies generated by known ionizing particles in comparable sensitive volumes to generate an dose equivalent estimate. - Bradley et al., "Solid state microdosimetry", Nucl. Instr. and Meth. in Phys., B184 (2001) 135-157 disclose a review of solid state microdosimetry with an emphasis on silicon-based devices, including the historical foundations and basics of microdosimetry and a comparison between the performance characteristics of a proportional gas counter and a silicon microdosimeter.
- Another approach, based on the parallel connection of micron scale Si detectors (p-n junctions), provides an active array of micron scale SVs. In this approach reverse biased Si detectors with micron scale silicon SVs - comparable in size to biological cells - are connected to a nuclear spectroscopy setup. The small area of the array of p-n junctions allows pile up to be avoided, provided that charge is generated in a single SV only (which is true in most situations). This condition does not hold, however, if the charged particle traverses an SV in a direction substantially parallel to the surface of the chip. In such cases energy can be deposited in two cells simultaneously, providing a greater charge than if it were deposited in a single SV. Spectroscopy information can be converted to dose equivalent using a weighting factor recommended by the ICRU. This technique has been demonstrated using planar arrays of p-n junctions of NMOS and CMOS SRAM with an SV size of 44 × 44 × 3 microns. Applications of such planar arrays of p-n junctions for regional microdosimetry are limited owing to uncertainty in the average chord, charge collection efficiency within the SV, overlayers and shape of the SV. Increasing the total area of the p-n junction array leads to increases in the noise owing to an increase in capacitance that reduces the minimal LET detected by the microdosimeter. A segmentation approach with several parallel readout spectroscopy channels has been suggested to reduce the noise of the microdosimeter; this method has been demonstrated in the separation of gamma-neutron field without any qualitative or quantitative (dose equivalent) characterization of the radiation field.
- Charge collection spectroscopy in a micron size array of planar P-N junctions (SVs) of a memory chip (SRAM) strongly depends on the fabrication technology, the angle of incidence and SV shape. Hence, interpretation of MCA spectra for conversion to dose equivalent is complex.
- A solid state silicon microdosimeter based on a parallel array of p-n junctions for measurements of tissue equivalent microdosimetric spectra has also been investigated. The viability of measuring integral dose and microdosimetric spectra simultaneously at the same point in a water phantom in fast neutron therapy beam has been demonstrated. A new generation solid state microdosimeter with an array of parallel p-n junctions manufactured on SOI (Silicon-on-Insulator) with SV thicknesses of 2, 5 and 10 µm have been produced and investigated. RPP (right angle parallelepiped) shaped 30 × 30 µm planar SVs (outer P+ contact) and 10 × 10 µm core (N+P p-n junction) regions were connected in parallel producing arrays of 4800 and 10000 cells.
Figure 1 is a schematic view of such an SV at 100, comprising a 3D-fragment of an SOI p-n junction array. The SOI p-n junction array has a better defined SV than have arrays of p-n junctions on a bulk material or commercial SRAM.
It has been demonstrated by Monte Carlo simulations that, for most charged particle of interest (α-particles, protons, electrons and some heavy ions typical for radiation therapy), a 3 × 3 × 3 µm silicon SV is equivalent to 5 × 5 × 5 µm of soft tissue. This amounts to a conversion linear scaling coefficient ζ = 0.63. It has also been demonstrated that solid sate microdosimetry spectra can be converted to tissue equivalent (TE) microdosimetry spectra, that is, to dose equivalent.Figure 2 is aplot 200 of microdosimetric spectra obtained with gas TEPC and 10 µm SOI 4800 parallel cell microdosimeter using developed conversion, at depths of 2.5 and 10 cm in a water phantom on an FNT (Fast Neutron Therapy) beam after TE conversion. These spectra were obtained in a water phantom at the FNT facility, Harper Hospital, Detroit, USA. (The tissue equivalent microdosimetric spectrum obtained with an SOI microdosimeter at depth 2.5 cm in water is shown at 202 and atdepth 10 cm in water at 204; the tissue equivalent microdosimetric spectrum obtained by TEPC at depth 2.5 cm in water is shown at 206 and atdepth 10 cm in water at 208.) - It is apparent from
Figure 2 that an SOI microdosimeter with an array of planar p-n junctions is essentially unable to measure events with LET (Lineal Energy Transfer) less than 1-2 keV/(µm; this is due to detector noise. This low LET part of the spectra is related to high energy gamma radiation, but it can dominate in certain radiation fields and is important to measure.
Detailed investigations of charge collection in a single SV of an SOI planar RPP SVs using IBIC ion microbeam has shown non-uniformity of charge collection, with increasing charge deficit laterally away from the centre of SV.Figures 3A, 3B and 3C are charge collection images, obtained with 3 MeV α-particle scanning microbeam in 30 x 30 µm planar RPP SVs in a 10 µm SOI microdosimeter.Figure 3A corresponds to a p-n junction bias of 0 V,Figure 3B to a p-n junction bias of 5 V andFigure 3C to a p-n junction bias of 10 V. Charge collection is almost 100% in the central part of the SV under the N+P p-n junction and diminishes laterally from the central axis of the SV owing to the lessening electrical field. - Losses of charge in a planar P-N junction cell due to recombination prevents the accurate measurement of energy deposited in a cell from a single event, thus reducing the accuracy of equivalent dosimetry. This is a disadvantage of the current design of solid state microdosimeters with planar p-n junction. Also, reducing the size of the SV to reduce the charge deficit reduces the energy deposited in the SV, and this technique is also limited by the noise of the detector.
- Two charged particles with the same LET can have different delta electron track structures, which are dependent on the speed of the charged particle. As the size of the SV is reduced, high energy delta electrons can be deposited in neighbouring cells (viz. SVs) and will be accepted as single events in an SV owing to the parallel connection of the p-n junctions. This produces an error in the determination of the cluster of deposited energy in a single SV. This effect is typical for high energy heavy ions in deep space radiation with delta electron energies up to 1 MeV.
- According to a first broad aspect, therefore, the present invention provides a microdosimeter, as set forth in
independent claim 1, and comprising: - an array of detectors, each providing a sensitive volume-target; and
- a tissue equivalent medium for generating secondary charged particles;
- characterized in that the array is manufactured from a semiconductor on insulator wafer and the detectors are located to detect secondary charged particles generated in the tissue equivalent medium;
- the detectors are three-dimensional (i.e. not planar) p-n junction semiconductor detectors;
- the detectors are embedded in and spatially separated by said tissue equivalent medium; and
- each of said detectors has a core p+ electrode and an outer n+ electrode region, or core n+ electrode and an outer p+ electrode region.
- In one particular embodiment, the detectors are micron scale detectors.
- However, in other embodiments it is possible to provide submicron scale detectors (i.e. "nano-dosimetry"), with little noise from readout electronics.
- In one embodiment, the detectors are cylindrical or near-cylindrical, or frusta-conical.
- However, the detectors may be produced in other shapes, such as cubes or rectangular prisms.
- Preferably the core comprises a rod-like p+ region within a Si SV. Hence, a strong electrical field can be achieved with a low bias voltage (of, for example, 10-15'V).
- In one particular embodiment, the tissue equivalent medium comprises polymethylmethacrylate (which is also known as acrylic).
- One advantage of this microdosimeter is its essentially 100% collection of charges produced by charged particles owing to the absence of lateral diffusion (which occurs with planar p-n junctions in existing arrangements). It allows accurate determinations of deposited energy event by event, and allows error reductions in the determination of dose equivalents.
- In an embodiment, each of the detectors is an avalanche detector for amplification of the deposited charge. Preferably the amplification is controllable with p-n junction bias.
- In one particular embodiment, the detectors are connected such that each of the detectors is not connected to at least one of its immediately neighbouring detectors of the detectors. This allows the more accurate observation of the pattern of charge particle track produced by δ-electrons and the use of more sophisticated approaches in the determination of dose equivalent.
- According to another aspect of the invention, there is provided a method for performing microdosimetry, as set forth in
independent claim 10, and employing the microdosimeter described above. - Thus, the present invention provides a method for performing microdosimetry, comprising:
- exposing a tissue equivalent medium to a radiation source, thereby generating secondary charged particles in the tissue equivalent medium; and
- detecting at least some of the secondary charged particles with an array of detectors, each providing a sensitive volume-target, the array manufactured from a semiconductor on insulator wafer;
- characterized in that the detectors are three-dimensional p-n junction semiconductor detectors;
- the detectors are embedded in and spatially separated by said tissue equivalent medium; and
- each of said detectors has a core p+ electrode and an outer n+ electrode region, or core n+ electrode and an outer p+ electrode region.
- According to the claimed invention, each of the cores of the detectors (402; 500 ; 600) comprises a rod-like p+ region (502; 602) within a Si sensitive volume (504; 604) or a rod-like n+ region within a Si sensitive volume (504; 604).
- In an embodiment, the detectors are connected such that each of said detectors is not connected to at least one of its immediately neighbouring detectors of said detectors.
- In an embodiment, the method includes:
- acquiring at least one spectrum of data from said detectors,
- determining absorbed dose in Si from said spectrum,
- converting said spectrum to a lineal energy spectrum,
- determining from said lineal energy spectrum a differential dose d(y) deposited in tissue equivalent material by secondary events within a lineal energy range y to y+dy,
- converting semiconductor absorbed dose to tissue equivalent absorbed dose using respective semiconductor and tissue equivalent ionizing stopping powers for secondary particles, and
- determining dose equivalent in a tissue from said tissue equivalent absorbed dose, including convoluting said differential dose d(y) with a lineal energy dependent quality coefficient.
- According to yet another aspect of the invention, there is provided a method, as set forth in independent claim 14, for processing data generated with the microdosimeter of the invention, to convert spectra of charge deposited in Si to tissue dose equivalent, comprising:
- acquiring at least one spectrum with a microdosimeter as described above;
- determining absorbed dose in Si from the spectrum ;
- converting the spectrum to a lineal energy spectrum;
- determining from the lineal energy spectrum a differential dose d(y) deposited in tissue equivalent material by secondary events within a lineal energy range y to y+dy;
- converting semiconductor (e.g. silicon) absorbed dose to tissue equivalent absorbed dose using respective semiconductor and tissue equivalent ionizing stopping powers for secondary particles; and
- determining dose equivalent in a tissue from the tissue equivalent absorbed dose, including convoluting the differential dose (typically normalized) with a lineal energy dependent quality coefficient.
- The converting of the spectrum to a lineal energy spectrum typically employs a tissue equivalent average chord (such as determined from an average SV chord).
- The lineal energy dependent quality coefficient is typically Q(y).
- In order that the invention may be more clearly ascertained, embodiments will now be described, by way of example, with reference to the accompanying drawing, in which:
-
Figure 1 is a view of a solid state microdosimeter with an array of parallel planar p-n junctions manufactured on Silicon-on-Insulator according to the background art; -
Figure 2 is a plot of microdosimetric spectra obtained with gas TEPC and 10 µm SOI 4800 parallel cell microdosimeters according to the background art; -
Figures 3A, 3B and 3C are charge collection images, obtained with 3 MeV α-particle scanning microbeam in 30 × 30 µm planar RPP SVs in a 10 µm SOI microdosimeter of the background art; -
Figure 4 is a simplified schematic view of a solid state microdosimeter comprising a micron or submicron array of cylindrical or near-cylindrical three-dimensional SVs according to an embodiment of the present invention; -
Figure 5 is a schematic view of an ideal form of an SV of the microdosimeter ofFigure 4 ; -
Figure 6 is a schematic view of a near-cylindrical SV according to this embodiment; -
Figure 7 is a simplified partial schematic view of the array layout of the SVs of the microdosimeter ofFigure 4 ; -
Figure 8 is a readout schematic of a portion of the array layout ofFigure 7 ; -
Figure 9 is an example of a set of plots of TE microdosimetric spectra, derived from experimentally measured MCA spectra obtained from a background art SOI microdosimeter comparable to that ofFigure 1 in response to a mixed gamma/neutron radiation field of a Pu-Be neutron source with and without the presence of a polyethylene converter layer, analysed according to the data processing method of the embodiment ofFigure 4 ; -
Figure 10 is a set of plots of TE microdosimetric spectra obtained from MCA spectra with abackground art 10 µm SOI microdosimeter comparable to that ofFigure 1 in a water phantom at different depths along the Bragg peak from a 190 MeV proton beam; -
Figures 11A, 11B ,11C and 11D are exemplary plots of the derivation of the distribution of neutron dose equivalent obtained with a 10 µm background art SOI microdosimeter comparable to that ofFigure 1 and data processing method of that embodiment, behind a proton field typical for prostate cancer treatment; and -
Figure 12 is a comparative plot of neutron dose equivalent measured in similar conditions from a background art microdosimeter comparable to that ofFigure 1 analysed according to the data processing method of the embodiment ofFigure 4 , and with other proton therapy facilities using TE detectors and Bonner Spheres. -
Figure 4 is a schematic isometric view (though simplified, including by the omission of electrical connections) of asolid state microdosimeter 400 according to an embodiment of the present invention. Themicrodosimeter 400 comprises a micron or submicron array of cylindrical or near-cylindrical three-dimensional - and hence non-planar - SVs (each a silicon detector) 402. The illustrated example comprises a 6 × 6 array, but this is purely for illustrative purposes; in practice the microdosimeter may comprise an array of 4800 or more SVs, and it will be understood that arrays of other sizes may be employed according to this embodiment; the arrays are commonly square but need not be. - The array of 3D SVs is manufactured from an SOI wafer, such as with isolation technology (e.g. mesa etching technology). The 3D SVs - once manufactured - are embedded in PMMA (or acrylic) 404 by any known, suitable technique. The
PMMA 404 is a tissue equivalent medium for the generation of secondary charged particles, as in tissue in the case of neutron irradiation and also for electronic equilibrium in the case of photon radiation. The thickness of thePMMA 404 can be selected according to application, as will be appreciated by those skilled in this art. Themicrodosimeter 400 has internal (avalanche) amplification. Inuse microdosimeter 400 is covered with the tissue equivalent material of interest or inserted into an object of interest for measurements of dose equivalent produced by secondary particle in the material of interest. -
Figure 5 is a schematic view of anideal form 500 of anSV 402 ofmicrodosimeter 400. In theirideal form 500 theSVs 402 are cylindrical (as depicted in this figure), but manufacturing constraints will make most practical SVs according to this embodiment near-cylindrical frusta-conical. TheSVs 402 are produced using SOI technology. Each comprises a core p+ inner diffusion or implantation layer 502 (of diameter d), surrounded by anactive silicon layer 504, and a n+ outer layer 506 (of outer diameter D). - The fixed thickness
active silicon layer 504 of the SOI and of the surface of each SV allows SVs of well defined and uniform shape to be manufactured. Three possible sizes of theSVs 402 are proposed: d = 1 µm and D = 5 µm, d = 3 µm and D = 8 µm, and d = 5 µm and D = 10 µm. - The
p+ core 502 and n+outer layer 506 produce a well defined electrical field allowing substantially 100% charge collection. The small radial size of the p+ core 502 (andSV 402 overall) provides a sufficiently strong electrical field near thecore 502 with reasonable values of applied reverse bias (for example, 5-10 V) for the avalanche process. Such structures were produced by 0.18 µm technology. Spatial separation of the SVs is achieved with, for example, mesa-etching technology on a depth of active layer SOI. - As will be understood by those skilled in the art, in another
embodiment SV 402 could instead have a n+ core and p+ outer layer. -
Figure 6 is a schematic view of a near-cylindrical and hence morerealistic SV 600 suitable formicrodosimeter 400.SV 600 is also produced using SOI technology, and comprises a core p+ inner diffusion orimplantation layer 502, surrounded by anactive silicon layer 604, and a n+outer layer 606. -
Figure 7 is a schematic view of thearray layout 700 ofSVs 402, 600 (comprising 3D p-n junctions) ofmicrodosimeter 400.Array layout 700 comprises a number of groups of SVs connected to separate channels of the readout electronics (not shown), the readout electronics operating in spectroscopy mode. In this figure, the outer layer of each p-n junction is shown as a circle, and the inner core as a central dot. - In this example, each group of SVs comprises five SVs arranged generally horizontally (as shown in this figure) and interleaved with another group of SVs. Consequently, the (partial)
array layout 700 includes 12output pads output pad A 702a, and the cores of the even SVs tooutput pad B 702g. In the next row down, this is reversed: the cores of the odd SVs (counting from the left) are connected tooutput pad B 702h, and the cores of the even SVs tooutput pad A 702b. - All outer layers of the p-n junctions are connected to a pad G (or ground) 704a, 704b, 704c, 704d, 704e, 704f.
- This arrangement allows measurements of energy cluster spread over more than one cell independently (where, in existing designs, such events will be related to a single p-n junction SV, thereby introducing errors in energy cluster determination). For example, such events may be in the form of high energy heavy ions with delta electrons radially distributed beyond the size of an SV. With
layout 700, each SV is generally surrounded by four other SVs with different outputs from that of the first SV. Thus, in the figure, each SV with an electrical output pad B (clear) is surrounded by four SVs with output pads A (shaded). (SVs at the edge of the array have three neighbouring SVs, and corner SVs have two neighbouring SVs.) This segmentation allows pile-up effects to be reduced, and reduces the capacitance of each subset of the array, hence improving the energy resolution of the microdosimeter. - Also, independent readouts of output pads A and output pads B allow coincidence measurements, which are important for observing track structures. The radial distribution of a deposited energy event can be measured while the efficient sensitive total area of the microdosimeter is the same as in the case of a parallel p-n junction array. The ratio of the deposited energies in a the first SV and the surrounding four SVs, measured in coincidence, provides important radiobiological information in measurements of the RBE of a radiation field, in additional to the usual microdosimetry information.
-
Figure 8 is a readout schematic of a portion of thearray layout 700 ofFigure 7 . Exemplary "core"SV 802 and four "surrounding"SVs 804 are shown, connected to two separate readoutcharge spectroscopy channels - In practice there are many channels (or segments) of readout to reduce capacitance, each segment corresponding to a plurality of parallel rows of the array (cf.
Figure 7 ). This is achieved by connecting pluralities of output pads A, B and G (respectively). - Before summing, the
first channel 806a (hence the output of the core SV 802) is passed through alinear gate 810, providing conventional MCA spectra (of energy deposited in the SVs by secondary charged particles in the medium of interest) atMCA 812. For events with an energy deposition cluster distributed over thecore SV 802 and surroundingSVs 804, a coincidence signal is generated 814 that blocks thesecond channel 806b (i.e. the outputs of the surrounding SVs 804) and charge is acquired to theMCA 812 from the core orfirst channel 806a. Separate values of "core charge" Qc from thecore SV 802 and "surrounding charge" Qs from the surroundingSVs 804 are thus generated at 816, the former excluding spurious duplicate events from the surroundingSVs 804. Together, Qc and Qs provide 2D plots of energy distribution between the two channels, that is, the track structure of high energy events, without reducing the sensitive area of themicrodosimeter 400. The spectrum of Qc/Qs ratio is a radiobiological parameter that extends the utility of the microdosimeter, including in the prediction of the cellular response to radiation fields in terms of track structure theory. Significant levels of coincidence events are expected in, for example, deep space radiation fields with high energy ions (such as Fe, Ti and C) with energies of the order of 1 GeV/u. - The
solid state microdosimeter 400 and associated, front-end electronics 800 in bothchannels - In regional microdosimetry mode the following steps are used, according to this embodiment, to convert the spectra of deposited energy cluster in silicon to dose equivalent:
-
Step 1. Acquiring MCA spectra (f(E) versus E) at the output of MCA (at 812 inFigure 8 ), as described above. -
Step 2. Determining absorbed dose in Si from MCA spectra:
microdosimeter 400. -
Step 3. Determining an average SV chord with conversion to tissue equivalent (TE) average chord <l>TE:
- Step 4 . Converting MCA spectra (f(E) versus E) to the lineal energy spectra f(y) vs y where y is equal :

- Step 5. Determining the fraction of dose deposited in tissue equivalent material by secondaries within lineal energy range y to y+dy:


It is clear that such normalization provides
- Step 6. Converting silicon absorbed dose to TE absorbed dose using Bragg Gray cavity theory:

- Step 7. Determining dose equivalent in a tissue, in Sv:

Figure 2 .) - In addition to the regional microdosimetry steps presented above, information on track structure can be used in predicting risk of cancer induction.
- Below are examples of applications of
solid state microdosimeter 400 for radiation protection and neutron dose equivalent measurements in terms of Sv in tissue in proton therapy outside the proton field. In first and second experiments, 5 and 10 µm thick SOI microdosimeters (according to the above described embodiment) based on arrays of 4800 of planar parallel p-n junctions withsize 30 × 30 × 10 µm, covered by a thin layer of polyethylene for mimic of TE material were used. Incomplete charge collection in a planar p-n junction was taken into account with a correction coefficient obtained from studies of charge collection imaging on heavy ions microprobe (seeFigures 3A, 3B and 3C ). The aim of these examples is to demonstrate the feasibility of active solid state microdosimetry for TE measurements. - Measurement of TE microdosimetric spectra on Pu-Be gamma-neutron source.
- The response of an SOI microdosimeter of the background art (cf.
Figure 1 ) in a mixed gamma/neutron field produced from a 238Pu-Be radioisotope neutron source was measured. The source was located in a general purpose neutron irradiation facility of floor area 7.5 m2; the facility was surrounded bywalls 400 mm thick and 1.75 m high of borated paraffin and concrete. The source activity was 325 GBq with an estimated neutron emission rate of 2 × 10⁷ neutrons in 4π. The average energy of fast neutrons was approximately 4 MeV with a maximum energy of about 10 MeV. The dominant gamma component was a 4.4 MeV emission associated with the decay of the bound excited state of 12C* produced in the Be(α,n) reaction within the 238Pu-Be source. The 5 µm thick SOI microdosimeter with 4800 planar parallel p-n junctions was mounted at a distance of approximately 2.6 cm from the source. -
Figure 9 is an example of a set ofplots 900 of TE microdosimetric spectra derived from experimentally measured MCA spectra, in response to the mixed gamma/neutron radiation field with and without the presence of a polyethylene converter layer, obtained according to theabove Steps 1 to 4 of the data analysis method of this embodiment. The solid line (for the bare SOI microdosimeter) has been scaled up 100 times for ease of comparison and related to event interaction of neutron in Si material. The contribution to simulated dose equivalent is negligible (less then 1%). Microdosimetric spectra match the shape of spectra obtained with TEPC well, supporting the validity of the method of this embodiment. - Measurements were made of dose equivalent of neutron contamination in a patient phantom produced during proton therapy.
- The interaction of 250 MeV protons with beam modifying devices and the patient produces fast neutrons that are deposit the energy dose in the patient and may be the cause of secondary cancer. Estimates were made of the equivalent neutron dose within the phantom outside the proton field using solid state microdosimeter and the steps of the data analysis method of the above embodiment.
-
Figure 10 is a set ofplots 1000 of TE microdosimetric spectra obtained from the MCA spectra with abackground art 10 µm SOI microdosimeter comparable to that ofFigure 1 in a water phantom at different depths in the water phantom along the proton Bragg peak. Proton energy was 190 MeV; the range was 26 cm. For clarity, the individual spectra - according to data collection position - are labelled as follows: - 1002 x = 2.2 cm
- 1004: x = 20 cm
- 1006: x = 23.2 cm
- 1008: x = 23.9 cm
- 1010: x = 25 cm
- 1012: x = 26 cm
- 1014: x = 30 cm
- Changes in the shape of the TE normalized microdosimetric spectra with depth to higher LET, due to reducing proton energy, are apparent. The
data 1014 collected at x = 30 cm (i.e. 4 cm behind the Bragg peak) shows a contribution from neutrons. Good agreement was observed between these microdosimetric spectra and data obtained with TEPC.Figures 11A, 11B ,11C, 11D and11E illustrate the derivation of the distribution of neutron dose equivalent obtained with a 10 µm background art SOI microdosimeter (cf.Figure 1 ), behind a proton field typical for prostate cancer treatment. With the steps of the method of this embodiment described above, neutron dose equivalent was measured 5 cm laterally from the field edge of the proton field along the Spread Out Bragg Peak (SOBP) in an acrylic phantom. Proton energy was 250 MeV.
The data demonstrate the applicability of this approach for dose equivalent measurements in tissue. The equivalent neutron doses are in a good agreement with that measured with Bonner spheres and TEPC. Another advantage of the SOI microdosimeter is that its spatial resolution is superior to other methods that allow measurements to be made in any point in a phantom. - Thus,
Figure 11A is a plot of MCA spectra f(E) versus deposited energy (keV), obtained with a background art SOI microdosimeter comparable to that ofFigure 1 (cf. Step 1). InStep 2, the areas under the MCA spectra and total mass of Si sensitive volumes are used to obtain the absorbed dose in Si. Absorbed dose in Si is converted to TE dose. Ratio of stoping powers used was 0.63. -
Steps 3 and 4 comprise the conversion of the MCA spectra (f(E) versus energy) to the lineal energy spectra f(y) versus y; the result is plotted inFigure 11B . - In Step 5, normalized microdosimetry spectra are obtained, as shown in
Figure 11C (in which, as a result, the area under the curve is 1). - Steps 6 and 7 produce a simulation of dose equivalent by convolution of spectra on
Figure 11C and Q(y) of Table 1. -
Figure 11D a plot of the derived distribution of neutron dose equivalent, expressed in mSv (millisiverts) per 1 Gy of proton absorbed dose. For clarity the proton dose distribution is also shown. -
Figure 12 is a comparison of neutron dose equivalent dose equivalent of neutrons in a particular location outside the treatment volume per 1 Gy absorbed dose of protons delivered to the target, measured in similar conditions from other proton therapy facilities using TE detectors and Bonner Spheres. The plotted data show good agreement with dose equivalent measured with SOI microdosimeter of this embodiment processed withSteps 1 to 7 (above). - These examples demonstrate firstly the utility of SOI microdosimeters with arrays of three-dimensional p-n junctions according to this invention, and data processing according to the seven step method described above according to this invention for quantitative characterization of mixed radiation fields in terms of tissue, rather than separation of gamma from neutron radiation in terms of counts as performed by others using arrays of planar p-n junctions for microdosimetry.
- The SOI microdosimeter with 3D avalanche SVs according to this embodiment thus appears to improve dynamic range and accuracy owing to the avoidance of pile up artefacts in microdosimetric spectra and the ability to analyse the track structure of high energy ions. This microdosimeter is free of at least some of the shortcomings of existing silicon microdosimeters but takes advantage of the best features of gas TEPCs, and hence can measure LET to less than 1 keV/µm.
Claims (15)
- A microdosimeter, comprising:an array (700) of detectors (402; 500; 600), each providing a sensitive volume-target; anda tissue equivalent medium (404) for generating secondary charged particles;characterized in that said array (700) is manufactured from a semiconductor on insulator wafer and said detectors (402; 500; 600) are located to detect secondary charged particles generated in said tissue equivalent medium (404);the detectors (402; 500; 600) are three-dimensional p-n junction semiconductor detectors (402; 500; 600) ;the detectors (402; 500; 600) are embedded in and spatially separated by said tissue equivalent medium (404); andeach of said detectors (402; 500; 600) has a core electrode (502, 602) surrounded by an active silicon layer (504, 604) surrounded by an outer electrode region (506, 606), wherein the volume of the core electrode, active silicon layer, and outer electrode region define the sensitive volume-target, and wherein either:the core electrode is a p+ electrode (502; 602) and the outer electrode region is a n+ electrode region (506; 606); orthe core electrode is a n+ electrode and the outer electrode region is a p+ electrode region.
- A microdosimeter as claimed in claim 1, wherein said semiconductor detectors (402; 500; 600) are silicon detectors and/or micron scale detectors.
- A microdosimeter as claimed in either claim 1 or 2, wherein the core of each of the detectors (402; 500; 600) comprises a rod-like p+ region (502; 602) within a Si sensitive volume (504; 604) or a rod-like n+ region within a Si sensitive volume (504; 604).
- A microdosimeter as claimed in any one of claims 1 to 3, wherein the detectors are cylindrical or near-cylindrical, or frusta-conical.
- A microdosimeter as claimed in any one of claims 1 to 4, wherein said tissue equivalent medium (404) comprises polymethylmethacrylate.
- A microdosimeter as claimed in any one of claims 1 to 5, wherein each of said detectors (402; 500; 600) is an avalanche detector for amplification of deposited charge.
- A microdosimeter as claimed in claim 6, wherein said amplification is controllable with p-n junction bias.
- A microdosimeter as claimed in any one of claims 1 to 7, wherein said detectors (402; 500; 600) are connected such that each of said detectors (402; 500; 600) is not connected to at least one of its immediately neighbouring detectors of said detectors (402; 500; 600).
- A microdosimeter as claimed in any one of claims 1 to 8, including a multi-channel analyser for acquiring at least one spectrum of data from said detectors (402; 500; 600), and computational means for determining absorbed dose in Si from said spectrum, converting said spectrum to a lineal energy spectrum, determining from said lineal energy spectrum a differential dose d(y) deposited in tissue equivalent material by secondary events within a lineal energy range y to y+dy, converting semiconductor absorbed dose to tissue equivalent absorbed dose using respective semiconductor and tissue equivalent ionizing stopping powers for secondary particles, and determining dose equivalent in a tissue from said tissue equivalent absorbed dose, including convoluting said differential dose d(y) with a lineal energy dependent quality coefficient.
- A method for performing microdosimetry, comprising:exposing a tissue equivalent medium (404) to a radiation source, thereby generating secondary charged particles in said tissue equivalent medium (404); anddetecting at least some of said secondary charged particles with an array (700) of detectors (402; 500; 600), each providing a sensitive volume-target, said array (700) being manufactured from a semiconductor on insulator wafer;characterized in that the detectors (402; 500; 600) are three-dimensional p-n junction semiconductor detectors (402; 500; 600);the detectors (402; 500; 600) are embedded in and spatially separated by said tissue equivalent medium (404); andeach of said detectors (402; 500; 600) has a core electrode surrounded by an active silicon layer surrounded by an outer electrode region, wherein the volume of the core electrode, active silicon layer, and outer electrode region define the sensitive volume-target, and wherein either:the core electrode is a p+ electrode (502; 602) and the outer electrode region is a n+ electrode region (506; 606); orthe core electrode is a n+ electrode and the outer electrode region is a p+ electrode region.
- A method as claimed in claim 10, wherein the core of each of the detectors (402; 500; 600) comprises a rod-like p+ region (502; 602) within a Si sensitive volume (504; 604) or a rod-like n+ region within a Si sensitive volume (504; 604) .
- A method as claimed in either claim 10 or 11, wherein said detectors (402; 500; 600) are connected such that each of said detectors (402; 500; 600) is not connected to at least one of its immediately neighbouring detectors of said detectors (402; 500; 600).
- A method as claimed in any one of claims 10 to 12, including:acquiring at least one spectrum of data from said detectors (402; 500; 600),determining absorbed dose in Si from said spectrum,converting said spectrum to a lineal energy spectrum,determining from said lineal energy spectrum a differential dose d(y) deposited in tissue equivalent material by secondary events within a lineal energy range y to y+dy,converting semiconductor absorbed dose to tissue equivalent absorbed dose using respective semiconductor and tissue equivalent ionizing stopping powers for secondary particles, anddetermining dose equivalent in a tissue from said tissue equivalent absorbed dose, including convoluting said differential dose d(y) with a lineal energy dependent quality coefficient.
- A method for processing microdosimeter data, comprising:acquiring at least one spectrum with a microdosimeter (400) as claimed in any one of claims 1 to 9;determining absorbed dose in Si from said spectrum;converting said spectrum to a lineal energy spectrum;determining from said lineal energy spectrum a differential dose d(y) deposited in tissue equivalent material (404) by secondary events within a lineal energy range y to y+dy;converting semiconductor absorbed dose to tissue equivalent absorbed dose using respective semiconductor and tissue equivalent ionizing stopping powers for secondary particles; anddetermining dose equivalent in a tissue from said tissue equivalent absorbed dose, including convoluting said differential dose d(y) with a lineal energy dependent quality coefficient.
- A method as claimed in claim 14, including converting said spectrum to a lineal energy spectrum with a tissue equivalent average chord.
Applications Claiming Priority (2)
| Application Number | Priority Date | Filing Date | Title |
|---|---|---|---|
| AU2006907071A AU2006907071A0 (en) | 2006-12-19 | Method and Apparatus for Tissue Equivalent Solid State Microdosimetry | |
| PCT/AU2007/001961 WO2008074074A1 (en) | 2006-12-19 | 2007-12-19 | Method and apparatus for tissue equivalent solid state microdosimetry |
Publications (3)
| Publication Number | Publication Date |
|---|---|
| EP2102685A1 EP2102685A1 (en) | 2009-09-23 |
| EP2102685A4 EP2102685A4 (en) | 2017-02-08 |
| EP2102685B1 true EP2102685B1 (en) | 2019-04-03 |
Family
ID=39535882
Family Applications (1)
| Application Number | Title | Priority Date | Filing Date |
|---|---|---|---|
| EP07845402.2A Active EP2102685B1 (en) | 2006-12-19 | 2007-12-19 | Method and apparatus for tissue equivalent solid state microdosimetry |
Country Status (4)
| Country | Link |
|---|---|
| US (1) | US8421022B2 (en) |
| EP (1) | EP2102685B1 (en) |
| ES (1) | ES2733104T3 (en) |
| WO (1) | WO2008074074A1 (en) |
Families Citing this family (15)
| Publication number | Priority date | Publication date | Assignee | Title |
|---|---|---|---|---|
| WO2010003134A2 (en) | 2008-07-03 | 2010-01-07 | Masimo Laboratories, Inc. | Protrusion, heat sink, and shielding for improving spectroscopic measurement of blood constituents |
| US8630691B2 (en) | 2008-08-04 | 2014-01-14 | Cercacor Laboratories, Inc. | Multi-stream sensor front ends for noninvasive measurement of blood constituents |
| WO2010140944A1 (en) * | 2009-06-05 | 2010-12-09 | Rti Electronics Ab | X-ray detection device |
| US8688183B2 (en) * | 2009-09-03 | 2014-04-01 | Ceracor Laboratories, Inc. | Emitter driver for noninvasive patient monitor |
| WO2012034157A1 (en) | 2010-09-13 | 2012-03-22 | Rmit University | Brachytherapy dose verification apparatus, system and method |
| US9645255B2 (en) * | 2011-09-21 | 2017-05-09 | Varian Medical Systems Particle Therapy Gmbh | Method for efficient daily constancy check or calibration of proton therapy system |
| US8858888B2 (en) * | 2012-12-19 | 2014-10-14 | James Francis Ziegler | Radiation microdosimeters correlated with biological cells and cell components |
| US9759672B2 (en) | 2012-12-19 | 2017-09-12 | James Francis Ziegler | Radiation detecting wearable devices |
| WO2015114193A1 (en) * | 2014-01-28 | 2015-08-06 | Consejo Superior De Investigaciones Científicas (Csic) | Microdosimeter based on 3d semiconductor structures, method for producing said microdosimeter, and use of said microdosimeter |
| US10481278B2 (en) | 2016-04-13 | 2019-11-19 | Dalhousie University | Tissue-equivalent dosimeter |
| CN113109859B (en) * | 2021-04-08 | 2024-04-30 | 西北核技术研究所 | A method for obtaining low LET heavy ion single event upset cross section |
| CN114594510B (en) * | 2022-02-25 | 2024-06-21 | 西北核技术研究所 | Combined type adjustable charged particle balance body of thermoluminescent dosimeter and installation method thereof |
| CN116500665B (en) * | 2023-05-17 | 2025-08-29 | 成都工业学院 | Tissue Equivalent Conversion Method for Microdose Detectors Based on Fourier Scaling Transform Characteristics |
| US20240402006A1 (en) * | 2023-06-02 | 2024-12-05 | International Business Machines Corporation | Flexible ultraviolet sensor |
| CN117148410A (en) * | 2023-08-30 | 2023-12-01 | 中国科学院新疆理化技术研究所 | Calculation method of absorbed dose in sensitive area when floating gate transistor reaches secondary electron balance |
Family Cites Families (5)
| Publication number | Priority date | Publication date | Assignee | Title |
|---|---|---|---|---|
| US5256879A (en) | 1991-10-10 | 1993-10-26 | Clemson University | Microdosimetry radiation analysis method and device |
| US5430308A (en) * | 1993-10-27 | 1995-07-04 | Accuray, Inc. | 3-dimensional radiation dosimeter |
| JP2701754B2 (en) * | 1994-10-03 | 1998-01-21 | 日本電気株式会社 | Method for manufacturing silicon light receiving element |
| US5693968A (en) * | 1996-07-10 | 1997-12-02 | Board Of Supervisors Of Louisiana State University And Agricultural And Mechanical College | Bi-directional, fast-timing, charge coupled device |
| US20060027756A1 (en) * | 2004-08-09 | 2006-02-09 | Ian Thomson | Dosimeter having an array of sensors for measuring ionizing radiation, and dosimetry system and method using such a dosimeter |
-
2007
- 2007-12-19 EP EP07845402.2A patent/EP2102685B1/en active Active
- 2007-12-19 US US12/520,077 patent/US8421022B2/en active Active
- 2007-12-19 ES ES07845402T patent/ES2733104T3/en active Active
- 2007-12-19 WO PCT/AU2007/001961 patent/WO2008074074A1/en not_active Ceased
Non-Patent Citations (1)
| Title |
|---|
| None * |
Also Published As
| Publication number | Publication date |
|---|---|
| ES2733104T3 (en) | 2019-11-27 |
| WO2008074074A1 (en) | 2008-06-26 |
| US20100090118A1 (en) | 2010-04-15 |
| EP2102685A1 (en) | 2009-09-23 |
| EP2102685A4 (en) | 2017-02-08 |
| US8421022B2 (en) | 2013-04-16 |
Similar Documents
| Publication | Publication Date | Title |
|---|---|---|
| US8421022B2 (en) | Method and apparatus for tissue equivalent solid state microdosimetry | |
| Rosenfeld | Novel detectors for silicon based microdosimetry, their concepts and applications | |
| Bradley et al. | Solid state microdosimetry | |
| Bradley | The development of a novel silicon microdosimeter for high LET radiation therapy | |
| US9941440B2 (en) | Radiation microdosimeters correlated with biological cells and cell components | |
| US4857737A (en) | Gamma ray measurement utilizing multiple compton scattering | |
| Parisi et al. | Microdosimetry for hadron therapy: a state of the art of detection technology | |
| Mumm et al. | New limit on time-reversal violation in beta decay | |
| Rosenfeld et al. | Simultaneous macro and micro dosimetry with MOSFETs | |
| Livingstone et al. | Large area silicon microdosimeter for dosimetry in high LET space radiation fields: Charge collection study | |
| Caffrey et al. | A review of instruments and methods for dosimetry in space | |
| Fleta et al. | 3D cylindrical silicon microdosimeters: fabrication, simulation and charge collection study | |
| Guardiola et al. | Microdosimetry in low energy proton beam at therapeutic-equivalent fluence rate with silicon 3D-cylindrical microdetectors | |
| Tran et al. | 3D radiation detectors: Charge collection characterisation and applicability of technology for microdosimetry | |
| Bartlett et al. | Active neutron personal dosemeters-A review of current status | |
| US11125893B2 (en) | Analyzing method using a detector of alpha particles | |
| Sheng et al. | Low-activity gamma source direction detection system based on NaI scintillator detector | |
| Tran et al. | Ultra-thin 3-D detector: Charge collection characterization and application for microdosimetry | |
| EP3933449B1 (en) | System for dosimetric and micro-dosimetric ionizing radiation characterization | |
| Livingstone et al. | Charge collection in n-SOI planar microdosimeters | |
| EP3821276B1 (en) | Silicon carbide ionizing radiation detector | |
| Caffrey et al. | Space radiation dosimetry: overview and recent developments | |
| Tran | Advanced semiconductor silicon detector for dosimetry and microdosimetry in radiation protection and hadron therapy | |
| US9759672B2 (en) | Radiation detecting wearable devices | |
| Palmans | Detectors, relative dosimetry, and microdosimetry |
Legal Events
| Date | Code | Title | Description |
|---|---|---|---|
| PUAI | Public reference made under article 153(3) epc to a published international application that has entered the european phase |
Free format text: ORIGINAL CODE: 0009012 |
|
| 17P | Request for examination filed |
Effective date: 20090702 |
|
| AK | Designated contracting states |
Kind code of ref document: A1 Designated state(s): AT BE BG CH CY CZ DE DK EE ES FI FR GB GR HU IE IS IT LI LT LU LV MC MT NL PL PT RO SE SI SK TR |
|
| DAX | Request for extension of the european patent (deleted) | ||
| RIC1 | Information provided on ipc code assigned before grant |
Ipc: G01T 1/24 20060101AFI20160926BHEP Ipc: G01T 3/08 20060101ALI20160926BHEP Ipc: G01T 1/02 20060101ALI20160926BHEP Ipc: H01L 31/115 20060101ALI20160926BHEP |
|
| RA4 | Supplementary search report drawn up and despatched (corrected) |
Effective date: 20170112 |
|
| RIC1 | Information provided on ipc code assigned before grant |
Ipc: G01T 1/02 20060101ALI20170105BHEP Ipc: G01T 1/24 20060101AFI20170105BHEP Ipc: G01T 3/08 20060101ALI20170105BHEP Ipc: H01L 31/115 20060101ALI20170105BHEP |
|
| STAA | Information on the status of an ep patent application or granted ep patent |
Free format text: STATUS: EXAMINATION IS IN PROGRESS |
|
| 17Q | First examination report despatched |
Effective date: 20180612 |
|
| GRAP | Despatch of communication of intention to grant a patent |
Free format text: ORIGINAL CODE: EPIDOSNIGR1 |
|
| STAA | Information on the status of an ep patent application or granted ep patent |
Free format text: STATUS: GRANT OF PATENT IS INTENDED |
|
| INTG | Intention to grant announced |
Effective date: 20181012 |
|
| GRAS | Grant fee paid |
Free format text: ORIGINAL CODE: EPIDOSNIGR3 |
|
| GRAA | (expected) grant |
Free format text: ORIGINAL CODE: 0009210 |
|
| STAA | Information on the status of an ep patent application or granted ep patent |
Free format text: STATUS: THE PATENT HAS BEEN GRANTED |
|
| AK | Designated contracting states |
Kind code of ref document: B1 Designated state(s): AT BE BG CH CY CZ DE DK EE ES FI FR GB GR HU IE IS IT LI LT LU LV MC MT NL PL PT RO SE SI SK TR |
|
| REG | Reference to a national code |
Ref country code: GB Ref legal event code: FG4D |
|
| REG | Reference to a national code |
Ref country code: CH Ref legal event code: EP Ref country code: AT Ref legal event code: REF Ref document number: 1116423 Country of ref document: AT Kind code of ref document: T Effective date: 20190415 |
|
| REG | Reference to a national code |
Ref country code: DE Ref legal event code: R096 Ref document number: 602007058038 Country of ref document: DE |
|
| REG | Reference to a national code |
Ref country code: IE Ref legal event code: FG4D |
|
| REG | Reference to a national code |
Ref country code: NL Ref legal event code: MP Effective date: 20190403 |
|
| REG | Reference to a national code |
Ref country code: LT Ref legal event code: MG4D |
|
| REG | Reference to a national code |
Ref country code: AT Ref legal event code: MK05 Ref document number: 1116423 Country of ref document: AT Kind code of ref document: T Effective date: 20190403 |
|
| PG25 | Lapsed in a contracting state [announced via postgrant information from national office to epo] |
Ref country code: NL Free format text: LAPSE BECAUSE OF FAILURE TO SUBMIT A TRANSLATION OF THE DESCRIPTION OR TO PAY THE FEE WITHIN THE PRESCRIBED TIME-LIMIT Effective date: 20190403 |
|
| PG25 | Lapsed in a contracting state [announced via postgrant information from national office to epo] |
Ref country code: PT Free format text: LAPSE BECAUSE OF FAILURE TO SUBMIT A TRANSLATION OF THE DESCRIPTION OR TO PAY THE FEE WITHIN THE PRESCRIBED TIME-LIMIT Effective date: 20190803 Ref country code: CZ Free format text: LAPSE BECAUSE OF FAILURE TO SUBMIT A TRANSLATION OF THE DESCRIPTION OR TO PAY THE FEE WITHIN THE PRESCRIBED TIME-LIMIT Effective date: 20190403 Ref country code: SE Free format text: LAPSE BECAUSE OF FAILURE TO SUBMIT A TRANSLATION OF THE DESCRIPTION OR TO PAY THE FEE WITHIN THE PRESCRIBED TIME-LIMIT Effective date: 20190403 Ref country code: LT Free format text: LAPSE BECAUSE OF FAILURE TO SUBMIT A TRANSLATION OF THE DESCRIPTION OR TO PAY THE FEE WITHIN THE PRESCRIBED TIME-LIMIT Effective date: 20190403 |
|
| REG | Reference to a national code |
Ref country code: ES Ref legal event code: FG2A Ref document number: 2733104 Country of ref document: ES Kind code of ref document: T3 Effective date: 20191127 |
|
| PG25 | Lapsed in a contracting state [announced via postgrant information from national office to epo] |
Ref country code: LV Free format text: LAPSE BECAUSE OF FAILURE TO SUBMIT A TRANSLATION OF THE DESCRIPTION OR TO PAY THE FEE WITHIN THE PRESCRIBED TIME-LIMIT Effective date: 20190403 Ref country code: PL Free format text: LAPSE BECAUSE OF FAILURE TO SUBMIT A TRANSLATION OF THE DESCRIPTION OR TO PAY THE FEE WITHIN THE PRESCRIBED TIME-LIMIT Effective date: 20190403 Ref country code: BG Free format text: LAPSE BECAUSE OF FAILURE TO SUBMIT A TRANSLATION OF THE DESCRIPTION OR TO PAY THE FEE WITHIN THE PRESCRIBED TIME-LIMIT Effective date: 20190703 Ref country code: GR Free format text: LAPSE BECAUSE OF FAILURE TO SUBMIT A TRANSLATION OF THE DESCRIPTION OR TO PAY THE FEE WITHIN THE PRESCRIBED TIME-LIMIT Effective date: 20190704 |
|
| PG25 | Lapsed in a contracting state [announced via postgrant information from national office to epo] |
Ref country code: IS Free format text: LAPSE BECAUSE OF FAILURE TO SUBMIT A TRANSLATION OF THE DESCRIPTION OR TO PAY THE FEE WITHIN THE PRESCRIBED TIME-LIMIT Effective date: 20190803 Ref country code: AT Free format text: LAPSE BECAUSE OF FAILURE TO SUBMIT A TRANSLATION OF THE DESCRIPTION OR TO PAY THE FEE WITHIN THE PRESCRIBED TIME-LIMIT Effective date: 20190403 |
|
| REG | Reference to a national code |
Ref country code: DE Ref legal event code: R097 Ref document number: 602007058038 Country of ref document: DE |
|
| PG25 | Lapsed in a contracting state [announced via postgrant information from national office to epo] |
Ref country code: DK Free format text: LAPSE BECAUSE OF FAILURE TO SUBMIT A TRANSLATION OF THE DESCRIPTION OR TO PAY THE FEE WITHIN THE PRESCRIBED TIME-LIMIT Effective date: 20190403 Ref country code: SK Free format text: LAPSE BECAUSE OF FAILURE TO SUBMIT A TRANSLATION OF THE DESCRIPTION OR TO PAY THE FEE WITHIN THE PRESCRIBED TIME-LIMIT Effective date: 20190403 Ref country code: EE Free format text: LAPSE BECAUSE OF FAILURE TO SUBMIT A TRANSLATION OF THE DESCRIPTION OR TO PAY THE FEE WITHIN THE PRESCRIBED TIME-LIMIT Effective date: 20190403 Ref country code: RO Free format text: LAPSE BECAUSE OF FAILURE TO SUBMIT A TRANSLATION OF THE DESCRIPTION OR TO PAY THE FEE WITHIN THE PRESCRIBED TIME-LIMIT Effective date: 20190403 |
|
| PLBE | No opposition filed within time limit |
Free format text: ORIGINAL CODE: 0009261 |
|
| STAA | Information on the status of an ep patent application or granted ep patent |
Free format text: STATUS: NO OPPOSITION FILED WITHIN TIME LIMIT |
|
| 26N | No opposition filed |
Effective date: 20200106 |
|
| PG25 | Lapsed in a contracting state [announced via postgrant information from national office to epo] |
Ref country code: TR Free format text: LAPSE BECAUSE OF FAILURE TO SUBMIT A TRANSLATION OF THE DESCRIPTION OR TO PAY THE FEE WITHIN THE PRESCRIBED TIME-LIMIT Effective date: 20190403 |
|
| PG25 | Lapsed in a contracting state [announced via postgrant information from national office to epo] |
Ref country code: SI Free format text: LAPSE BECAUSE OF FAILURE TO SUBMIT A TRANSLATION OF THE DESCRIPTION OR TO PAY THE FEE WITHIN THE PRESCRIBED TIME-LIMIT Effective date: 20190403 |
|
| REG | Reference to a national code |
Ref country code: CH Ref legal event code: PL |
|
| REG | Reference to a national code |
Ref country code: BE Ref legal event code: MM Effective date: 20191231 |
|
| PG25 | Lapsed in a contracting state [announced via postgrant information from national office to epo] |
Ref country code: MC Free format text: LAPSE BECAUSE OF FAILURE TO SUBMIT A TRANSLATION OF THE DESCRIPTION OR TO PAY THE FEE WITHIN THE PRESCRIBED TIME-LIMIT Effective date: 20190403 |
|
| PG25 | Lapsed in a contracting state [announced via postgrant information from national office to epo] |
Ref country code: IE Free format text: LAPSE BECAUSE OF NON-PAYMENT OF DUE FEES Effective date: 20191219 Ref country code: LU Free format text: LAPSE BECAUSE OF NON-PAYMENT OF DUE FEES Effective date: 20191219 |
|
| PG25 | Lapsed in a contracting state [announced via postgrant information from national office to epo] |
Ref country code: LI Free format text: LAPSE BECAUSE OF NON-PAYMENT OF DUE FEES Effective date: 20191231 Ref country code: CH Free format text: LAPSE BECAUSE OF NON-PAYMENT OF DUE FEES Effective date: 20191231 Ref country code: BE Free format text: LAPSE BECAUSE OF NON-PAYMENT OF DUE FEES Effective date: 20191231 |
|
| PG25 | Lapsed in a contracting state [announced via postgrant information from national office to epo] |
Ref country code: CY Free format text: LAPSE BECAUSE OF FAILURE TO SUBMIT A TRANSLATION OF THE DESCRIPTION OR TO PAY THE FEE WITHIN THE PRESCRIBED TIME-LIMIT Effective date: 20190403 |
|
| PG25 | Lapsed in a contracting state [announced via postgrant information from national office to epo] |
Ref country code: HU Free format text: LAPSE BECAUSE OF FAILURE TO SUBMIT A TRANSLATION OF THE DESCRIPTION OR TO PAY THE FEE WITHIN THE PRESCRIBED TIME-LIMIT; INVALID AB INITIO Effective date: 20071219 Ref country code: MT Free format text: LAPSE BECAUSE OF FAILURE TO SUBMIT A TRANSLATION OF THE DESCRIPTION OR TO PAY THE FEE WITHIN THE PRESCRIBED TIME-LIMIT Effective date: 20190403 |
|
| PGFP | Annual fee paid to national office [announced via postgrant information from national office to epo] |
Ref country code: DE Payment date: 20250227 Year of fee payment: 18 |
|
| PGFP | Annual fee paid to national office [announced via postgrant information from national office to epo] |
Ref country code: FI Payment date: 20250324 Year of fee payment: 18 |
|
| PGFP | Annual fee paid to national office [announced via postgrant information from national office to epo] |
Ref country code: ES Payment date: 20250328 Year of fee payment: 18 |
|
| PGFP | Annual fee paid to national office [announced via postgrant information from national office to epo] |
Ref country code: FR Payment date: 20250227 Year of fee payment: 18 |
|
| PGFP | Annual fee paid to national office [announced via postgrant information from national office to epo] |
Ref country code: IT Payment date: 20250227 Year of fee payment: 18 Ref country code: GB Payment date: 20250227 Year of fee payment: 18 |