EP2060903A1 - Image processing device, image processing method, and image processing program - Google Patents
Image processing device, image processing method, and image processing program Download PDFInfo
- Publication number
- EP2060903A1 EP2060903A1 EP07792608A EP07792608A EP2060903A1 EP 2060903 A1 EP2060903 A1 EP 2060903A1 EP 07792608 A EP07792608 A EP 07792608A EP 07792608 A EP07792608 A EP 07792608A EP 2060903 A1 EP2060903 A1 EP 2060903A1
- Authority
- EP
- European Patent Office
- Prior art keywords
- spectrum
- dye
- image
- image processing
- estimating
- Prior art date
- Legal status (The legal status is an assumption and is not a legal conclusion. Google has not performed a legal analysis and makes no representation as to the accuracy of the status listed.)
- Withdrawn
Links
Images


Classifications
-
- A—HUMAN NECESSITIES
- A61—MEDICAL OR VETERINARY SCIENCE; HYGIENE
- A61K—PREPARATIONS FOR MEDICAL, DENTAL OR TOILETRY PURPOSES
- A61K49/00—Preparations for testing in vivo
- A61K49/001—Preparation for luminescence or biological staining
- A61K49/006—Biological staining of tissues in vivo, e.g. methylene blue or toluidine blue O administered in the buccal area to detect epithelial cancer cells, dyes used for delineating tissues during surgery
-
- G—PHYSICS
- G01—MEASURING; TESTING
- G01N—INVESTIGATING OR ANALYSING MATERIALS BY DETERMINING THEIR CHEMICAL OR PHYSICAL PROPERTIES
- G01N21/00—Investigating or analysing materials by the use of optical means, i.e. using sub-millimetre waves, infrared, visible or ultraviolet light
- G01N21/17—Systems in which incident light is modified in accordance with the properties of the material investigated
- G01N21/25—Colour; Spectral properties, i.e. comparison of effect of material on the light at two or more different wavelengths or wavelength bands
- G01N21/31—Investigating relative effect of material at wavelengths characteristic of specific elements or molecules, e.g. atomic absorption spectrometry
-
- G—PHYSICS
- G06—COMPUTING OR CALCULATING; COUNTING
- G06T—IMAGE DATA PROCESSING OR GENERATION, IN GENERAL
- G06T11/00—Two-dimensional [2D] image generation
- G06T11/10—Texturing; Colouring; Generation of textures or colours
-
- G—PHYSICS
- G06—COMPUTING OR CALCULATING; COUNTING
- G06T—IMAGE DATA PROCESSING OR GENERATION, IN GENERAL
- G06T7/00—Image analysis
- G06T7/90—Determination of colour characteristics
-
- G—PHYSICS
- G06—COMPUTING OR CALCULATING; COUNTING
- G06T—IMAGE DATA PROCESSING OR GENERATION, IN GENERAL
- G06T2207/00—Indexing scheme for image analysis or image enhancement
- G06T2207/10—Image acquisition modality
- G06T2207/10024—Color image
-
- G—PHYSICS
- G06—COMPUTING OR CALCULATING; COUNTING
- G06T—IMAGE DATA PROCESSING OR GENERATION, IN GENERAL
- G06T2207/00—Indexing scheme for image analysis or image enhancement
- G06T2207/30—Subject of image; Context of image processing
- G06T2207/30004—Biomedical image processing
- G06T2207/30024—Cell structures in vitro; Tissue sections in vitro
Definitions
- the present invention relates to an image processing technology of a dye-stained living specimen, and specifically relates to an image processing apparatus, an image processing method, and an image processing program for forming a display image from image data obtained by imaging a pathological specimen with multiband using transmitting illumination.
- the living specimen especially in the pathological specimen, magnifying observation with a microscope for acquiring various findings is widely performed after thinly slicing a block specimen obtained by removing an organ and the specimen obtained by performing a needle biopsy to approximately several micrometers.
- transmitting observation with an optical microscope is one of the most popular observation methods, because equipments are relatively inexpensive and easy to handle, and this has been performed through the ages.
- the thinly sliced living specimen hardly absorbs or scatters light and is nearly clear and colorless, so that this is generally stained by dye before the observation.
- H&E staining hematoxylin-eosin staining
- Hematoxylin is a natural substance collected from a plant, and has no staining properties in itself.
- hematin which is oxide thereof, is a basophilic dye, and combines with a negatively charged substance.
- Deoxyribo nucleic acid (DNA) in a cell nucleus is negatively charged by a phosphate group contained as a component, so that this combines with hematin and is stained in blue-purple.
- hematin which is the oxide of hematoxylin, has the staining properties, this is hereinafter referred to as hematoxylin because this is general as the name of dye.
- Eosin is an acidophilic dye and combines with a positively charged substance.
- a pH environment affects the charge of amino acid and protein, and they tend to be positively charged under an acidic condition. Therefore, eosin solution is sometimes used with acetic acid added thereto.
- the protein in a cytoplasm combines with eosin and is stained to red to pink.
- the cell nucleus, bone tissue, and the like are stained in blue-purple, and the cytoplasm, connective tissue, and a red blood cell are stained in red, respectively, and are easily visually recognized.
- an observer may comprehend sizes of components composing the tissue such as the cell nucleus and a positional relationship among them, so that it becomes possible to morphologically judge a state of the specimen.
- the staining of the living specimen is an operation to fix the dye to living tissue originally having individual difference using chemical reaction, so that it is difficult to obtain an always uniform result. Specifically, even when the specimen is allowed to react with staining solution of the same concentration for the same time period, an amount of the dye to be fixed is not always nearly equal. According to the specimens, there are cases in which relatively more dyes are fixed and in which relatively less dyes are fixed. In the former case, the specimen is stained deeper than the general one; on the other hand, in the latter case, the specimen is stained lighter than the general one. There are facilities staffed with a stain engineer having specialized skills in order to prevent such variation in staining. In such facilities, the staining variation in the same facilities may be reduced to a certain degree by a professional adjustment operation by the stain engineer, but it is not possible to reduce the staining variation of other facilities.
- the above-described staining variation has two problems. First, when a human visually observes, irregularity in states of the observation objects might cause stress of the observer. Especially, when there is significant variation, possibility of overlooking crucial finding cannot be denied.
- the staining variation might badly affect process accuracy. For example, even when it is known that a certain lesion displays a specific color, it is difficult to automatically extract this fact from the image. This is because the staining variation disturbs the color variation due to the lesion.
- a method for solving such a problem in the staining variation by the image processing using a multiband image is disclosed in Tokiya Abe et al., "Color Correction of Pathological Images Based on Dye Amount Quantification", OPTICAL REVIEW Vol. 12, No. 4 (2005) 293-300 (hereinafter, referred to as a non-patent document).
- a relative amount of the dye (dye amount) fixed from the multiband image to the stained specimen is estimated based on a predetermined physical model.
- the estimated dye amount is virtually increased or decreased, and further a color image of the virtual specimen is synthesized using the increased or decreased dye amount.
- the deeply stained specimen and the lightly stained specimen can be corrected to the image having the color nearly equal to the appropriately stained specimen.
- the correction technique of the image disclosed in the above-described non-patent document will be described in more detail.
- the multiband image is imaged with a frame sequential method by rotating 16 band path filters with a filter wheel to switch.
- Such an imaging method is disclosed in, for example, Japanese Patent Application Laid-Open No. 07-120324 .
- this imaging method the multiband image having a 16-band pixel value at each point of the specimen is obtained.
- the dyes are originally three-dimensionally distributed in the stained specimen, which is the observation object, but it is not possible to directly acquire the same as a three-dimensional image by a general transmitting observation system, and this is observed as a two-dimensional image obtained by projecting illuminating light passing through the specimen on an imaging device of the camera. Therefore, the above-described each point of the specimen means the point on the projected specimen corresponding to each pixel of the imaging device.
- a relationship represented by the following equation (1) is established among a position (x, y) of the image, a pixel value g(x, y ,b) in a band b, and a spectral transmittance t(x, y, ⁇ ) of a corresponding point on the specimen.
- g x y b ⁇ f b ⁇ ⁇ s ⁇ ⁇ e ⁇ ⁇ t x y ⁇ ⁇ d ⁇ + n b
- ⁇ represents a wavelength
- f(b, ⁇ ) represents a spectral transmittance of a b-th filter
- s( ⁇ ) represents spectral sensitivity characteristics of the camera
- e( ⁇ ) represents spectral radiance characteristics of the illumination
- n(b) represents imaging noise in the band b.
- b is a sequential number for identifying the band, and is an integral value satisfying 1 ⁇ b ⁇ 16.
- Equation (2) which is obtained by discretizing the equation (1) in a wavelength direction, is used.
- G x y FSET x y + N
- G(x, y) is a B-row 1-column matrix corresponding to the pixel value g(x, y, b) at the position (x, y).
- T(x, y) is a D-row 1-column matrix corresponding to t(x, y, ⁇ )
- F is a B-row D-column matrix corresponding to f(b, ⁇ ).
- S is a D-row D-column diagonal matrix and a diagonal component corresponds to s( ⁇ ).
- E also is a D-row D-column diagonal matrix and the diagonal component corresponds to e( ⁇ ).
- N is a B-row 1-column matrix corresponding to n(b).
- the spectral transmittance at each point of the specimen is estimated from the imaged multiband image. Wiener estimation is used as the estimation method at that time.
- the Wiener estimation is widely known as one of linear filter methods for estimating an original signal from a signal on which noise is superimposed, and an estimation value T ⁇ (x,y) of the spectral transmittance can be calculated by the following equation (3).
- T ⁇ x y R SS ⁇ FSE t ⁇ FSE ⁇ R SS ⁇ FSE t + R NN - 1 ⁇ G x y
- R SS is a D-row D-column matrix and represents a covariance matrix of the spectral transmittance of the specimen of the object specimen.
- R NN is a B-row B-column matrix and represents the covariance matrix of noise of the camera used for imaging.
- () t and () -1 represent a transposed matrix and an inverse matrix, respectively.
- T ⁇ is sometimes represented as T ⁇ (this notation applies to a case of a letter other than T).
- the dye amounts at each point (x, y) of the specimen are estimated based on the estimated spectral transmittance T ⁇ (x, y).
- the dyes which are objects of the estimation, are hematoxylin, eosin which stains the cytoplasm, and eosin which stains the red blood cell.
- the above-described three kinds of dyes are abbreviated as a dye H, a dye E, and a dye R in this order.
- the red blood cell has its particular color even in a state without staining, and after the H&E staining, the color of the red blood cell itself and the color of eosin changed in the course of staining are superimposingly observed. Therefore, to be precise, the color obtained by superimposing the color of the red blood cell itself on the color of eosin, which stains the red blood cell, is referred to as the dye R.
- the dyes are dispersively present in the specimen, so that a concept of width is not correct; however, this becomes an index to indicate a relative dye amount indicating the relative amount of the dye which is present compared to a case supposing that the specimen is stained by a single dye. That is to say, it can be said that d H , d E and d R represent the dye amounts of the dyes H, E and R, respectively.
- k H ( ⁇ ), k E ( ⁇ ) and k R ( ⁇ ) can be easily obtained from the equation (4) by creating the specimen stained by a single dye in advance and measuring the spectral transmittance thereof by a spectrometer.
- the following equation (6) is obtained by taking a natural logarithm of both sides of the equation (5).
- - log ⁇ I ⁇ I 0 ⁇ k H ⁇ ⁇ d H + k E ⁇ ⁇ d E + k R ⁇ ⁇ d R
- the component corresponding to the wavelength ⁇ of the estimation value T ⁇ (x, y) of the spectral transmittance at the position (x, y) on the specimen obtained by using the equation (3) is represented as t ⁇ (x, y, ⁇ ), and by substituting this t ⁇ (x, y, ⁇ ) into the equation (6), the following equation (7) is obtained.
- unknown variables are three, which are d H , d E and d R , so that it is possible to make the equation (7) simultaneous with at least three different wavelengths ⁇ to solve. In order to further improve accuracy, it is possible to make the equation (7) simultaneous with four or more different wavelengths ⁇ to perform a multiple regression analysis.
- the dye amount of hematoxylin in the cell nucleus and the dye amount of eosin in the cytoplasm can be estimated without problem; on the other hand, the dye amount of eosin in the red blood cell is estimated as an unnaturally large value. This is because eosin in the red blood cell displays the color different from the original color by a chemical reaction at the time of staining, and visually behaves as another dye having spectral characteristics different from those of original eosin. Therefore, it becomes clear that eosin in the cytoplasm other than the red blood cell and eosin in the red blood cell should be considered separately.
- the amounts of three kinds of dyes are estimated without problem and there is no unnaturalness in the result.
- the spectral transmittance characteristics corresponding to the dye amounts are derived using the Lambert-Beer law at the point on an actually estimated dye amount distribution, and further are converted to the RGB value using the spectral sensitivity characteristic of the imaging system, it becomes clear that a red blood cell area displays unnatural red-orange color different from the original red color.
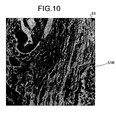
- FIG. 10 shows an example of an image generated by the method disclosed in the non-patent document.
- a red blood cell area 51R displays unnatural red-orange color as described above.
- An object of the above-mentioned non-patent document was to solve the problem in staining variation by the image processing using the multiband image.
- This method functions without problem when there is no red blood cell in an observation area of the object and an excellent result can be obtained.
- the red blood cell is included in the observation area, and in such a case, the red blood cell displaying the unnatural color is included in the image.
- the red blood cell area becomes new variation cause of the color even though the staining variation in the cell nucleus and the cytoplasm is corrected, and it can be said that this should be improved by the above-described method.
- the present invention is achieved in view of the above-described problem, and an object thereof is to provide the image processing apparatus, the image processing method, and the image processing program capable of correcting the staining variation using the image processing including the function of virtually adjusting the staining dye amount without causing the unnatural color variation in the image.
- an image processing apparatus for performing an image processing on an image, and includes a storage unit for storing image information regarding the image; a first spectrum estimating unit for reading the image information from the storage unit and estimating a spectrum of an object based on the read image information; a dye amount estimating unit for estimating a plurality of dye amounts included in the object using the spectrum of the object estimated by the first spectrum estimating unit; a second spectrum estimating unit for synthesizing a first spectrum using the plurality of dye amounts estimated by the dye amount estimating unit; a spectrum subtractor for calculating a difference spectrum by subtracting the first spectrum synthesized by the second spectrum estimating unit from the spectrum of the object; a dye amount correcting unit for correcting at least a part of the plurality of dye amounts estimated by the dye amount estimating unit; a third spectrum estimating unit for synthesizing a second spectrum using the dye amount corrected by the dye amount correcting unit; a spectrum adder for synthesizing a third spectrum
- the display image is an RGB image.
- the number of dye amounts estimated from the spectrum of the object is larger than the number of dye amounts used for synthesizing the first spectrum.
- the number of dye amounts estimated from the spectrum of the object is equal to the number of dye amounts used for synthesizing the first spectrum.
- the number of dye amounts used for synthesizing the first spectrum and the number of dye amounts used for synthesizing the second spectrum are equal to each other.
- the image processing apparatus further includes a display unit for displaying the display image.
- the image processing apparatus further includes an operating unit to which a correction instruction signal for instructing correction of the dye amount is input.
- the operating unit includes any one of a slider, a dial, and a push button.
- the operating unit includes a graphical user interface, which imitates any one of a slider, a dial, and a push button.
- the graphical user interface is displayed in a same screen as the display image.
- the dye amount correcting unit corrects the dye amount by multiplying a first coefficient by the dye amount.
- the dye amount correcting unit corrects the dye amount by adding a second coefficient to the dye amount.
- the dye amount correcting unit, the third spectrum estimating unit, the spectrum adder, and the image synthesizer perform a process based on contents of the correction instruction signal input by the operating unit, and the display unit displays the display image to which the process based on the contents of the correction instruction signal is reflected.
- the object is a stained living specimen.
- the object is a pathological specimen.
- the dye amount estimated by the dye amount estimating unit includes hematoxylin and eosin.
- the dye amount estimated by the dye amount estimating unit further includes eosin which stains a red blood cell.
- the first spectrum estimating unit uses a Wiener estimation when estimating the spectrum of the object.
- the first spectrum estimating unit uses a Lambert-Beer law when estimating a plurality of dye amounts included in the object.
- An image processing method is performed in a computer which is capable of performing an image processing on an image and which includes a storage unit for storing image information regarding the image.
- the image processing method includes a first spectrum estimating step of reading the image information from the storage unit and estimating a spectrum of an object based on the read image information; a dye amount estimating step of estimating a plurality of dye amounts included in the object using the spectrum of the object estimated at the first spectrum estimating step; a second spectrum estimating step of synthesizing a first spectrum using the plurality of dye amounts estimated at the dye amount estimating step; a spectrum subtracting step of calculating a difference spectrum by subtracting the first spectrum synthesized at the second spectrum estimating step from the spectrum of the object; a dye amount correcting step of correcting at least a part of the plurality of dye amounts estimated at the dye amount estimating step; a third spectrum estimating step of synthesizing a second spectrum using the dye amount corrected at the dye amount correcting step; a spectrum adding step of synthesizing
- An image processing program is for causing a computer which is capable of performing an image processing on an image and which includes a storage unit for storing image information regarding the image, to perform a first spectrum estimating step of reading the image information from the storage unit and estimating a spectrum of an object based on the read image information; a dye amount estimating step of estimating a plurality of dye amounts included in the object using the spectrum of the object estimated at the first spectrum estimating step; a second spectrum estimating step of synthesizing a first spectrum using the plurality of dye amounts estimated at the dye amount estimating step; a spectrum subtracting step of calculating a difference spectrum by subtracting the first spectrum synthesized at the second spectrum estimating step from the spectrum of the object; a dye amount correcting step of correcting at least a part of the plurality of dye amounts estimated at the dye amount estimating step; a third spectrum estimating step of synthesizing a second spectrum using the dye amount corrected at the dye amount correcting step; a spectrum adding step of synthesizing a third
- the spectrum of the object is estimated based on the image information regarding the image, a plurality of dye amounts included in the object are estimated from the estimated spectrum of the object, the first spectrum is synthesized using a plurality of estimated dye amounts, and the synthesized first spectrum is subtracted from the spectrum of the object, thereby calculating the difference spectrum, and on the other hand, at least a part of a plurality of estimated dye amounts is corrected, the second spectrum is synthesized using the corrected dye amount, and after that, the third spectrum is synthesized by adding the synthesized second spectrum and the difference spectrum, and the display image is synthesized from the synthesized third spectrum, thereby correcting the staining variation using the image processing including the function to virtually adjust the staining dye amount without causing the unnatural color variation in the image.
- a 6-band image of an H&E stained pathological specimen is imaged with two kinds of optical filters and an RGB camera, and spectral transmittance characteristics and a dye amount are estimated for each point of an object. Thereafter, the estimated dye amount is corrected and the corrected dye amount is converted again to the spectral transmittance characteristics to be converted to an RGB value.
- This embodiment is characterized in that only the dye amounts of hematoxylin and eosin in a cytoplasm other than a red blood cell are used when converting from the dye amount to spectral transmittance, and another component is processed as a difference spectrum.
- FIG. 1 is a view showing a configuration of an image processing apparatus 1 according to this embodiment.
- the image processing apparatus 1 shown in the drawing is provided with a multiband image imaging unit 101, a first spectrum estimating unit 102, a dye amount estimating unit 103, a second spectrum estimating unit 104, a spectrum subtractor 105, a dye amount correcting unit 106, a third spectrum estimating unit 107, a spectrum adder 108, an image synthesizer 109, a display unit 110, an operating unit 111, a storage unit 112, and a controller 113 for controlling operations of all of them. Meanwhile, in FIG. 1 , connections from the controller 113 to each unit are not shown.
- the image processing apparatus 1 is composed of a computer provided with a CPU, a ROM, a RAM, and the like.
- FIG. 2 is a view showing an overview of an image processing method according to this embodiment.
- a functional configuration of the image processing apparatus 1 and the overview of the image processing method are described with reference to FIGs. 1 and 2 , respectively.
- an object specimen is imaged as a 6-band multiband image by the multiband image imaging unit 101 (step S1).
- the multiband image imaging unit 101 is composed of a specimen holder 1010, an illuminating unit 1011, an optical system 1012, an optical filter 1013, an optical filter switching unit 1014, and an RGB camera 1015, as shown in FIG. 3 .
- the RGB camera 1015 used here is one widely used in a digital camera or the like, and is obtained by arranging RGB filters on a black-and-white imaging device in a mosaic pattern.
- FIG. 4 is a view schematically showing a configuration example of the RGB filter.
- each pixel can only image any one of components R, G and B, a method for interpolating lacking R, G and B components by utilizing pixel values in the vicinity of each of them is adopted. Meanwhile, this method is disclosed in Japanese Patent No. 3510037 , for example.
- FIG. 5 shows an example of spectral sensitivity of each of R, G and B bands when imaging the illuminating light from the illuminating unit 1011 with the RGB camera 1015 through the optical system 1012.
- the optical filter 1013 is composed of a first optical filter 1013a having the spectral transmittance characteristics shown in FIG. 6A and a second optical filter 1013b having the spectral transmittance characteristics shown in FIG. 6B , and for example, first imaging is performed first using the first optical filter 1013a, and after that, this is switched to the second optical filter 1013b by the optical filter switching unit 1014 and second imaging is performed.
- a 3-band image is obtained in each of the first and second imagings, and the 6-band multiband image is obtained by combining both results.
- the imaged multiband image is stored in the storage unit 112.
- the first spectrum estimating unit 102 reads image information regarding the 6-band multiband image imaged by the multiband image imaging unit 101 from the storage unit 112 to estimate first spectral transmittance (spectrum of the object) based on the read image information (step S2).
- the process thereafter is performed according to the procedure similar to that disclosed in the above-mentioned non-patent document, and a Wiener estimation is used as in the non-patent document as an estimation method at step S2.
- T ⁇ x y R SS ⁇ FSE t ⁇ FSE ⁇ R SS ⁇ FSE t + R NN - 1 ⁇ G x y which is described also in the section of the background art, is used to convert a matrix representation G(x,y) of a pixel value at a point (x, y) on the multiband image, thereby estimating the matrix representation T ⁇ (x, y) of the spectral transmittance at a corresponding point on the specimen.
- T ⁇ (x, y) represents an estimation value of the first spectral transmittance.
- the estimation value of the spectral transmittance is simply referred to as "spectral transmittance”.
- meaning of each symbol in the equation (3) is as described in the section of the background of art.
- spectral transmittance F of the optical filter 1013, spectral sensitivity characteristics S of the RGB camera 1015, and spectral radiance characteristics E of the illuminating unit 1011 are measured in advance with a spectrometer after selecting a device to be used.
- the spectral transmittance of the optical system 1012 approximates 1.0 herein, when deviation from the an approximation value 1.0 is not acceptable, the spectral transmittance of the optical system 1012 may also be measured in advance and multiplied by the spectral radiance characteristics E of the illumination.
- a covariance matrix R SS of the spectral transmittance of the specimen is obtained by preparing a typical H&E stained pathological specimen and measuring the spectral transmittance of a plurality of points with the spectrometer. At that time, it is better to measure approximately 100 points in the specimen without bias, in order to improve statistical accuracy.
- a covariance matrix R NN of noise of the camera is obtained by performing the first and second imagings with the multiband image imaging unit 101 in a state in which the specimen is not placed to obtain variance of the pixel value for each band of the obtained 6-band image, and generating the matrix having the same as a diagonal component. However, it is supposed that there is no noise correlation between bands.
- the first spectral transmittance T ⁇ (x, y) obtained in this manner is stored in the storage unit 112.
- the dye amount estimating unit 103 reads the first spectral transmittance T ⁇ (x, y) estimated by the first spectrum estimating unit 102 from the storage unit 112, and converts the read first spectral transmittance T ⁇ (x, y) to estimate the dye amount (step S3).
- the dyes to be processed here are hematoxylin, eosin which stains the cytoplasm, and eosin which stains the red blood cell, as in the non-patent document, and they are abbreviated as dyes H, E, and R, respectively.
- the second spectrum estimating unit 104 reads the dye amount estimated by the dye amount estimating unit 103 from the storage unit 112, and converts the read dye amount to synthesize second spectral transmittance (first spectrum) (step S4).
- a term for the dye R is eliminated from the equation (8), and the following equation (11) obtained by setting coefficients ⁇ H and ⁇ E to 1 is used.
- t * * x y ⁇ exp - k H ⁇ ⁇ d H + k E ⁇ ⁇ d E
- t ** (x, y, ⁇ ) is a component corresponding to the wavelength ⁇ out of the second spectral transmittance.
- T ** (x, y, ⁇ ) for a plurality of wavelengths ⁇ obtained by using the equation (11) is summarized into a matrix form and is expressed as T ** (x, y, ⁇ )
- this T ** (x, y, ⁇ ) represents the second spectral transmittance.
- the second spectral transmittance T ** (x, y, ⁇ ) obtained in this manner is stored in the storage unit 112.
- the difference spectrum T diff (x, y) obtained by the equation (12) is stored in the storage unit 112.
- a reason for obtaining the difference spectrum T diff (x, y) is as follows.
- the dye amount estimating unit 103 converts the first spectral transmittance T ⁇ (x, y) estimated by the first spectrum estimating unit 102 to the dye amount
- physical model used at that time is the Lambert-Beer law only.
- the Lambert-Beer law is obtained by formulating attenuation of light passing through a translucent substance assuming that there is no refraction and scattering, but the refraction and the scattering might occur in the actual stained specimen.
- the term for the dye R (eosin, which stains the red blood cell) is eliminated (refer to the equation (11)). Therefore, the second spectral transmittance T ** (x, y) does not include the attenuation due to the dye R. Instead, the attenuation of light caused by the dye R included in the first spectral transmittance T ⁇ (x, y) is given to a following process in a state included in the difference spectrum T diff (x, y).
- the dye amount correcting unit 106 performs correction of multiplying coefficients (first coefficients) ⁇ H and ⁇ E by the dye amounts d H and d E , respectively (step S6).
- the dye amounts after the correction are ⁇ H d H and ⁇ E d E , respectively.
- the initial values of the coefficients ⁇ H and ⁇ E are 1, the values can be changed by the input from the operating unit 111, as described later. Meanwhile, it is also possible to further introduce the coefficients (second coefficients) ⁇ H and ⁇ E to correct the dye amounts by the forms ⁇ H d H + ⁇ H and ⁇ E d E + ⁇ E .
- the initial values of the coefficients ⁇ H and ⁇ E may be set to 0.
- the dye amounts corrected in this manner are stored in the storage unit 112.
- the dye amount d R of the dye R is eliminated from the correction object at the above-described step S6 because the dye R is not susceptible to the effect by a staining state and generally displays vivid red, so that it is not practically necessary to be corrected.
- color saturation of the dye R is higher than those of the dyes H and E, so that the color in a finally output RGB image is prone to unnatural due to the effect of the error which occurs in modeling and calculation process, and this tendency is further emphasized by correcting the dye amount. Therefore, unless there is some positive reason to correct the dye amount d R of the dye R, this is preferably eliminated from the correction object.
- the third spectrum estimating unit 107 reads the dye amount corrected by the dye amount correcting unit 106 from the storage unit 112, and converts the read dye amount to synthesize third spectral transmittance (second spectrum) (step S7).
- the following equation (13) is obtained by eliminating the term for the dye R from the equation (8) shown in the section of the background art.
- t * * * x y ⁇ exp - k H ⁇ ⁇ ⁇ H ⁇ d H + k E ⁇ ⁇ ⁇ E ⁇ d E
- t *** (x, y, ⁇ ) is a component corresponding to the wavelength ⁇ out of the third spectral transmittance.
- the spectrum adder 108 reads the third spectral transmittance T *** (x, y, ⁇ ) obtained by the third spectrum estimating unit 107 and the difference spectrum T diff (x,y, ⁇ ) obtained by the spectrum subtractor 105 from the storage unit 112 to add, and synthesizes fourth spectral transmittance (third spectrum) (step S8).
- T ⁇ x y T * * * x y + T diff x y
- the fourth spectral transmittance T ⁇ (x,y) synthesized in this manner is stored in the storage unit 112.
- T ⁇ is sometimes represented as T ⁇ .
- the difference spectrum T diff (x, y) includes modeling error due to the effect of the scattering and diffusion and the attenuation of light by the dye R (eosin, which stains the red blood cell).
- the dye R eosin, which stains the red blood cell.
- the image synthesizer 109 reads the fourth spectral transmittance T ⁇ (x, y) from the storage unit 112 and synthesizes the RGB image, which is a display image, using the read fourth spectral transmittance T ⁇ (x, y) (step 9).
- T ⁇ (x, y) an RGB value G RGB (x, y)
- G RGB x y FSE ⁇ T ⁇ x y
- a matrix S corresponds to the spectral sensitivity characteristics of the RGB camera 1015.
- the RGB image having the same width and height as the imaged multiband image is obtained by repeatedly performing the process to convert the fourth spectral transmittance T ⁇ (x, y) to the RGB value for all of the points (x, y).
- the RGB image synthesized in this manner is stored in the storage unit 112.
- the display unit 110 displays the RGB image generated by the image synthesizer 109 and stored in the storage unit 112.
- FIG. 7 is a view showing a displaying example of the RGB image in the display unit 110.
- An RGB image 41 shown in the drawing is obtained by executing the image processing method according to this embodiment to the image obtained by imaging the same portion as the RGB image 51 in FIG. 10 described in the section of the background art.
- a red blood cell area 41R of the RGB image 41 is more tinged with red than a red blood cell area 51R of the RGB image 51, and displays more natural color without causing the unnatural color variation in the image.
- the RGB image 41 totally displays the natural color for other areas.
- a general flat panel display such as a liquid crystal and an organic EL
- a CRT display may be used as the display unit 110.
- a mechanism with which the user can select the RGB image to be displayed may be added.
- the user inputs a correction instruction signal to instruct the correction of the dye amount by operating the operating unit 111 while observing the RGB image displayed on the display unit 110.
- the correction instruction signal includes, for example, an instruction to change the coefficients ⁇ H and ⁇ E used in the dye amount correcting unit 106.
- the operating unit 111 may be realized by devices such as a slider 21 ( FIG. 8A ), a dial 22 ( FIG. 8B ), and a push button 23 ( FIG. 8C ).
- a configuration in which any of graphical user interfaces 31 ( FIG. 9A ), 32 ( FIG. 9B ) and 33 FIG.
- FIGs. 8A to 8C and 9A to 9C it is also possible to simultaneously input the correction instruction signal of one or a plurality of the dyes by a plurality of them or a combination of them.
- step S6 the coefficients ⁇ H and ⁇ E used in the dye amount correcting unit 106 are immediately changed, and a correction process of the dye amount (step S6) is executed again in the dye amount correcting unit 106.
- the third spectrum estimating unit 107, the spectrum adder 108, and the image synthesizer 109 perform the above-described processes (steps S7 to S9), respectively, and the RGB image synthesized again is displayed on the display unit 110 (step S10).
- the dye amount d R of the dye R is corrected in the form of ⁇ R d R or ⁇ R d R + ⁇ R using the first and second coefficients ⁇ R and ⁇ R .
- the initial values of the coefficients ⁇ R and ⁇ R are 1 and 0, respectively, the values may be made changeable by the input from the operating unit 111.
- the second spectrum estimating unit 104 and the third spectrum estimating unit 107 are separated in this embodiment, if the coefficients ⁇ H and ⁇ are set to 1 in the third spectrum estimating unit 107, the process becomes identical to that of the second spectrum estimating unit 104. Therefore, the configuration that the second and third spectrum estimating units 104 and 107 are integrated and are separately used by switching the coefficients may also be used. Thus configured, the device configuration is simplified and a lower cost may be realized.
- the CPU provided in the image processing apparatus 1 executes the calculation process regarding the image processing method by reading the image processing program for executing the image processing method according to this embodiment from the storage unit 112. Meanwhile, the image processing program according to this embodiment may be recorded in a computer-readable recording media such as a flexible disk, a CD-ROM, a DVD-ROM, and a flash memory and is widely distributed. In this sense, the image processing apparatus 1 may be provided with an auxiliary storage device capable of reading any of the above-described various recording media.
- the image processing apparatus, the image processing method, and the image processing program according to the present invention are useful in the image processing technology of the living specimen stained by the dye, and are suitable for forming the display image from the image data obtained by imaging the pathological specimen with multiband using the transmitting illumination.
Landscapes
- Physics & Mathematics (AREA)
- Engineering & Computer Science (AREA)
- Health & Medical Sciences (AREA)
- General Physics & Mathematics (AREA)
- Life Sciences & Earth Sciences (AREA)
- General Health & Medical Sciences (AREA)
- Theoretical Computer Science (AREA)
- Spectroscopy & Molecular Physics (AREA)
- Biomedical Technology (AREA)
- Biodiversity & Conservation Biology (AREA)
- Chemical & Material Sciences (AREA)
- Optics & Photonics (AREA)
- Epidemiology (AREA)
- Animal Behavior & Ethology (AREA)
- Nuclear Medicine, Radiotherapy & Molecular Imaging (AREA)
- Public Health (AREA)
- Veterinary Medicine (AREA)
- Computer Vision & Pattern Recognition (AREA)
- Oncology (AREA)
- Analytical Chemistry (AREA)
- Biochemistry (AREA)
- Immunology (AREA)
- Pathology (AREA)
- Image Processing (AREA)
- Image Analysis (AREA)
- Investigating Or Analysing Biological Materials (AREA)
- Investigating Or Analysing Materials By Optical Means (AREA)
- Color Television Image Signal Generators (AREA)
Abstract
Description
- The present invention relates to an image processing technology of a dye-stained living specimen, and specifically relates to an image processing apparatus, an image processing method, and an image processing program for forming a display image from image data obtained by imaging a pathological specimen with multiband using transmitting illumination.
- In the living specimen, especially in the pathological specimen, magnifying observation with a microscope for acquiring various findings is widely performed after thinly slicing a block specimen obtained by removing an organ and the specimen obtained by performing a needle biopsy to approximately several micrometers. Among them, transmitting observation with an optical microscope is one of the most popular observation methods, because equipments are relatively inexpensive and easy to handle, and this has been performed through the ages. In this case, the thinly sliced living specimen hardly absorbs or scatters light and is nearly clear and colorless, so that this is generally stained by dye before the observation.
- Conventionally, various types of staining methods have been suggested, and a total number thereof rises to 100 or larger; however, regarding especially the pathological specimen, hematoxylin-eosin staining (hereinafter, referred to as "H&E staining") using blue-purple hematoxylin and red eosin as dyes is normally used.
- Hematoxylin is a natural substance collected from a plant, and has no staining properties in itself. However, hematin, which is oxide thereof, is a basophilic dye, and combines with a negatively charged substance. Deoxyribo nucleic acid (DNA) in a cell nucleus is negatively charged by a phosphate group contained as a component, so that this combines with hematin and is stained in blue-purple. Meanwhile, as described above, although hematin, which is the oxide of hematoxylin, has the staining properties, this is hereinafter referred to as hematoxylin because this is general as the name of dye.
- Eosin is an acidophilic dye and combines with a positively charged substance. A pH environment affects the charge of amino acid and protein, and they tend to be positively charged under an acidic condition. Therefore, eosin solution is sometimes used with acetic acid added thereto. The protein in a cytoplasm combines with eosin and is stained to red to pink.
- In the specimen after the H&E staining, the cell nucleus, bone tissue, and the like are stained in blue-purple, and the cytoplasm, connective tissue, and a red blood cell are stained in red, respectively, and are easily visually recognized. As a result, an observer may comprehend sizes of components composing the tissue such as the cell nucleus and a positional relationship among them, so that it becomes possible to morphologically judge a state of the specimen.
- The staining of the living specimen is an operation to fix the dye to living tissue originally having individual difference using chemical reaction, so that it is difficult to obtain an always uniform result. Specifically, even when the specimen is allowed to react with staining solution of the same concentration for the same time period, an amount of the dye to be fixed is not always nearly equal. According to the specimens, there are cases in which relatively more dyes are fixed and in which relatively less dyes are fixed. In the former case, the specimen is stained deeper than the general one; on the other hand, in the latter case, the specimen is stained lighter than the general one. There are facilities staffed with a stain engineer having specialized skills in order to prevent such variation in staining. In such facilities, the staining variation in the same facilities may be reduced to a certain degree by a professional adjustment operation by the stain engineer, but it is not possible to reduce the staining variation of other facilities.
- The above-described staining variation has two problems. First, when a human visually observes, irregularity in states of the observation objects might cause stress of the observer. Especially, when there is significant variation, possibility of overlooking crucial finding cannot be denied.
- Second, when imaging the stained specimen with a camera and image-processing the same, the staining variation might badly affect process accuracy. For example, even when it is known that a certain lesion displays a specific color, it is difficult to automatically extract this fact from the image. This is because the staining variation disturbs the color variation due to the lesion.
- A method for solving such a problem in the staining variation by the image processing using a multiband image is disclosed in Tokiya Abe et al., "Color Correction of Pathological Images Based on Dye Amount Quantification", OPTICAL REVIEW Vol. 12, No. 4 (2005) 293-300 (hereinafter, referred to as a non-patent document). In the non-patent document, a relative amount of the dye (dye amount) fixed from the multiband image to the stained specimen is estimated based on a predetermined physical model. Next, the estimated dye amount is virtually increased or decreased, and further a color image of the virtual specimen is synthesized using the increased or decreased dye amount. By appropriately increasing and decreasing the dye amount, the deeply stained specimen and the lightly stained specimen can be corrected to the image having the color nearly equal to the appropriately stained specimen. Hereinafter, the correction technique of the image disclosed in the above-described non-patent document will be described in more detail.
- First, the multiband image is imaged with a frame sequential method by rotating 16 band path filters with a filter wheel to switch. Such an imaging method is disclosed in, for example, Japanese Patent Application Laid-Open No.
07-120324 - The dyes are originally three-dimensionally distributed in the stained specimen, which is the observation object, but it is not possible to directly acquire the same as a three-dimensional image by a general transmitting observation system, and this is observed as a two-dimensional image obtained by projecting illuminating light passing through the specimen on an imaging device of the camera. Therefore, the above-described each point of the specimen means the point on the projected specimen corresponding to each pixel of the imaging device.
- A relationship represented by the following equation (1) is established among a position (x, y) of the image, a pixel value g(x, y ,b) in a band b, and a spectral transmittance t(x, y, λ) of a corresponding point on the specimen.

where λ represents a wavelength, f(b, λ) represents a spectral transmittance of a b-th filter, s(λ) represents spectral sensitivity characteristics of the camera, e(λ) represents spectral radiance characteristics of the illumination, and n(b) represents imaging noise in the band b. Meanwhile, b is a sequential number for identifying the band, and is an integral value satisfying 1 ≤ b ≤ 16. - In an actual calculation, the following equation (2), which is obtained by discretizing the equation (1) in a wavelength direction, is used.

- Next, the spectral transmittance at each point of the specimen is estimated from the imaged multiband image. Wiener estimation is used as the estimation method at that time.
- The Wiener estimation is widely known as one of linear filter methods for estimating an original signal from a signal on which noise is superimposed, and an estimation value T̂(x,y) of the spectral transmittance can be calculated by the following equation (3).

where RSS is a D-row D-column matrix and represents a covariance matrix of the spectral transmittance of the specimen of the object specimen. RNN is a B-row B-column matrix and represents the covariance matrix of noise of the camera used for imaging. Also, ()t and ()-1 represent a transposed matrix and an inverse matrix, respectively. Hereinafter, T̂ is sometimes represented as T^ (this notation applies to a case of a letter other than T). - Next, the dye amounts at each point (x, y) of the specimen are estimated based on the estimated spectral transmittance T^(x, y). Here, the dyes, which are objects of the estimation, are hematoxylin, eosin which stains the cytoplasm, and eosin which stains the red blood cell. Hereinafter, for simplicity, the above-described three kinds of dyes are abbreviated as a dye H, a dye E, and a dye R in this order. Meanwhile, to be strict, the red blood cell has its particular color even in a state without staining, and after the H&E staining, the color of the red blood cell itself and the color of eosin changed in the course of staining are superimposingly observed. Therefore, to be precise, the color obtained by superimposing the color of the red blood cell itself on the color of eosin, which stains the red blood cell, is referred to as the dye R.
- Generally, it is known that in a light transmissive substance, a Lambert-Beer law represented by the following equation (4) is established between intensity I0(λ) of incident light and intensity I(λ) of emitting light for each wavelength λ.

- When the H&E stained specimen is stained by three kinds of dyes H, E and R, the following equation (5) is established in each wavelength λ by the Lambert-Beer law.

where kH(λ), kE(λ) and kR(λ) represent k(λ) corresponding to the dyes H, E and R, respectively. Also, dH, dE and dR represent virtual thicknesses corresponding to the dyes H, E and R, respectively. Originally, the dyes are dispersively present in the specimen, so that a concept of width is not correct; however, this becomes an index to indicate a relative dye amount indicating the relative amount of the dye which is present compared to a case supposing that the specimen is stained by a single dye. That is to say, it can be said that dH, dE and dR represent the dye amounts of the dyes H, E and R, respectively. kH(λ), kE(λ) and kR(λ) can be easily obtained from the equation (4) by creating the specimen stained by a single dye in advance and measuring the spectral transmittance thereof by a spectrometer. - The following equation (6) is obtained by taking a natural logarithm of both sides of the equation (5).


- Once the dye amounts dH, dE and dR are obtained, it is possible to simulate the variation in the dye amounts in the specimen by correcting them. That is to say, by multiplying appropriate coefficients αH, αE and αR, by dH, dE and dR, respectively, and substituting them into the equation (5), an equation (8) is obtained as a new spectral transmittance t*(x, y, λ).

- By the above-described procedure, it becomes possible to virtually adjust the dye amounts of the stained specimen. By preparing an appropriate user interface, a user himself may adjust the dye amount and confirm the result by the image. Therefore, even when there is staining variation in the stained specimen, the user may adjust the same to an appropriate staining state to observe, and the problem in the staining variation may be solved.
- When applying the method disclosed in the above-mentioned non-patent document to a number of existing H&E stained pathological specimens, it becomes clear that there is the following problem.
- First, when estimating a spatial dye amount distribution of two kinds of dyes, which are hematoxylin and eosin, fixed in the specimen, it becomes clear that the dye amount of hematoxylin in the cell nucleus and the dye amount of eosin in the cytoplasm can be estimated without problem; on the other hand, the dye amount of eosin in the red blood cell is estimated as an unnaturally large value. This is because eosin in the red blood cell displays the color different from the original color by a chemical reaction at the time of staining, and visually behaves as another dye having spectral characteristics different from those of original eosin. Therefore, it becomes clear that eosin in the cytoplasm other than the red blood cell and eosin in the red blood cell should be considered separately.
- Second, by considering the dyes as three kinds, which are hematoxylin, normal eosin in the cytoplasm other than the red blood cell, and altered eosin in the red blood cell, and estimating the spatial dye amount distribution, apparently, the amounts of three kinds of dyes are estimated without problem and there is no unnaturalness in the result. However, when the spectral transmittance characteristics corresponding to the dye amounts are derived using the Lambert-Beer law at the point on an actually estimated dye amount distribution, and further are converted to the RGB value using the spectral sensitivity characteristic of the imaging system, it becomes clear that a red blood cell area displays unnatural red-orange color different from the original red color. It also becomes clear that unnaturalness of the color in the red blood cell area tends to be further emphasized by coefficient-correcting the estimated dye amount distribution and converting the same to the RGB value by the above-described procedure thereafter.
FIG. 10 shows an example of an image generated by the method disclosed in the non-patent document. In anRGB image 51 shown in the drawing, a redblood cell area 51R displays unnatural red-orange color as described above. - An object of the above-mentioned non-patent document was to solve the problem in staining variation by the image processing using the multiband image. This method functions without problem when there is no red blood cell in an observation area of the object and an excellent result can be obtained. However, actually, it is not rare that the red blood cell is included in the observation area, and in such a case, the red blood cell displaying the unnatural color is included in the image. This means that the red blood cell area becomes new variation cause of the color even though the staining variation in the cell nucleus and the cytoplasm is corrected, and it can be said that this should be improved by the above-described method.
- The present invention is achieved in view of the above-described problem, and an object thereof is to provide the image processing apparatus, the image processing method, and the image processing program capable of correcting the staining variation using the image processing including the function of virtually adjusting the staining dye amount without causing the unnatural color variation in the image.
- To solve the problems described above and achieve the object, an image processing apparatus according to the present invention is for performing an image processing on an image, and includes a storage unit for storing image information regarding the image; a first spectrum estimating unit for reading the image information from the storage unit and estimating a spectrum of an object based on the read image information; a dye amount estimating unit for estimating a plurality of dye amounts included in the object using the spectrum of the object estimated by the first spectrum estimating unit; a second spectrum estimating unit for synthesizing a first spectrum using the plurality of dye amounts estimated by the dye amount estimating unit; a spectrum subtractor for calculating a difference spectrum by subtracting the first spectrum synthesized by the second spectrum estimating unit from the spectrum of the object; a dye amount correcting unit for correcting at least a part of the plurality of dye amounts estimated by the dye amount estimating unit; a third spectrum estimating unit for synthesizing a second spectrum using the dye amount corrected by the dye amount correcting unit; a spectrum adder for synthesizing a third spectrum by adding the second spectrum synthesized by the third spectrum estimating unit and the difference spectrum; and an image synthesizer for synthesizing a display image from the third spectrum synthesized by the spectrum adder.
- In the image processing apparatus according to the invention, the display image is an RGB image.
- In the image processing apparatus according to the invention, the number of dye amounts estimated from the spectrum of the object is larger than the number of dye amounts used for synthesizing the first spectrum.
- In the image processing apparatus according to the invention, the number of dye amounts estimated from the spectrum of the object is equal to the number of dye amounts used for synthesizing the first spectrum.
- In the image processing apparatus according to the invention, the number of dye amounts used for synthesizing the first spectrum and the number of dye amounts used for synthesizing the second spectrum are equal to each other.
- The image processing apparatus according to the invention further includes a display unit for displaying the display image.
- The image processing apparatus according to the invention further includes an operating unit to which a correction instruction signal for instructing correction of the dye amount is input.
- In the image processing apparatus according to the invention, information regarding a coefficient used when correcting the dye amount is included in the correction instruction signal.
- In the image processing apparatus according to the invention, the operating unit includes any one of a slider, a dial, and a push button.
- In the image processing apparatus according to the invention, the operating unit includes a graphical user interface, which imitates any one of a slider, a dial, and a push button.
- In the image processing apparatus according to the invention, the graphical user interface is displayed in a same screen as the display image.
- In the image processing apparatus according to the invention, the dye amount correcting unit corrects the dye amount by multiplying a first coefficient by the dye amount.
- In the image processing apparatus according to the invention, the dye amount correcting unit corrects the dye amount by adding a second coefficient to the dye amount.
- In the image processing apparatus according to the invention, the dye amount correcting unit, the third spectrum estimating unit, the spectrum adder, and the image synthesizer perform a process based on contents of the correction instruction signal input by the operating unit, and the display unit displays the display image to which the process based on the contents of the correction instruction signal is reflected.
- In the image processing apparatus according to the invention, the object is a stained living specimen.
- In the image processing apparatus according to the invention, the object is a pathological specimen.
- In the image processing apparatus according to the invention, the dye amount estimated by the dye amount estimating unit includes hematoxylin and eosin.
- In the image processing apparatus according to the invention, the dye amount estimated by the dye amount estimating unit further includes eosin which stains a red blood cell.
- In the image processing apparatus according to the invention, the first spectrum estimating unit uses a Wiener estimation when estimating the spectrum of the object.
- In the image processing apparatus according to the invention, the first spectrum estimating unit uses a Lambert-Beer law when estimating a plurality of dye amounts included in the object.
- An image processing method according to the present invention is performed in a computer which is capable of performing an image processing on an image and which includes a storage unit for storing image information regarding the image. The image processing method includes a first spectrum estimating step of reading the image information from the storage unit and estimating a spectrum of an object based on the read image information; a dye amount estimating step of estimating a plurality of dye amounts included in the object using the spectrum of the object estimated at the first spectrum estimating step; a second spectrum estimating step of synthesizing a first spectrum using the plurality of dye amounts estimated at the dye amount estimating step; a spectrum subtracting step of calculating a difference spectrum by subtracting the first spectrum synthesized at the second spectrum estimating step from the spectrum of the object; a dye amount correcting step of correcting at least a part of the plurality of dye amounts estimated at the dye amount estimating step; a third spectrum estimating step of synthesizing a second spectrum using the dye amount corrected at the dye amount correcting step; a spectrum adding step of synthesizing a third spectrum by adding the second spectrum synthesized at the third spectrum estimating step and the difference spectrum; and an image synthesizing step of synthesizing a display image from the third spectrum synthesized at the spectrum adding step.
- An image processing program according to the present invention is for causing a computer which is capable of performing an image processing on an image and which includes a storage unit for storing image information regarding the image, to perform a first spectrum estimating step of reading the image information from the storage unit and estimating a spectrum of an object based on the read image information; a dye amount estimating step of estimating a plurality of dye amounts included in the object using the spectrum of the object estimated at the first spectrum estimating step; a second spectrum estimating step of synthesizing a first spectrum using the plurality of dye amounts estimated at the dye amount estimating step; a spectrum subtracting step of calculating a difference spectrum by subtracting the first spectrum synthesized at the second spectrum estimating step from the spectrum of the object; a dye amount correcting step of correcting at least a part of the plurality of dye amounts estimated at the dye amount estimating step; a third spectrum estimating step of synthesizing a second spectrum using the dye amount corrected at the dye amount correcting step; a spectrum adding step of synthesizing a third spectrum by adding the second spectrum synthesized at the third spectrum estimating step and the difference spectrum; and an image synthesizing step of synthesizing a display image from the third spectrum synthesized at the spectrum adding step.
- According to the present invention, the spectrum of the object is estimated based on the image information regarding the image, a plurality of dye amounts included in the object are estimated from the estimated spectrum of the object, the first spectrum is synthesized using a plurality of estimated dye amounts, and the synthesized first spectrum is subtracted from the spectrum of the object, thereby calculating the difference spectrum, and on the other hand, at least a part of a plurality of estimated dye amounts is corrected, the second spectrum is synthesized using the corrected dye amount, and after that, the third spectrum is synthesized by adding the synthesized second spectrum and the difference spectrum, and the display image is synthesized from the synthesized third spectrum, thereby correcting the staining variation using the image processing including the function to virtually adjust the staining dye amount without causing the unnatural color variation in the image.
-
-
FIG. 1 is a view showing a configuration of an image processing apparatus according to one embodiment of the present invention. -
FIG. 2 is a view showing an overview of a process of an image processing method according to one embodiment of the present invention. -
FIG. 3 is a view showing a configuration of a multiband image imaging unit. -
FIG. 4 is a view schematically showing a configuration example of an RGB filter. -
FIG. 5 is a view showing an example of spectral sensitivity of each of R, G, B bands. -
FIG. 6A is a view showing spectral transmittance characteristics of a first optical filter. -
FIG. 6B is a view showing spectral transmittance characteristics of a second optical filter. -
FIG. 7 is a view showing a display example of an RGB image in a display unit. -
FIG. 8A is a view showing a configuration example (first example) of an operating unit. -
FIG. 8B is a view showing the configuration example (second example) of the operating unit. -
FIG. 8C is a view showing the configuration example (third example) of the operating unit. -
FIG. 9A is a view showing a configuration example (first example) of a graphical user interface. -
FIG. 9B is a view showing the configuration example (second example) of the graphical user interface. -
FIG. 9C is a view showing the configuration example (third example) of the graphical user interface. -
FIG. 10 is view showing a display example of the RGB image according to a conventional method. - Hereinafter, a best mode for carrying out the present invention (hereinafter, referred to as an "embodiment") will be described with reference to the attached drawings.
- In one embodiment of the present invention, a 6-band image of an H&E stained pathological specimen is imaged with two kinds of optical filters and an RGB camera, and spectral transmittance characteristics and a dye amount are estimated for each point of an object. Thereafter, the estimated dye amount is corrected and the corrected dye amount is converted again to the spectral transmittance characteristics to be converted to an RGB value. This embodiment is characterized in that only the dye amounts of hematoxylin and eosin in a cytoplasm other than a red blood cell are used when converting from the dye amount to spectral transmittance, and another component is processed as a difference spectrum.
-
FIG. 1 is a view showing a configuration of animage processing apparatus 1 according to this embodiment. Theimage processing apparatus 1 shown in the drawing is provided with a multibandimage imaging unit 101, a firstspectrum estimating unit 102, a dyeamount estimating unit 103, a secondspectrum estimating unit 104, aspectrum subtractor 105, a dyeamount correcting unit 106, a thirdspectrum estimating unit 107, aspectrum adder 108, animage synthesizer 109, adisplay unit 110, anoperating unit 111, astorage unit 112, and acontroller 113 for controlling operations of all of them. Meanwhile, inFIG. 1 , connections from thecontroller 113 to each unit are not shown. Theimage processing apparatus 1 is composed of a computer provided with a CPU, a ROM, a RAM, and the like. -
FIG. 2 is a view showing an overview of an image processing method according to this embodiment. Hereinafter, a functional configuration of theimage processing apparatus 1 and the overview of the image processing method are described with reference toFIGs. 1 and2 , respectively. - First, an object specimen is imaged as a 6-band multiband image by the multiband image imaging unit 101 (step S1). The multiband
image imaging unit 101 is composed of aspecimen holder 1010, an illuminatingunit 1011, anoptical system 1012, anoptical filter 1013, an opticalfilter switching unit 1014, and anRGB camera 1015, as shown inFIG. 3 . - The
RGB camera 1015 used here is one widely used in a digital camera or the like, and is obtained by arranging RGB filters on a black-and-white imaging device in a mosaic pattern.FIG. 4 is a view schematically showing a configuration example of the RGB filter. When using anRGB filter 200 shown in the drawing, although each pixel can only image any one of components R, G and B, a method for interpolating lacking R, G and B components by utilizing pixel values in the vicinity of each of them is adopted. Meanwhile, this method is disclosed in Japanese Patent No.3510037 - On the other hand, it is also possible to image with a 3CCD-type camera. In this case, the R, G and B components in each pixel can be obtained from the beginning.
- Although both of the above-described imaging methods may be used in this embodiment, in a process to be described below, it is assumed that the R, G and B components are obtained in each pixel of the image imaged with the
RGB camera 1015. - Light emitted by the illuminating
unit 1011 passes through a specimen O placed on thespecimen holder 1010. The transmitting light forms an image on the imaging device of theRGB camera 1015 through theoptical system 1012 and theoptical filter 1013. Theoptical filter 1013 has only to be placed on any position on an optical path from the illuminatingunit 1011 to theRGB camera 1015.FIG. 5 shows an example of spectral sensitivity of each of R, G and B bands when imaging the illuminating light from the illuminatingunit 1011 with theRGB camera 1015 through theoptical system 1012. - The
optical filter 1013 is composed of a firstoptical filter 1013a having the spectral transmittance characteristics shown inFIG. 6A and a secondoptical filter 1013b having the spectral transmittance characteristics shown inFIG. 6B , and for example, first imaging is performed first using the firstoptical filter 1013a, and after that, this is switched to the secondoptical filter 1013b by the opticalfilter switching unit 1014 and second imaging is performed. A 3-band image is obtained in each of the first and second imagings, and the 6-band multiband image is obtained by combining both results. The imaged multiband image is stored in thestorage unit 112. - Next, the first
spectrum estimating unit 102 reads image information regarding the 6-band multiband image imaged by the multibandimage imaging unit 101 from thestorage unit 112 to estimate first spectral transmittance (spectrum of the object) based on the read image information (step S2). The process thereafter is performed according to the procedure similar to that disclosed in the above-mentioned non-patent document, and a Wiener estimation is used as in the non-patent document as an estimation method at step S2. Specifically, an equation (3)
which is described also in the section of the background art, is used to convert a matrix representation G(x,y) of a pixel value at a point (x, y) on the multiband image, thereby estimating the matrix representation T^(x, y) of the spectral transmittance at a corresponding point on the specimen. Here, T^(x, y) represents an estimation value of the first spectral transmittance. Hereinafter, the estimation value of the spectral transmittance is simply referred to as "spectral transmittance". Meanwhile, meaning of each symbol in the equation (3) is as described in the section of the background of art. - Here, spectral transmittance F of the
optical filter 1013, spectral sensitivity characteristics S of theRGB camera 1015, and spectral radiance characteristics E of the illuminatingunit 1011 are measured in advance with a spectrometer after selecting a device to be used. Meanwhile, although the spectral transmittance of theoptical system 1012 approximates 1.0 herein, when deviation from the an approximation value 1.0 is not acceptable, the spectral transmittance of theoptical system 1012 may also be measured in advance and multiplied by the spectral radiance characteristics E of the illumination. - A covariance matrix RSS of the spectral transmittance of the specimen is obtained by preparing a typical H&E stained pathological specimen and measuring the spectral transmittance of a plurality of points with the spectrometer. At that time, it is better to measure approximately 100 points in the specimen without bias, in order to improve statistical accuracy. On the other hand, a covariance matrix RNN of noise of the camera is obtained by performing the first and second imagings with the multiband
image imaging unit 101 in a state in which the specimen is not placed to obtain variance of the pixel value for each band of the obtained 6-band image, and generating the matrix having the same as a diagonal component. However, it is supposed that there is no noise correlation between bands. The first spectral transmittance T^(x, y) obtained in this manner is stored in thestorage unit 112. - Consequently, the dye
amount estimating unit 103 reads the first spectral transmittance T^(x, y) estimated by the firstspectrum estimating unit 102 from thestorage unit 112, and converts the read first spectral transmittance T^(x, y) to estimate the dye amount (step S3). The dyes to be processed here are hematoxylin, eosin which stains the cytoplasm, and eosin which stains the red blood cell, as in the non-patent document, and they are abbreviated as dyes H, E, and R, respectively. In the specific process, the following equation (7)
- As one example, considering a case in which the equation (7) is made simultaneous with three wavelengths λ1, λ2 and λ3, the matrix representation as in the following equation (9) is obtained.


storage unit 112. - After that, the second
spectrum estimating unit 104 reads the dye amount estimated by the dyeamount estimating unit 103 from thestorage unit 112, and converts the read dye amount to synthesize second spectral transmittance (first spectrum) (step S4). At step S4, a term for the dye R is eliminated from the equation (8), and the following equation (11) obtained by setting coefficients αH and αE to 1 is used.
storage unit 112. - Next, the
spectral subtractor 105 reads the first and second spectral transmittances T^(x, y) and T***(x, y) from thestorage unit 112, and calculates a difference spectrum by subtracting the second spectral transmittance T***(x, y) from the first spectral transmittance T^(x, y),
storage unit 112. - Here, a reason for obtaining the difference spectrum Tdiff(x, y) is as follows. Although the dye
amount estimating unit 103 converts the first spectral transmittance T^(x, y) estimated by the firstspectrum estimating unit 102 to the dye amount, physical model used at that time is the Lambert-Beer law only. The Lambert-Beer law is obtained by formulating attenuation of light passing through a translucent substance assuming that there is no refraction and scattering, but the refraction and the scattering might occur in the actual stained specimen. Therefore, when modeling the attenuation of light by the stained specimen only by the Lambert-Beer law, error that accompanies the modeling occurs, so that even when the spectral transmittance of the stained specimen is calculated by applying the dye amount estimated from the first spectral transmittance T^(x, y) to the Lambert-Beer law again, this does not conform to the first spectral transmittance T^(x, y) in general. However, model construction including the refraction and the scattering in a living specimen is extremely difficult, and this is practically impracticable. Then, in this embodiment, it is configured to bring out the error of modeling including the effect of the refraction and the scattering as the difference spectrum, and combine the same with the information capable of modeling, thereby improving general accuracy. - In this embodiment, when calculating the second spectral transmittance T**(x, y), the term for the dye R (eosin, which stains the red blood cell) is eliminated (refer to the equation (11)). Therefore, the second spectral transmittance T**(x, y) does not include the attenuation due to the dye R. Instead, the attenuation of light caused by the dye R included in the first spectral transmittance T^(x, y) is given to a following process in a state included in the difference spectrum Tdiff(x, y).
- Continuously, the dye
amount correcting unit 106 performs correction of multiplying coefficients (first coefficients) αH and αE by the dye amounts dH and dE, respectively (step S6). The dye amounts after the correction are αHdH and αEdE, respectively. Although the initial values of the coefficients αH and αE are 1, the values can be changed by the input from theoperating unit 111, as described later. Meanwhile, it is also possible to further introduce the coefficients (second coefficients) βH and βE to correct the dye amounts by the forms αHdH+βH and αEdE+βE. It is possible to add a bias component to the estimated dye amount in this form, so that an emphatic effect different from a case in which the coefficient is multiplied only is obtained. The initial values of the coefficients βH and βE may be set to 0. The dye amounts corrected in this manner are stored in thestorage unit 112. - The dye amount dR of the dye R is eliminated from the correction object at the above-described step S6 because the dye R is not susceptible to the effect by a staining state and generally displays vivid red, so that it is not practically necessary to be corrected. In addition, color saturation of the dye R is higher than those of the dyes H and E, so that the color in a finally output RGB image is prone to unnatural due to the effect of the error which occurs in modeling and calculation process, and this tendency is further emphasized by correcting the dye amount. Therefore, unless there is some positive reason to correct the dye amount dR of the dye R, this is preferably eliminated from the correction object.
- In this embodiment, not only by eliminating the dye R from the correction object, but also by processing the same by including in the difference spectrum Tdiff(x, y) as described above, the effect of the error in an area including the dye R (that is to say, a red blood cell area) to the finally output RGB image is reduced.
- Consequently, the third
spectrum estimating unit 107 reads the dye amount corrected by the dyeamount correcting unit 106 from thestorage unit 112, and converts the read dye amount to synthesize third spectral transmittance (second spectrum) (step S7). At step S7, the following equation (13) is obtained by eliminating the term for the dye R from the equation (8) shown in the section of the background art.
storage unit 112. - After that, the
spectrum adder 108 reads the third spectral transmittance T***(x, y, λ) obtained by the thirdspectrum estimating unit 107 and the difference spectrum Tdiff(x,y,λ) obtained by thespectrum subtractor 105 from thestorage unit 112 to add, and synthesizes fourth spectral transmittance (third spectrum) (step S8).
storage unit 112. Hereinafter, T̃ is sometimes represented as T~. - As described above, the difference spectrum Tdiff(x, y) includes modeling error due to the effect of the scattering and diffusion and the attenuation of light by the dye R (eosin, which stains the red blood cell). By adding the same to the attenuation of light by the dyes H and E modeled by the Lambert-Beer law, it is possible to calculate the spectral transmittance data having high accuracy with reduced effect of the modeling error.
- Next, the
image synthesizer 109 reads the fourth spectral transmittance T~(x, y) from thestorage unit 112 and synthesizes the RGB image, which is a display image, using the read fourth spectral transmittance T~(x, y) (step 9). Specifically, when converting T~(x, y) to an RGB value GRGB(x, y), the following equation (15) obtained by eliminating a noise component N in the equation (2) is used.
RGB camera 1015. It is simple to use the spectral sensitivity characteristics of theRGB camera 1015 that images the multiband image, but this may be those of another RGB camera. At step S9, the RGB image having the same width and height as the imaged multiband image is obtained by repeatedly performing the process to convert the fourth spectral transmittance T~(x, y) to the RGB value for all of the points (x, y). The RGB image synthesized in this manner is stored in thestorage unit 112. - The
display unit 110 displays the RGB image generated by theimage synthesizer 109 and stored in thestorage unit 112.FIG. 7 is a view showing a displaying example of the RGB image in thedisplay unit 110. AnRGB image 41 shown in the drawing is obtained by executing the image processing method according to this embodiment to the image obtained by imaging the same portion as theRGB image 51 inFIG. 10 described in the section of the background art. When comparing theRGB image 41 with theRGB image 51, a redblood cell area 41R of theRGB image 41 is more tinged with red than a redblood cell area 51R of theRGB image 51, and displays more natural color without causing the unnatural color variation in the image. Also, theRGB image 41 totally displays the natural color for other areas. - Meanwhile, as the
display unit 110, a general flat panel display (such as a liquid crystal and an organic EL) or a CRT display may be used. When a plurality of RGB images are stored in thestorage unit 112, a mechanism with which the user can select the RGB image to be displayed may be added. - In the above-described image processing method, it is also possible to provide a dye amount correction function adjustable by the user himself. In this case, the user inputs a correction instruction signal to instruct the correction of the dye amount by operating the
operating unit 111 while observing the RGB image displayed on thedisplay unit 110. The correction instruction signal includes, for example, an instruction to change the coefficients αH and αE used in the dyeamount correcting unit 106. Theoperating unit 111 may be realized by devices such as a slider 21 (FIG. 8A ), a dial 22 (FIG. 8B ), and a push button 23 (FIG. 8C ). A configuration in which any of graphical user interfaces 31 (FIG. 9A ), 32 (FIG. 9B ) and 33 (FIG. 9C ), which imitatively display the devices on a screen, is displayed on the screen of thedisplay unit 110 and is operated by a mouse and a touch panel is also possible. By providing such anoperating unit 111, the user may simply input the correction instruction signal including change of the coefficients αH and αE. - Meanwhile, although the devices and the graphical user interfaces for correcting one dye are shown in
FIGs. 8A to 8C and9A to 9C , it is also possible to simultaneously input the correction instruction signal of one or a plurality of the dyes by a plurality of them or a combination of them. - In response to the correction instruction signal input from the
operating unit 111 in this manner, the coefficients αH and αE used in the dyeamount correcting unit 106 are immediately changed, and a correction process of the dye amount (step S6) is executed again in the dyeamount correcting unit 106. Next to the dye amount correcting process, the thirdspectrum estimating unit 107, thespectrum adder 108, and theimage synthesizer 109 perform the above-described processes (steps S7 to S9), respectively, and the RGB image synthesized again is displayed on the display unit 110 (step S10). - When providing the here described correction function of the dye amount by the user himself to the
image processing apparatus 1, it is possible to immediately reflect a result of the correction operation of the dye amount as the RGB image by mounting a high-speed processor on theimage processing apparatus 1, so that the user can correct the dye amount by confirming the operation contents, thereby significantly improving the operability thereof. - According to one embodiment of the present invention described above, it is possible to correct the staining variation by using the image processing including the function to virtually adjusting the staining dye amount without causing the unnatural color variation in the image.
- Also, according to this embodiment, by processing the modeling error caused by the refraction and the scattering when applying the Lambert-Beer law to the living specimen as the difference spectrum, it becomes possible to perform a spectral data process having high accuracy, which is not susceptible to the effect of the modeling error. As a result, the RGB image more preferable in performing the visual presentation can be obtained.
- Meanwhile, in this embodiment, although the dye R is eliminated from the object of the dye amount correction in the second
spectrum estimating unit 104, the dyeamount correcting unit 106, and the thirdspectrum estimating unit 107, when it is desired to especially add them to the correction object, following equations (11)' and (13)' may be used in place of the equations (11) and (13), respectively.

operating unit 111. - Also, although the second
spectrum estimating unit 104 and the thirdspectrum estimating unit 107 are separated in this embodiment, if the coefficients αH and α are set to 1 in the thirdspectrum estimating unit 107, the process becomes identical to that of the secondspectrum estimating unit 104. Therefore, the configuration that the second and thirdspectrum estimating units - The CPU provided in the
image processing apparatus 1 executes the calculation process regarding the image processing method by reading the image processing program for executing the image processing method according to this embodiment from thestorage unit 112. Meanwhile, the image processing program according to this embodiment may be recorded in a computer-readable recording media such as a flexible disk, a CD-ROM, a DVD-ROM, and a flash memory and is widely distributed. In this sense, theimage processing apparatus 1 may be provided with an auxiliary storage device capable of reading any of the above-described various recording media. - Although the best mode for carrying out the present invention has been described as above, the present invention is not limited to only one embodiment described above. That is to say, the present invention may include various embodiments or the like, which are not herein described, and kinds of design changes may be made without departing from the technical idea specified by the scope of claims.
- As described above, the image processing apparatus, the image processing method, and the image processing program according to the present invention are useful in the image processing technology of the living specimen stained by the dye, and are suitable for forming the display image from the image data obtained by imaging the pathological specimen with multiband using the transmitting illumination.
Claims (22)
- An image processing apparatus for performing an image processing on an image, comprising;
a storage unit for storing image information regarding the image;
a first spectrum estimating unit for reading the image information from the storage unit and estimating a spectrum of an object based on the read image information;
a dye amount estimating unit for estimating a plurality of dye amounts included in the object using the spectrum of the object estimated by the first spectrum estimating unit;
a second spectrum estimating unit for synthesizing a first spectrum using the plurality of dye amounts estimated by the dye amount estimating unit;
a spectrum subtractor for calculating a difference spectrum by subtracting the first spectrum synthesized by the second spectrum estimating unit from the spectrum of the object;
a dye amount correcting unit for correcting at least a part of the plurality of dye amounts estimated by the dye amount estimating unit;
a third spectrum estimating unit for synthesizing a second spectrum using the dye amount corrected by the dye amount correcting unit;
a spectrum adder for synthesizing a third spectrum by adding the second spectrum synthesized by the third spectrum estimating unit and the difference spectrum; and
an image synthesizer for synthesizing a display image from the third spectrum synthesized by the spectrum adder. - The image processing apparatus according to claim 1, wherein the display image is an RGB image.
- The image processing apparatus according to claim 1 or 2, wherein the number of dye amounts estimated from the spectrum of the object is larger than the number of dye amounts used for synthesizing the first spectrum.
- The image processing apparatus according to claim 1 or 2, wherein the number of dye amounts estimated from the spectrum of the object is equal to the number of dye amounts used for synthesizing the first spectrum.
- The image processing apparatus according to any one of claims 1 to 4, wherein the number of dye amounts used for synthesizing the first spectrum and the number of dye amounts used for synthesizing the second spectrum are equal to each other.
- The image processing apparatus according to any one of claims 1 to 5, further comprising a display unit for displaying the display image.
- The image processing apparatus according to any one of claims 1 to 6, further comprising an operating unit to which a correction instruction signal for instructing correction of the dye amount is input.
- The image processing apparatus according to claim 7, wherein information regarding a coefficient used when correcting the dye amount is included in the correction instruction signal.
- The image processing apparatus according to claim 7 or 8, wherein the operating unit includes any one of a slider, a dial, and a push button.
- The image processing apparatus according to claim 7 or 8, wherein the operating unit includes a graphical user interface, which imitates any one of a slider, a dial, and a push button.
- The image processing apparatus according to claim 10, wherein the graphical user interface is displayed in a same screen as the display image.
- The image processing apparatus according to any one of claims 1 to 11, wherein the dye amount correcting unit corrects the dye amount by multiplying a first coefficient by the dye amount.
- The image processing apparatus according to any one of claims 1 to 12, wherein the dye amount correcting unit corrects the dye amount by adding a second coefficient to the dye amount.
- The image processing apparatus according to any one of claims 7 to 13, wherein the dye amount correcting unit, the third spectrum estimating unit, the spectrum adder, and the image synthesizer perform a process based on contents of the correction instruction signal input by the operating unit, and
the display unit displays the display image to which the process based on the contents of the correction instruction signal is reflected. - The image processing apparatus according to any one of claims 1 to 14, wherein the object is a stained living specimen.
- The image processing apparatus according to claim 15, wherein the object is a pathological specimen.
- The image processing apparatus according to claim 16, wherein the dye amount estimated by the dye amount estimating unit includes hematoxylin and eosin.
- The image processing apparatus according to claim 17, wherein the dye amount estimated by the dye amount estimating unit further includes eosin which stains a red blood cell.
- The image processing apparatus according to any one of claims 1 to 18, wherein the first spectrum estimating unit uses a Wiener estimation when estimating the spectrum of the object.
- The image processing apparatus according to any one of claims 1 to 19, wherein the first spectrum estimating unit uses a Lambert-Beer law when estimating the plurality of dye amounts included in the object.
- An image processing method performed in a computer capable of performing an image processing on an image, the computer including a storage unit for storing image information regarding the image, the image processing method comprising:a first spectrum estimating step of reading the image information from the storage unit and estimating a spectrum of an object based on the read image information;a dye amount estimating step of estimating a plurality of dye amounts included in the object using the spectrum of the object estimated at the first spectrum estimating step;a second spectrum estimating step of synthesizing a first spectrum using the plurality of dye amounts estimated at the dye amount estimating step;a spectrum subtracting step of calculating a difference spectrum by subtracting the first spectrum synthesized at the second spectrum estimating step from the spectrum of the object;a dye amount correcting step of correcting at least a part of the plurality of dye amounts estimated at the dye amount estimating step;a third spectrum estimating step of synthesizing a second spectrum using the dye amount corrected at the dye amount correcting step;a spectrum adding step of synthesizing a third spectrum by adding the second spectrum synthesized at the third spectrum estimating step and the difference spectrum; andan image synthesizing step of synthesizing a display image from the third spectrum synthesized at the spectrum adding step.
- An image processing program for causing a computer which is capable of performing an image processing on an image and includes a storage unit for storing image information regarding the image, to perform:a first spectrum estimating step of reading the image information from the storage unit and estimating a spectrum of an object based on the read image information;a dye amount estimating step of estimating a plurality of dye amounts included in the object using the spectrum of the object estimated at the first spectrum estimating step;a second spectrum estimating step of synthesizing a first spectrum using the plurality of dye amounts estimated at the dye amount estimating step;a spectrum subtracting step of calculating a difference spectrum by subtracting the first spectrum synthesized at the second spectrum estimating step from the spectrum of the object;a dye amount correcting step of correcting at least a part of the plurality of dye amounts estimated at the dye amount estimating step;a third spectrum estimating step of synthesizing a second spectrum using the dye amount corrected at the dye amount correcting step;a spectrum adding step of synthesizing a third spectrum by adding the second spectrum synthesized at the third spectrum estimating step and the difference spectrum; andan image synthesizing step of synthesizing a display image from the third spectrum synthesized at the spectrum adding step.
Applications Claiming Priority (2)
| Application Number | Priority Date | Filing Date | Title |
|---|---|---|---|
| JP2006228269A JP4740068B2 (en) | 2006-08-24 | 2006-08-24 | Image processing apparatus, image processing method, and image processing program |
| PCT/JP2007/065979 WO2008023629A1 (en) | 2006-08-24 | 2007-08-10 | Image processing device, image processing method, and image processing program |
Publications (2)
| Publication Number | Publication Date |
|---|---|
| EP2060903A1 true EP2060903A1 (en) | 2009-05-20 |
| EP2060903A4 EP2060903A4 (en) | 2017-07-26 |
Family
ID=39106714
Family Applications (1)
| Application Number | Title | Priority Date | Filing Date |
|---|---|---|---|
| EP07792608.7A Withdrawn EP2060903A4 (en) | 2006-08-24 | 2007-08-10 | Image processing device, image processing method, and image processing program |
Country Status (4)
| Country | Link |
|---|---|
| US (1) | US8068133B2 (en) |
| EP (1) | EP2060903A4 (en) |
| JP (1) | JP4740068B2 (en) |
| WO (1) | WO2008023629A1 (en) |
Families Citing this family (16)
| Publication number | Priority date | Publication date | Assignee | Title |
|---|---|---|---|---|
| JP5161052B2 (en) * | 2008-12-04 | 2013-03-13 | オリンパス株式会社 | Microscope system, specimen observation method and program |
| US9552518B2 (en) * | 2000-07-31 | 2017-01-24 | The United States Of America, As Represented By The Secretary Of The Navy | Method of out-of-band correction for multispectral remote sensing |
| JP5117274B2 (en) * | 2008-05-02 | 2013-01-16 | オリンパス株式会社 | Image processing apparatus and image processing program |
| JP5478084B2 (en) * | 2009-01-23 | 2014-04-23 | オリンパス株式会社 | Image processing system, image processing apparatus, and image processing terminal |
| US20100201800A1 (en) * | 2009-02-09 | 2010-08-12 | Olympus Corporation | Microscopy system |
| JP5490568B2 (en) | 2010-02-26 | 2014-05-14 | オリンパス株式会社 | Microscope system, specimen observation method and program |
| JP5557091B2 (en) * | 2010-03-30 | 2014-07-23 | 日本電気株式会社 | Image processing apparatus, image reading apparatus, image processing method, and image processing program |
| JP5451552B2 (en) | 2010-08-09 | 2014-03-26 | オリンパス株式会社 | Microscope system, specimen observation method and program |
| US8433132B2 (en) * | 2011-04-12 | 2013-04-30 | Sony Corporation | Method for efficient representation and processing of color pixel data in digital pathology images |
| JP5752985B2 (en) * | 2011-04-28 | 2015-07-22 | オリンパス株式会社 | Image processing apparatus, image processing method, image processing program, and virtual microscope system |
| US8977017B2 (en) * | 2011-09-15 | 2015-03-10 | The General Hospital Corporation | System and method for support of medical diagnosis |
| US20130342845A1 (en) * | 2012-06-21 | 2013-12-26 | Wei Chen | Method of multispectral decomposition for the removal of out-of-band effects |
| KR101854815B1 (en) * | 2012-10-10 | 2018-05-04 | 광주과학기술원 | Spectroscopic apparatus and spectroscopic method |
| US11385168B2 (en) | 2015-03-31 | 2022-07-12 | Nec Corporation | Spectroscopic analysis apparatus, spectroscopic analysis method, and readable medium |
| US10785903B2 (en) * | 2018-04-17 | 2020-09-29 | Hrl Laboratories, Llc | System and method for determining crop residue fraction using blind source separation of color images |
| JP2019190927A (en) * | 2018-04-23 | 2019-10-31 | キヤノン株式会社 | Analysis system, image capturing device, and program |
Family Cites Families (7)
| Publication number | Priority date | Publication date | Assignee | Title |
|---|---|---|---|---|
| JP3469619B2 (en) | 1993-10-22 | 2003-11-25 | オリンパス光学工業株式会社 | Color classification device |
| AT400639B (en) * | 1994-07-18 | 1996-02-26 | Avl Verbrennungskraft Messtech | METHOD FOR DETERMINING THE CONCENTRATION C OF AN ABSORBENT HOMOGENOUSLY DISTRIBUTED IN A SUBSTANCE |
| US5629734A (en) | 1995-03-17 | 1997-05-13 | Eastman Kodak Company | Adaptive color plan interpolation in single sensor color electronic camera |
| JPH1196333A (en) * | 1997-09-16 | 1999-04-09 | Olympus Optical Co Ltd | Color image processing equipment |
| JP2002149148A (en) * | 2000-11-08 | 2002-05-24 | Telecommunication Advancement Organization Of Japan | Color reproduction system |
| JP2003065948A (en) * | 2001-08-27 | 2003-03-05 | Telecommunication Advancement Organization Of Japan | Apparatus, method and program for processing microscopic image |
| JP4696223B2 (en) * | 2004-03-31 | 2011-06-08 | 国立大学法人三重大学 | Quantitative determination of plant pigment content using image analysis |
-
2006
- 2006-08-24 JP JP2006228269A patent/JP4740068B2/en not_active Expired - Fee Related
-
2007
- 2007-08-10 EP EP07792608.7A patent/EP2060903A4/en not_active Withdrawn
- 2007-08-10 WO PCT/JP2007/065979 patent/WO2008023629A1/en not_active Ceased
-
2009
- 2009-02-24 US US12/380,137 patent/US8068133B2/en not_active Expired - Fee Related
Non-Patent Citations (1)
| Title |
|---|
| See references of WO2008023629A1 * |
Also Published As
| Publication number | Publication date |
|---|---|
| EP2060903A4 (en) | 2017-07-26 |
| WO2008023629A1 (en) | 2008-02-28 |
| JP4740068B2 (en) | 2011-08-03 |
| JP2008051654A (en) | 2008-03-06 |
| US20090231421A1 (en) | 2009-09-17 |
| US8068133B2 (en) | 2011-11-29 |
Similar Documents
| Publication | Publication Date | Title |
|---|---|---|
| US8068133B2 (en) | Image processing apparatus and image processing method | |
| US8666113B2 (en) | Spectral unmixing for visualization of samples | |
| US8503743B2 (en) | Image processing system, image processing device and image processing terminal | |
| US20110182490A1 (en) | Visualization of stained samples | |
| JP6590928B2 (en) | Image processing apparatus, imaging system, image processing method, and image processing program | |
| US8160331B2 (en) | Image processing apparatus and computer program product | |
| US20100195903A1 (en) | Image processing device, data-set generating device, computer readable storage medium storing image processing program and computer readable storage medium storing data-set generating program | |
| JP5738564B2 (en) | Image processing system | |
| US20130071002A1 (en) | System and method for support of medical diagnosis | |
| US9406118B2 (en) | Stain image color correcting apparatus, method, and system | |
| JP2010156612A (en) | Image processing device, image processing program, image processing method, and virtual microscope system | |
| JP5305618B2 (en) | Image processing apparatus and image processing program | |
| US20180146847A1 (en) | Image processing device, imaging system, image processing method, and computer-readable recording medium | |
| JP2009014355A (en) | Image processor and processing program | |
| JP2009186442A (en) | Image processor, reliability evaluation method and image processing program of image processor | |
| JP4920507B2 (en) | Image processing apparatus and image processing program | |
| JP5752985B2 (en) | Image processing apparatus, image processing method, image processing program, and virtual microscope system | |
| JP5210571B2 (en) | Image processing apparatus, image processing program, and image processing method | |
| US11037294B2 (en) | Image processing device, image processing method, and computer-readable recording medium | |
| US8295562B2 (en) | Medical image modification to simulate characteristics | |
| Bautista et al. | Multispectral enhancement method to increase the visual differences of tissue structures in stained histopathology images | |
| US20120250960A1 (en) | Image processing apparatus, image processing method, image processing program, and virtual microscope system |
Legal Events
| Date | Code | Title | Description |
|---|---|---|---|
| PUAI | Public reference made under article 153(3) epc to a published international application that has entered the european phase |
Free format text: ORIGINAL CODE: 0009012 |
|
| 17P | Request for examination filed |
Effective date: 20090304 |
|
| AK | Designated contracting states |
Kind code of ref document: A1 Designated state(s): AT BE BG CH CY CZ DE DK EE ES FI FR GB GR HU IE IS IT LI LT LU LV MC MT NL PL PT RO SE SI SK TR |
|
| AX | Request for extension of the european patent |
Extension state: AL BA HR MK RS |
|
| DAX | Request for extension of the european patent (deleted) | ||
| RBV | Designated contracting states (corrected) |
Designated state(s): DE FR GB |
|
| RAP1 | Party data changed (applicant data changed or rights of an application transferred) |
Owner name: OLYMPUS CORPORATION |
|
| RAP1 | Party data changed (applicant data changed or rights of an application transferred) |
Owner name: OLYMPUS CORPORATION |
|
| RAP1 | Party data changed (applicant data changed or rights of an application transferred) |
Owner name: OLYMPUS CORPORATION |
|
| RIN1 | Information on inventor provided before grant (corrected) |
Inventor name: ABE, TOKIYA Inventor name: ARAI, SATOSHI Inventor name: YAMAGUCHI, MASAHIRO |
|
| RA4 | Supplementary search report drawn up and despatched (corrected) |
Effective date: 20170622 |
|
| RIC1 | Information provided on ipc code assigned before grant |
Ipc: G06T 7/90 20170101ALI20170616BHEP Ipc: A61K 49/00 20060101ALI20170616BHEP Ipc: G01N 21/31 20060101AFI20170616BHEP Ipc: G06T 11/00 20060101ALI20170616BHEP |
|
| STAA | Information on the status of an ep patent application or granted ep patent |
Free format text: STATUS: THE APPLICATION HAS BEEN WITHDRAWN |
|
| 18W | Application withdrawn |
Effective date: 20180605 |