EP2047245B1 - Automatic material labeling during spectral image data acquisition - Google Patents
Automatic material labeling during spectral image data acquisition Download PDFInfo
- Publication number
- EP2047245B1 EP2047245B1 EP07840556.0A EP07840556A EP2047245B1 EP 2047245 B1 EP2047245 B1 EP 2047245B1 EP 07840556 A EP07840556 A EP 07840556A EP 2047245 B1 EP2047245 B1 EP 2047245B1
- Authority
- EP
- European Patent Office
- Prior art keywords
- spectra
- pixels
- pixel
- collected
- probable
- Prior art date
- Legal status (The legal status is an assumption and is not a legal conclusion. Google has not performed a legal analysis and makes no representation as to the accuracy of the status listed.)
- Active
Links
Images

Classifications
-
- H—ELECTRICITY
- H01—ELECTRIC ELEMENTS
- H01J—ELECTRIC DISCHARGE TUBES OR DISCHARGE LAMPS
- H01J49/00—Particle spectrometers or separator tubes
- H01J49/0027—Methods for using particle spectrometers
- H01J49/0036—Step by step routines describing the handling of the data generated during a measurement
-
- G—PHYSICS
- G01—MEASURING; TESTING
- G01J—MEASUREMENT OF INTENSITY, VELOCITY, SPECTRAL CONTENT, POLARISATION, PHASE OR PULSE CHARACTERISTICS OF INFRARED, VISIBLE OR ULTRAVIOLET LIGHT; COLORIMETRY; RADIATION PYROMETRY
- G01J3/00—Spectrometry; Spectrophotometry; Monochromators; Measuring colours
- G01J3/28—Investigating the spectrum
-
- G—PHYSICS
- G01—MEASURING; TESTING
- G01N—INVESTIGATING OR ANALYSING MATERIALS BY DETERMINING THEIR CHEMICAL OR PHYSICAL PROPERTIES
- G01N21/00—Investigating or analysing materials by the use of optical means, i.e. using sub-millimetre waves, infrared, visible or ultraviolet light
- G01N21/17—Systems in which incident light is modified in accordance with the properties of the material investigated
- G01N21/25—Colour; Spectral properties, i.e. comparison of effect of material on the light at two or more different wavelengths or wavelength bands
- G01N21/31—Investigating relative effect of material at wavelengths characteristic of specific elements or molecules, e.g. atomic absorption spectrometry
-
- G—PHYSICS
- G01—MEASURING; TESTING
- G01N—INVESTIGATING OR ANALYSING MATERIALS BY DETERMINING THEIR CHEMICAL OR PHYSICAL PROPERTIES
- G01N23/00—Investigating or analysing materials by the use of wave or particle radiation, e.g. X-rays or neutrons, not covered by groups G01N3/00 – G01N17/00, G01N21/00 or G01N22/00
- G01N23/22—Investigating or analysing materials by the use of wave or particle radiation, e.g. X-rays or neutrons, not covered by groups G01N3/00 – G01N17/00, G01N21/00 or G01N22/00 by measuring secondary emission from the material
- G01N23/225—Investigating or analysing materials by the use of wave or particle radiation, e.g. X-rays or neutrons, not covered by groups G01N3/00 – G01N17/00, G01N21/00 or G01N22/00 by measuring secondary emission from the material using electron or ion
-
- G—PHYSICS
- G01—MEASURING; TESTING
- G01N—INVESTIGATING OR ANALYSING MATERIALS BY DETERMINING THEIR CHEMICAL OR PHYSICAL PROPERTIES
- G01N2201/00—Features of devices classified in G01N21/00
- G01N2201/12—Circuits of general importance; Signal processing
- G01N2201/129—Using chemometrical methods
Definitions
- This document concerns an invention relating generally to spectral microanalysis (i.e., chemical microanalytical characterization of a specimen), and more specifically to methods for enhancing the speed of microanalysis.
- spectral microanalysis yields a map of the specimen's composition, and can do so on a microscopic level, yielding an extremely useful tool for science and industry.
- Spectral microanalysis is usually performed by directing an excitation beam - such as an electron beam or X-ray beam - at a specimen, and then capturing and analyzing the radiation and/or particles emitted by the specimen in response to the excitation beam. Often, data related to the emitted radiation and/or particles are presented to a user as a spectral histogram (or simply a "spectrum"), wherein the counts (numbers) of emissions from the specimen are plotted versus their energy. Most distinct substances generate a unique spectrum, and thus the substance's spectrum serves as a "fingerprint" for the substance.
- an excitation beam - such as an electron beam or X-ray beam -
- specimens rarely consist of pure substances, one usually cannot simply identify the "closest" reference spectrum and assume that it identifies the substance. Rather, a spectrum captured from a specimen often reflects the presence of several substances, each being present in different amounts within the specimen. Thus, the specimen spectrum equates to a combination of the spectra of the component substances, with each component spectrum having a strength within the combination which corresponds to the relative amount of that component.
- analyzing a spectrum captured from a specimen to determine its component spectra (and this its component substances) often requires complicated and time-consuming statistical methods.
- the method described above only provides information about (i.e., a spectrum for) the area of the specimen which is subjected to the excitation beam.
- the excitation beam must be scanned across the specimen (e.g., in an X-Y "rastering" pattern), and spectra must be collected at multiple points during the scan. This leads to large amounts of data, and consequently large data analysis times.
- each spectrum contains information regarding the elements present in the specimen at the pixel from which the spectrum was captured.
- data resulting from the excitation beam is also captured at each pixel and can be used to generate an image of the pixel.
- the image may depict the pixel's backscattered electrons (electrons from the excitation beam which were "reflected" from the specimen), or the pixel's secondary electrons (electrons knocked out of the specimen by the excitation beam).
- the image provides a visual representation of the pixel, though the visual representation may not correspond to the pixel's appearance if viewed by the eye under standard light; for example, a backscattered electron image effectively provides a view of the pixel's density, and a secondary electron image effectively provides a view of the pixel's surface roughness.
- the combination of the spectrum and image data at a particular pixel is often referred to as a "hyperspectral image,” or as a "hyperspectral data cube" when referring to the spectra and image data over the entire scanned region (i.e., over all pixels).
- the spectra from the various pixels are then statistically analyzed via Principal Component Analysis (PCA) to determine which components (i.e., compounds or other combinations of elements) seem most likely to be present in the scanned region of the specimen, and at each pixel in the scanned region.
- PCA Principal Component Analysis
- the correlations between the pixel spectra are determined to extract the spectra of the underlying components that seem to be present in the various pixels across the scanned region. This results in a set of statistically-derived spectra, each representing a component, wherein these derived spectra of all of these (derived) components combine in varying proportions at each of the pixels to result in the measured spectra at the pixels.
- the information regarding the derived components and their proportions can then be extended to the measured hyperspectral images to determine their likely components. For example, one could look to each pixel and determine the dominant component at that pixel (i.e., the derived component which seems present in greatest amounts at that pixel, and/or which seems to be most likely to be present at that pixel), and then combine/average the measured spectra of all pixels having that same dominant component.
- the combined spectrum - which at least theoretically represents the component(s) present at its respective pixels - can then be assigned to each of the pixels having that same dominant component. This step, which replaces the measured spectrum for each pixel with its corresponding combined spectrum, can result in a smaller and more manageable set of spectra for the pixels.
- spectra can then each be processed versus databases of reference spectra to determine the probable real-world components at each pixel.
- the image(s) of the specimen can then have the name(s) of the calculated components overlaid over the areas to which they correspond, or the image can be color-coded or otherwise encoded/labeled to allow a user to visualize the composition of the specimen.
- COMPASS a commercially available software package known as COMPASS, details of which are described in greater detail in U.S. Patents 6,584,413 and 6,675,106 .
- COMPASS is a valuable microanalysis tool, it suffers from the drawback that it can be time-consuming to use: since there are many pixels (e.g., over a million pixels across a 1024 X 1024 pixel area), and the correlations between their unique measured spectra must be calculated to determine their probable components (and these spectra may themselves consist of thousands of data points, e.g., counts measured across 4096 energy intervals or "bins"), it can require many minutes to provide the desired output, even where exceptionally fast computer processing speeds are used.
- Other analysis packages which may employ different statistical processing methods than those of the aforementioned patents, tend to incur similar processing times. This is disadvantageous because an analyst naturally wants microanalysis results as soon as possible.
- US 2004/126909 relates to a method and device that are mainly used in the production process of semiconductor electronic circuits and are for reviewing and analyzing, on the basis of inspection information, the composition of particles and defects generated on a semiconductor wafer.
- US 6675106 relates generally to the field of chemical compositional analysis, and more specifically to a method and apparatus for performing multivariate spectral analysis.
- a method for performing spectral microanalysis of a specimen as set out in claim 1.
- the invention involves methods for performing spectral microanalysis and statistical analyses of microanalysis data cubes, as well as devices and systems for performing such methods, wherein the invention is intended to at least partially address the aforementioned problems.
- spectra are collected from a set of pixels spaced about a region of interest on the specimen. This is preferably done by repeated scanning of the excitation beam over the region of interest on the specimen, with spectra being collected from the pixels during each scan.
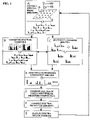
- This is schematically depicted in the accompanying FIG. 1 at step A , wherein an emitter 100 is shown directing an excitation beam at a specimen 10 so that radiation and/or particles emitted by a pixel 12 (i.e., the location of impingement by the excitation beam) can be detected by a detector 102.
- sixteen pixels are depicted (though usually a scanned region of interest would have far more, e.g., a 1024 X 1024 array of pixels rather than a 4 X 4 array), and the emitter 100 might scan the pixels row-by-row and then repeat the scan so that two or more spectra are collected for each pixel during the course of the scans.
- the spectra collected from the pixels 12 are shown below the specimen 10 in the form of histograms including emission counts (i.e., counts of emissions from the pixel in response to the incident excitation beam) which are sorted into a series of discrete energy intervals, with all counts within an interval having corresponding energies fitting within the interval.
- the size of the data can be significantly reduced by "condensing" the spectra collected from the pixels: by combining the emission counts in adjacent energy intervals within each spectrum, as schematically illustrated in FIG. 1 at step B.
- Such spectra could be condensed to 2048 channel spectra, each having channels 20 eV wide (as exemplified by step B as shown in FIG.
- the invention could (for example) perform a first scan over the specimen's region of interest to collect a first set of pixel spectra, and could then process these spectra (and deliver output) in parallel with a subsequent scan to collect a second set of pixel spectra.
- the analysis of the first set can be greatly expedited by condensing the spectra in the aforementioned manner, and the probable components determined by the analysis can be delivered to the analyst as data collection proceeds.
- the primary fault arising from condensing the spectra tends to be that one or more components - generally those that are present in the specimen in lesser amounts - go unidentified, rather than having components be misidentified.
- the degree to which the spectra are condensed may be reduced so that the resolution of the output might be enhanced. For example, after a first scan, the channels of the spectra might be reduced by a factor of four, and the analyst might be rapidly provided with preliminary output identifying the probable components present at the pixels (perhaps along with a warning that the output is merely approximate at this point).
- the channels of the spectra might be reduced by a factor of two, and the analyst can then be provided with updated output identifying the probable specimen components. These results may simply verify the prior output, or they may exhibit more accurate component identification at certain pixels.
- analysis might proceed without condensing the spectra, thereby providing the analyst with even higher accuracy in component identification.
- the analyst is rapidly provided with at least approximate microanalysis results, and these are subsequently periodically updated to enhance their resolution.
- a second useful method of decreasing analysis time is to spatially condense the pixels, i.e., to combine the spectra in adjacent pixels, as schematically illustrated in FIG. 1 at step C.
- a 1024 X 1024 pixel matrix can be condensed to a 512 X 512 matrix by averaging or adding the spectra of adjacent sets of 2 X 2 pixels, a 256 X 256 matrix by averaging or adding the spectra of adjacent sets of 4 X 4 pixels, etc.
- step C as illustrated in FIG. 1 , the spectra of each set of 4 adjacent pixels are combined, thereby condensing the 16 spectra shown in step A to the 4 spectra shown in step C.
- condensing the pixels also serves to reduce the size of the data cube and decrease analysis times, and the accuracy of the analysis does not significantly degrade (at least when only immediately adjacent pixels are combined, e.g., when a 1024 X 1024 is condensed to a 512 X 512 matrix).
- the degree to which the pixels are condensed may be varied during the course of data collection, e.g., larger numbers of pixels may be condensed during early stages of data collection so that component output can be more rapidly provided to an analyst, and as data collection progresses and the analyst has obtained at least preliminary output, the degree of condensation may be reduced, or pixels need not be condensed at all.
- spectral and/or spatial condensation may be applied to allow more rapid analysis, and the analysis can occur in parallel with further data collection so that the analyst need not await results from the collection and analysis of an entire standard data cube.
- the processing time required for statistical analysis is generally reduced from several minutes to only a few seconds (by use of computer processors in common use at the time this document was prepared).
- data collection might periodically be halted so that analysis and output of data can occur, with the analyst being presented with interim analysis results before data collection resumes. In either case, the analyst's productivity is effectively increased because the analyst is able to begin drawing conclusions and making decisions at an earlier stage than in prior microanalysis methods.
- the analysis of the (preferably condensed) spectra, depicted at step D of FIG. 1 can be performed by the multivariate statistical methods described in the aforementioned U.S. Patents 6,584,413 and 6,675,106 , or by any other suitable methods.
- the correlations between the spectra are calculated to generate a set of proposed component spectra, wherein the proposed component spectra combine in varying proportions at each pixel to at least approximately result in the spectra actually collected from the pixels.
- Pixels having similar proposed component content may then be combined (e.g., their spectra may be averaged or added, as depicted at step E ), and these combined spectra may be cross-referenced versus one or more libraries of reference spectra to determine the components which are probably present at the pixels (as depicted at step F ).
- those pixels which are determined to be dominated by (i.e., to predominantly contain) a particular proposed component may have their spectra combined and cross-referenced versus reference libraries to assign probable components to these pixels.
- those pixels which have similar proportions of the same components may have their spectra combined and cross-referenced versus reference libraries to assign probable components to these pixels.
- the probable components may be output to an analyst in a variety of forms (as shown at step G of FIG. 1 ).
- the output includes at least three components: an image of the region of interest (or at least a portion thereof), e.g., a backscattered or secondary electron image (preferably with color-coding, or other encoding, applied to indicate the presence of different probable components); labels naming the probable components of at least some of the pixels within the region of interest (as by simply providing a list of the names of the probable components as they are identified in the reference libraries, perhaps with the percentage of each probable component within the region of interest); and the spectrum for each of the probable components.
- the analyst also has the ability to move a cursor or other pointer over any pixel within the displayed image of the region of interest to display the collected spectrum for that pixel, as well as other information (e.g., the probable components present at that pixel, their percentages, etc.).
- a cursor or other pointer over any pixel within the displayed image of the region of interest to display the collected spectrum for that pixel, as well as other information (e.g., the probable components present at that pixel, their percentages, etc.).
- FIGS. 2-5 show output that might be obtained from an exemplary version of the invention.
- An analyst can load a desired specimen into a spectrometer of the desired form, e.g., a spectrometer for energy-dispersive X-ray spectrometry (EDS), FT-IR and/or Raman spectrometry, electron energy-loss spectrometry (EELS), secondary ion mass spectrometry (SIMS), auger electron spectrometry, or any other spectrometer which collects specimen characteristics (such as mass, energy or wavenumber emissions) on a pixel-by-pixel basis.
- EDS energy-dispersive X-ray spectrometry
- EELS electron energy-loss spectrometry
- SIMS secondary ion mass spectrometry
- auger electron spectrometry or any other spectrometer which collects specimen characteristics (such as mass, energy or wavenumber emissions) on a pixel-by-pixel basis.
- the analyst might then input desired measurement settings, such as the location and size of the region of interest (e.g., 256 X 256 pixels, 1024 X 1024 pixels, etc.), the "frame” or “exposure” time over which emissions are to be captured from each pixel, the number of times the set of pixels is to be scanned, and so forth.
- desired measurement settings such as the location and size of the region of interest (e.g., 256 X 256 pixels, 1024 X 1024 pixels, etc.), the "frame” or “exposure” time over which emissions are to be captured from each pixel, the number of times the set of pixels is to be scanned, and so forth.
- the collected data can periodically be analyzed to provide output to the analyst as data collection proceeds. For example, after each scan over the region of interest, or after some time interval (e.g., 10 seconds) has expired, the system might analyze the data that has thus far been collected and provide output to the analyst so that the analyst might begin formulating conclusions and future actions while data acquisition proceeds. Any conclusions
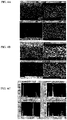
- FIGS. 3A-3C illustrate exemplary results from the specimen of FIG. 2 after data have been collected for 10 seconds (as in step A in FIG. 1 ), condensed (steps B and/or C in FIG. 1 ), and analyzed and output (steps D-G in FIG. 1 ).
- the step of condensing the collected spectra - i.e., "energy binning" (combining adjacent energy intervals/channels) and/or “spatially binning” (combining the spectra of adjacent pixels) the spectra - is optional, but unless the data cube is reduced by these or similar steps, it is difficult to process the collected data with sufficient speed that meaningful analysis results can be supplied during the course of data collection.
- the spectra of the various pixels are analyzed for their correlation to determine some set of proposed component spectra, wherein the proposed component spectra appear to combine in varying proportions to result in the measured spectra at the various pixels.
- FIGS. 3A-3C three proposed components - Cu-Zn (copper-zinc solder), Ag-Cd (silver-cadmium solder), and Fe (iron) - appear probable based on the data cube collected thus far, and FIG. 3A illustrates calculated probability maps wherein the pixel density (pixel darkness) represents the probability that a specified one of the probable components is present at a given pixel.
- FIG. 3B then depicts maps corresponding to those of FIG.
- FIGS. 4A-4C then show corresponding proposed components, probability maps, and spectra after 30 seconds of data collection. At this point, the data cube is larger, and sufficient spectra are present which indicate a the presence of a distinct fourth probable component (Cu) that this component now appears present in the specimen.
- Cu fourth probable component
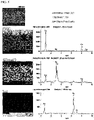
- FIG. 5 presents a view of a report that might be presented to an analyst, with the report here showing the image of the specimen, the binary probability maps for each probable component (which effectively amount to maps of where each probable component is the dominant component in the specimen), and the corresponding reference spectra.
- This report might be presented to the analyst after all data collection is complete, and/or it could be presented at some earlier time (e.g., after some period or time or number of data collection scans).
Landscapes
- Physics & Mathematics (AREA)
- Spectroscopy & Molecular Physics (AREA)
- Analytical Chemistry (AREA)
- General Physics & Mathematics (AREA)
- Chemical & Material Sciences (AREA)
- Biochemistry (AREA)
- Life Sciences & Earth Sciences (AREA)
- General Health & Medical Sciences (AREA)
- Health & Medical Sciences (AREA)
- Immunology (AREA)
- Pathology (AREA)
- Analysing Materials By The Use Of Radiation (AREA)
- Other Investigation Or Analysis Of Materials By Electrical Means (AREA)
- Investigating Or Analysing Materials By Optical Means (AREA)
Description
- This application claims priority under 35 USC §119(e) to
U.S. Provisional Patent Application 60/820,537 filed 27 July 2006 - This document concerns an invention relating generally to spectral microanalysis (i.e., chemical microanalytical characterization of a specimen), and more specifically to methods for enhancing the speed of microanalysis.
- Scientists, technicians and other users often perform spectral microanalysis of specimens to determine the spatial composition of the specimen - in other words, what makes up the specimen (elements, compounds, alloys, phases, etc.) at various points about an area of interest on the specimen. In essence, spectral microanalysis yields a map of the specimen's composition, and can do so on a microscopic level, yielding an extremely useful tool for science and industry.
- Spectral microanalysis is usually performed by directing an excitation beam - such as an electron beam or X-ray beam - at a specimen, and then capturing and analyzing the radiation and/or particles emitted by the specimen in response to the excitation beam. Often, data related to the emitted radiation and/or particles are presented to a user as a spectral histogram (or simply a "spectrum"), wherein the counts (numbers) of emissions from the specimen are plotted versus their energy. Most distinct substances generate a unique spectrum, and thus the substance's spectrum serves as a "fingerprint" for the substance. By capturing spectra from a specimen and then cross-referencing these spectra versus catalogues/databases of "reference spectra" - spectra captured from known substances - one can determine the substances present in the specimen. Usefully, the aforementioned spectra can often be collected along with an image of the specimen, thereby allowing an analyst a useful visual reference against which the spectral (substance identification) data may be reviewed. Thus, one can both view the analyzed region of interest on the specimen, and also determine the composition of the specimen at the viewed region.
- Several factors tend to complicate microanalysis. Initially, since specimens rarely consist of pure substances, one usually cannot simply identify the "closest" reference spectrum and assume that it identifies the substance. Rather, a spectrum captured from a specimen often reflects the presence of several substances, each being present in different amounts within the specimen. Thus, the specimen spectrum equates to a combination of the spectra of the component substances, with each component spectrum having a strength within the combination which corresponds to the relative amount of that component. As a result, analyzing a spectrum captured from a specimen to determine its component spectra (and this its component substances) often requires complicated and time-consuming statistical methods.
- Further, the method described above only provides information about (i.e., a spectrum for) the area of the specimen which is subjected to the excitation beam. Thus, if one wishes to obtain information about a larger region of the specimen, the excitation beam must be scanned across the specimen (e.g., in an X-Y "rastering" pattern), and spectra must be collected at multiple points during the scan. This leads to large amounts of data, and consequently large data analysis times.
- To better illustrate these difficulties, it is useful to consider common spectral microanalysis methods in greater detail. As an excitation beam is scanned between areas or "pixels" distributed about a specimen, a spectrum is collected at each pixel. Each spectrum contains information regarding the elements present in the specimen at the pixel from which the spectrum was captured. In addition, data resulting from the excitation beam is also captured at each pixel and can be used to generate an image of the pixel. For example, where the excitation beam is an electron beam, the image may depict the pixel's backscattered electrons (electrons from the excitation beam which were "reflected" from the specimen), or the pixel's secondary electrons (electrons knocked out of the specimen by the excitation beam). In either case, the image provides a visual representation of the pixel, though the visual representation may not correspond to the pixel's appearance if viewed by the eye under standard light; for example, a backscattered electron image effectively provides a view of the pixel's density, and a secondary electron image effectively provides a view of the pixel's surface roughness. The combination of the spectrum and image data at a particular pixel is often referred to as a "hyperspectral image," or as a "hyperspectral data cube" when referring to the spectra and image data over the entire scanned region (i.e., over all pixels).
- The spectra from the various pixels are then statistically analyzed via Principal Component Analysis (PCA) to determine which components (i.e., compounds or other combinations of elements) seem most likely to be present in the scanned region of the specimen, and at each pixel in the scanned region. In PCA methods, the correlations between the pixel spectra are determined to extract the spectra of the underlying components that seem to be present in the various pixels across the scanned region. This results in a set of statistically-derived spectra, each representing a component, wherein these derived spectra of all of these (derived) components combine in varying proportions at each of the pixels to result in the measured spectra at the pixels.
- The information regarding the derived components and their proportions can then be extended to the measured hyperspectral images to determine their likely components. For example, one could look to each pixel and determine the dominant component at that pixel (i.e., the derived component which seems present in greatest amounts at that pixel, and/or which seems to be most likely to be present at that pixel), and then combine/average the measured spectra of all pixels having that same dominant component. The combined spectrum - which at least theoretically represents the component(s) present at its respective pixels - can then be assigned to each of the pixels having that same dominant component. This step, which replaces the measured spectrum for each pixel with its corresponding combined spectrum, can result in a smaller and more manageable set of spectra for the pixels. These spectra can then each be processed versus databases of reference spectra to determine the probable real-world components at each pixel. If desired, the image(s) of the specimen can then have the name(s) of the calculated components overlaid over the areas to which they correspond, or the image can be color-coded or otherwise encoded/labeled to allow a user to visualize the composition of the specimen.
- The aforementioned statistical analysis of the measured pixel spectra is often performed by a commercially available software package known as COMPASS, details of which are described in greater detail in
U.S. Patents 6,584,413 and6,675,106 . While COMPASS is a valuable microanalysis tool, it suffers from the drawback that it can be time-consuming to use: since there are many pixels (e.g., over a million pixels across a 1024 X 1024 pixel area), and the correlations between their unique measured spectra must be calculated to determine their probable components (and these spectra may themselves consist of thousands of data points, e.g., counts measured across 4096 energy intervals or "bins"), it can require many minutes to provide the desired output, even where exceptionally fast computer processing speeds are used. Other analysis packages, which may employ different statistical processing methods than those of the aforementioned patents, tend to incur similar processing times. This is disadvantageous because an analyst naturally wants microanalysis results as soon as possible. -
US 2004/126909 relates to a method and device that are mainly used in the production process of semiconductor electronic circuits and are for reviewing and analyzing, on the basis of inspection information, the composition of particles and defects generated on a semiconductor wafer. -
US 6675106 relates generally to the field of chemical compositional analysis, and more specifically to a method and apparatus for performing multivariate spectral analysis. - In accordance with the present invention, there is provided a method for performing spectral microanalysis of a specimen, as set out in claim 1. The invention involves methods for performing spectral microanalysis and statistical analyses of microanalysis data cubes, as well as devices and systems for performing such methods, wherein the invention is intended to at least partially address the aforementioned problems. To give the reader a basic understanding of some of the advantageous features of the invention, following is a brief summary of preferred versions of the methods, with reference being made to the accompanying drawings to enhance the reader's understanding. Since this is merely a summary, it should be understood that more details regarding the preferred versions may be found in the Detailed Description set forth elsewhere in this document. The claims set forth at the end of this document then define the various versions of the invention in which exclusive rights are secured.
- Initially, spectra are collected from a set of pixels spaced about a region of interest on the specimen. This is preferably done by repeated scanning of the excitation beam over the region of interest on the specimen, with spectra being collected from the pixels during each scan. This is schematically depicted in the accompanying
FIG. 1 at step A, wherein anemitter 100 is shown directing an excitation beam at aspecimen 10 so that radiation and/or particles emitted by a pixel 12 (i.e., the location of impingement by the excitation beam) can be detected by adetector 102. Here, sixteen pixels are depicted (though usually a scanned region of interest would have far more, e.g., a 1024 X 1024 array of pixels rather than a 4X 4 array), and theemitter 100 might scan the pixels row-by-row and then repeat the scan so that two or more spectra are collected for each pixel during the course of the scans. The spectra collected from thepixels 12 are shown below thespecimen 10 in the form of histograms including emission counts (i.e., counts of emissions from the pixel in response to the incident excitation beam) which are sorted into a series of discrete energy intervals, with all counts within an interval having corresponding energies fitting within the interval. With each successive scan, all spectra collected for each respective pixel can be combined (e.g., added or averaged), thereby generating a combined spectrum for each pixel. This combination process beneficially results in a spectrum with enhanced signal-to-noise ratio because noise present in a pixel's successive individual spectra tends to "average out" in its combined spectrum. - Analysis of the spectra, and output of the probable components present at the pixels, are then preferably performed during collection of the spectra rather than thereafter (as in COMPASS and other prior microanalysis methods). As a result, an analyst can be provided with preliminary microanalysis results while collection of spectra is still underway. Such results may be rough or incomplete, but they may nevertheless allow an analyst to begin drawing conclusions regarding a specimen, to plan further experimentation, or to take other steps which rely on microanalysis results to proceed. As previously noted, conventional analysis is computationally burdensome and time-consuming, and thus it is somewhat impractical to perform conventional analysis during the course of data collection (at least with use of computer processing speeds which are commonly available at the time this document was prepared). Thus, one or more of the following steps is recommended to reduce analysis time and burden, and to hasten output.
- First, the size of the data (e.g., the hyperspectral data cube) can be significantly reduced by "condensing" the spectra collected from the pixels: by combining the emission counts in adjacent energy intervals within each spectrum, as schematically illustrated in
FIG. 1 at step B. As an example, it is conventional to collect spectra which each have counts measured across 4096 channels, with each channel spanning a 10 eV energy interval. Such spectra could be condensed to 2048 channel spectra, each havingchannels 20 eV wide (as exemplified by step B as shown inFIG. 1 , wherein the emission counts in each set of two adjacent channels/intervals are combined); to 1024 channel spectra, each having channels 40 eV wide; or to 512 channel spectra, each having channels 80 eV wide. It has been found that condensing a spectrum by a factor of n results in an increase in analysis speed of approximately n squared (e.g., reducing the number of channels or "bins" by ½ increases analysis speed by a factor of approximately 4). Thus, the invention could (for example) perform a first scan over the specimen's region of interest to collect a first set of pixel spectra, and could then process these spectra (and deliver output) in parallel with a subsequent scan to collect a second set of pixel spectra. The analysis of the first set can be greatly expedited by condensing the spectra in the aforementioned manner, and the probable components determined by the analysis can be delivered to the analyst as data collection proceeds. - It is notable that condensing spectra to fewer channels/intervals will inherently decrease their resolution, and it might be expected that this would have a significant adverse impact on analysis: since the probable components present within the spectra are statistically determined by looking at their correlations, and extracting the common constituents therefrom, it would seem that reducing the number of channels/intervals would generate false or inaccurate correlations and lead to erroneous identification of components. Surprisingly, this has not been found to be the case, at least when the number of channels are condensed to a lesser extent (e.g., halved or quartered). In any event, the primary fault arising from condensing the spectra tends to be that one or more components - generally those that are present in the specimen in lesser amounts - go unidentified, rather than having components be misidentified. Additionally, as data collection progresses and the analyst is presented with at least some preliminary microanalysis results, the degree to which the spectra are condensed may be reduced so that the resolution of the output might be enhanced. For example, after a first scan, the channels of the spectra might be reduced by a factor of four, and the analyst might be rapidly provided with preliminary output identifying the probable components present at the pixels (perhaps along with a warning that the output is merely approximate at this point). When the second scan is complete, the channels of the spectra might be reduced by a factor of two, and the analyst can then be provided with updated output identifying the probable specimen components. These results may simply verify the prior output, or they may exhibit more accurate component identification at certain pixels. After the third or some subsequent scan, analysis might proceed without condensing the spectra, thereby providing the analyst with even higher accuracy in component identification. By following this approach, the analyst is rapidly provided with at least approximate microanalysis results, and these are subsequently periodically updated to enhance their resolution.
- A second useful method of decreasing analysis time is to spatially condense the pixels, i.e., to combine the spectra in adjacent pixels, as schematically illustrated in
FIG. 1 at step C. As an example, a 1024 X 1024 pixel matrix can be condensed to a 512 X 512 matrix by averaging or adding the spectra of adjacent sets of 2X 2 pixels, a 256 X 256 matrix by averaging or adding the spectra of adjacent sets of 4X 4 pixels, etc. In step C as illustrated inFIG. 1 , the spectra of each set of 4 adjacent pixels are combined, thereby condensing the 16 spectra shown in step A to the 4 spectra shown in step C. As with condensing the energies of the spectra, condensing the pixels also serves to reduce the size of the data cube and decrease analysis times, and the accuracy of the analysis does not significantly degrade (at least when only immediately adjacent pixels are combined, e.g., when a 1024 X 1024 is condensed to a 512 X 512 matrix). Also similarly to condensing spectral energies, the degree to which the pixels are condensed may be varied during the course of data collection, e.g., larger numbers of pixels may be condensed during early stages of data collection so that component output can be more rapidly provided to an analyst, and as data collection progresses and the analyst has obtained at least preliminary output, the degree of condensation may be reduced, or pixels need not be condensed at all. - Thus, spectral and/or spatial condensation may be applied to allow more rapid analysis, and the analysis can occur in parallel with further data collection so that the analyst need not await results from the collection and analysis of an entire standard data cube. To illustrate, where both condensation methods are applied, the processing time required for statistical analysis is generally reduced from several minutes to only a few seconds (by use of computer processors in common use at the time this document was prepared). Alternatively, where processor capacity is limited, data collection might periodically be halted so that analysis and output of data can occur, with the analyst being presented with interim analysis results before data collection resumes. In either case, the analyst's productivity is effectively increased because the analyst is able to begin drawing conclusions and making decisions at an earlier stage than in prior microanalysis methods.
- The analysis of the (preferably condensed) spectra, depicted at step D of
FIG. 1 , can be performed by the multivariate statistical methods described in the aforementionedU.S. Patents 6,584,413 and6,675,106 , or by any other suitable methods. Preferably, the correlations between the spectra are calculated to generate a set of proposed component spectra, wherein the proposed component spectra combine in varying proportions at each pixel to at least approximately result in the spectra actually collected from the pixels. Pixels having similar proposed component content may then be combined (e.g., their spectra may be averaged or added, as depicted at step E), and these combined spectra may be cross-referenced versus one or more libraries of reference spectra to determine the components which are probably present at the pixels (as depicted at step F). As a simple example, those pixels which are determined to be dominated by (i.e., to predominantly contain) a particular proposed component may have their spectra combined and cross-referenced versus reference libraries to assign probable components to these pixels. Alternatively or additionally, those pixels which have similar proportions of the same components (e.g., all pixels having 30-35% of proposed component A, 30-35% of proposed component B, and 30-35% of proposed component C) may have their spectra combined and cross-referenced versus reference libraries to assign probable components to these pixels. - Once the probable components are assigned to the pixels, they may be output to an analyst in a variety of forms (as shown at step G of
FIG. 1 ). Preferably, the output includes at least three components: an image of the region of interest (or at least a portion thereof), e.g., a backscattered or secondary electron image (preferably with color-coding, or other encoding, applied to indicate the presence of different probable components); labels naming the probable components of at least some of the pixels within the region of interest (as by simply providing a list of the names of the probable components as they are identified in the reference libraries, perhaps with the percentage of each probable component within the region of interest); and the spectrum for each of the probable components. Preferably, the analyst also has the ability to move a cursor or other pointer over any pixel within the displayed image of the region of interest to display the collected spectrum for that pixel, as well as other information (e.g., the probable components present at that pixel, their percentages, etc.). - Further advantages, features, and objects of the invention will be apparent from the remainder of this document in conjunction with the associated drawings.
-
-
FIG. 1 is a flowchart schematically presenting a preferred form of the invention, wherein a region ofinterest 10 on a specimen is scanned to collect spectra from a set of pixels 12 (step A); the spectra are then condensed by combining the emission counts in adjacent energy intervals (channels) within the spectra (step B), and/or by combining the spectra of adjacent pixels (step C); the condensed spectra are then analyzed to identify probable components present at the pixels (step D); the spectra of the pixels having similar probable components (and proportions thereof) are then combined (step E); the resulting spectra are cross-referenced via reference spectra to determine their actual components (step F); and the results are then output to the analyst (step G). -
FIG. 2 is an image (e.g., an electron image) of a region of interest on a specimen. -
FIGS. 3A-3C illustrate exemplary output that might be obtained from the invention after 10 seconds of data collection and analysis of the region of interest ofFIG. 2 , whereinFIG. 3A illustrates probability maps wherein the density (darkness) or a pixel/region depicts the probability that one of three probable components is present at that pixel,FIG. 3B depicts corresponding binary maps wherein a darkened pixel indicates that a certain probable component is dominant (most probable) at that pixel (and conversely a white pixel indicates that a certain probable component is unlikely at that pixel), andFIG. 3C illustrates the reference spectra obtained when the pixels of each ofFIGS. 3A-3C each have their respective spectra combined and cross-referenced versus a reference library of spectra. -
FIGS. 4A-4C illustrate exemplary output that might be obtained from the invention after 30 seconds of data collection and analysis of the region of interest ofFIG. 2 , with an additional component (Cu in addition to Fe, Cu-Zn, and Ag-Cd) being identified here owing to the larger data cube (with 30 seconds of data rather than merely 10). -
FIG. 5 illustrates an exemplary final report that might be generated and presented to an analyst after data collection is completed on the region of interest ofFIG. 2 (e.g., after 60 seconds of data collection), with an image of the region of interest being presented along with corresponding binary images showing where each predicted component is dominant, and also with the reference spectra obtained when the pixels corresponding to each of the dominant components each have their respective spectra combined and cross-referenced versus a reference library of spectra. - To expand on the foregoing Summary,
FIGS. 2-5 show output that might be obtained from an exemplary version of the invention. An analyst can load a desired specimen into a spectrometer of the desired form, e.g., a spectrometer for energy-dispersive X-ray spectrometry (EDS), FT-IR and/or Raman spectrometry, electron energy-loss spectrometry (EELS), secondary ion mass spectrometry (SIMS), auger electron spectrometry, or any other spectrometer which collects specimen characteristics (such as mass, energy or wavenumber emissions) on a pixel-by-pixel basis. The analyst might then input desired measurement settings, such as the location and size of the region of interest (e.g., 256 X 256 pixels, 1024 X 1024 pixels, etc.), the "frame" or "exposure" time over which emissions are to be captured from each pixel, the number of times the set of pixels is to be scanned, and so forth. Once data collection begins, the collected data can periodically be analyzed to provide output to the analyst as data collection proceeds. For example, after each scan over the region of interest, or after some time interval (e.g., 10 seconds) has expired, the system might analyze the data that has thus far been collected and provide output to the analyst so that the analyst might begin formulating conclusions and future actions while data acquisition proceeds. Any conclusions based on preliminary data analysis results can be revised as data collection proceeds, and as updated or final analysis results are made available to the analyst. - To illustrate this process in greater depth,
FIGS. 3A-3C illustrate exemplary results from the specimen ofFIG. 2 after data have been collected for 10 seconds (as in step A inFIG. 1 ), condensed (steps B and/or C inFIG. 1 ), and analyzed and output (steps D-G inFIG. 1 ). The step of condensing the collected spectra - i.e., "energy binning" (combining adjacent energy intervals/channels) and/or "spatially binning" (combining the spectra of adjacent pixels) the spectra - is optional, but unless the data cube is reduced by these or similar steps, it is difficult to process the collected data with sufficient speed that meaningful analysis results can be supplied during the course of data collection. As discussed previously, during analysis, the spectra of the various pixels are analyzed for their correlation to determine some set of proposed component spectra, wherein the proposed component spectra appear to combine in varying proportions to result in the measured spectra at the various pixels. InFIGS. 3A-3C , three proposed components - Cu-Zn (copper-zinc solder), Ag-Cd (silver-cadmium solder), and Fe (iron) - appear probable based on the data cube collected thus far, andFIG. 3A illustrates calculated probability maps wherein the pixel density (pixel darkness) represents the probability that a specified one of the probable components is present at a given pixel.FIG. 3B then depicts maps corresponding to those ofFIG. 3A , but wherein probabilities are presented in binary form, with a dark pixel indicating that a certain probable component is dominant (most probable) at that pixel, and conversely a white pixel indicating that a certain probable component is unlikely at that pixel. The spectra ofFIG. 3C are then obtained if the measured spectra corresponding to each of the component pixels - i.e., the dark pixels for each of the Cu-Zn, Ag-Cd, and Fe binary maps ofFIG. 3B - are combined, and then cross-referenced versus libraries of reference spectra. -
FIGS. 4A-4C then show corresponding proposed components, probability maps, and spectra after 30 seconds of data collection. At this point, the data cube is larger, and sufficient spectra are present which indicate a the presence of a distinct fourth probable component (Cu) that this component now appears present in the specimen. -
FIG. 5 then presents a view of a report that might be presented to an analyst, with the report here showing the image of the specimen, the binary probability maps for each probable component (which effectively amount to maps of where each probable component is the dominant component in the specimen), and the corresponding reference spectra. This report might be presented to the analyst after all data collection is complete, and/or it could be presented at some earlier time (e.g., after some period or time or number of data collection scans). - It should be understood that the versions of the invention described above are merely exemplary, and the invention is not intended to be limited to these versions. Rather, the scope of rights to the invention is limited only by the claims set out below, and the invention encompasses all different versions that fall within the scope of these claims.
Claims (11)
- A method for performing spectral microanalysis of a specimen, the method including the steps of:a. collecting spectra from pixels spaced about a region of interest on the specimen, wherein each spectrum includes emission counts measured across a range of energies;b. periodically during the collection:(1) condensing the collected spectra by combining the emission counts in adjacent energy intervals within the range of energies and/or condensing the pixels by spatially combining the spectra in adjacent pixels;(2) analyzing the condensed spectra collected thus far to determine the probable components present at the pixels, and(3) outputting the probable components present at the pixels.
- The method of claim 1 wherein the number of adjacent energy intervals whose emission counts are combined is varied as collection progresses.
- The method of claim 1 wherein the number of adjacent energy intervals whose emission counts are combined is reduced as collection progresses.
- The method of any one of the preceding claims wherein the step of outputting the probable components present at the pixels includes displaying:a. an image of at least some of the pixels within the region of interest, andb. labels naming the probable components of at least some of the pixels within the region of interest.
- The method of claim 4 wherein the step of outputting the probable components present at the pixels further includes displaying the spectra of one or more of the pixels within the region of interest.
- The method of any of the preceding claims wherein the step of outputting the probable components present at the pixels includes displaying, for any user-selected pixel:a. the spectrum collected at the user-selected pixel, andb. one or more of the probable components present at the user-selected pixel.
- The method of claim 4 or 5 wherein the step of outputting the probable components present at the pixels further includes displaying the spectra of one or more of the probable components of at least some of the pixels within the region of interest.
- The method of any of the preceding claims wherein the step of collecting spectra from pixels spaced about a region of interest includes:a. scanning the area of interest at least twice, andb. collecting spectra from the pixels during each scan,whereby two or more spectra are collected for each pixel.
- The method of claim 8 wherein, after the second and subsequent scans, the collected spectra for each respective pixel are combined.
- The method of any of the preceding claims wherein the step of analyzing the spectra collected thus far to determine the probable components present at the pixels includes the steps of:a. calculating a set of proposed component spectra, wherein the proposed component spectra combine in varying proportions at each pixel to at least approximately result in the spectra collected from the pixels;b. combining the spectra of the pixels having the same proposed component spectrum present as the maximum proportion of their proposed component spectra;c. cross-referencing the combined spectra versus one or more libraries of reference spectra to determine the components present at the pixels.
- The method of any of claims 1-9 wherein the step of analyzing the spectra collected thus far to determine the probable components present at the pixels includes the steps of:a. calculating a set of proposed component spectra, wherein the proposed component spectra combine in varying proportions at each pixel to at least approximately result in the spectra collected from the pixels;b. combining the spectra of the pixels wherein the proposed component spectra combine in at least substantially the same proportions;c. cross-referencing the combined spectra versus one or more libraries of reference spectra to determine the components present at the pixels.
Applications Claiming Priority (2)
| Application Number | Priority Date | Filing Date | Title |
|---|---|---|---|
| US82053706P | 2006-07-27 | 2006-07-27 | |
| PCT/US2007/074610 WO2008014463A2 (en) | 2006-07-27 | 2007-07-27 | Automatic material labeling during spectral image data acquisition |
Publications (3)
| Publication Number | Publication Date |
|---|---|
| EP2047245A2 EP2047245A2 (en) | 2009-04-15 |
| EP2047245A4 EP2047245A4 (en) | 2016-12-07 |
| EP2047245B1 true EP2047245B1 (en) | 2022-09-21 |
Family
ID=38982391
Family Applications (1)
| Application Number | Title | Priority Date | Filing Date |
|---|---|---|---|
| EP07840556.0A Active EP2047245B1 (en) | 2006-07-27 | 2007-07-27 | Automatic material labeling during spectral image data acquisition |
Country Status (4)
| Country | Link |
|---|---|
| US (1) | US7567871B2 (en) |
| EP (1) | EP2047245B1 (en) |
| JP (1) | JP5286598B2 (en) |
| WO (1) | WO2008014463A2 (en) |
Families Citing this family (11)
| Publication number | Priority date | Publication date | Assignee | Title |
|---|---|---|---|---|
| US9128144B2 (en) * | 2010-08-10 | 2015-09-08 | Sof-Tek Integrators, Inc. | System and method of quantifying color and intensity of light sources |
| US8967851B1 (en) | 2011-01-19 | 2015-03-03 | Kemeny Associates | Spectral monitoring of ingredient blending |
| EP2702204B8 (en) | 2011-04-28 | 2016-09-21 | ABB Schweiz AG | Determination of cd and md variations from scanning measurements of a sheet of material |
| EP3217420A1 (en) * | 2016-03-09 | 2017-09-13 | Carl Zeiss Microscopy Ltd. | Method, analysis system and computer program product for semi-automated x-ray elemental analysis using a particle microscope |
| CN106404688A (en) * | 2016-08-31 | 2017-02-15 | 湖北省兴发磷化工研究院有限公司 | Method for detecting available zinc in fertilizer grade monoammonium phosphate and diammonium phosphate |
| CN109801247A (en) * | 2017-11-16 | 2019-05-24 | 通用电气公司 | Medical imaging procedure, computer program and computer storage medium |
| KR102250387B1 (en) * | 2018-06-21 | 2021-05-10 | 주식회사 엘지화학 | Method for quantifying amine compound forming active layer of separation membrane before preparing it, method for quantifying polyamide or residue amine compound in active layer of separation membrane, and methode for determining creteria for determing conditions or conditions for preparing active layer of separation membrane |
| EP3614414A1 (en) * | 2018-08-20 | 2020-02-26 | FEI Company | Method of examining a sample using a charged particle microscope |
| EP3736849A1 (en) * | 2019-05-06 | 2020-11-11 | FEI Company | Method of examining a sample using a charged particle microscope |
| JP7442487B2 (en) * | 2021-11-02 | 2024-03-04 | 日本電子株式会社 | Phase analyzer, sample analyzer, and analysis method |
| JP7702450B2 (en) * | 2023-07-18 | 2025-07-03 | 日本電子株式会社 | Spectral processing device, sample analysis device, and spectrum processing method |
Family Cites Families (12)
| Publication number | Priority date | Publication date | Assignee | Title |
|---|---|---|---|---|
| JP3303441B2 (en) * | 1993-06-04 | 2002-07-22 | 株式会社島津製作所 | Electron beam analyzer |
| JPH1027833A (en) * | 1996-07-09 | 1998-01-27 | Jeol Ltd | Foreign matter analysis method |
| JP2000180392A (en) * | 1998-12-15 | 2000-06-30 | Shimadzu Corp | Electron beam micro analyzer |
| JP3567176B2 (en) * | 1998-12-28 | 2004-09-22 | 理学電機工業株式会社 | X-ray fluorescence analyzer |
| JP2001176439A (en) * | 1999-12-21 | 2001-06-29 | Jeol Ltd | Analytical measurement method by surface analyzer |
| WO2002001597A1 (en) * | 2000-06-27 | 2002-01-03 | Ebara Corporation | Charged particle beam inspection apparatus and method for fabricating device using that inspection apparatus |
| JP4574815B2 (en) * | 2000-08-25 | 2010-11-04 | エスアイアイ・ナノテクノロジー株式会社 | Energy dispersive X-ray detection system |
| US6584413B1 (en) | 2001-06-01 | 2003-06-24 | Sandia Corporation | Apparatus and system for multivariate spectral analysis |
| US6675106B1 (en) * | 2001-06-01 | 2004-01-06 | Sandia Corporation | Method of multivariate spectral analysis |
| JP3993817B2 (en) * | 2002-12-11 | 2007-10-17 | 株式会社日立製作所 | Defect composition analysis method and apparatus |
| JP3988137B2 (en) * | 2003-01-24 | 2007-10-10 | 株式会社島津製作所 | Elemental analysis analyzer |
| JP4874697B2 (en) * | 2006-04-14 | 2012-02-15 | 日本電子株式会社 | Electron probe X-ray analyzer and operation method thereof |
-
2007
- 2007-07-27 WO PCT/US2007/074610 patent/WO2008014463A2/en not_active Ceased
- 2007-07-27 EP EP07840556.0A patent/EP2047245B1/en active Active
- 2007-07-27 US US11/829,518 patent/US7567871B2/en active Active
- 2007-07-27 JP JP2009522020A patent/JP5286598B2/en active Active
Also Published As
| Publication number | Publication date |
|---|---|
| WO2008014463A3 (en) | 2008-10-23 |
| EP2047245A4 (en) | 2016-12-07 |
| EP2047245A2 (en) | 2009-04-15 |
| WO2008014463A2 (en) | 2008-01-31 |
| US20080027657A1 (en) | 2008-01-31 |
| US7567871B2 (en) | 2009-07-28 |
| JP5286598B2 (en) | 2013-09-11 |
| JP2009544980A (en) | 2009-12-17 |
Similar Documents
| Publication | Publication Date | Title |
|---|---|---|
| US7567871B2 (en) | Automatic material labeling during spectral image data acquisition | |
| EP2812676B1 (en) | Methods and systems for analyzing samples | |
| US9778215B2 (en) | Automated mineral classification | |
| JP2010060389A (en) | Particle analyzer, data analyzer, x-ray analyzer, particle analysis method and computer program | |
| AU2016201122B2 (en) | Sample-specific reference spectra library | |
| JP6569805B2 (en) | Imaging mass spectrometer | |
| EP3062096B1 (en) | Sample-specific reference spectra library | |
| US20080181458A1 (en) | Light intensity measurement method and light intensity measurement system | |
| Koerting et al. | A solar optical hyperspectral library of rare-earth-bearing minerals, rare-earth oxide powders, copper-bearing minerals and Apliki mine surface samples | |
| Bright et al. | Maximum pixel spectrum: a new tool for detecting and recovering rare, unanticipated features from spectrum image data cubes | |
| US12469675B2 (en) | Phase analyzer, sample analyzer, and analysis method | |
| JP2017083235A (en) | Sample frame and sample analysis method | |
| JP7476247B2 (en) | Phase analysis device, sample analysis device, and analysis method | |
| JP7702450B2 (en) | Spectral processing device, sample analysis device, and spectrum processing method | |
| Edwards et al. | Combined cathodoluminescence hyperspectral imaging and wavelength dispersive X-ray analysis of minerals | |
| Gröner et al. | Automated ion imaging with the NanoSIMS ion microprobe | |
| JP6588362B2 (en) | Phase analyzer, phase analysis method, and surface analyzer | |
| EP3073253A1 (en) | Sample-specific reference spectra library | |
| Newbury et al. | “Derived spectra” software tools for detecting spatial and spectral features in spectrum images | |
| Goldstein et al. | Compositional Mapping | |
| US12340972B2 (en) | Method for operating a particle beam microscope, particle beam microscope and computer program product | |
| Newbury et al. | Characterizing heterogeneous particles with SEM/SDD-EDS mapping and NIST Lispix | |
| CN113508293B (en) | Imaging quality analysis device | |
| Fauteux-Lefebvre et al. | Determining the Number of Components for Multivariate Curve Resolution: Case Study Using Raman Mapping of Pharmaceutical Tablets | |
| Hiscock | Optimization of Forensic Analyses with Latest Generation EDS and EBSD on Multi-Function SEMs |
Legal Events
| Date | Code | Title | Description |
|---|---|---|---|
| PUAI | Public reference made under article 153(3) epc to a published international application that has entered the european phase |
Free format text: ORIGINAL CODE: 0009012 |
|
| 17P | Request for examination filed |
Effective date: 20090127 |
|
| AK | Designated contracting states |
Kind code of ref document: A2 Designated state(s): AT BE BG CH CY CZ DE DK EE ES FI FR GB GR HU IE IS IT LI LT LU LV MC MT NL PL PT RO SE SI SK TR |
|
| AX | Request for extension of the european patent |
Extension state: AL BA HR MK RS |
|
| DAX | Request for extension of the european patent (deleted) | ||
| A4 | Supplementary search report drawn up and despatched |
Effective date: 20161104 |
|
| RIC1 | Information provided on ipc code assigned before grant |
Ipc: G01N 21/31 20060101ALI20161028BHEP Ipc: G01J 3/28 20060101ALI20161028BHEP Ipc: H01J 49/00 20060101ALI20161028BHEP Ipc: G01N 23/225 20060101AFI20161028BHEP |
|
| STAA | Information on the status of an ep patent application or granted ep patent |
Free format text: STATUS: EXAMINATION IS IN PROGRESS |
|
| 17Q | First examination report despatched |
Effective date: 20200203 |
|
| GRAP | Despatch of communication of intention to grant a patent |
Free format text: ORIGINAL CODE: EPIDOSNIGR1 |
|
| STAA | Information on the status of an ep patent application or granted ep patent |
Free format text: STATUS: GRANT OF PATENT IS INTENDED |
|
| INTG | Intention to grant announced |
Effective date: 20220425 |
|
| GRAS | Grant fee paid |
Free format text: ORIGINAL CODE: EPIDOSNIGR3 |
|
| GRAA | (expected) grant |
Free format text: ORIGINAL CODE: 0009210 |
|
| STAA | Information on the status of an ep patent application or granted ep patent |
Free format text: STATUS: THE PATENT HAS BEEN GRANTED |
|
| AK | Designated contracting states |
Kind code of ref document: B1 Designated state(s): AT BE BG CH CY CZ DE DK EE ES FI FR GB GR HU IE IS IT LI LT LU LV MC MT NL PL PT RO SE SI SK TR |
|
| REG | Reference to a national code |
Ref country code: GB Ref legal event code: FG4D |
|
| REG | Reference to a national code |
Ref country code: CH Ref legal event code: EP |
|
| REG | Reference to a national code |
Ref country code: DE Ref legal event code: R096 Ref document number: 602007061577 Country of ref document: DE |
|
| REG | Reference to a national code |
Ref country code: IE Ref legal event code: FG4D |
|
| REG | Reference to a national code |
Ref country code: AT Ref legal event code: REF Ref document number: 1520173 Country of ref document: AT Kind code of ref document: T Effective date: 20221015 |
|
| REG | Reference to a national code |
Ref country code: LT Ref legal event code: MG9D |
|
| PG25 | Lapsed in a contracting state [announced via postgrant information from national office to epo] |
Ref country code: SE Free format text: LAPSE BECAUSE OF FAILURE TO SUBMIT A TRANSLATION OF THE DESCRIPTION OR TO PAY THE FEE WITHIN THE PRESCRIBED TIME-LIMIT Effective date: 20220921 Ref country code: LV Free format text: LAPSE BECAUSE OF FAILURE TO SUBMIT A TRANSLATION OF THE DESCRIPTION OR TO PAY THE FEE WITHIN THE PRESCRIBED TIME-LIMIT Effective date: 20220921 Ref country code: LT Free format text: LAPSE BECAUSE OF FAILURE TO SUBMIT A TRANSLATION OF THE DESCRIPTION OR TO PAY THE FEE WITHIN THE PRESCRIBED TIME-LIMIT Effective date: 20220921 Ref country code: FI Free format text: LAPSE BECAUSE OF FAILURE TO SUBMIT A TRANSLATION OF THE DESCRIPTION OR TO PAY THE FEE WITHIN THE PRESCRIBED TIME-LIMIT Effective date: 20220921 |
|
| REG | Reference to a national code |
Ref country code: AT Ref legal event code: MK05 Ref document number: 1520173 Country of ref document: AT Kind code of ref document: T Effective date: 20220921 |
|
| PG25 | Lapsed in a contracting state [announced via postgrant information from national office to epo] |
Ref country code: GR Free format text: LAPSE BECAUSE OF FAILURE TO SUBMIT A TRANSLATION OF THE DESCRIPTION OR TO PAY THE FEE WITHIN THE PRESCRIBED TIME-LIMIT Effective date: 20221222 |
|
| PG25 | Lapsed in a contracting state [announced via postgrant information from national office to epo] |
Ref country code: RO Free format text: LAPSE BECAUSE OF FAILURE TO SUBMIT A TRANSLATION OF THE DESCRIPTION OR TO PAY THE FEE WITHIN THE PRESCRIBED TIME-LIMIT Effective date: 20220921 Ref country code: PT Free format text: LAPSE BECAUSE OF FAILURE TO SUBMIT A TRANSLATION OF THE DESCRIPTION OR TO PAY THE FEE WITHIN THE PRESCRIBED TIME-LIMIT Effective date: 20230123 Ref country code: ES Free format text: LAPSE BECAUSE OF FAILURE TO SUBMIT A TRANSLATION OF THE DESCRIPTION OR TO PAY THE FEE WITHIN THE PRESCRIBED TIME-LIMIT Effective date: 20220921 Ref country code: CZ Free format text: LAPSE BECAUSE OF FAILURE TO SUBMIT A TRANSLATION OF THE DESCRIPTION OR TO PAY THE FEE WITHIN THE PRESCRIBED TIME-LIMIT Effective date: 20220921 Ref country code: AT Free format text: LAPSE BECAUSE OF FAILURE TO SUBMIT A TRANSLATION OF THE DESCRIPTION OR TO PAY THE FEE WITHIN THE PRESCRIBED TIME-LIMIT Effective date: 20220921 |
|
| PG25 | Lapsed in a contracting state [announced via postgrant information from national office to epo] |
Ref country code: SK Free format text: LAPSE BECAUSE OF FAILURE TO SUBMIT A TRANSLATION OF THE DESCRIPTION OR TO PAY THE FEE WITHIN THE PRESCRIBED TIME-LIMIT Effective date: 20220921 Ref country code: PL Free format text: LAPSE BECAUSE OF FAILURE TO SUBMIT A TRANSLATION OF THE DESCRIPTION OR TO PAY THE FEE WITHIN THE PRESCRIBED TIME-LIMIT Effective date: 20220921 Ref country code: IS Free format text: LAPSE BECAUSE OF FAILURE TO SUBMIT A TRANSLATION OF THE DESCRIPTION OR TO PAY THE FEE WITHIN THE PRESCRIBED TIME-LIMIT Effective date: 20230121 Ref country code: EE Free format text: LAPSE BECAUSE OF FAILURE TO SUBMIT A TRANSLATION OF THE DESCRIPTION OR TO PAY THE FEE WITHIN THE PRESCRIBED TIME-LIMIT Effective date: 20220921 |
|
| REG | Reference to a national code |
Ref country code: DE Ref legal event code: R097 Ref document number: 602007061577 Country of ref document: DE |
|
| P01 | Opt-out of the competence of the unified patent court (upc) registered |
Effective date: 20230520 |
|
| PG25 | Lapsed in a contracting state [announced via postgrant information from national office to epo] |
Ref country code: NL Free format text: LAPSE BECAUSE OF FAILURE TO SUBMIT A TRANSLATION OF THE DESCRIPTION OR TO PAY THE FEE WITHIN THE PRESCRIBED TIME-LIMIT Effective date: 20220921 |
|
| PLBE | No opposition filed within time limit |
Free format text: ORIGINAL CODE: 0009261 |
|
| STAA | Information on the status of an ep patent application or granted ep patent |
Free format text: STATUS: NO OPPOSITION FILED WITHIN TIME LIMIT |
|
| PG25 | Lapsed in a contracting state [announced via postgrant information from national office to epo] |
Ref country code: DK Free format text: LAPSE BECAUSE OF FAILURE TO SUBMIT A TRANSLATION OF THE DESCRIPTION OR TO PAY THE FEE WITHIN THE PRESCRIBED TIME-LIMIT Effective date: 20220921 |
|
| 26N | No opposition filed |
Effective date: 20230622 |
|
| PG25 | Lapsed in a contracting state [announced via postgrant information from national office to epo] |
Ref country code: SI Free format text: LAPSE BECAUSE OF FAILURE TO SUBMIT A TRANSLATION OF THE DESCRIPTION OR TO PAY THE FEE WITHIN THE PRESCRIBED TIME-LIMIT Effective date: 20220921 |
|
| PG25 | Lapsed in a contracting state [announced via postgrant information from national office to epo] |
Ref country code: MC Free format text: LAPSE BECAUSE OF FAILURE TO SUBMIT A TRANSLATION OF THE DESCRIPTION OR TO PAY THE FEE WITHIN THE PRESCRIBED TIME-LIMIT Effective date: 20220921 |
|
| PG25 | Lapsed in a contracting state [announced via postgrant information from national office to epo] |
Ref country code: MC Free format text: LAPSE BECAUSE OF FAILURE TO SUBMIT A TRANSLATION OF THE DESCRIPTION OR TO PAY THE FEE WITHIN THE PRESCRIBED TIME-LIMIT Effective date: 20220921 |
|
| REG | Reference to a national code |
Ref country code: CH Ref legal event code: PL |
|
| REG | Reference to a national code |
Ref country code: BE Ref legal event code: MM Effective date: 20230731 |
|
| PG25 | Lapsed in a contracting state [announced via postgrant information from national office to epo] |
Ref country code: LU Free format text: LAPSE BECAUSE OF NON-PAYMENT OF DUE FEES Effective date: 20230727 |
|
| PG25 | Lapsed in a contracting state [announced via postgrant information from national office to epo] |
Ref country code: LU Free format text: LAPSE BECAUSE OF NON-PAYMENT OF DUE FEES Effective date: 20230727 |
|
| REG | Reference to a national code |
Ref country code: IE Ref legal event code: MM4A |
|
| PG25 | Lapsed in a contracting state [announced via postgrant information from national office to epo] |
Ref country code: CH Free format text: LAPSE BECAUSE OF NON-PAYMENT OF DUE FEES Effective date: 20230731 |
|
| PG25 | Lapsed in a contracting state [announced via postgrant information from national office to epo] |
Ref country code: IT Free format text: LAPSE BECAUSE OF FAILURE TO SUBMIT A TRANSLATION OF THE DESCRIPTION OR TO PAY THE FEE WITHIN THE PRESCRIBED TIME-LIMIT Effective date: 20220921 Ref country code: BE Free format text: LAPSE BECAUSE OF NON-PAYMENT OF DUE FEES Effective date: 20230731 |
|
| PG25 | Lapsed in a contracting state [announced via postgrant information from national office to epo] |
Ref country code: IE Free format text: LAPSE BECAUSE OF NON-PAYMENT OF DUE FEES Effective date: 20230727 |
|
| PG25 | Lapsed in a contracting state [announced via postgrant information from national office to epo] |
Ref country code: IE Free format text: LAPSE BECAUSE OF NON-PAYMENT OF DUE FEES Effective date: 20230727 |
|
| PG25 | Lapsed in a contracting state [announced via postgrant information from national office to epo] |
Ref country code: BG Free format text: LAPSE BECAUSE OF FAILURE TO SUBMIT A TRANSLATION OF THE DESCRIPTION OR TO PAY THE FEE WITHIN THE PRESCRIBED TIME-LIMIT Effective date: 20220921 |
|
| PG25 | Lapsed in a contracting state [announced via postgrant information from national office to epo] |
Ref country code: BG Free format text: LAPSE BECAUSE OF FAILURE TO SUBMIT A TRANSLATION OF THE DESCRIPTION OR TO PAY THE FEE WITHIN THE PRESCRIBED TIME-LIMIT Effective date: 20220921 |
|
| PG25 | Lapsed in a contracting state [announced via postgrant information from national office to epo] |
Ref country code: HU Free format text: LAPSE BECAUSE OF FAILURE TO SUBMIT A TRANSLATION OF THE DESCRIPTION OR TO PAY THE FEE WITHIN THE PRESCRIBED TIME-LIMIT; INVALID AB INITIO Effective date: 20070727 |
|
| PG25 | Lapsed in a contracting state [announced via postgrant information from national office to epo] |
Ref country code: CY Free format text: LAPSE BECAUSE OF FAILURE TO SUBMIT A TRANSLATION OF THE DESCRIPTION OR TO PAY THE FEE WITHIN THE PRESCRIBED TIME-LIMIT; INVALID AB INITIO Effective date: 20070727 |
|
| PGFP | Annual fee paid to national office [announced via postgrant information from national office to epo] |
Ref country code: DE Payment date: 20250616 Year of fee payment: 19 |
|
| PGFP | Annual fee paid to national office [announced via postgrant information from national office to epo] |
Ref country code: GB Payment date: 20250715 Year of fee payment: 19 |
|
| PGFP | Annual fee paid to national office [announced via postgrant information from national office to epo] |
Ref country code: FR Payment date: 20250718 Year of fee payment: 19 |
|
| PG25 | Lapsed in a contracting state [announced via postgrant information from national office to epo] |
Ref country code: TR Free format text: LAPSE BECAUSE OF FAILURE TO SUBMIT A TRANSLATION OF THE DESCRIPTION OR TO PAY THE FEE WITHIN THE PRESCRIBED TIME-LIMIT Effective date: 20220921 |