EP2034439A1 - Method for establishing the saliency map of an image - Google Patents
Method for establishing the saliency map of an image Download PDFInfo
- Publication number
- EP2034439A1 EP2034439A1 EP07301350A EP07301350A EP2034439A1 EP 2034439 A1 EP2034439 A1 EP 2034439A1 EP 07301350 A EP07301350 A EP 07301350A EP 07301350 A EP07301350 A EP 07301350A EP 2034439 A1 EP2034439 A1 EP 2034439A1
- Authority
- EP
- European Patent Office
- Prior art keywords
- image
- maps
- map
- processor unit
- graphics processor
- Prior art date
- Legal status (The legal status is an assumption and is not a legal conclusion. Google has not performed a legal analysis and makes no representation as to the accuracy of the status listed.)
- Withdrawn
Links
Images


Classifications
-
- G—PHYSICS
- G06—COMPUTING OR CALCULATING; COUNTING
- G06T—IMAGE DATA PROCESSING OR GENERATION, IN GENERAL
- G06T7/00—Image analysis
- G06T7/10—Segmentation; Edge detection
-
- G—PHYSICS
- G06—COMPUTING OR CALCULATING; COUNTING
- G06F—ELECTRIC DIGITAL DATA PROCESSING
- G06F18/00—Pattern recognition
- G06F18/20—Analysing
- G06F18/25—Fusion techniques
- G06F18/253—Fusion techniques of extracted features
-
- G—PHYSICS
- G06—COMPUTING OR CALCULATING; COUNTING
- G06V—IMAGE OR VIDEO RECOGNITION OR UNDERSTANDING
- G06V10/00—Arrangements for image or video recognition or understanding
- G06V10/40—Extraction of image or video features
- G06V10/44—Local feature extraction by analysis of parts of the pattern, e.g. by detecting edges, contours, loops, corners, strokes or intersections; Connectivity analysis, e.g. of connected components
- G06V10/443—Local feature extraction by analysis of parts of the pattern, e.g. by detecting edges, contours, loops, corners, strokes or intersections; Connectivity analysis, e.g. of connected components by matching or filtering
- G06V10/449—Biologically inspired filters, e.g. difference of Gaussians [DoG] or Gabor filters
- G06V10/451—Biologically inspired filters, e.g. difference of Gaussians [DoG] or Gabor filters with interaction between the filter responses, e.g. cortical complex cells
- G06V10/454—Integrating the filters into a hierarchical structure, e.g. convolutional neural networks [CNN]
-
- G—PHYSICS
- G06—COMPUTING OR CALCULATING; COUNTING
- G06V—IMAGE OR VIDEO RECOGNITION OR UNDERSTANDING
- G06V10/00—Arrangements for image or video recognition or understanding
- G06V10/40—Extraction of image or video features
- G06V10/46—Descriptors for shape, contour or point-related descriptors, e.g. scale invariant feature transform [SIFT] or bags of words [BoW]; Salient regional features
- G06V10/462—Salient features, e.g. scale invariant feature transforms [SIFT]
-
- G—PHYSICS
- G06—COMPUTING OR CALCULATING; COUNTING
- G06V—IMAGE OR VIDEO RECOGNITION OR UNDERSTANDING
- G06V10/00—Arrangements for image or video recognition or understanding
- G06V10/70—Arrangements for image or video recognition or understanding using pattern recognition or machine learning
- G06V10/77—Processing image or video features in feature spaces; using data integration or data reduction, e.g. principal component analysis [PCA] or independent component analysis [ICA] or self-organising maps [SOM]; Blind source separation
- G06V10/80—Fusion, i.e. combining data from various sources at the sensor level, preprocessing level, feature extraction level or classification level
- G06V10/806—Fusion, i.e. combining data from various sources at the sensor level, preprocessing level, feature extraction level or classification level of extracted features
-
- G—PHYSICS
- G06—COMPUTING OR CALCULATING; COUNTING
- G06V—IMAGE OR VIDEO RECOGNITION OR UNDERSTANDING
- G06V10/00—Arrangements for image or video recognition or understanding
- G06V10/94—Hardware or software architectures specially adapted for image or video understanding
- G06V10/955—Hardware or software architectures specially adapted for image or video understanding using specific electronic processors
-
- G—PHYSICS
- G06—COMPUTING OR CALCULATING; COUNTING
- G06T—IMAGE DATA PROCESSING OR GENERATION, IN GENERAL
- G06T2200/00—Indexing scheme for image data processing or generation, in general
- G06T2200/28—Indexing scheme for image data processing or generation, in general involving image processing hardware
-
- G—PHYSICS
- G06—COMPUTING OR CALCULATING; COUNTING
- G06T—IMAGE DATA PROCESSING OR GENERATION, IN GENERAL
- G06T2207/00—Indexing scheme for image analysis or image enhancement
- G06T2207/20—Special algorithmic details
- G06T2207/20016—Hierarchical, coarse-to-fine, multiscale or multiresolution image processing; Pyramid transform
Definitions
- the invention concerns a method to calculate the saliency map of an image.
- VA Visual attention
- the invention proposes to solve at least one of these drawbacks by using graphic processor units (GPUs) for computing the saliency maps, in order to accelerate the computation of the saliency maps.
- GPUs graphic processor units
- the invention proposes a method for computing a saliency map for an image.
- the method is implemented by a graphics Processor Unit.
- the method comprises a step of calculating a set of feature maps for the intensity, the color and the orientation of the image, said feature maps being calculated in parallel using separate channels of a single Red Green Blue texture of said Graphic Processor Unit for the intensity and the color opponents and using one RGBA texture of said Graphics Processor Unit for the orientation.
- the method comprises the step of pre-computing Gabor filters as Red Green Blue texture of said Graphics Processor Unit.
- the method comprises a step of finding the maximum and minimum values of each feature map, said step being performed using the reduction function of the Graphics Processor Unit.
- the method comprises a step of fusion of the set of feature maps, said fusion steps comprising the sub-steps of:
- M represent the feature map, l ⁇ I ⁇ RG ⁇ BY ; ⁇ ⁇ 0 ⁇ ° , 45 ⁇ ° , 90 ⁇ ° , 135 ⁇ ° and c ⁇ 2 ⁇ 3 ⁇ 4 ;
- the preferred embodiment on the invention is based on Itti's model described in the document L.Itti, C.Koch, and E. Niebur, "A model of saliency based visual attention for rapid scene analysis", IEEE Transactions on Pattern Analysis and Machine Intelligence, vol. 20, no. 11, pp. 1254-1259, Nov 1998 and in Simone Frintrop, "VOCUS: A Visual Attention System for Object Detection and Goal-Directed Search", vol. 3899 of Lecture Notes in Computer Science, Springer, 2006 .
- the image for which a saliency map has to be calculated is loaded by the Graphics Processor Unit (GPU) as a 2 dimensions RGB texture.
- GPU Graphics Processor Unit
- step E1 on figure 2 the input image which salience has to be calculated is resized with its aspect ratio unchanged by drawing a quad in a specific size, typical 640x480, which aims to reduce computations for large images and build a complete image pyramid.
- a rendering pass is activated for color space conversion from RGB to Lab.
- the space is spanned by three axes, as shown in Fig.3 : L represents luminance; a represents the color component between red and green; and b for the component between yellow and blue.
- the result is stored in a multi-channel texture of the GPU with the 16bit floating point format to ensure the precision.
- RGBA texture means a texture format with four color channels: red, green, blue and alpha
- the automatic Mipmap texture generation is further utilized to build the image pyramid P l ( ⁇ ) where l ⁇ ⁇ I,RG,BY ⁇ and ⁇ ⁇ ⁇ 0..8 ⁇ , which is based on bilinear filtering.
- the Gaussian and other filters can also be utilized to build the pyramid by the ping-pong technique.
- the Mipmap method is used due to its simplicity.
- the level of the pyramid can be specified by setting the derivative parameters for Cg texture functions.
- a simple fragment shader is performed to compute center-surrounding differences ⁇ which detects locations that locally stand out from their surroundings, and is implemented as the difference between fine and coarse scales.
- the operation is obtained by interpolation to the finer scale and point-by-point subtraction.
- the signed difference value to account for both on-center and off-center cells in receptive field is used.
- six maps of each feature are yielded to analyze in a multi-scale manner. But each map has separate positive and negative ranges to represent the on/off center responses.
- a step E5 local information of orientations is obtained by applying Gabor filters to the levels of luminance pyramid P I . Since the center-surround differences are already determined implicitly by the gabor filters, three levels c ⁇ ⁇ 2,3,4 ⁇ are chosen from the luminance pyramid P I to be convolved with four orientations filter G ( ⁇ ); ⁇ ⁇ ⁇ 0°,45°,90°,135° ⁇ . Totally twelve maps are generated for analysis of orientations. In this way, all the early visual features are obtained.
- the Gabor filters are always computation intensive.
- the filter kernel size directly impacts the performance. Fortunately, four Gabor filter kernels are pre-computed and stored as a RGBA texture by the GPU. Filters with the size of 5x5 or 7x7 are practical for high speed implementation on the GPU.
- Steps E6 and E7 across-scale additions are performed and the blending function to accumulate all the differences is used.
- each feature map should be able to represent a sparse distribution of a few conspicuous locations over the visual field. These conspicuous spots are taken as informative events.
- the pixels are counted with their values above a certain conspicuous threshold ⁇ , for example 70% of the global maximum.
- ⁇ a certain conspicuous threshold
- the ratio with the number of total pixels in a feature map M yields the approximation of p(M).
- the information quantity I(M) reflects the importance of a corresponding feature map, shown as Equation 3. This information quantity I(M) is used to weight each map during a fusion step.
- p M C pass M i ⁇ j > ⁇ C all M i ⁇ j ;
- I M - log p M
- each of the intensity and color maps implicitly has two separate positive and negative maps, for the on-center and off-center responses. Afterwards, they are combined into three conspicuity maps: ⁇ for intensity, C ⁇ for color and ⁇ for orientation. Before that, a weight function of Equation (5) is given. The global maximum gives the amplitude while I(M) obtained by equation (3) represents the uniqueness of a map. Both of them are used to weight each sub-map. The positive and negative parts are considered separately. In this way, conspicuity maps are combined according to Eq.5, where ⁇ +,- ⁇ , K ⁇ RG , BY ⁇ and ⁇ 0°,45°,90°,135° ⁇ .
- each conspicuity map is weighted according to equation (5) and summed up to the global saliency map S. Since selecting focus of attentions by a WTA (standing for "winner-take-all") network is a sequent process, it is left to the CPU.
- S I I ⁇ * I ⁇ + I C ⁇ * C ⁇ + I O ⁇ * O ⁇
- I() represents the information quantity of each map and is defined in equation (3) above.
- Figure 4 represents the implementation of the method according to the invention using some GPU features, such as query occlusion, reduction.
- the proposed fusion method acts as global nonlinear amplifications but it is more robust and avoids the time-consuming search for every local maxima.
- equation (3) is efficiently implemented by the occlusion query of current GPUs. Furthermore, by splitting the feature map into blocks and analyzing the local statistics, one obtains more accuracy and spatial-context adaptive results.
- the computation for equation (3) is implemented by the occlusion query. This hardware mechanism counts the number of pixels that finally pass through the rendering pipeline. Since the global maxima for each feature maps are obtained, shaders are designed to only allow pixels with their values above a threshold to pass through. By means of the queried number of passed pixels, the computation for I(M) equation (3) is done.
Landscapes
- Engineering & Computer Science (AREA)
- Theoretical Computer Science (AREA)
- Computer Vision & Pattern Recognition (AREA)
- Physics & Mathematics (AREA)
- General Physics & Mathematics (AREA)
- Multimedia (AREA)
- Evolutionary Computation (AREA)
- Artificial Intelligence (AREA)
- Software Systems (AREA)
- Health & Medical Sciences (AREA)
- General Health & Medical Sciences (AREA)
- Life Sciences & Earth Sciences (AREA)
- Molecular Biology (AREA)
- Computing Systems (AREA)
- Medical Informatics (AREA)
- Biodiversity & Conservation Biology (AREA)
- Biomedical Technology (AREA)
- Databases & Information Systems (AREA)
- Data Mining & Analysis (AREA)
- Bioinformatics & Cheminformatics (AREA)
- Bioinformatics & Computational Biology (AREA)
- Evolutionary Biology (AREA)
- General Engineering & Computer Science (AREA)
- Image Analysis (AREA)
- Image Processing (AREA)
Abstract
Description
- The invention concerns a method to calculate the saliency map of an image.
- Visual attention (VA) is an efficient mechanism which selects important visual information for further identification and understanding and filters out redundant parts. It greatly reduces the quantity of input data and gives our ability for rapid analysis and reaction to the complex environment. No doubt, such a mechanism is much superior to any available machine based methods. Therefore, some computational models have been proposed to mimic the biological behavior and the neuronal architecture. They are based on the concept of saliency maps. Due to the effectiveness of attention models, they have found a wide range of applications, including image/video representation and compression, information retrieval, realistic rendering, object detection, robotic control and video adaptation on small-display devices.
- However, the preferred models show several disadvantages. First, intensive computations and high bandwidth requirements lead to low performance of generating saliency maps. Computations in such models are dominated by lots of per-pixel operations, across-scale interpolations and image convolutions; therefore, high computational complexity for imitating biological functions requires massively parallel implementations to obtain fast response. To make the attention model feasible and practical, some applications adopt much simplified version of the biological plausible model, such as giving spatial saliency using color histograms of images, computing contrasts in a small local window and ignoring analysis of orientations.
- On the other hand, some models fail to output an accurate saliency map under some circumstances, that is, the true attention regions cannot be located in an image from the saliency map, as shown on
Figure 1 . This might be further explained by two reasons. First, the model ignores the separate responses from on-center and off-center cells in receptive field. These cells respond to light at the center excitably and inhibitably, respectively. The computations of on-center and off-center differences are combined by taking the absolute value of difference |center - surround|. This approach can lead to an incorrect intensity pop-out, as shown in the top ofFig.1 . There is an image with a gray background and white/black dots on it, both having the same intensity contrast with the background. The on-center cells respond to the white dot, while the off-center cells to the black ones. The white one pops out in human perception, but the saliency map can not yield such pop-out effects since both the black and white dots have the same absolute contrast values. - This issue has been addressed by adding additional maps to handle on-center/off-center responses separately, which requires more computations and memory spaces.
- In practice, the main challenge of the computational models comes from their high computational complexity.
- The invention proposes to solve at least one of these drawbacks by using graphic processor units (GPUs) for computing the saliency maps, in order to accelerate the computation of the saliency maps.
- To this end, the invention proposes a method for computing a saliency map for an image. According to the invention, the method is implemented by a graphics Processor Unit.
- According to a preferred embodiment, the method comprises a step of calculating a set of feature maps for the intensity, the color and the orientation of the image, said feature maps being calculated in parallel using separate channels of a single Red Green Blue texture of said Graphic Processor Unit for the intensity and the color opponents and using one RGBA texture of said Graphics Processor Unit for the orientation.
- According to a preferred embodiment the method comprises the step of pre-computing Gabor filters as Red Green Blue texture of said Graphics Processor Unit.
- According to a preferred embodiment the method comprises a step of finding the maximum and minimum values of each feature map, said step being performed using the reduction function of the Graphics Processor Unit.
- According to a preferred embodiment the method comprises a step of fusion of the set of feature maps, said fusion steps comprising the sub-steps of:
- summing the feature maps according to the following equation:

- Where M represent the feature map,

- obtaining three conspicuity maps according to the following equation:


- obtaining the saliency map of the image by the following equation:

- Other characteristics and advantages of the invention will appear through the description of a non-limiting embodiment of the invention, which will be illustrated, with the help of the enclosed drawings:
-
Figure 1 represents the prior art results, -
Figure 2 represents a preferred embodiment of the invention, -
Figure 3 represents the CIE lab color space, -
Figure 4 represents the implementation of the method with GPUs modules, -
Figure 5 represents the reduction process. - The preferred embodiment on the invention is based on Itti's model described in the document L.Itti, C.Koch, and E. Niebur, "A model of saliency based visual attention for rapid scene analysis", IEEE Transactions on Pattern Analysis and Machine Intelligence, vol. 20, no. 11, pp. 1254-1259, Nov 1998 and in Simone Frintrop, "VOCUS: A Visual Attention System for Object Detection and Goal-Directed Search", vol. 3899 of Lecture Notes in Computer Science, Springer, 2006.
- The image for which a saliency map has to be calculated is loaded by the Graphics Processor Unit (GPU) as a 2 dimensions RGB texture.
- During a step E1 on
figure 2 the input image which salience has to be calculated is resized with its aspect ratio unchanged by drawing a quad in a specific size, typical 640x480, which aims to reduce computations for large images and build a complete image pyramid. - In a step E2, a rendering pass is activated for color space conversion from RGB to Lab. The space is spanned by three axes, as shown in
Fig.3 : L represents luminance; a represents the color component between red and green; and b for the component between yellow and blue. These three values of each pixel are treated as approximations for the intensity I, red-green color opponent RG and blue-yellow opponent BY in the attention model. - The result is stored in a multi-channel texture of the GPU with the 16bit floating point format to ensure the precision.
- The intensity and two color opponents are stored in the separate color channels of a single RGB texture, while the four orientation maps reside in one RGBA texture. In this way, all the channels in one texture can be processed in parallel and benefit from the GPU's vector operations. An RGBA texture means a texture format with four color channels: red, green, blue and alpha
- During a step E3, the automatic Mipmap texture generation is further utilized to build the image pyramid Pl (σ) where l ∈ {I,RG,BY} and σ ∈ {0..8}, which is based on bilinear filtering. The Gaussian and other filters can also be utilized to build the pyramid by the ping-pong technique. In the preferred embodiment, the Mipmap method is used due to its simplicity. The level of the pyramid can be specified by setting the derivative parameters for Cg texture functions.
- In a step E4, a simple fragment shader is performed to compute center-surrounding differences Θ which detects locations that locally stand out from their surroundings, and is implemented as the difference between fine and coarse scales. The operation is obtained by interpolation to the finer scale and point-by-point subtraction.

where c ∈ {2,3,4}; s = c+δ,δ ∈ {3,4}. The signed difference value to account for both on-center and off-center cells in receptive field is used. Then, six maps of each feature are yielded to analyze in a multi-scale manner. But each map has separate positive and negative ranges to represent the on/off center responses. - In a step E5, local information of orientations is obtained by applying Gabor filters to the levels of luminance pyramid PI . Since the center-surround differences are already determined implicitly by the gabor filters, three levels c ∈ {2,3,4} are chosen from the luminance pyramid PI to be convolved with four orientations filter G(θ); θ ∈ {0°,45°,90°,135°}. Totally twelve maps are generated for analysis of orientations. In this way, all the early visual features are obtained.
- The Gabor filters are always computation intensive. The filter kernel size directly impacts the performance. Fortunately, four Gabor filter kernels are pre-computed and stored as a RGBA texture by the GPU. Filters with the size of 5x5 or 7x7 are practical for high speed implementation on the GPU.
- During Steps E6 and E7, across-scale additions are performed and the blending function to accumulate all the differences is used.
- Since different multi-scale feature maps have different visual modalities and dynamic ranges, it is always a difficult problem to combine them into a unique saliency map. Obviously, all the maps have un-equal influences. So it is necessary to determine their corresponding importance. In a step E8, a fusion of all the saliency map is performed.
- Ideally, each feature map should be able to represent a sparse distribution of a few conspicuous locations over the visual field. These conspicuous spots are taken as informative events. According to Shannon's information theory, the information conveyed by an event x is inversely proportional to the likelihood of x being observed.

- To get the probability p(x), the pixels are counted with their values above a certain conspicuous thresholdτ, for example 70% of the global maximum. The ratio with the number of total pixels in a feature map M yields the approximation of p(M). In this way, the information quantity I(M) reflects the importance of a corresponding feature map, shown as Equation 3. This information quantity I(M) is used to weight each map during a fusion step.


- With Cpass the number of pixels having a pixel value higher than the conspicuous thresholdτ , and Call the total number of pixels in the image.
- In our model, different fusion methods are given for different fusion actions. There are three fusion actions:
- 1) multi-scale maps of each feature, defined below in equation (4).
- 2) multiple features in the same modality, such as four orientations, positive and negative parts of the intensity and RG and BY of the color, defined below in equation (5).
- 3) across-modality fusion between intensity, color and orientation, defined below in equation (6).
- Considering their same modality, six center-surrounding difference maps of each I, RG, BY are summed up directly by across-scale addition⊕, same for the three multi-scale maps of each orientation.
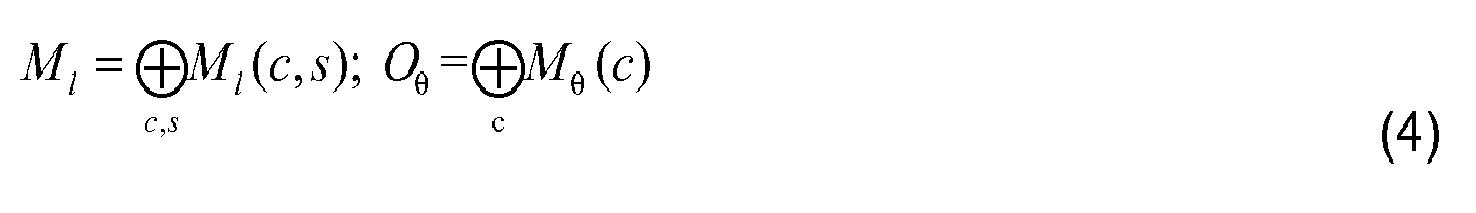
where l ∈ {I,RG,BY}; θ ∈ {0°,45°,90°,135°} and c ∈ {2,3,4}. Then seven feature maps are obtained: one intensity (I), two colors (RG, BY) and four orientations (O). Actually, each of the intensity and color maps implicitly has two separate positive and negative maps, for the on-center and off-center responses. Afterwards, they are combined into three conspicuity maps: Ĩ for intensity, C̃ for color and Õ for orientation. Before that, a weight function of Equation (5) is given. The global maximum gives the amplitude while I(M) obtained by equation (3) represents the uniqueness of a map. Both of them are used to weight each sub-map. The positive and negative parts are considered separately. In this way, conspicuity maps are combined according to Eq.5, where φ∈{+,-}, K∈{RG,BY} and θ∈{0°,45°,90°,135°}. They are further normalized to [0,1] to eliminate modality differences.

- Finally, each conspicuity map is weighted according to equation (5) and summed up to the global saliency map S. Since selecting focus of attentions by a WTA (standing for "winner-take-all") network is a sequent process, it is left to the CPU.

- Where I() represents the information quantity of each map and is defined in equation (3) above.
-
Figure 4 represents the implementation of the method according to the invention using some GPU features, such as query occlusion, reduction. - To some extend, the proposed fusion method acts as global nonlinear amplifications but it is more robust and avoids the time-consuming search for every local maxima. Especially, equation (3) is efficiently implemented by the occlusion query of current GPUs. Furthermore, by splitting the feature map into blocks and analyzing the local statistics, one obtains more accuracy and spatial-context adaptive results.
- Finding the maximum and minimum values of each feature map (equation (5)) is called reduction when using GPU. On GPUs, reductions can be performed by the ping-pong techniques in O(logn) steps. For a two-dimensional reduction, the fragment program reads four elements from four quadrants of the input texture, and the output size is halved in both dimensions at each step, as shown in
Figure 5 . The maxima and minima correspond to the positive and negative parts, respectively. - The computation for equation (3) is implemented by the occlusion query. This hardware mechanism counts the number of pixels that finally pass through the rendering pipeline. Since the global maxima for each feature maps are obtained, shaders are designed to only allow pixels with their values above a threshold to pass through. By means of the queried number of passed pixels, the computation for I(M) equation (3) is done.
Claims (5)
- Method for computing a saliency map for an image characterized in that the method is implemented by a graphics Processor Unit.
- Method according to claim 1 characterized in that it comprises a step of calculating a set of feature maps for the intensity, the color and the orientation of the image, said feature maps being calculated in parallel using separate channels of a single Red Green Blue texture of said Graphics Processor Unit for the intensity and the color opponents and using one RGBA texture of said Graphics Processor Unit for the orientation.
- Method according to claim 2 characterized in that it comprises the step of pre-computing Gabor filters as Red Green Blue texture of said Graphics Processor Unit.
- Method according to one of claims 2 or 3 characterized in that it comprises a step of finding the maximum and minimum values of each feature map, said step being performed using the reduction function of the Graphics Processor Unit.
- Method according to claim 1 characterized in that it comprises a step of fusion of the set of feature maps, said fusion steps comprising the sub-steps of:- summing the feature maps according to the following equation:

Where M represent the feature map, - obtaining three conspicuity maps according to the following equation:where φ∈{+,-}, K∈{RG,BY} and θ∈{0°,45°,90°,135°},


 - obtaining the saliency map of the image by the following equation:Where I() represents the information quantity of each feature map.
Priority Applications (1)
| Application Number | Priority Date | Filing Date | Title |
|---|---|---|---|
| EP07301350A EP2034439A1 (en) | 2007-09-07 | 2007-09-07 | Method for establishing the saliency map of an image |
Applications Claiming Priority (1)
| Application Number | Priority Date | Filing Date | Title |
|---|---|---|---|
| EP07301350A EP2034439A1 (en) | 2007-09-07 | 2007-09-07 | Method for establishing the saliency map of an image |
Publications (1)
| Publication Number | Publication Date |
|---|---|
| EP2034439A1 true EP2034439A1 (en) | 2009-03-11 |
Family
ID=39204793
Family Applications (1)
| Application Number | Title | Priority Date | Filing Date |
|---|---|---|---|
| EP07301350A Withdrawn EP2034439A1 (en) | 2007-09-07 | 2007-09-07 | Method for establishing the saliency map of an image |
Country Status (1)
| Country | Link |
|---|---|
| EP (1) | EP2034439A1 (en) |
Cited By (12)
| Publication number | Priority date | Publication date | Assignee | Title |
|---|---|---|---|---|
| CN102103750A (en) * | 2011-01-07 | 2011-06-22 | 杭州电子科技大学 | Vision significance detection method based on Weber's law and center-periphery hypothesis |
| WO2011121563A1 (en) | 2010-04-01 | 2011-10-06 | Koninklijke Philips Electronics N.V. | Detecting saliency in an image |
| WO2011152893A1 (en) * | 2010-02-10 | 2011-12-08 | California Institute Of Technology | Methods and systems for generating saliency models through linear and/or nonlinear integration |
| US8098886B2 (en) | 2001-03-08 | 2012-01-17 | California Institute Of Technology | Computation of intrinsic perceptual saliency in visual environments, and applications |
| US8907971B2 (en) | 2011-04-08 | 2014-12-09 | Dolby Laboratories Licensing Corporation | Local definition of global image transformations |
| CN105139385A (en) * | 2015-08-12 | 2015-12-09 | 西安电子科技大学 | Image visual saliency region detection method based on deep automatic encoder reconfiguration |
| US9754163B2 (en) | 2015-06-22 | 2017-09-05 | Photomyne Ltd. | System and method for detecting objects in an image |
| US10157480B2 (en) | 2016-06-24 | 2018-12-18 | Microsoft Technology Licensing, Llc | Efficient decoding and rendering of inter-coded blocks in a graphics pipeline |
| CN110533119A (en) * | 2019-09-04 | 2019-12-03 | 北京迈格威科技有限公司 | The training method of index identification method and its model, device and electronic system |
| US10575007B2 (en) | 2016-04-12 | 2020-02-25 | Microsoft Technology Licensing, Llc | Efficient decoding and rendering of blocks in a graphics pipeline |
| US11197010B2 (en) | 2016-10-07 | 2021-12-07 | Microsoft Technology Licensing, Llc | Browser-based video decoder using multiple CPU threads |
| CN114332572A (en) * | 2021-12-15 | 2022-04-12 | 南方医科大学 | A method based on saliency map-guided hierarchical dense feature fusion network for extracting multi-scale fusion feature parameters from ultrasound images of breast lesions |
-
2007
- 2007-09-07 EP EP07301350A patent/EP2034439A1/en not_active Withdrawn
Non-Patent Citations (2)
| Title |
|---|
| ITTI L ET AL: "A MODEL OF SALIENCY-BASED VISUAL ATTENTION FOR RAPID SCENE ANALYSIS", IEEE TRANSACTIONS ON PATTERN ANALYSIS AND MACHINEINTELLIGENCE, IEEE SERVICE CENTER, LOS ALAMITOS, CA, US, vol. 20, no. 11, 1 November 1998 (1998-11-01), pages 1254 - 1259, XP001203933, ISSN: 0162-8828 * |
| LONGHURST PETER ET AL: "A GPU based saliency map for high-fidelity selective rendering", ACM INTERNATIONAL CONFERENCE ON COMPUTER GRAPHICS, VIRTUAL REALITY AND VISUALISATION IN AFRICA, AFRIGAPH '06, vol. 2006, 25 January 2006 (2006-01-25), pages 21 - 29, XP008091559 * |
Cited By (21)
| Publication number | Priority date | Publication date | Assignee | Title |
|---|---|---|---|---|
| US8098886B2 (en) | 2001-03-08 | 2012-01-17 | California Institute Of Technology | Computation of intrinsic perceptual saliency in visual environments, and applications |
| WO2011152893A1 (en) * | 2010-02-10 | 2011-12-08 | California Institute Of Technology | Methods and systems for generating saliency models through linear and/or nonlinear integration |
| US8649606B2 (en) | 2010-02-10 | 2014-02-11 | California Institute Of Technology | Methods and systems for generating saliency models through linear and/or nonlinear integration |
| WO2011121563A1 (en) | 2010-04-01 | 2011-10-06 | Koninklijke Philips Electronics N.V. | Detecting saliency in an image |
| CN102103750B (en) * | 2011-01-07 | 2012-09-19 | 杭州电子科技大学 | Vision significance detection method based on Weber's law and center-periphery hypothesis |
| CN102103750A (en) * | 2011-01-07 | 2011-06-22 | 杭州电子科技大学 | Vision significance detection method based on Weber's law and center-periphery hypothesis |
| US9466098B2 (en) | 2011-04-08 | 2016-10-11 | Dolby Laboratories Licensing Corporation | Local definition of global image transformations |
| US8907971B2 (en) | 2011-04-08 | 2014-12-09 | Dolby Laboratories Licensing Corporation | Local definition of global image transformations |
| US9928418B2 (en) | 2015-06-22 | 2018-03-27 | Photomyne Ltd. | System and method for detecting objects in an image |
| US9754163B2 (en) | 2015-06-22 | 2017-09-05 | Photomyne Ltd. | System and method for detecting objects in an image |
| US10198629B2 (en) | 2015-06-22 | 2019-02-05 | Photomyne Ltd. | System and method for detecting objects in an image |
| US10452905B2 (en) | 2015-06-22 | 2019-10-22 | Photomyne Ltd. | System and method for detecting objects in an image |
| CN105139385A (en) * | 2015-08-12 | 2015-12-09 | 西安电子科技大学 | Image visual saliency region detection method based on deep automatic encoder reconfiguration |
| CN105139385B (en) * | 2015-08-12 | 2018-04-17 | 西安电子科技大学 | Image vision salient region detection method based on the reconstruct of deep layer autocoder |
| US10575007B2 (en) | 2016-04-12 | 2020-02-25 | Microsoft Technology Licensing, Llc | Efficient decoding and rendering of blocks in a graphics pipeline |
| US10157480B2 (en) | 2016-06-24 | 2018-12-18 | Microsoft Technology Licensing, Llc | Efficient decoding and rendering of inter-coded blocks in a graphics pipeline |
| US11197010B2 (en) | 2016-10-07 | 2021-12-07 | Microsoft Technology Licensing, Llc | Browser-based video decoder using multiple CPU threads |
| CN110533119A (en) * | 2019-09-04 | 2019-12-03 | 北京迈格威科技有限公司 | The training method of index identification method and its model, device and electronic system |
| CN110533119B (en) * | 2019-09-04 | 2022-12-27 | 北京迈格威科技有限公司 | Identification recognition method, model training method and device thereof, and electronic system |
| CN114332572A (en) * | 2021-12-15 | 2022-04-12 | 南方医科大学 | A method based on saliency map-guided hierarchical dense feature fusion network for extracting multi-scale fusion feature parameters from ultrasound images of breast lesions |
| CN114332572B (en) * | 2021-12-15 | 2024-03-26 | 南方医科大学 | Method for extracting breast lesion ultrasonic image multi-scale fusion characteristic parameters based on saliency map-guided hierarchical dense characteristic fusion network |
Similar Documents
| Publication | Publication Date | Title |
|---|---|---|
| EP2034439A1 (en) | Method for establishing the saliency map of an image | |
| CN108229490B (en) | Key point detection method, neural network training method, device and electronic equipment | |
| CN113743417B (en) | Semantic segmentation method and semantic segmentation device | |
| CN113822209A (en) | Hyperspectral image recognition method and device, electronic equipment and readable storage medium | |
| WO2023193400A1 (en) | Point cloud detection and segmentation method and apparatus, and electronic device | |
| US11875486B2 (en) | Image brightness statistical method and imaging device | |
| CN111160114B (en) | Gesture recognition method, gesture recognition device, gesture recognition equipment and computer-readable storage medium | |
| CN113822352B (en) | Infrared dim target detection method based on multi-feature fusion | |
| CN113822951A (en) | Image processing method, image processing device, electronic equipment and storage medium | |
| CN113807354A (en) | Image semantic segmentation method, device, equipment and storage medium | |
| CN118941795A (en) | Medical image segmentation method based on fusion of 3D depthwise separable convolution and EAM module | |
| CN109977834B (en) | Method and device for segmenting human hand and interactive object from depth image | |
| CN112766012B (en) | Two-dimensional code image recognition method and device, electronic equipment and storage medium | |
| CN116486394B (en) | Label text detection method based on multistage separation feature enhancement and spatial attention | |
| CN111179270A (en) | Image co-segmentation method and device based on attention mechanism | |
| CN115984583B (en) | Data processing method, apparatus, computer device, storage medium, and program product | |
| US12412080B2 (en) | Method and apparatus for forward computation of neural network, and computer-readable storage medium | |
| CN115187790A (en) | An Image Contour Extraction Method Based on the Binarization Results of Reference Regions | |
| CN119205911B (en) | A method and device for directly regressing the 6D pose of an object based on image joint attention | |
| CN114004751B (en) | Image processing method and related equipment thereof | |
| Han et al. | High speed visual saliency computation on gpu | |
| US20240203081A1 (en) | Processing method for image recognition model and related product | |
| CN116740375A (en) | An image feature extraction method, system and medium | |
| CN112001479B (en) | Processing method and system based on deep learning model and electronic equipment | |
| CN115648215A (en) | Grasping Detection Method for Service Robots Based on Attention Mechanism and Siamese Deconvolution |
Legal Events
| Date | Code | Title | Description |
|---|---|---|---|
| PUAI | Public reference made under article 153(3) epc to a published international application that has entered the european phase |
Free format text: ORIGINAL CODE: 0009012 |
|
| AK | Designated contracting states |
Kind code of ref document: A1 Designated state(s): AT BE BG CH CY CZ DE DK EE ES FI FR GB GR HU IE IS IT LI LT LU LV MC MT NL PL PT RO SE SI SK TR |
|
| AX | Request for extension of the european patent |
Extension state: AL BA HR MK RS |
|
| AKX | Designation fees paid | ||
| REG | Reference to a national code |
Ref country code: DE Ref legal event code: 8566 |
|
| STAA | Information on the status of an ep patent application or granted ep patent |
Free format text: STATUS: THE APPLICATION IS DEEMED TO BE WITHDRAWN |
|
| RAP1 | Party data changed (applicant data changed or rights of an application transferred) |
Owner name: THOMSON LICENSING |
|
| 18D | Application deemed to be withdrawn |
Effective date: 20090912 |