EP2008118B1 - Separation of metabolites with chemical shift imaging - Google Patents
Separation of metabolites with chemical shift imaging Download PDFInfo
- Publication number
- EP2008118B1 EP2008118B1 EP07775747A EP07775747A EP2008118B1 EP 2008118 B1 EP2008118 B1 EP 2008118B1 EP 07775747 A EP07775747 A EP 07775747A EP 07775747 A EP07775747 A EP 07775747A EP 2008118 B1 EP2008118 B1 EP 2008118B1
- Authority
- EP
- European Patent Office
- Prior art keywords
- recited
- nmr
- signal
- pulse sequence
- metabolite
- Prior art date
- Legal status (The legal status is an assumption and is not a legal conclusion. Google has not performed a legal analysis and makes no representation as to the accuracy of the status listed.)
- Active
Links
Images


Classifications
-
- G—PHYSICS
- G01—MEASURING; TESTING
- G01R—MEASURING ELECTRIC VARIABLES; MEASURING MAGNETIC VARIABLES
- G01R33/00—Arrangements or instruments for measuring magnetic variables
- G01R33/20—Arrangements or instruments for measuring magnetic variables involving magnetic resonance
- G01R33/44—Arrangements or instruments for measuring magnetic variables involving magnetic resonance using nuclear magnetic resonance [NMR]
- G01R33/48—NMR imaging systems
- G01R33/483—NMR imaging systems with selection of signals or spectra from particular regions of the volume, e.g. in vivo spectroscopy
- G01R33/485—NMR imaging systems with selection of signals or spectra from particular regions of the volume, e.g. in vivo spectroscopy based on chemical shift information [CSI] or spectroscopic imaging, e.g. to acquire the spatial distributions of metabolites
-
- G—PHYSICS
- G01—MEASURING; TESTING
- G01R—MEASURING ELECTRIC VARIABLES; MEASURING MAGNETIC VARIABLES
- G01R33/00—Arrangements or instruments for measuring magnetic variables
- G01R33/20—Arrangements or instruments for measuring magnetic variables involving magnetic resonance
- G01R33/44—Arrangements or instruments for measuring magnetic variables involving magnetic resonance using nuclear magnetic resonance [NMR]
- G01R33/48—NMR imaging systems
- G01R33/4818—MR characterised by data acquisition along a specific k-space trajectory or by the temporal order of k-space coverage, e.g. centric or segmented coverage of k-space
- G01R33/4824—MR characterised by data acquisition along a specific k-space trajectory or by the temporal order of k-space coverage, e.g. centric or segmented coverage of k-space using a non-Cartesian trajectory
-
- G—PHYSICS
- G01—MEASURING; TESTING
- G01R—MEASURING ELECTRIC VARIABLES; MEASURING MAGNETIC VARIABLES
- G01R33/00—Arrangements or instruments for measuring magnetic variables
- G01R33/20—Arrangements or instruments for measuring magnetic variables involving magnetic resonance
- G01R33/44—Arrangements or instruments for measuring magnetic variables involving magnetic resonance using nuclear magnetic resonance [NMR]
- G01R33/48—NMR imaging systems
- G01R33/54—Signal processing systems, e.g. using pulse sequences ; Generation or control of pulse sequences; Operator console
- G01R33/56—Image enhancement or correction, e.g. subtraction or averaging techniques, e.g. improvement of signal-to-noise ratio and resolution
- G01R33/5601—Image enhancement or correction, e.g. subtraction or averaging techniques, e.g. improvement of signal-to-noise ratio and resolution involving use of a contrast agent for contrast manipulation, e.g. a paramagnetic, super-paramagnetic, ferromagnetic or hyperpolarised contrast agent
-
- G—PHYSICS
- G01—MEASURING; TESTING
- G01R—MEASURING ELECTRIC VARIABLES; MEASURING MAGNETIC VARIABLES
- G01R33/00—Arrangements or instruments for measuring magnetic variables
- G01R33/20—Arrangements or instruments for measuring magnetic variables involving magnetic resonance
- G01R33/44—Arrangements or instruments for measuring magnetic variables involving magnetic resonance using nuclear magnetic resonance [NMR]
- G01R33/48—NMR imaging systems
- G01R33/54—Signal processing systems, e.g. using pulse sequences ; Generation or control of pulse sequences; Operator console
- G01R33/56—Image enhancement or correction, e.g. subtraction or averaging techniques, e.g. improvement of signal-to-noise ratio and resolution
- G01R33/561—Image enhancement or correction, e.g. subtraction or averaging techniques, e.g. improvement of signal-to-noise ratio and resolution by reduction of the scanning time, i.e. fast acquiring systems, e.g. using echo-planar pulse sequences
- G01R33/5613—Generating steady state signals, e.g. low flip angle sequences [FLASH]
Definitions
- the field of the invention is nuclear magnetic resonance imaging methods and systems. More particularly, the invention relates to the in vivo imaging of metabolites using paramagnetic labels such as hyperpolarized carbon-13.
- polarizing field B 0 When a substance such as human tissue is subjected to a uniform magnetic field (polarizing field B 0 ), the individual magnetic moments of the spins in the tissue attempt to align with this polarizing field, but precess about it in random order at their characteristic Larmor frequency. If the substance, or tissue, is subjected to a magnetic field (excitation field B 1 ) which is in the x-y plane and which is near the Larmor frequency, the net aligned moment, Mz, may be rotated, or "tipped", into the x-y plane to produce a net transverse magnetic moment Mt. A signal is emitted by the excited spins after the excitation signal B 1 is terminated, this signal may be received and processed to form an image.
- excitation field B 1 which is in the x-y plane and which is near the Larmor frequency
- magnetic field gradients (G x . G y and G z ) are employed.
- the region to be imaged is scanned by a sequence of measurement cycles in which these gradients vary according to the particular localization method being used.
- the resulting set of received NMR signals are digitized and processed to reconstruct the image using one of many well known reconstruction techniques.
- IDEAL Magnetic Resonance Imaging With Fat-Water Signal Separation
- the IDEAL method employs pulse sequences to acquire multiple images at different echo times (TE) and an iterative, linear least squares approach to estimate the separate water and fat signal components.
- TE echo times
- the advantage of the IDEAL method is if the frequencies of the particular metabolites being imaged are known, the number of different echo time repetitions can be significantly reduced. This "a priori" information shortens scan time and enables more pulse sequence repetitions to be devoted to increased image resolution.
- s k ⁇ w ⁇ e j ⁇ ⁇ w + ⁇ f ⁇ e j ⁇ ⁇ f + ⁇ k ⁇ e j ⁇ ⁇ ⁇ ⁇ k + ⁇ .
- the present invention is defined in claim 1 and concerns a method for producing an MR image of a metabolite where the frequencies of the peak NMR signals produced by the metabolite are known and the relative values of the plurality of NMR peak signals produced by the metabolite are known.
- the NMR signal can be modeled with an equation of relatively few unknowns.
- a corresponding relatively few MR images are acquired of the subject and from this acquired NMR image data and the equation, the signal components corresponding to the metabolite peak signals may be calculated and used to produce a metabolite image.
- the echo time (TE) is shifted in each of the acquired NMR images and the optimal echo time shift is determined to increase SNR of the measurement.
- Fig. 1 is a block diagram of an MRI system which employs the present invention
- Fig. 2 is a graphic representation of the spectra produced by C-13 labeled pyruvate and its metabolites
- Fig. 3 is a graphic representation of a preferred pulse sequence used to direct the operation of the MRI system of Fig. 1 ;
- Fig. 4 is a graphic representation of the NSA plot for the metabolites of Fig. 2 ;
- Fig. 5 is a flow chart illustrating the steps used to practice the preferred embodiment of the invention.
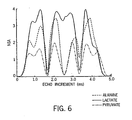
- Fig. 6 is a graphic representation of the NSA plot of the metabolites of Fig. 2 in a four echo acquisition.
- the present invention enables the spectrum of a metabolite such as C-13 labeled pyruvate and its metabolites lactate and alanine to be efficiently produced when a priori information is known about the metabolites. More specifically, when the frequency of each peak in the metabolite NMR signal is known, this information can be used to substantially reduce the amount of NMR data that needs to be acquired to produce an image of the metabolite. In addition, where a single metabolite produces more than one signal peak, available a priori knowledge about the relative areas of the multiple signal peaks may also be used to substantially reduce the amount of NMR data that needs to be acquired.
- a priori knowledge about the relative areas of the multiple signal peaks may also be used to substantially reduce the amount of NMR data that needs to be acquired.
- s t n P A ⁇ e i ⁇ 2 ⁇ ⁇ ⁇ f A ⁇ t n + P L ⁇ e i ⁇ 2 ⁇ ⁇ ⁇ f L ⁇ t n + P P ⁇ r P ⁇ 1 ⁇ e i ⁇ 2 ⁇ ⁇ ⁇ f P ⁇ 1 ⁇ t n + r P ⁇ 2 ⁇ e i ⁇ 2 ⁇ ⁇ ⁇ f P ⁇ 2 ⁇ t n ⁇ e i ⁇ 2 ⁇ ⁇ ⁇ t n ⁇ e i ⁇ 2 ⁇ ⁇ ⁇ t n
- P A , P L and P P are the total signal contributions from alanine, lac
- the outer phase term in equation (1) results from the local polarizing magnetic field inhomogeneity ( ⁇ ) and this must be removed from the signals S(t n ) before they can be used to compute the metabolite levels.
- the field inhomogeneity term ⁇ can be estimated from the acquired signals S(t n ) using an iterative method as described by Reeder et al, MRM, 51(1):123-30, 2004 . With this approach at least four signals S(t n ) must be acquired in order to solve for the four unknowns (P A , P L , P P . ⁇ ).
- the inhomogeneity ( ⁇ ) can be calculated from a proton density ( 1 H) calibration image that is separately acquired and used to produce a B 0 field inhomogeneity map.
- ⁇ is determined by the separate proton density image acquisition.
- This map indicates the field inhomogeneity ⁇ at each image pixel in terms of a shift in the Larmor frequency from the nominal Larmor frequency.
- the phase created by the field ihhomogeneity is demodulated from the acquired NMR signals S(t n ) by multiplying the signal S(t n ) by a phase term e -i2n ⁇ tn to remove the effects of B 0 field inhomogeneities.
- NSA effective number of signal averages
- the NSA values can be calculated for different echo shifts in order to maximize the NSA for some or all the metabolites, determining the optimum echo spacing that will maximize noise performance.
- Fig. 4 shows the NSA performance for three equally spaced echoes for the case where the field map ( ⁇ ) is known or measured using an external calibration. From this plot, it can be determined that an echo spacing of approximately 1.0ms will provide excellent NSA for all three metabolites. This is one possible echo combination that will provide good noise performance for the decomposition of the three species, however other combinations of echoes, including unequally spaced echoes can be used for this form of optimization.
- More than three echoes can also be used to decompose the three species. Not all pulse sequences are sufficiently flexible in their timing to achieve the optimal echo spacing, for example, 1.0ms. For this reason it may be advantageous to acquire more than 3 echoes, in order to match the capabilities of the pulse sequence with an optimal echo combination. For example, Fig. 6 plots the NSA for the same decomposition using 4 echoes. An optimal spacing occurs at spacings of 1.4ms or 2.1 ms. Thus, if a pulse sequence is unable to achieve an echo spacing of 1.0ms for performing the preferred 3 echo decomposition, it might be advantageous to perform a four echo acquisition using an echo spacing 1.4ms or 2.1 ms.
- the MRI system includes a workstation 10 having a display 12 and a keyboard 14.
- the workstation 10 includes a processor 16 which is a commercially available programmable machine running a commercially available operating system.
- the workstation 10 provides the operator interface which enables scan prescriptions to be entered into the MRI system.
- the workstation 10 is coupled to four servers: a pulse sequence server 18; a data acquisition server 20; a data processing server 22, and a data store server 23.
- the data store server 23 is performed by the workstation processor 16 and associated disc drive interface circuitry.
- the remaining three servers 18, 20 and 22 are performed by separate processors mounted in a single enclosure and interconnected using a 64-bit backplane bus.
- the pulse sequence server 18 employs a commercially available microprocessor and a commercially available quad communication controller.
- the data acquisition server 20 and data processing server 22 both employ the same commercially available microprocessor and the data processing server 22 further includes one or more array processors based on commercially available parallel vector processors.
- the workstation 10 and each processor for the servers 18, 20 and 22 are connected to a serial communications network.
- This serial network conveys data that is downloaded to the servers 18, 20 and 22 from the workstation 10 and it conveys tag data that is communicated between the servers and between the workstation and the servers.
- a high speed data link is provided between the data processing server 22 and the workstation 10 in order to convey image data to the data store server 23.
- the pulse sequence server 18 functions in response to program elements downloaded from the workstation 10 to operate a gradient system 24 and an RF system 26. Gradient waveforms necessary to perform the prescribed scan are produced and applied to the gradient system 24 which excites gradient coils in an assembly 28 to produce the magnetic field gradients G x , G y and G z used for position encoding NMR signals.
- the gradient coil assembly 28 forms part of a magnet assembly 30 which includes a polarizing magnet 32 and a whole-body RF coil 34.
- a 3.0 Tesla scanner sold by General Electric under the trademark "SIGNA" is employed.
- RF excitation waveforms are applied to the RF coil 34 by the RF system 26 to perform the prescribed magnetic resonance pulse sequence.
- Responsive NMR signals detected by the RF coil 34 are received by the RF system 26, amplified, demodulated, filtered and digitized under direction of commands produced by the pulse sequence server 18.
- the RF system 26 includes an RF transmitter for producing a wide variety of RF pulses used in MR pulse sequences.
- the RF transmitter is responsive to the scan prescription and direction from the pulse sequence server 18 to produce RF pulses of the desired frequency, phase and pulse amplitude waveform.
- the generated RF pulses may be applied to the whole body RF coil 34 or to one or more local coils or coil arrays.
- the RF system 26 also includes one or more RF receiver channels.
- Each RF receiver channel includes an RF amplifier that amplifies the NMR signal received by the coil to which it is connected and a quadrature detector which detects and digitizes the I and Q quadrature components of the received NMR signal.
- a dual-tuned, proton-carbon transmit and receive local coil is employed such as that described in U.S. Pat. No. 4,799,016 entitled "Dual Frequency NMR Surface Coil.”
- the pulse sequence server 18 also optionally receives patient data from a physiological acquisition controller 36.
- the controller 36 receives signals from a number of different sensors connected to the patient, such as ECG signals from electrodes or respiratory signals from a bellows. Such signals are typically used by the pulse sequence server 18 to synchronize, or "gate", the performance of the scan with the subject's respiration or heart beat.
- the pulse sequence server 18 also connects to a scan room interface circuit 38 which receives signals from various sensors associated with the condition of the patient and the magnet system. It is also through the scan room interface circuit 38 that a patient positioning system 40 receives commands to move the patient to desired positions during the scan.
- the pulse sequence server 18 performs real-time control of MRI system elements during a scan. As a result, it is necessary that its hardware elements be operated with program instructions that are executed in a timely manner by run-time programs.
- the description components for a scan prescription are downloaded from the workstation 10 in the form of objects.
- the pulse sequence server 18 contains programs which receive these objects and converts them to objects that are employed by the run-time programs.
- the digitized NMR signal samples produced by the RF system 26 are received by the data acquisition server 20.
- the data acquisition server 20 operates in response to description components downloaded from the workstation 10 to receive the real-time NMR data and provide buffer storage such that no data is lost by data overrun. In some scans the data acquisition server 20 does little more than pass the acquired NMR data to the data processor server 22. However, in scans which require information derived from acquired NMR data to control the further performance of the scan, the data acquisition server 20 is programmed to produce such information and convey it to the pulse sequence server 18. For example, during prescans NMR data is acquired and used to calibrate the pulse sequence performed by the pulse sequence server 18.
- navigator signals may be acquired during a scan and used to adjust RF or gradient system operating parameters or to control the view order in which k-space is sampled.
- the data acquisition server 20 may be employed to process NMR signals used to detect the arrival of contrast agent in an MRA scan. In all these examples the data acquisition server 20 acquires NMR data and processes it in real-time to produce information which is used to control the scan.
- the data processing server 22 receives NMR data from the data acquisition server 20 and processes it in accordance with description components downloaded from the workstation 10. Such processing include Fourier transformation of raw k-space NMR data to produce two or three-dimensional images; the application of filters to a reconstructed image and the reconstruction of the metabolic images according to the present invention.
- Images reconstructed by the data processing server 22 are conveyed back to the workstation 10 where they are stored.
- Real-time images are stored in a data base memory cache (not shown) from which they may be output to operator display 12 or a display 42 which is located near the magnet assembly 30 for use by attending physicians.
- Batch mode images or selected real time images are stored in a host database on disc storage 44.
- the data processing server 22 notifies the data store server 23 on the workstation 10.
- the workstation 10 may be used by an operator to archive the images, produce films, or send the images via a network to other facilities.
- a pulse sequence as shown in Fig. 3 which uses the steady state free precision (SSFP) principle. It includes a selective rf excitation pulse 50 that is repeated at the start of each TR period as well as a slice select gradient pulse 52 that is produced concurrently with the rf pulse 50 to produce transverse magnetization in a prescribed slice. After excitation of the spins in the slice a phase encoding gradient pulse 54 is applied to position encode the NMR signal 56 along one direction in the slice. A readout gradient pulse 58 is also applied after a dephasing gradient lobe 60 to position encode the NMR signal 56 along a second, orthogonal direction in the slice.
- SSFP steady state free precision
- the NMR signal 56 is sampled during a data acquisition window 62. To maintain the steady state condition, the integrals of the three gradients each sum to zero. To accomplish this rephrasing lobes 64 are added to the slice select gradient waveform, a rephrasing lobe 66 is added to the readout gradient waveform and a rewinder gradient lobe 68 is added to the phase encoding gradient waveform. As is well known in the art, the pulse sequence is repeated and the amplitude of the phase encoding gradient 54 and its equal, but opposite rewinder 68 are stepped through a set of values to sample 2D k-space in a prescribed manner. As will be explained in more detail below, each slice is acquired three or more times and the echo time TE increment is set to 1.0ms during successive acquisitions.
- the first step in performing a C-13 metabolite scan is to prepare the subject as indicated at process block 100.
- This includes injection of nonhyperpolarized or hyperpolarized C-13 labeled pyruvate from a suitable source such as a polarizer device.
- a scan is then conducted with the above MRI system using the above described pulse sequence to acquire spectroscopic image data as indicated at process block 102.
- Three images at three different echo times TE are acquired at each prescribed slice location. This provides sufficient information when combined with a prior information concerning the metabolite signal to produce images of the metabolites alanine, lactate and pyruvate.
- the next step is to reconstruct the three images at each slice location. This is done in the usual manner by performing a two-dimensional, complex Fourier transformation of the acquired k-space data. As a result, three NMR signals S(t TE1 ), S(t TE2 ) and S(t TE3 ) are produced for each pixel location in each slice.
- a field map ( ⁇ ) is produced next as indicated at process block 106. As indicated above, this can be done by either using an iterative method described by S.B. Reeder et al in "Multicoil Dixon Chemical Species Separation With An Iterative Least-Squares Estimation Method", MRM, 51:35-45 (2004 ), or a separate scan can be performed to acquire a proton calibration image from which the phase error ⁇ is determined at each image pixel as discussed above. The phase shifts caused by inhomogeneities in the scanner polarizing magnetic field are then demodulated from the images as described above and indicated at process block 108.
- the metabolite component of the signals at each slice image pixel is then calculated using the corrected image signals S(t TE1 ), S(t TE2 ) and S(t TE3 ) and the above equation (3).
- the values of the metabolite signals ⁇ A , ⁇ L and ⁇ P are thus calculated at each slice image pixel.
- These can be displayed as separate metabolite images as indicated at process block 112, or the three separate metabolite images can be combined into a single image with different color coding for each metabolite. It is also possible to acquire during the scan a proton image and reconstruct a high resolution anatomical image of each slice.
- the metabolite image or images may be registered and displayed in color with the anatomical image forming a black and white background.
- pulse sequences can be used to acquire the NMR data and different image reconstruction methods can be used.
- a pulse sequence that samples k-space along a radial path can be used and the images reconstructed using a backprojection technique.
- other metabolites may be imaged using the present invention where sufficient a priori information is known about the frequency of their NMR signal peaks and the relative values of their multiple peaks.
- Equation 1 The decomposition described in Equations 1-3 is preferably performed in image space. So long as the field map ( ⁇ ) can be ignored or has been demodulated from the source data, the signal, as described in Equation 1 is a linear system, which will also hold after Fourier transformation into k-space. This permits separation of the k-space signals of the chemical species into separate data matrices. After separation of the k-space data, the Fourier transform is performed to yield images of each metabolite. In general, however, it is more convenient to perform calculations in image space if the field map (which makes Equation 1 a non-linear equation) is non-zero, creating position dependent phase shifts.
Landscapes
- Physics & Mathematics (AREA)
- Spectroscopy & Molecular Physics (AREA)
- High Energy & Nuclear Physics (AREA)
- Condensed Matter Physics & Semiconductors (AREA)
- General Physics & Mathematics (AREA)
- Optics & Photonics (AREA)
- Magnetic Resonance Imaging Apparatus (AREA)
Abstract
Description
- The field of the invention is nuclear magnetic resonance imaging methods and systems. More particularly, the invention relates to the in vivo imaging of metabolites using paramagnetic labels such as hyperpolarized carbon-13.
- When a substance such as human tissue is subjected to a uniform magnetic field (polarizing field B0), the individual magnetic moments of the spins in the tissue attempt to align with this polarizing field, but precess about it in random order at their characteristic Larmor frequency. If the substance, or tissue, is subjected to a magnetic field (excitation field B1) which is in the x-y plane and which is near the Larmor frequency, the net aligned moment, Mz, may be rotated, or "tipped", into the x-y plane to produce a net transverse magnetic moment Mt. A signal is emitted by the excited spins after the excitation signal B1 is terminated, this signal may be received and processed to form an image.
- When utilizing these signals to produce images, magnetic field gradients (Gx. Gy and Gz) are employed. Typically, the region to be imaged is scanned by a sequence of measurement cycles in which these gradients vary according to the particular localization method being used. The resulting set of received NMR signals are digitized and processed to reconstruct the image using one of many well known reconstruction techniques.
- The advent of hyperpolarized (carbon-13) has spurred interest in imaging with this isotope in a variety of in vivo applications such as vascular imaging (MRA) and metabolic flux. One of these is C-13 labeled pyruvate and its metabolites (lactate and alanine), which are of particular interest in oncology applications. The NMR spectrum of these three metabolites is relatively sparse, making them well suited for chemical shift based imaging methods such as those commonly used to separately image water and fat. As shown in
Fig. 2 , these metabolites have a single peak for lactate (Lac), a single peak for alanine (AL) and two peaks for pyruvate (PE and Pyr). In a 3 Tesla polarizing field the chemical frequency shift of alanine is approximately -242Hz relative to lactate, pyruvate has a main peak at approximately -622Hz and a pyruvate ester peak lies at approximately -242Hz relative to lactate. - The usual method for imaging these C-13 isotopes uses an echo planar spectroscopic imaging technique that requires the acquisition of large amounts of data. In order to resolve the spectral peaks for AL and PE it is necessary to acquire 64 NMR signal at different echo times. A large amount of data is needed to obtain the needed "spectral resolution" when a Fourier transformation is performed on the data to produce a spectrum. Because of the large amount of data that is acquired, a difficult choice between shorter scan time and higher spatial resolution is usually required.
- Recently, a new method known as IDEAL was developed for imaging spin species such as fat and water. As described in
U.S. Pat. No. 6,856,134 B1 issued on February 15, 2005 and entitled "magnetic Resonance Imaging With Fat-Water Signal Separation", the IDEAL method employs pulse sequences to acquire multiple images at different echo times (TE) and an iterative, linear least squares approach to estimate the separate water and fat signal components. The advantage of the IDEAL method is if the frequencies of the particular metabolites being imaged are known, the number of different echo time repetitions can be significantly reduced. This "a priori" information shortens scan time and enables more pulse sequence repetitions to be devoted to increased image resolution. - Pineda A. R. et al: "Cramer-Rao Bounds for Three-Point Decomposition of Water and Fat" (MAGNETIC RESONANCE IN MEDICINE Wiley USA, vol. 54, no. 3, Sept. 2005) deal with the optimization of the choice of echo time shifts to minimize the variance of the estimates of the water and fat magnitude and phase as well as the field map. Therefore, the Cramer-Rao bound is used. The analysis shows that the noise properties not only depend on the choice of echo time shifts but also on the amount of fat and water in each voxel and their alignment to the echo. The underlying signal model for one voxel is given by

- This method was also suggested to be applied to metabolites other than fat and water in the International patent application
WO 2006/011810 A2 and Europeanpatent application EP 1 574 874 A1 . - The present invention is defined in
claim 1 and concerns a method for producing an MR image of a metabolite where the frequencies of the peak NMR signals produced by the metabolite are known and the relative values of the plurality of NMR peak signals produced by the metabolite are known. Using this a priori information the NMR signal can be modeled with an equation of relatively few unknowns. A corresponding relatively few MR images are acquired of the subject and from this acquired NMR image data and the equation, the signal components corresponding to the metabolite peak signals may be calculated and used to produce a metabolite image. The echo time (TE) is shifted in each of the acquired NMR images and the optimal echo time shift is determined to increase SNR of the measurement. -
Fig. 1 is a block diagram of an MRI system which employs the present invention; -
Fig. 2 is a graphic representation of the spectra produced by C-13 labeled pyruvate and its metabolites; -
Fig. 3 is a graphic representation of a preferred pulse sequence used to direct the operation of the MRI system ofFig. 1 ; -
Fig. 4 is a graphic representation of the NSA plot for the metabolites ofFig. 2 ; -
Fig. 5 is a flow chart illustrating the steps used to practice the preferred embodiment of the invention; and -
Fig. 6 is a graphic representation of the NSA plot of the metabolites ofFig. 2 in a four echo acquisition. - The present invention enables the spectrum of a metabolite such as C-13 labeled pyruvate and its metabolites lactate and alanine to be efficiently produced when a priori information is known about the metabolites. More specifically, when the frequency of each peak in the metabolite NMR signal is known, this information can be used to substantially reduce the amount of NMR data that needs to be acquired to produce an image of the metabolite. In addition, where a single metabolite produces more than one signal peak, available a priori knowledge about the relative areas of the multiple signal peaks may also be used to substantially reduce the amount of NMR data that needs to be acquired.
- As shown in
Fig. 2 , the frequencies of the C-13 labeled pyruvate metabolites are known, as is the relative areas of the two pyruvate peaks PE and Pyr. The NMR signal from a voxel containing these three species measured at an echo time tn is then expressed as follows:
where: PA, PL and PP are the total signal contributions from alanine, lactate and pyruvate respectively; fA, fL, fP1 and fP2 are the resonant frequencies of alanine, lactate, the main pyruvate peak and pyruvate ester peak; and rP1 and rP2 are the relative fractions of total signal from the two pyruvate peaks (rP1 + rP2 = 1.0). - The outer phase term in equation (1) results from the local polarizing magnetic field inhomogeneity (ψ) and this must be removed from the signals S(tn) before they can be used to compute the metabolite levels. The field inhomogeneity term ψ can be estimated from the acquired signals S(tn) using an iterative method as described by Reeder et al, MRM, 51(1):123-30, 2004. With this approach at least four signals S(tn) must be acquired in order to solve for the four unknowns (PA, PL, PP. ψ). Or the inhomogeneity (ψ) can be calculated from a proton density (1H) calibration image that is separately acquired and used to produce a B0 field inhomogeneity map. In this embodiment only three signals S(tn) need be acquired since ψ is determined by the separate proton density image acquisition. This map indicates the field inhomogeneity ψ at each image pixel in terms of a shift in the Larmor frequency from the nominal Larmor frequency. The phase created by the field ihhomogeneity is demodulated from the acquired NMR signals S(tn) by multiplying the signal S(tn) by a phase term e -i2nψtn to remove the effects of B0 field inhomogeneities.
- With the phase created by the field inhomogeneity removed, equation (1) can be rewritten as follows:

where: - S = [S(tTE1), S] (tTE2) ... S(tn)
- ρ = [ρA, ρL, ρP]

- If sufficient images are acquired at different echo times TE, all of the terms in the coefficient matrix A are known and estimates of the three metabolites (P̂) may then be calculated from the pseudo-inverse of equation (2):

where "H" denotes the Hermitian transpose. In the case of C-13 labeled pyruvate, three images are required at a minimum. Obviously, this is a substantial reduction in scan time over prior methods which require 64 images to provide the needed spectral resolution. - Different echo times are needed in the n=3 images and the changes, or shifts in echo time TE can be chosen to maximize the SNR performance of the the effective number of signal averages (NSA). NSA is easily calculated for each species as the inverse of each diagonal term in the covariance matrix:

where: - m=1 for alanine,
- m=2 for lactate, and
- m=3 for pyruvate.
- The NSA values can be calculated for different echo shifts in order to maximize the NSA for some or all the metabolites, determining the optimum echo spacing that will maximize noise performance. For example,
Fig. 4 shows the NSA performance for three equally spaced echoes for the case where the field map (ψ) is known or measured using an external calibration. From this plot, it can be determined that an echo spacing of approximately 1.0ms will provide excellent NSA for all three metabolites. This is one possible echo combination that will provide good noise performance for the decomposition of the three species, however other combinations of echoes, including unequally spaced echoes can be used for this form of optimization. - More than three echoes can also be used to decompose the three species. Not all pulse sequences are sufficiently flexible in their timing to achieve the optimal echo spacing, for example, 1.0ms. For this reason it may be advantageous to acquire more than 3 echoes, in order to match the capabilities of the pulse sequence with an optimal echo combination. For example,
Fig. 6 plots the NSA for the same decomposition using 4 echoes. An optimal spacing occurs at spacings of 1.4ms or 2.1 ms. Thus, if a pulse sequence is unable to achieve an echo spacing of 1.0ms for performing the preferred 3 echo decomposition, it might be advantageous to perform a four echo acquisition using an echo spacing 1.4ms or 2.1 ms. - Referring particularly to
Fig. 1 , the preferred embodiment of the invention is employed in an MRI system. The MRI system includes aworkstation 10 having adisplay 12 and a keyboard 14. Theworkstation 10 includes aprocessor 16 which is a commercially available programmable machine running a commercially available operating system. Theworkstation 10 provides the operator interface which enables scan prescriptions to be entered into the MRI system. - The
workstation 10 is coupled to four servers: apulse sequence server 18; adata acquisition server 20; adata processing server 22, and adata store server 23. In the preferred embodiment thedata store server 23 is performed by theworkstation processor 16 and associated disc drive interface circuitry. The remaining threeservers pulse sequence server 18 employs a commercially available microprocessor and a commercially available quad communication controller. Thedata acquisition server 20 anddata processing server 22 both employ the same commercially available microprocessor and thedata processing server 22 further includes one or more array processors based on commercially available parallel vector processors. - The
workstation 10 and each processor for theservers servers workstation 10 and it conveys tag data that is communicated between the servers and between the workstation and the servers. In addition, a high speed data link is provided between thedata processing server 22 and theworkstation 10 in order to convey image data to thedata store server 23. - The
pulse sequence server 18 functions in response to program elements downloaded from theworkstation 10 to operate agradient system 24 and anRF system 26. Gradient waveforms necessary to perform the prescribed scan are produced and applied to thegradient system 24 which excites gradient coils in anassembly 28 to produce the magnetic field gradients Gx, Gy and Gz used for position encoding NMR signals. Thegradient coil assembly 28 forms part of amagnet assembly 30 which includes apolarizing magnet 32 and a whole-body RF coil 34. In the preferred embodiment a 3.0 Tesla scanner sold by General Electric under the trademark "SIGNA" is employed. - RF excitation waveforms are applied to the
RF coil 34 by theRF system 26 to perform the prescribed magnetic resonance pulse sequence. Responsive NMR signals detected by theRF coil 34 are received by theRF system 26, amplified, demodulated, filtered and digitized under direction of commands produced by thepulse sequence server 18. TheRF system 26 includes an RF transmitter for producing a wide variety of RF pulses used in MR pulse sequences. The RF transmitter is responsive to the scan prescription and direction from thepulse sequence server 18 to produce RF pulses of the desired frequency, phase and pulse amplitude waveform. The generated RF pulses may be applied to the wholebody RF coil 34 or to one or more local coils or coil arrays. - The
RF system 26 also includes one or more RF receiver channels. Each RF receiver channel includes an RF amplifier that amplifies the NMR signal received by the coil to which it is connected and a quadrature detector which detects and digitizes the I and Q quadrature components of the received NMR signal. The magnitude of the received NMR signal may thus be determined at any sampled point by the square root of the sum of the squares of the I and Q components:
and the phase of the received NMR signal may also be determined:
In the preferred embodiment a dual-tuned, proton-carbon transmit and receive local coil is employed such as that described inU.S. Pat. No. 4,799,016 entitled "Dual Frequency NMR Surface Coil." - The
pulse sequence server 18 also optionally receives patient data from aphysiological acquisition controller 36. Thecontroller 36 receives signals from a number of different sensors connected to the patient, such as ECG signals from electrodes or respiratory signals from a bellows. Such signals are typically used by thepulse sequence server 18 to synchronize, or "gate", the performance of the scan with the subject's respiration or heart beat. - The
pulse sequence server 18 also connects to a scanroom interface circuit 38 which receives signals from various sensors associated with the condition of the patient and the magnet system. It is also through the scanroom interface circuit 38 that apatient positioning system 40 receives commands to move the patient to desired positions during the scan. - It should be apparent that the
pulse sequence server 18 performs real-time control of MRI system elements during a scan. As a result, it is necessary that its hardware elements be operated with program instructions that are executed in a timely manner by run-time programs. The description components for a scan prescription are downloaded from theworkstation 10 in the form of objects. Thepulse sequence server 18 contains programs which receive these objects and converts them to objects that are employed by the run-time programs. - The digitized NMR signal samples produced by the
RF system 26 are received by thedata acquisition server 20. Thedata acquisition server 20 operates in response to description components downloaded from theworkstation 10 to receive the real-time NMR data and provide buffer storage such that no data is lost by data overrun. In some scans thedata acquisition server 20 does little more than pass the acquired NMR data to thedata processor server 22. However, in scans which require information derived from acquired NMR data to control the further performance of the scan, thedata acquisition server 20 is programmed to produce such information and convey it to thepulse sequence server 18. For example, during prescans NMR data is acquired and used to calibrate the pulse sequence performed by thepulse sequence server 18. Also, navigator signals may be acquired during a scan and used to adjust RF or gradient system operating parameters or to control the view order in which k-space is sampled. And, thedata acquisition server 20 may be employed to process NMR signals used to detect the arrival of contrast agent in an MRA scan. In all these examples thedata acquisition server 20 acquires NMR data and processes it in real-time to produce information which is used to control the scan. - The
data processing server 22 receives NMR data from thedata acquisition server 20 and processes it in accordance with description components downloaded from theworkstation 10. Such processing include Fourier transformation of raw k-space NMR data to produce two or three-dimensional images; the application of filters to a reconstructed image and the reconstruction of the metabolic images according to the present invention. - Images reconstructed by the
data processing server 22 are conveyed back to theworkstation 10 where they are stored. Real-time images are stored in a data base memory cache (not shown) from which they may be output tooperator display 12 or adisplay 42 which is located near themagnet assembly 30 for use by attending physicians. Batch mode images or selected real time images are stored in a host database ondisc storage 44. When such images have been reconstructed and transferred to storage, thedata processing server 22 notifies thedata store server 23 on theworkstation 10. Theworkstation 10 may be used by an operator to archive the images, produce films, or send the images via a network to other facilities. - A number of different pulse sequences can be used to direct the MRI system to acquire the data needed to practice the present invention. In the preferred embodiment a pulse sequence as shown in
Fig. 3 is employed which uses the steady state free precision (SSFP) principle. It includes a selectiverf excitation pulse 50 that is repeated at the start of each TR period as well as a sliceselect gradient pulse 52 that is produced concurrently with therf pulse 50 to produce transverse magnetization in a prescribed slice. After excitation of the spins in the slice a phaseencoding gradient pulse 54 is applied to position encode theNMR signal 56 along one direction in the slice. Areadout gradient pulse 58 is also applied after adephasing gradient lobe 60 to position encode theNMR signal 56 along a second, orthogonal direction in the slice. TheNMR signal 56 is sampled during adata acquisition window 62. To maintain the steady state condition, the integrals of the three gradients each sum to zero. To accomplish this rephrasing lobes 64 are added to the slice select gradient waveform, a rephrasinglobe 66 is added to the readout gradient waveform and arewinder gradient lobe 68 is added to the phase encoding gradient waveform. As is well known in the art, the pulse sequence is repeated and the amplitude of thephase encoding gradient 54 and its equal, butopposite rewinder 68 are stepped through a set of values to sample 2D k-space in a prescribed manner. As will be explained in more detail below, each slice is acquired three or more times and the echo time TE increment is set to 1.0ms during successive acquisitions. - Referring particularly to
Fig. 5 , the first step in performing a C-13 metabolite scan is to prepare the subject as indicated atprocess block 100. This includes injection of nonhyperpolarized or hyperpolarized C-13 labeled pyruvate from a suitable source such as a polarizer device. - A scan is then conducted with the above MRI system using the above described pulse sequence to acquire spectroscopic image data as indicated at
process block 102. Three images at three different echo times TE are acquired at each prescribed slice location. This provides sufficient information when combined with a prior information concerning the metabolite signal to produce images of the metabolites alanine, lactate and pyruvate. - As indicated at process block 104 the next step is to reconstruct the three images at each slice location. This is done in the usual manner by performing a two-dimensional, complex Fourier transformation of the acquired k-space data. As a result, three NMR signals S(tTE1), S(tTE2) and S(tTE3) are produced for each pixel location in each slice.
- A field map (ψ) is produced next as indicated at
process block 106. As indicated above, this can be done by either using an iterative method described by S.B. Reeder et al in "Multicoil Dixon Chemical Species Separation With An Iterative Least-Squares Estimation Method", MRM, 51:35-45 (2004), or a separate scan can be performed to acquire a proton calibration image from which the phase error ψ is determined at each image pixel as discussed above. The phase shifts caused by inhomogeneities in the scanner polarizing magnetic field are then demodulated from the images as described above and indicated atprocess block 108. - As indicated at
process block 110, the metabolite component of the signals at each slice image pixel is then calculated using the corrected image signals S(tTE1), S(tTE2) and S(tTE3) and the above equation (3). The values of the metabolite signals ρA, ρL and ρP are thus calculated at each slice image pixel. These can be displayed as separate metabolite images as indicated atprocess block 112, or the three separate metabolite images can be combined into a single image with different color coding for each metabolite. It is also possible to acquire during the scan a proton image and reconstruct a high resolution anatomical image of each slice. The metabolite image or images may be registered and displayed in color with the anatomical image forming a black and white background. - It should be apparent to those skilled in the art that many variations are possible from the above described preferred embodiment. For example, many other pulse sequences can be used to acquire the NMR data and different image reconstruction methods can be used. For example, a pulse sequence that samples k-space along a radial path can be used and the images reconstructed using a backprojection technique. Also, other metabolites may be imaged using the present invention where sufficient a priori information is known about the frequency of their NMR signal peaks and the relative values of their multiple peaks.
- The decomposition described in Equations 1-3 is preferably performed in image space. So long as the field map (ψ) can be ignored or has been demodulated from the source data, the signal, as described in
Equation 1 is a linear system, which will also hold after Fourier transformation into k-space. This permits separation of the k-space signals of the chemical species into separate data matrices. After separation of the k-space data, the Fourier transform is performed to yield images of each metabolite. In general, however, it is more convenient to perform calculations in image space if the field map (which makes Equation 1 a non-linear equation) is non-zero, creating position dependent phase shifts.

Claims (16)
- A method for producing an image of a metabolite with a magnetic resonance imaging (MRI) system, the steps comprising:a) acquiring NMR image signals with the MRI system from a subject containing a number of target metabolites having known resonant frequencies under the direction of a pulse sequence having a first echo time (TE);b) repeating step a) under the direction of a pulse sequence having a different echo time (TE), wherein a number of repetitions of step a) is based on the number of target metabolites;c) reconstructing images from the NMR image signals acquired in step a) and step b) for the target metabolites;d) calculating the signal produced by one of said target metabolites at each image pixel using the reconstructed image signals at each pixel and an equation derived from a model NMR signal;wherein the model NMR signal includes a term for each target metabolite that has a single known resonant frequency, and further terms for each of a plurality of known resonant frequencies of another metabolite along with factors that indicate the known relative values of NMR signals at each of said plurality of known resonant frequencies.
- The method as recited in claim 1 in which the target metabolites include lactate, alanine and pyruvate having known resonant frequencies fA, fL for lactate and alanine and two known resonant frequencies fP1 and fP2 for pyruvate and wherein the factors include relative areas of the signal peaks associated with each target metabolite.
- The method as recited in claim 2 in which the model NMR signal is in the form:

where PA, PL and PP are the signal contributions from alanine, lactate and pyruvate respectively, rP1 and rP2 are the known relative values of NMR signals at the two pyruvate resonant frequencies; ψ is the field inhomogeneity in the MRI system, and tn is the echo time (TE) of the pulse sequence used to acquire the NMR signal. - The method as recited in claim 2 in which step a) is performed three times at three different echo times (TE).
- The method as recited in claim 4 in which echo times (TE) differ from each other by approximately 1.0 milliseconds.
- The method as recited in claim 1 in which step d) includes correcting the signal at each image pixel for inhomogeneity of an MRI system polarizing magnetic field.
- The method as recited in claim 1 which includes:administering a paramagnetic label to the subject prior to performing step a).
- The method as recited in claim 7 in which the paramagnetic label is Carbon-13.
- The method as recited in claim 1 in which step a) is performed by repeatedly performing a pulse sequence that directs the MRI system to produce an rf excitation field at a selected Larmor frequency and to acquire a resulting NMR signal.
- The method as recited in claim 9 in which the Larmor frequency of Carbon-13 is selected.
- The method as recited in claim 9 in which the pulse sequence is a gradient-recalled echo pulse sequence.
- The method as recited in claim 11 is a steady state free precession pulse sequence.
- The method as recited in claim 1 which includes:determining a difference in echo time for use in setting the different echo time (TE) in step b) such that the NMR signals produced by the target metabolites are optimized.
- The method as recited in claim 13 in which the difference is approximately 1.0 milliseconds.
- The method as recited in claim 1 in which step d) includes calculating the signal produced by each of said target metabolites.
- The method as recited in claim 15 which includes producing an image in which the target metabolite signals calculated in step d) modulate the intensity at each image pixel and each target metabolite produces a different color.
Applications Claiming Priority (2)
| Application Number | Priority Date | Filing Date | Title |
|---|---|---|---|
| US11/406,645 US7202665B1 (en) | 2006-04-19 | 2006-04-19 | Magnetic resonance spectroscopy of species with multiple peaks |
| PCT/US2007/009546 WO2007123981A2 (en) | 2006-04-19 | 2007-04-18 | Separation of metabolites with chemical shift imaging |
Publications (2)
| Publication Number | Publication Date |
|---|---|
| EP2008118A2 EP2008118A2 (en) | 2008-12-31 |
| EP2008118B1 true EP2008118B1 (en) | 2012-04-04 |
Family
ID=37904213
Family Applications (1)
| Application Number | Title | Priority Date | Filing Date |
|---|---|---|---|
| EP07775747A Active EP2008118B1 (en) | 2006-04-19 | 2007-04-18 | Separation of metabolites with chemical shift imaging |
Country Status (5)
| Country | Link |
|---|---|
| US (1) | US7202665B1 (en) |
| EP (1) | EP2008118B1 (en) |
| JP (1) | JP5196408B2 (en) |
| AT (1) | ATE552511T1 (en) |
| WO (1) | WO2007123981A2 (en) |
Cited By (1)
| Publication number | Priority date | Publication date | Assignee | Title |
|---|---|---|---|---|
| JP2009534101A (en) * | 2006-04-19 | 2009-09-24 | ウイスコンシン アラムナイ リサーチ フオンデーシヨン | Magnetic resonance spectroscopy of species with multiple peaks. |
Families Citing this family (12)
| Publication number | Priority date | Publication date | Assignee | Title |
|---|---|---|---|---|
| US8483798B2 (en) * | 2007-01-15 | 2013-07-09 | General Electric Company | System and method for metabolic MR imaging of a hyperpolarized agent |
| US7772844B2 (en) * | 2008-01-30 | 2010-08-10 | General Electric Company | System and method for tissue specific MR imaging of metabolites using spectral-spatially formed stimulated echo |
| US7924003B2 (en) * | 2008-04-17 | 2011-04-12 | Wisconsin Alumni Research Foundation | Method for water-fat separation and T2* estimation in an MRI system employing multiple fat spectral peaks and fat spectrum self-calibration |
| US20110140696A1 (en) * | 2009-12-15 | 2011-06-16 | Huanzhou Yu | System and method for quantitative species signal separation using mr imaging |
| EP2365354A1 (en) * | 2010-02-22 | 2011-09-14 | Koninklijke Philips Electronics N.V. | Magnetic resonance imaging of chemical species with a spectral model |
| US8970217B1 (en) | 2010-04-14 | 2015-03-03 | Hypres, Inc. | System and method for noise reduction in magnetic resonance imaging |
| US8373415B2 (en) | 2010-04-15 | 2013-02-12 | Wisconsin Alumni Research Foundation | Method for separating magnetic resonance imaging signals using spectral distinction of species |
| EP3591418A1 (en) * | 2018-07-03 | 2020-01-08 | Koninklijke Philips N.V. | Mri method for b0-mapping |
| US12007458B2 (en) * | 2019-07-08 | 2024-06-11 | Canon Medical Systems Corporation | Magnetic resonance imaging apparatus and magnetic resonance imaging method |
| JP7756015B2 (en) * | 2022-02-14 | 2025-10-17 | キヤノンメディカルシステムズ株式会社 | Magnetic resonance imaging apparatus, hyperpolarized signal acquisition method, and hyperpolarized signal acquisition program |
| JP7680978B2 (en) | 2022-03-14 | 2025-05-21 | 富士フイルム株式会社 | Magnetic resonance imaging apparatus, image processing apparatus, and signal separation method |
| JP2024052074A (en) | 2022-09-30 | 2024-04-11 | 富士フイルムヘルスケア株式会社 | IMAGE PROCESSING APPARATUS, MAGNETIC RESONANCE IMAGING APPARATUS, AND SIGNAL SEPARATION METHOD |
Family Cites Families (11)
| Publication number | Priority date | Publication date | Assignee | Title |
|---|---|---|---|---|
| JPH06225863A (en) * | 1993-02-03 | 1994-08-16 | Hitachi Ltd | Magnetic resonance spectrum imaging method |
| US6674897B1 (en) * | 1993-09-08 | 2004-01-06 | Sony Corporation | Picture data compression device and red data detection device |
| US6181134B1 (en) * | 1998-03-09 | 2001-01-30 | The Mclean Hospital Corporation | Magnetic resonance imaging of the distribution of a marker compound without obtaining spectral information |
| US6370416B1 (en) * | 1998-11-25 | 2002-04-09 | Ge Medical Systems Global Technology Company Llc | fMRI signal processing |
| DE10138961B4 (en) | 2001-08-08 | 2006-09-28 | Universitätsklinikum Freiburg | Method for measuring magnetic resonance (NMR) by means of steady state signals (SSFP) |
| US6856134B1 (en) | 2003-05-23 | 2005-02-15 | The Board Of Trustees Of The Leland Stanford Junior University | Magnetic resonance imaging with fat-water signal separation |
| US7349729B2 (en) | 2003-10-20 | 2008-03-25 | The Board Of Trustees Of The Leland Stanford Junior University | Magnetic resonance imaging of different chemical species in a system having magnetic field heterogeneities |
| DE102004011874B4 (en) * | 2004-03-11 | 2006-04-20 | Universitätsklinikum Freiburg | Method for measuring magnetic resonance (NMR) using Continuously Refocused Multiecho Spectroscopic Imaging |
| KR101126952B1 (en) * | 2004-07-30 | 2012-03-20 | 지이 헬스케어 에이에스 | Mr imaging method for the discrimination between healthy and tumour tissue |
| ES2422558T3 (en) * | 2004-11-19 | 2013-09-12 | Ge Healthcare As | Cardiac imaging method with the use of hyperpolarized 13C-pyruvate |
| US7202665B1 (en) * | 2006-04-19 | 2007-04-10 | Wisconsin Alumni Research Foundation | Magnetic resonance spectroscopy of species with multiple peaks |
-
2006
- 2006-04-19 US US11/406,645 patent/US7202665B1/en not_active Expired - Lifetime
-
2007
- 2007-04-18 WO PCT/US2007/009546 patent/WO2007123981A2/en not_active Ceased
- 2007-04-18 EP EP07775747A patent/EP2008118B1/en active Active
- 2007-04-18 JP JP2009506573A patent/JP5196408B2/en active Active
- 2007-04-18 AT AT07775747T patent/ATE552511T1/en active
Cited By (1)
| Publication number | Priority date | Publication date | Assignee | Title |
|---|---|---|---|---|
| JP2009534101A (en) * | 2006-04-19 | 2009-09-24 | ウイスコンシン アラムナイ リサーチ フオンデーシヨン | Magnetic resonance spectroscopy of species with multiple peaks. |
Also Published As
| Publication number | Publication date |
|---|---|
| JP2009534101A (en) | 2009-09-24 |
| WO2007123981A2 (en) | 2007-11-01 |
| JP5196408B2 (en) | 2013-05-15 |
| US7202665B1 (en) | 2007-04-10 |
| EP2008118A2 (en) | 2008-12-31 |
| ATE552511T1 (en) | 2012-04-15 |
| WO2007123981A3 (en) | 2008-01-31 |
Similar Documents
| Publication | Publication Date | Title |
|---|---|---|
| US7619411B2 (en) | Generalized method for MRI chemical species separation using arbitrary k-space trajectories | |
| US7924003B2 (en) | Method for water-fat separation and T2* estimation in an MRI system employing multiple fat spectral peaks and fat spectrum self-calibration | |
| JP5196408B2 (en) | Magnetic resonance spectroscopy of species with multiple peaks. | |
| US7495439B2 (en) | MRI method for reducing artifacts using RF pulse at offset frequency | |
| US6326786B1 (en) | Magnetic resonance imaging method and apparatus | |
| CN101484823B (en) | Magnetic resonance imaging apparatus and method | |
| US6559642B2 (en) | Calibration method for use with sensitivity encoding MRI acquisition | |
| US8527031B2 (en) | Methods for fat quantification with correction for noise bias | |
| EP1136836B1 (en) | T2 contrast in magnetic resonance imaging with gradient echoes | |
| US7235971B2 (en) | Shimming of MRI scanner involving fat suppression and/or black blood preparation | |
| US20100026297A1 (en) | Method for relaxation-compensated fast multi-slice chemical exchange saturation transfer mri | |
| US10459058B2 (en) | System and method for magnetic resonance imaging with prospective motion control | |
| US20100185081A1 (en) | Magnetic resonance thermometry in the presence of water and fat | |
| EP2057602A2 (en) | Method for aligning multiple mr images acquired with alternating readout gradient | |
| EP4246170A1 (en) | Methods for acquiring a magnetic resonance image dataset and for generating a motion-corrected image dataset | |
| US6046589A (en) | Method and device for spectroscopic magnetic resonance imaging | |
| EP1372110B1 (en) | Method and system for image reconstruction | |
| US20240201302A1 (en) | Systems and methods for non-selective stimulated echo multislice diffusion imaging |
Legal Events
| Date | Code | Title | Description |
|---|---|---|---|
| PUAI | Public reference made under article 153(3) epc to a published international application that has entered the european phase |
Free format text: ORIGINAL CODE: 0009012 |
|
| 17P | Request for examination filed |
Effective date: 20081006 |
|
| AK | Designated contracting states |
Kind code of ref document: A2 Designated state(s): AT BE BG CH CY CZ DE DK EE ES FI FR GB GR HU IE IS IT LI LT LU LV MC MT NL PL PT RO SE SI SK TR |
|
| AX | Request for extension of the european patent |
Extension state: AL BA HR MK RS |
|
| 17Q | First examination report despatched |
Effective date: 20110303 |
|
| GRAP | Despatch of communication of intention to grant a patent |
Free format text: ORIGINAL CODE: EPIDOSNIGR1 |
|
| DAX | Request for extension of the european patent (deleted) | ||
| GRAS | Grant fee paid |
Free format text: ORIGINAL CODE: EPIDOSNIGR3 |
|
| GRAA | (expected) grant |
Free format text: ORIGINAL CODE: 0009210 |
|
| AK | Designated contracting states |
Kind code of ref document: B1 Designated state(s): AT BE BG CH CY CZ DE DK EE ES FI FR GB GR HU IE IS IT LI LT LU LV MC MT NL PL PT RO SE SI SK TR |
|
| REG | Reference to a national code |
Ref country code: GB Ref legal event code: FG4D |
|
| REG | Reference to a national code |
Ref country code: CH Ref legal event code: EP |
|
| REG | Reference to a national code |
Ref country code: AT Ref legal event code: REF Ref document number: 552511 Country of ref document: AT Kind code of ref document: T Effective date: 20120415 |
|
| REG | Reference to a national code |
Ref country code: IE Ref legal event code: FG4D |
|
| REG | Reference to a national code |
Ref country code: DE Ref legal event code: R096 Ref document number: 602007021759 Country of ref document: DE Effective date: 20120531 |
|
| REG | Reference to a national code |
Ref country code: NL Ref legal event code: T3 |
|
| REG | Reference to a national code |
Ref country code: AT Ref legal event code: MK05 Ref document number: 552511 Country of ref document: AT Kind code of ref document: T Effective date: 20120404 |
|
| LTIE | Lt: invalidation of european patent or patent extension |
Effective date: 20120404 |
|
| PG25 | Lapsed in a contracting state [announced via postgrant information from national office to epo] |
Ref country code: SI Free format text: LAPSE BECAUSE OF FAILURE TO SUBMIT A TRANSLATION OF THE DESCRIPTION OR TO PAY THE FEE WITHIN THE PRESCRIBED TIME-LIMIT Effective date: 20120404 Ref country code: PL Free format text: LAPSE BECAUSE OF FAILURE TO SUBMIT A TRANSLATION OF THE DESCRIPTION OR TO PAY THE FEE WITHIN THE PRESCRIBED TIME-LIMIT Effective date: 20120404 Ref country code: LT Free format text: LAPSE BECAUSE OF FAILURE TO SUBMIT A TRANSLATION OF THE DESCRIPTION OR TO PAY THE FEE WITHIN THE PRESCRIBED TIME-LIMIT Effective date: 20120404 Ref country code: SE Free format text: LAPSE BECAUSE OF FAILURE TO SUBMIT A TRANSLATION OF THE DESCRIPTION OR TO PAY THE FEE WITHIN THE PRESCRIBED TIME-LIMIT Effective date: 20120404 Ref country code: FI Free format text: LAPSE BECAUSE OF FAILURE TO SUBMIT A TRANSLATION OF THE DESCRIPTION OR TO PAY THE FEE WITHIN THE PRESCRIBED TIME-LIMIT Effective date: 20120404 Ref country code: IS Free format text: LAPSE BECAUSE OF FAILURE TO SUBMIT A TRANSLATION OF THE DESCRIPTION OR TO PAY THE FEE WITHIN THE PRESCRIBED TIME-LIMIT Effective date: 20120804 Ref country code: CY Free format text: LAPSE BECAUSE OF FAILURE TO SUBMIT A TRANSLATION OF THE DESCRIPTION OR TO PAY THE FEE WITHIN THE PRESCRIBED TIME-LIMIT Effective date: 20120404 |
|
| PG25 | Lapsed in a contracting state [announced via postgrant information from national office to epo] |
Ref country code: LV Free format text: LAPSE BECAUSE OF FAILURE TO SUBMIT A TRANSLATION OF THE DESCRIPTION OR TO PAY THE FEE WITHIN THE PRESCRIBED TIME-LIMIT Effective date: 20120404 Ref country code: GR Free format text: LAPSE BECAUSE OF FAILURE TO SUBMIT A TRANSLATION OF THE DESCRIPTION OR TO PAY THE FEE WITHIN THE PRESCRIBED TIME-LIMIT Effective date: 20120705 Ref country code: MC Free format text: LAPSE BECAUSE OF NON-PAYMENT OF DUE FEES Effective date: 20120430 Ref country code: PT Free format text: LAPSE BECAUSE OF FAILURE TO SUBMIT A TRANSLATION OF THE DESCRIPTION OR TO PAY THE FEE WITHIN THE PRESCRIBED TIME-LIMIT Effective date: 20120806 |
|
| REG | Reference to a national code |
Ref country code: CH Ref legal event code: PL |
|
| PG25 | Lapsed in a contracting state [announced via postgrant information from national office to epo] |
Ref country code: BE Free format text: LAPSE BECAUSE OF FAILURE TO SUBMIT A TRANSLATION OF THE DESCRIPTION OR TO PAY THE FEE WITHIN THE PRESCRIBED TIME-LIMIT Effective date: 20120404 |
|
| REG | Reference to a national code |
Ref country code: IE Ref legal event code: MM4A |
|
| PG25 | Lapsed in a contracting state [announced via postgrant information from national office to epo] |
Ref country code: EE Free format text: LAPSE BECAUSE OF FAILURE TO SUBMIT A TRANSLATION OF THE DESCRIPTION OR TO PAY THE FEE WITHIN THE PRESCRIBED TIME-LIMIT Effective date: 20120404 Ref country code: DK Free format text: LAPSE BECAUSE OF FAILURE TO SUBMIT A TRANSLATION OF THE DESCRIPTION OR TO PAY THE FEE WITHIN THE PRESCRIBED TIME-LIMIT Effective date: 20120404 Ref country code: RO Free format text: LAPSE BECAUSE OF FAILURE TO SUBMIT A TRANSLATION OF THE DESCRIPTION OR TO PAY THE FEE WITHIN THE PRESCRIBED TIME-LIMIT Effective date: 20120404 Ref country code: SK Free format text: LAPSE BECAUSE OF FAILURE TO SUBMIT A TRANSLATION OF THE DESCRIPTION OR TO PAY THE FEE WITHIN THE PRESCRIBED TIME-LIMIT Effective date: 20120404 Ref country code: CZ Free format text: LAPSE BECAUSE OF FAILURE TO SUBMIT A TRANSLATION OF THE DESCRIPTION OR TO PAY THE FEE WITHIN THE PRESCRIBED TIME-LIMIT Effective date: 20120404 Ref country code: AT Free format text: LAPSE BECAUSE OF FAILURE TO SUBMIT A TRANSLATION OF THE DESCRIPTION OR TO PAY THE FEE WITHIN THE PRESCRIBED TIME-LIMIT Effective date: 20120404 Ref country code: CH Free format text: LAPSE BECAUSE OF NON-PAYMENT OF DUE FEES Effective date: 20120430 Ref country code: LI Free format text: LAPSE BECAUSE OF NON-PAYMENT OF DUE FEES Effective date: 20120430 Ref country code: IE Free format text: LAPSE BECAUSE OF NON-PAYMENT OF DUE FEES Effective date: 20120418 |
|
| PLBE | No opposition filed within time limit |
Free format text: ORIGINAL CODE: 0009261 |
|
| STAA | Information on the status of an ep patent application or granted ep patent |
Free format text: STATUS: NO OPPOSITION FILED WITHIN TIME LIMIT |
|
| PG25 | Lapsed in a contracting state [announced via postgrant information from national office to epo] |
Ref country code: IT Free format text: LAPSE BECAUSE OF FAILURE TO SUBMIT A TRANSLATION OF THE DESCRIPTION OR TO PAY THE FEE WITHIN THE PRESCRIBED TIME-LIMIT Effective date: 20120404 |
|
| REG | Reference to a national code |
Ref country code: FR Ref legal event code: ST Effective date: 20130204 |
|
| 26N | No opposition filed |
Effective date: 20130107 |
|
| GBPC | Gb: european patent ceased through non-payment of renewal fee |
Effective date: 20120704 |
|
| PG25 | Lapsed in a contracting state [announced via postgrant information from national office to epo] |
Ref country code: FR Free format text: LAPSE BECAUSE OF NON-PAYMENT OF DUE FEES Effective date: 20120604 Ref country code: ES Free format text: LAPSE BECAUSE OF FAILURE TO SUBMIT A TRANSLATION OF THE DESCRIPTION OR TO PAY THE FEE WITHIN THE PRESCRIBED TIME-LIMIT Effective date: 20120715 Ref country code: GB Free format text: LAPSE BECAUSE OF NON-PAYMENT OF DUE FEES Effective date: 20120704 |
|
| REG | Reference to a national code |
Ref country code: DE Ref legal event code: R097 Ref document number: 602007021759 Country of ref document: DE Effective date: 20130107 |
|
| PG25 | Lapsed in a contracting state [announced via postgrant information from national office to epo] |
Ref country code: MT Free format text: LAPSE BECAUSE OF FAILURE TO SUBMIT A TRANSLATION OF THE DESCRIPTION OR TO PAY THE FEE WITHIN THE PRESCRIBED TIME-LIMIT Effective date: 20120404 Ref country code: BG Free format text: LAPSE BECAUSE OF FAILURE TO SUBMIT A TRANSLATION OF THE DESCRIPTION OR TO PAY THE FEE WITHIN THE PRESCRIBED TIME-LIMIT Effective date: 20120704 |
|
| PG25 | Lapsed in a contracting state [announced via postgrant information from national office to epo] |
Ref country code: TR Free format text: LAPSE BECAUSE OF FAILURE TO SUBMIT A TRANSLATION OF THE DESCRIPTION OR TO PAY THE FEE WITHIN THE PRESCRIBED TIME-LIMIT Effective date: 20120404 |
|
| PG25 | Lapsed in a contracting state [announced via postgrant information from national office to epo] |
Ref country code: LU Free format text: LAPSE BECAUSE OF NON-PAYMENT OF DUE FEES Effective date: 20120418 |
|
| PG25 | Lapsed in a contracting state [announced via postgrant information from national office to epo] |
Ref country code: HU Free format text: LAPSE BECAUSE OF FAILURE TO SUBMIT A TRANSLATION OF THE DESCRIPTION OR TO PAY THE FEE WITHIN THE PRESCRIBED TIME-LIMIT Effective date: 20070418 |
|
| P01 | Opt-out of the competence of the unified patent court (upc) registered |
Effective date: 20230425 |
|
| PGFP | Annual fee paid to national office [announced via postgrant information from national office to epo] |
Ref country code: NL Payment date: 20250418 Year of fee payment: 19 |
|
| PGFP | Annual fee paid to national office [announced via postgrant information from national office to epo] |
Ref country code: DE Payment date: 20250422 Year of fee payment: 19 |