EP1981983B1 - Method and composition for rapid viability testing of cells - Google Patents
Method and composition for rapid viability testing of cells Download PDFInfo
- Publication number
- EP1981983B1 EP1981983B1 EP07861206.6A EP07861206A EP1981983B1 EP 1981983 B1 EP1981983 B1 EP 1981983B1 EP 07861206 A EP07861206 A EP 07861206A EP 1981983 B1 EP1981983 B1 EP 1981983B1
- Authority
- EP
- European Patent Office
- Prior art keywords
- cell
- test sample
- impedance response
- response
- impedance
- Prior art date
- Legal status (The legal status is an assumption and is not a legal conclusion. Google has not performed a legal analysis and makes no representation as to the accuracy of the status listed.)
- Not-in-force
Links
- 238000012360 testing method Methods 0.000 title claims description 165
- 238000000034 method Methods 0.000 title claims description 107
- 230000035899 viability Effects 0.000 title description 9
- 239000000203 mixture Substances 0.000 title description 8
- 210000004027 cell Anatomy 0.000 claims description 315
- 230000004044 response Effects 0.000 claims description 263
- 239000000523 sample Substances 0.000 claims description 175
- 230000003938 response to stress Effects 0.000 claims description 85
- 239000012867 bioactive agent Substances 0.000 claims description 83
- 239000013074 reference sample Substances 0.000 claims description 75
- 230000012010 growth Effects 0.000 claims description 69
- 238000005259 measurement Methods 0.000 claims description 53
- 238000012544 monitoring process Methods 0.000 claims description 50
- 230000008859 change Effects 0.000 claims description 31
- 230000005684 electric field Effects 0.000 claims description 25
- 239000011324 bead Substances 0.000 claims description 16
- 210000003527 eukaryotic cell Anatomy 0.000 claims description 14
- 230000007704 transition Effects 0.000 claims description 13
- 210000001236 prokaryotic cell Anatomy 0.000 claims description 9
- 239000000126 substance Substances 0.000 claims description 9
- 210000005260 human cell Anatomy 0.000 claims description 6
- 210000004102 animal cell Anatomy 0.000 claims description 5
- 150000001875 compounds Chemical class 0.000 claims description 5
- 239000011248 coating agent Substances 0.000 claims description 4
- 238000000576 coating method Methods 0.000 claims description 4
- 102000010834 Extracellular Matrix Proteins Human genes 0.000 claims description 3
- 108010037362 Extracellular Matrix Proteins Proteins 0.000 claims description 3
- 241000233866 Fungi Species 0.000 claims description 3
- 239000013543 active substance Substances 0.000 claims description 3
- 239000002246 antineoplastic agent Substances 0.000 claims description 3
- 210000002744 extracellular matrix Anatomy 0.000 claims description 3
- 241000700605 Viruses Species 0.000 claims description 2
- 239000003131 biological toxin Substances 0.000 claims description 2
- 230000001419 dependent effect Effects 0.000 claims description 2
- 230000028993 immune response Effects 0.000 claims description 2
- 102000039446 nucleic acids Human genes 0.000 claims description 2
- 108020004707 nucleic acids Proteins 0.000 claims description 2
- 150000007523 nucleic acids Chemical class 0.000 claims description 2
- 231100000765 toxin Toxicity 0.000 claims description 2
- 239000002609 medium Substances 0.000 description 47
- 230000035882 stress Effects 0.000 description 38
- 239000003814 drug Substances 0.000 description 36
- 229940079593 drug Drugs 0.000 description 36
- 238000001514 detection method Methods 0.000 description 35
- 241000894006 Bacteria Species 0.000 description 34
- 241000588724 Escherichia coli Species 0.000 description 28
- 230000001580 bacterial effect Effects 0.000 description 22
- 230000000875 corresponding effect Effects 0.000 description 20
- 239000000725 suspension Substances 0.000 description 18
- QRXWMOHMRWLFEY-UHFFFAOYSA-N isoniazide Chemical compound NNC(=O)C1=CC=NC=C1 QRXWMOHMRWLFEY-UHFFFAOYSA-N 0.000 description 16
- 239000006285 cell suspension Substances 0.000 description 15
- 230000002503 metabolic effect Effects 0.000 description 15
- 230000007423 decrease Effects 0.000 description 14
- 239000003634 thrombocyte concentrate Substances 0.000 description 14
- 244000052769 pathogen Species 0.000 description 13
- 241000894007 species Species 0.000 description 13
- 239000001974 tryptic soy broth Substances 0.000 description 12
- 108010050327 trypticase-soy broth Proteins 0.000 description 12
- 238000002474 experimental method Methods 0.000 description 11
- 241000186366 Mycobacterium bovis Species 0.000 description 10
- 230000001965 increasing effect Effects 0.000 description 10
- 208000015181 infectious disease Diseases 0.000 description 10
- 239000013642 negative control Substances 0.000 description 10
- 230000000694 effects Effects 0.000 description 9
- 239000003242 anti bacterial agent Substances 0.000 description 8
- 230000032823 cell division Effects 0.000 description 8
- 230000001717 pathogenic effect Effects 0.000 description 8
- 239000013598 vector Substances 0.000 description 8
- 229940088710 antibiotic agent Drugs 0.000 description 7
- 239000003795 chemical substances by application Substances 0.000 description 7
- 244000005700 microbiome Species 0.000 description 7
- 235000015197 apple juice Nutrition 0.000 description 6
- 239000002028 Biomass Substances 0.000 description 5
- 241000191963 Staphylococcus epidermidis Species 0.000 description 5
- 238000004458 analytical method Methods 0.000 description 5
- 238000013459 approach Methods 0.000 description 5
- 230000003115 biocidal effect Effects 0.000 description 5
- 230000007613 environmental effect Effects 0.000 description 5
- 238000002847 impedance measurement Methods 0.000 description 5
- 238000007747 plating Methods 0.000 description 5
- 108090000623 proteins and genes Proteins 0.000 description 5
- 230000004083 survival effect Effects 0.000 description 5
- 210000002700 urine Anatomy 0.000 description 5
- 241000186427 Cutibacterium acnes Species 0.000 description 4
- 239000004599 antimicrobial Substances 0.000 description 4
- 210000004369 blood Anatomy 0.000 description 4
- 239000008280 blood Substances 0.000 description 4
- 239000003990 capacitor Substances 0.000 description 4
- 239000000356 contaminant Substances 0.000 description 4
- 230000009089 cytolysis Effects 0.000 description 4
- 230000003247 decreasing effect Effects 0.000 description 4
- 238000010586 diagram Methods 0.000 description 4
- 230000006870 function Effects 0.000 description 4
- 239000000463 material Substances 0.000 description 4
- 239000000047 product Substances 0.000 description 4
- 102000004169 proteins and genes Human genes 0.000 description 4
- 230000035945 sensitivity Effects 0.000 description 4
- 206010059866 Drug resistance Diseases 0.000 description 3
- 206010021143 Hypoxia Diseases 0.000 description 3
- 239000006142 Luria-Bertani Agar Substances 0.000 description 3
- 230000002411 adverse Effects 0.000 description 3
- 230000008901 benefit Effects 0.000 description 3
- 239000012472 biological sample Substances 0.000 description 3
- 235000010633 broth Nutrition 0.000 description 3
- 230000010261 cell growth Effects 0.000 description 3
- 230000019522 cellular metabolic process Effects 0.000 description 3
- 238000012258 culturing Methods 0.000 description 3
- 238000003745 diagnosis Methods 0.000 description 3
- LOKCTEFSRHRXRJ-UHFFFAOYSA-I dipotassium trisodium dihydrogen phosphate hydrogen phosphate dichloride Chemical compound P(=O)(O)(O)[O-].[K+].P(=O)(O)([O-])[O-].[Na+].[Na+].[Cl-].[K+].[Cl-].[Na+] LOKCTEFSRHRXRJ-UHFFFAOYSA-I 0.000 description 3
- 238000005516 engineering process Methods 0.000 description 3
- 239000003527 fibrinolytic agent Substances 0.000 description 3
- 238000001914 filtration Methods 0.000 description 3
- 239000003112 inhibitor Substances 0.000 description 3
- 210000000265 leukocyte Anatomy 0.000 description 3
- 239000002953 phosphate buffered saline Substances 0.000 description 3
- 230000008569 process Effects 0.000 description 3
- 230000002829 reductive effect Effects 0.000 description 3
- 239000000758 substrate Substances 0.000 description 3
- 239000003440 toxic substance Substances 0.000 description 3
- ZKHQWZAMYRWXGA-KQYNXXCUSA-N Adenosine triphosphate Chemical compound C1=NC=2C(N)=NC=NC=2N1[C@@H]1O[C@H](COP(O)(=O)OP(O)(=O)OP(O)(O)=O)[C@@H](O)[C@H]1O ZKHQWZAMYRWXGA-KQYNXXCUSA-N 0.000 description 2
- ZKHQWZAMYRWXGA-UHFFFAOYSA-N Adenosine triphosphate Natural products C1=NC=2C(N)=NC=NC=2N1C1OC(COP(O)(=O)OP(O)(=O)OP(O)(O)=O)C(O)C1O ZKHQWZAMYRWXGA-UHFFFAOYSA-N 0.000 description 2
- 229920001817 Agar Polymers 0.000 description 2
- IJGRMHOSHXDMSA-UHFFFAOYSA-N Atomic nitrogen Chemical compound N#N IJGRMHOSHXDMSA-UHFFFAOYSA-N 0.000 description 2
- 206010027202 Meningitis bacterial Diseases 0.000 description 2
- 241001465754 Metazoa Species 0.000 description 2
- 101710127774 Stress response protein Proteins 0.000 description 2
- XJLXINKUBYWONI-DQQFMEOOSA-N [[(2r,3r,4r,5r)-5-(6-aminopurin-9-yl)-3-hydroxy-4-phosphonooxyoxolan-2-yl]methoxy-hydroxyphosphoryl] [(2s,3r,4s,5s)-5-(3-carbamoylpyridin-1-ium-1-yl)-3,4-dihydroxyoxolan-2-yl]methyl phosphate Chemical compound NC(=O)C1=CC=C[N+]([C@@H]2[C@H]([C@@H](O)[C@H](COP([O-])(=O)OP(O)(=O)OC[C@@H]3[C@H]([C@@H](OP(O)(O)=O)[C@@H](O3)N3C4=NC=NC(N)=C4N=C3)O)O2)O)=C1 XJLXINKUBYWONI-DQQFMEOOSA-N 0.000 description 2
- 239000008272 agar Substances 0.000 description 2
- 150000001413 amino acids Chemical class 0.000 description 2
- -1 anti polymerases Substances 0.000 description 2
- 230000000845 anti-microbial effect Effects 0.000 description 2
- 201000009904 bacterial meningitis Diseases 0.000 description 2
- 230000006399 behavior Effects 0.000 description 2
- 239000013060 biological fluid Substances 0.000 description 2
- 230000015572 biosynthetic process Effects 0.000 description 2
- 230000004790 biotic stress Effects 0.000 description 2
- 210000000601 blood cell Anatomy 0.000 description 2
- 150000001720 carbohydrates Chemical class 0.000 description 2
- 235000014633 carbohydrates Nutrition 0.000 description 2
- 230000003833 cell viability Effects 0.000 description 2
- 230000036755 cellular response Effects 0.000 description 2
- 230000007960 cellular response to stress Effects 0.000 description 2
- 210000001175 cerebrospinal fluid Anatomy 0.000 description 2
- 150000001793 charged compounds Chemical class 0.000 description 2
- 230000001332 colony forming effect Effects 0.000 description 2
- 239000004020 conductor Substances 0.000 description 2
- 239000000470 constituent Substances 0.000 description 2
- 238000007796 conventional method Methods 0.000 description 2
- 230000034994 death Effects 0.000 description 2
- 230000001934 delay Effects 0.000 description 2
- 239000003599 detergent Substances 0.000 description 2
- 238000010790 dilution Methods 0.000 description 2
- 239000012895 dilution Substances 0.000 description 2
- 210000003743 erythrocyte Anatomy 0.000 description 2
- 230000002349 favourable effect Effects 0.000 description 2
- 235000013305 food Nutrition 0.000 description 2
- 239000001963 growth medium Substances 0.000 description 2
- 230000007954 hypoxia Effects 0.000 description 2
- 230000002458 infectious effect Effects 0.000 description 2
- 230000002401 inhibitory effect Effects 0.000 description 2
- 239000002054 inoculum Substances 0.000 description 2
- 230000003834 intracellular effect Effects 0.000 description 2
- 150000002632 lipids Chemical class 0.000 description 2
- 239000006166 lysate Substances 0.000 description 2
- 238000004519 manufacturing process Methods 0.000 description 2
- 230000000813 microbial effect Effects 0.000 description 2
- 229930027945 nicotinamide-adenine dinucleotide Natural products 0.000 description 2
- 235000015097 nutrients Nutrition 0.000 description 2
- 239000008177 pharmaceutical agent Substances 0.000 description 2
- DTBNBXWJWCWCIK-UHFFFAOYSA-K phosphonatoenolpyruvate Chemical compound [O-]C(=O)C(=C)OP([O-])([O-])=O DTBNBXWJWCWCIK-UHFFFAOYSA-K 0.000 description 2
- 210000002381 plasma Anatomy 0.000 description 2
- 231100000614 poison Toxicity 0.000 description 2
- 230000035755 proliferation Effects 0.000 description 2
- 229940055019 propionibacterium acne Drugs 0.000 description 2
- 238000011084 recovery Methods 0.000 description 2
- 230000035939 shock Effects 0.000 description 2
- 238000011895 specific detection Methods 0.000 description 2
- 238000003786 synthesis reaction Methods 0.000 description 2
- 238000002560 therapeutic procedure Methods 0.000 description 2
- 230000014616 translation Effects 0.000 description 2
- XLYOFNOQVPJJNP-UHFFFAOYSA-N water Substances O XLYOFNOQVPJJNP-UHFFFAOYSA-N 0.000 description 2
- 239000005541 ACE inhibitor Substances 0.000 description 1
- 208000035143 Bacterial infection Diseases 0.000 description 1
- 229940127291 Calcium channel antagonist Drugs 0.000 description 1
- OKTJSMMVPCPJKN-UHFFFAOYSA-N Carbon Chemical compound [C] OKTJSMMVPCPJKN-UHFFFAOYSA-N 0.000 description 1
- 108091006146 Channels Proteins 0.000 description 1
- 241000606161 Chlamydia Species 0.000 description 1
- 241000195493 Cryptophyta Species 0.000 description 1
- 206010011878 Deafness Diseases 0.000 description 1
- 241000196324 Embryophyta Species 0.000 description 1
- 108090000790 Enzymes Proteins 0.000 description 1
- 102000004190 Enzymes Human genes 0.000 description 1
- 241001646719 Escherichia coli O157:H7 Species 0.000 description 1
- LFQSCWFLJHTTHZ-UHFFFAOYSA-N Ethanol Chemical compound CCO LFQSCWFLJHTTHZ-UHFFFAOYSA-N 0.000 description 1
- 238000006424 Flood reaction Methods 0.000 description 1
- 229940123457 Free radical scavenger Drugs 0.000 description 1
- 230000005526 G1 to G0 transition Effects 0.000 description 1
- WQZGKKKJIJFFOK-GASJEMHNSA-N Glucose Natural products OC[C@H]1OC(O)[C@H](O)[C@@H](O)[C@@H]1O WQZGKKKJIJFFOK-GASJEMHNSA-N 0.000 description 1
- 229940122853 Growth hormone antagonist Drugs 0.000 description 1
- 102000002812 Heat-Shock Proteins Human genes 0.000 description 1
- 108010004889 Heat-Shock Proteins Proteins 0.000 description 1
- 241000282412 Homo Species 0.000 description 1
- 206010061218 Inflammation Diseases 0.000 description 1
- 241000712431 Influenza A virus Species 0.000 description 1
- 102000012750 Membrane Glycoproteins Human genes 0.000 description 1
- 108010090054 Membrane Glycoproteins Proteins 0.000 description 1
- 241001467552 Mycobacterium bovis BCG Species 0.000 description 1
- 241000204051 Mycoplasma genitalium Species 0.000 description 1
- 206010036790 Productive cough Diseases 0.000 description 1
- 241000589776 Pseudomonas putida Species 0.000 description 1
- 229940122388 Thrombin inhibitor Drugs 0.000 description 1
- 206010047163 Vasospasm Diseases 0.000 description 1
- 231100000764 actin inhibitor Toxicity 0.000 description 1
- 230000004913 activation Effects 0.000 description 1
- 230000006978 adaptation Effects 0.000 description 1
- 230000009603 aerobic growth Effects 0.000 description 1
- 210000004381 amniotic fluid Anatomy 0.000 description 1
- 230000009604 anaerobic growth Effects 0.000 description 1
- 239000012491 analyte Substances 0.000 description 1
- 239000004037 angiogenesis inhibitor Substances 0.000 description 1
- 229940044094 angiotensin-converting-enzyme inhibitor Drugs 0.000 description 1
- 230000001093 anti-cancer Effects 0.000 description 1
- 239000002260 anti-inflammatory agent Substances 0.000 description 1
- 230000000340 anti-metabolite Effects 0.000 description 1
- 230000002927 anti-mitotic effect Effects 0.000 description 1
- 230000001028 anti-proliverative effect Effects 0.000 description 1
- 230000000692 anti-sense effect Effects 0.000 description 1
- 239000002220 antihypertensive agent Substances 0.000 description 1
- 229940030600 antihypertensive agent Drugs 0.000 description 1
- 229940100197 antimetabolite Drugs 0.000 description 1
- 239000002256 antimetabolite Substances 0.000 description 1
- 239000003080 antimitotic agent Substances 0.000 description 1
- 239000003963 antioxidant agent Substances 0.000 description 1
- 229940127218 antiplatelet drug Drugs 0.000 description 1
- 239000003443 antiviral agent Substances 0.000 description 1
- 238000003556 assay Methods 0.000 description 1
- QVGXLLKOCUKJST-UHFFFAOYSA-N atomic oxygen Chemical compound [O] QVGXLLKOCUKJST-UHFFFAOYSA-N 0.000 description 1
- 208000022362 bacterial infectious disease Diseases 0.000 description 1
- 230000037358 bacterial metabolism Effects 0.000 description 1
- 230000004993 binary fission Effects 0.000 description 1
- 230000004071 biological effect Effects 0.000 description 1
- 239000012620 biological material Substances 0.000 description 1
- 230000031018 biological processes and functions Effects 0.000 description 1
- 230000005540 biological transmission Effects 0.000 description 1
- 230000000740 bleeding effect Effects 0.000 description 1
- 239000010836 blood and blood product Substances 0.000 description 1
- 229940125691 blood product Drugs 0.000 description 1
- 230000006931 brain damage Effects 0.000 description 1
- 231100000874 brain damage Toxicity 0.000 description 1
- 208000029028 brain injury Diseases 0.000 description 1
- 239000000480 calcium channel blocker Substances 0.000 description 1
- 238000004364 calculation method Methods 0.000 description 1
- 229910052799 carbon Inorganic materials 0.000 description 1
- 238000004113 cell culture Methods 0.000 description 1
- 239000006143 cell culture medium Substances 0.000 description 1
- 230000030833 cell death Effects 0.000 description 1
- 210000000170 cell membrane Anatomy 0.000 description 1
- 230000004663 cell proliferation Effects 0.000 description 1
- 230000001413 cellular effect Effects 0.000 description 1
- 238000012512 characterization method Methods 0.000 description 1
- 239000002738 chelating agent Substances 0.000 description 1
- 238000006243 chemical reaction Methods 0.000 description 1
- 210000003763 chloroplast Anatomy 0.000 description 1
- 239000000306 component Substances 0.000 description 1
- 238000009833 condensation Methods 0.000 description 1
- 230000005494 condensation Effects 0.000 description 1
- 238000010276 construction Methods 0.000 description 1
- 238000011109 contamination Methods 0.000 description 1
- 230000002596 correlated effect Effects 0.000 description 1
- 239000002537 cosmetic Substances 0.000 description 1
- 210000004748 cultured cell Anatomy 0.000 description 1
- 230000000120 cytopathologic effect Effects 0.000 description 1
- 229940127089 cytotoxic agent Drugs 0.000 description 1
- 231100000135 cytotoxicity Toxicity 0.000 description 1
- 230000003013 cytotoxicity Effects 0.000 description 1
- 230000003111 delayed effect Effects 0.000 description 1
- 238000004925 denaturation Methods 0.000 description 1
- 230000036425 denaturation Effects 0.000 description 1
- 238000013461 design Methods 0.000 description 1
- 230000014670 detection of bacterium Effects 0.000 description 1
- 238000009792 diffusion process Methods 0.000 description 1
- 201000010099 disease Diseases 0.000 description 1
- 208000037265 diseases, disorders, signs and symptoms Diseases 0.000 description 1
- 229940052760 dopamine agonists Drugs 0.000 description 1
- 239000003136 dopamine receptor stimulating agent Substances 0.000 description 1
- 230000000459 effect on growth Effects 0.000 description 1
- 230000001729 effect on metabolism Effects 0.000 description 1
- 238000002635 electroconvulsive therapy Methods 0.000 description 1
- 230000005670 electromagnetic radiation Effects 0.000 description 1
- 230000006353 environmental stress Effects 0.000 description 1
- 229940088598 enzyme Drugs 0.000 description 1
- 210000002615 epidermis Anatomy 0.000 description 1
- 230000001747 exhibiting effect Effects 0.000 description 1
- 239000000284 extract Substances 0.000 description 1
- 238000000855 fermentation Methods 0.000 description 1
- 230000004151 fermentation Effects 0.000 description 1
- 230000003328 fibroblastic effect Effects 0.000 description 1
- 238000011049 filling Methods 0.000 description 1
- 239000000706 filtrate Substances 0.000 description 1
- 239000012634 fragment Substances 0.000 description 1
- 239000000499 gel Substances 0.000 description 1
- 238000001415 gene therapy Methods 0.000 description 1
- 239000008103 glucose Substances 0.000 description 1
- 239000003102 growth factor Substances 0.000 description 1
- 230000010370 hearing loss Effects 0.000 description 1
- 231100000888 hearing loss Toxicity 0.000 description 1
- 208000016354 hearing loss disease Diseases 0.000 description 1
- 229910001385 heavy metal Inorganic materials 0.000 description 1
- 239000005556 hormone Substances 0.000 description 1
- 229940088597 hormone Drugs 0.000 description 1
- 235000003642 hunger Nutrition 0.000 description 1
- 230000001146 hypoxic effect Effects 0.000 description 1
- 239000003018 immunosuppressive agent Substances 0.000 description 1
- 229940125721 immunosuppressive agent Drugs 0.000 description 1
- 230000003116 impacting effect Effects 0.000 description 1
- 238000001566 impedance spectroscopy Methods 0.000 description 1
- 238000000338 in vitro Methods 0.000 description 1
- 238000001727 in vivo Methods 0.000 description 1
- 238000011534 incubation Methods 0.000 description 1
- 230000001939 inductive effect Effects 0.000 description 1
- 230000036512 infertility Effects 0.000 description 1
- 230000004054 inflammatory process Effects 0.000 description 1
- 206010022000 influenza Diseases 0.000 description 1
- 230000005764 inhibitory process Effects 0.000 description 1
- 208000014674 injury Diseases 0.000 description 1
- 239000012212 insulator Substances 0.000 description 1
- 230000003993 interaction Effects 0.000 description 1
- 230000005865 ionizing radiation Effects 0.000 description 1
- 201000003723 learning disability Diseases 0.000 description 1
- 230000000670 limiting effect Effects 0.000 description 1
- 230000007774 longterm Effects 0.000 description 1
- 230000002934 lysing effect Effects 0.000 description 1
- 229920002521 macromolecule Polymers 0.000 description 1
- 238000013507 mapping Methods 0.000 description 1
- 238000007567 mass-production technique Methods 0.000 description 1
- 210000002418 meninge Anatomy 0.000 description 1
- 230000004066 metabolic change Effects 0.000 description 1
- 230000004060 metabolic process Effects 0.000 description 1
- 230000006609 metabolic stress Effects 0.000 description 1
- 229910052751 metal Inorganic materials 0.000 description 1
- 239000002184 metal Substances 0.000 description 1
- 238000005142 microbroth dilution method Methods 0.000 description 1
- 231100000782 microtubule inhibitor Toxicity 0.000 description 1
- 210000003470 mitochondria Anatomy 0.000 description 1
- 210000003097 mucus Anatomy 0.000 description 1
- 229910052757 nitrogen Inorganic materials 0.000 description 1
- 239000000041 non-steroidal anti-inflammatory agent Substances 0.000 description 1
- 229940021182 non-steroidal anti-inflammatory drug Drugs 0.000 description 1
- 239000000615 nonconductor Substances 0.000 description 1
- 239000002773 nucleotide Substances 0.000 description 1
- 125000003729 nucleotide group Chemical group 0.000 description 1
- 230000003287 optical effect Effects 0.000 description 1
- 210000003463 organelle Anatomy 0.000 description 1
- 150000002894 organic compounds Chemical class 0.000 description 1
- 230000003204 osmotic effect Effects 0.000 description 1
- 230000003647 oxidation Effects 0.000 description 1
- 238000007254 oxidation reaction Methods 0.000 description 1
- 230000036542 oxidative stress Effects 0.000 description 1
- 229910052760 oxygen Inorganic materials 0.000 description 1
- 239000001301 oxygen Substances 0.000 description 1
- 230000036284 oxygen consumption Effects 0.000 description 1
- 230000020477 pH reduction Effects 0.000 description 1
- 229930029653 phosphoenolpyruvate Natural products 0.000 description 1
- 238000002428 photodynamic therapy Methods 0.000 description 1
- 230000035790 physiological processes and functions Effects 0.000 description 1
- 230000009894 physiological stress Effects 0.000 description 1
- 239000000106 platelet aggregation inhibitor Substances 0.000 description 1
- 108090000765 processed proteins & peptides Proteins 0.000 description 1
- 102000004196 processed proteins & peptides Human genes 0.000 description 1
- 238000001243 protein synthesis Methods 0.000 description 1
- 230000005180 public health Effects 0.000 description 1
- 239000002516 radical scavenger Substances 0.000 description 1
- 230000003439 radiotherapeutic effect Effects 0.000 description 1
- 239000002994 raw material Substances 0.000 description 1
- 230000009467 reduction Effects 0.000 description 1
- 230000001105 regulatory effect Effects 0.000 description 1
- 238000007634 remodeling Methods 0.000 description 1
- 230000010076 replication Effects 0.000 description 1
- 238000011160 research Methods 0.000 description 1
- 230000008261 resistance mechanism Effects 0.000 description 1
- 238000005316 response function Methods 0.000 description 1
- 210000003296 saliva Anatomy 0.000 description 1
- 150000003839 salts Chemical class 0.000 description 1
- 238000012216 screening Methods 0.000 description 1
- 210000000582 semen Anatomy 0.000 description 1
- 238000000926 separation method Methods 0.000 description 1
- 210000002966 serum Anatomy 0.000 description 1
- 238000012421 spiking Methods 0.000 description 1
- 230000002269 spontaneous effect Effects 0.000 description 1
- 230000007480 spreading Effects 0.000 description 1
- 238000003892 spreading Methods 0.000 description 1
- 210000003802 sputum Anatomy 0.000 description 1
- 208000024794 sputum Diseases 0.000 description 1
- 230000037351 starvation Effects 0.000 description 1
- 239000002731 stomach secretion inhibitor Substances 0.000 description 1
- 239000006228 supernatant Substances 0.000 description 1
- 208000024891 symptom Diseases 0.000 description 1
- 230000001360 synchronised effect Effects 0.000 description 1
- 210000001138 tear Anatomy 0.000 description 1
- 230000001225 therapeutic effect Effects 0.000 description 1
- 239000003868 thrombin inhibitor Substances 0.000 description 1
- 229960000103 thrombolytic agent Drugs 0.000 description 1
- 210000001519 tissue Anatomy 0.000 description 1
- 231100000167 toxic agent Toxicity 0.000 description 1
- 231100000027 toxicology Toxicity 0.000 description 1
- 238000013518 transcription Methods 0.000 description 1
- 230000035897 transcription Effects 0.000 description 1
- 238000012546 transfer Methods 0.000 description 1
- 230000009466 transformation Effects 0.000 description 1
- 230000008733 trauma Effects 0.000 description 1
- 241001148471 unidentified anaerobic bacterium Species 0.000 description 1
- 229940124549 vasodilator Drugs 0.000 description 1
- 239000003071 vasodilator agent Substances 0.000 description 1
- 230000003612 virological effect Effects 0.000 description 1
- 230000036642 wellbeing Effects 0.000 description 1
Images





Classifications
-
- C—CHEMISTRY; METALLURGY
- C12—BIOCHEMISTRY; BEER; SPIRITS; WINE; VINEGAR; MICROBIOLOGY; ENZYMOLOGY; MUTATION OR GENETIC ENGINEERING
- C12Q—MEASURING OR TESTING PROCESSES INVOLVING ENZYMES, NUCLEIC ACIDS OR MICROORGANISMS; COMPOSITIONS OR TEST PAPERS THEREFOR; PROCESSES OF PREPARING SUCH COMPOSITIONS; CONDITION-RESPONSIVE CONTROL IN MICROBIOLOGICAL OR ENZYMOLOGICAL PROCESSES
- C12Q1/00—Measuring or testing processes involving enzymes, nucleic acids or microorganisms; Compositions therefor; Processes of preparing such compositions
- C12Q1/02—Measuring or testing processes involving enzymes, nucleic acids or microorganisms; Compositions therefor; Processes of preparing such compositions involving viable microorganisms
Definitions
- Microbial contamination and infection is one of the greatest challenges to the survival and well-being of humans and animals, and as such continues to consume huge societal resources.
- An essential component of the effort to combat pathogens is assessing the presence and viability of prokaryotic and eukaryotic cells.
- Most commercially available methods capable of assessing cell viability routinely rely on cell growth to make this determination.
- a continuing limitation of these conventional approaches is their dependence on the doubling time of the cell population as well as the practical availability of the proper culturing conditions.
- methods based on biological growth in order to detect observable changes can require significant time. Therefore, existing methods can be ineffective for applications wherein time delays translate into economic costs and, in extreme cases, human lives. Even where existing detection methods are sufficient, more rapid detection could provide increased efficiencies and reduced costs.
- a majority of existing methods for determining the antibiotic susceptibility of a pathogen also rely on detection of growth, and rely exclusively on biomass increase due to continuous cell division of the pathogen in culture. Standard plating methods can require many days or even weeks, in the case of slow-growing pathogen, to yield drug-susceptibility results. Optical detection methods, while less time-consuming, still require significant time for the cells to grow to a detectable level. Time delays in obtaining susceptibility test results have led to the clinical practice of empirically prescribing therapies to treat life-threatening infections. The inability to identify antimicrobial-resistant cells in a timely manner results in the prescription of inappropriate therapies and consequently, unfavorable patient outcomes. The continuing emergence of drug resistant strains threatens our ability to treat life-threatening infections through a growing use of ineffective drugs.
- the disclosed invention provides a means for identifying antibiotic-resistant pathogens rapidly, thereby reducing the number of unnecessarily-prescribed antibiotics.
- Another on-going problem relates to the fact that a functional shelf-life of a unit of platelets, a blood product transfused to control bleeding, is only five days.
- the platelets In order to preserve their physiological function, the platelets must be stored at room temperature. Such conditions are favorable for the growth of many contaminant species of bacteria in the stored units. If not detected, this growth could lead to post-transfusion infection and septic reactions. Methods currently used to establish the sterility of these products require 48 hours time for fast-growing cells, and significantly longer for slow-growing cells in order to grow the cells to detectable levels. Consequently, the effective lifespan of a unit of platelets is reduced to only three days. A more rapid method for identifying fast- and slow-growing contaminant bacteria growing in platelets would increase the useful lifespan of the platelets and place less pressure on an already precious resource.
- Bacterial meningitis is an infection causing inflammation of the meninges.
- effective and rapid diagnosis is essential. Failure to diagnose and treat bacterial meningitis early can result in morbidity with serious, long-term complications including brain damage, hearing loss, learning disability, and death.
- the physician may prescribe an antibiotic for a suspected bacterial infection before any testing has begun.
- impedance sensing One method developed and used to detect the presence of viable cells faster is the impedance sensing of biological samples that measures metabolic deviations to monitor the proliferation of cells and subsequent population growth.
- impedance sensing has been used as an electronic analog of the Petri dish to monitor the proliferation of cells and subsequent population growth.
- Commercially available systems using this approach typically measure either conductance, capacitance, or the full impedance vector, that is, both resistive and reactive components, and use geometries with detection thresholds that require growth up to a million Colony Forming Units per milliliter (10 6 CFU/ml) or greater in the case of bacteria.
- obtaining that high titer requires significant time, especially if the bacteria belong to a slow-growing species.
- US 2002/0086277 A1 describes a method of determining the efficacy of a compound in treating a subject infected with a microbe, or a method of determining the minimum inhibitory concentration of an antimicrobial agent against a microbe, wherein the method involves the measurement of an electrical parameter of a culture of the microbe.
- US 6,051,422 A describes an apparatus and method for monitoring cells and a method for monitoring changes in cells upon addition of an analyte to the cell's environment, comprising a device which includes an array of microelectrodes disposed in a cell culture chamber, upon which array a portion of cells adhere to the surfaces of the microelectrodes.
- EP 1 764 417 A1 describes a method and apparatus for electrically measuring an adverse effect of toxic substances on prokaryotic cells which includes measuring a whole intracellular change caused by the presence of toxic substances as a change in an electric signal of cell membranes of the prokaryotic cells.
- the present invention fulfills this need.
- Various embodiments of the disclosed invention provide such methods that yield test results significantly faster than conventional methods relying on growth or biomass increase.
- the inventors of the disclosed subject matter have now discovered a method of monitoring a stress response from a cell, using impedance sensing to obtain this information.
- the change in impedance from a cell suspension caused by the stress response of living organisms to a stressor is immediate and more intense than the change in impedance from a cell suspension resulting from growth.
- the method described herein directly monitors changes in the level of stress response induced by different stressors by sensing changes in the impedance of a cell suspension. From these changes one can infer the presence or absence of viable cells, and the susceptibility of the cells to different stressors.
- the invention inter alia includes the following, alone or in combination.
- the invention related to a method for rapidly monitoring a stress response of a cell suspended in a medium to a stressor and determining the magnitude of the stress response, the method comprising: a) under conditions suitable for monitoring the voltage and/or the current, applying an electric field to a test sample comprising the cell suspended in the medium or to a test sample comprising the cell on a suspended micro culture bead; b) monitoring the voltage and/or the current; c) allowing a stressor to impact the test sample, wherein the stressor is chosen from a stressor applied prior to, a stressor applied substantially simultaneously with, and a stressor applied subsequent to the applying of the electric field; d) monitoring an initial impedance response of the test sample, wherein the initial impedance response of the test sample is an impedance change of the test sample during the period of transition from a first measurement of impedance of the test sample at about the time of applying the electric field up to and including a subsequently measured impedance of the test sample that is indicative of the stress response or
- the present invention relates, in another aspect, to a method for rapidly detecting the presence or absence of a cell by monitoring a stress response of the cell if said cell is present, or the absence of the stress response if said cell is absent or dead, the method comprising: a) under conditions suitable for monitoring the voltage and/or the current, applying an electric field to a test sample comprising the cell suspended in a medium or to a test sample comprising the cell on a suspended micro culture bead; b) monitoring the voltage and/or the current; c) allowing a stressor to impact the test sample, wherein the stressor is chosen from a stressor applied prior to, a stressor applied substantially simultaneously with, and a stressor applied subsequent to the applying of the electric field; d) at a specific time point or over a series of time points, measuring an initial impedance response of the test sample, wherein the initial impedance response of the test sample is an impedance change of the test sample during the period of transition from a first measurement of impedance of the test sample
- Yet another embodiment of the invention is a method for determining a predictive outcome for the susceptibility of a cell suspended in a medium to a selected concentration of a bio-active agent and a level of stress of the cell at the selected concentration of the bio-active agent, wherein the level of susceptibility of the cell is previously known or unknown, the method comprising: a) i) at specific time points or over a series of time points, measuring an initial impedance response of a test sample comprising: the cell suspended in a medium or of a test sample comprising the cell on a suspended micro culture bead, and the selected concentration of the bio-active agent; and measuring an impedance response of a reference sample comprising the medium and the selected concentration of the bio-active agent, wherein said reference sample is devoid of cells, and wherein the initial impedance response is measured within a period of about 45 minutes of the initial minutes of the measurement; ii) determining a First Impedance Response Treated Profile at each of the time points, wherein the First Impedance Response Tre
- kits comprising materials that are helpful or required for carrying out a method of the invention, and a set of instructions for use of the kit.
- the methods according to various embodiments of the invention facilitate the rapid and reliable detection of viable cells, identification of pathogens, and determination of the susceptibility of a pathogen to a particular drug.
- the present invention is directed to methods for rapidly detecting the presence of viable cells, identifying the cell type, and rapidly determining the susceptibility of the cell to an external agent.
- the invention provides significantly faster detection of viable cells and their corresponding susceptibilities compared to currently-used methods which rely on detecting biomass increase due to the growth of cultured cells or the lack thereof.
- one aspect of the invention provides a method for monitoring a stress response from a cell to a stressor, using impedance sensing to obtain this information.
- the invention in another aspect, relates to detecting the presence or absence of a viable cell, using impedance sensing to monitor the stress response of the cell to a stressor.
- the invention provides a method for determining the susceptibility of a cell to a selected concentration of a stressor comprising a bio-active agent, and a level of stress of the cell at the selected concentration of the bio-active agent, using impedance sensing to achieve this determination.
- the growth of a viable cell population is determined by the multiplication of one or more cells comprising that population.
- cells utilize available nutrients in order to accumulate energy predominantly in the form of ATP as well as NADPH and phosphoenolpyruvate (PEP), and synthesize biological macromolecules, such as DNA, RNA, proteins, lipids, and carbohydrates.
- PEP phosphoenolpyruvate
- Stressors can comprise chemical stressors, physical stressors, and biological stressors.
- chemical stressors include detergent treatment, alcohol treatment, antibiotic treatment, acidification or alkalization, oxidation, and contact with heavy metals.
- physical stressors include temperature shift, acoustic waves, pressure shock, osmotic pressure change, ionizing radiation, electric shock, and electromagnetic radiation.
- biological stressors include changes in media conditions, stationary phase after growth, nutrient deprivation, including, for example, carbon or nitrogen starvation, and hypoxia.
- stress and “stressor” refer to any combination of stressors which may be applied, modified and/or removed at various times.
- the measurement of impedance itself may be considered a stressor and can be used either alone or in conjunction with other stress factors.
- Activation of the stress response machinery usually occurs within minutes after the appropriate stimulus is applied and peaks at about 10 to 30 minutes, depending on the species. This response may last up to several hours or more depending on the severity of the stress. This period, which may be a different actual length for exceptional cell types, will be referred to as the initial response period.
- bio-active agent has the same meaning as “biologically active agent” and refers to any agent or substance that has or is capable of demonstrating any in vivo or in vitro activity.
- Non-limiting examples of chemical and biological bio-active agents useful in an embodiment of the invention include therapeutic substances and pharmaceutical agents, such as antimicrobial agents, antibiotics, thrombin inhibitors, antithrombogenic agents, thrombolytic agents, fibrinolytic agents, vasospasm inhibitors, calcium channel blockers, vasodilators, antihypertensive agents, inhibitors of surface glycoprotein receptors, antiplatelet agents, antimitotics, microtubule inhibitors, anti secretory agents, actin inhibitors, remodeling inhibitors, antisense nucleotides, anti metabolites, antiproliferatives (including antiangiogenesis agents), anticancer chemotherapeutic agents, anti-inflammatory steroid or non-steroidal anti-inflammatory agents, immunosuppressive agents, hormones, growth hormone antagonists, growth factors, dopamine agonists, radiotherapeutic agents, peptides, proteins, enzymes, extracellular matrix components, ACE inhibitors, free radical scavengers, chelators, antioxidants, anti polymera
- a stressor such as a bio-active agent is applied to the cell by a method comprising contacting the cell with the bio-active agent.
- the bio-active agent is chosen from a pharmaceutically active agent, such as an anti-cancer agent; a biological toxin; a virus; and another substance capable of producing stress, and combinations thereof.
- the stressor can create a stress or biotic stress or physiological stress.
- stress and “biotic stress” have the same meaning and refer to any adverse effect on metabolism, growth or viability of a cell population.
- the adverse effect can be produced by a living organism, a non-living or non-biological environmental stressor, such as temperature change.
- the stress response is characterized by significant retardation and/or redirection of most of the metabolic processes related to growth. These include a decrease in the level of ATP, NADPH, and PEP; inhibition of replication, and the increase of condensation of DNA, together with local denaturation in super-coiled DNA. In addition, RNA transcription, protein translation, and lipid and carbohydrates synthesis are also down-regulated.
- cell division arrest At this stage, stressed cells enter conditions which are characterized as cell division arrest. Consequently, all cells become synchronized in the same stage of their "growth cycle" and hence the majority of cells will begin cell division at a similar time after successfully transitioning through the stress period.
- cell division arrest after stress can last as long as four hours.
- stress response proteins are highly conserved among various species. Although some details of the stress responses to different factors, such as, for example, heat-shock, SOS, and oxidative stress, may differ at the molecular level, in most cases heat shock proteins (hsp) play the most important role in cell survival during and after the initial stress. Stress response proteins, especially hsp, are described for virtually all single-celled organisms and multi-cellular organisms of both prokaryotic, including the smallest known self-replicating cell, Mycoplasma genitalium, and another obligate intracellular bacterium, Chlamydophila trachomatis, and eukaryotic origin, including algae, plants, fungi, protozoa, animal and human cells. Even eukaryotic cell organelles, such as mitochondria and chloroplasts, encode their own hsp.
- prokaryotic including the smallest known self-replicating cell, Mycoplasma genitalium, and another obligate intracellular bacterium, Chlamydophila tracho
- Deviations in cellular metabolism are manifested by changes in the dielectric properties of a cell suspension.
- Cellular metabolism modifies the dielectric, reflecting a net change of charged compounds from metabolic products, changes in cell morphology, surface charge effects, and synthesis of highly charged molecules, such as DNA and RNA, along with salts, proteins, amino acids and other constituents that may be present in the medium.
- these changes to the dielectric properties of a cell suspension are measured by recording changes in the electrical impedance of the corresponding suspension.
- the method described herein directly monitors changes in the stress response of cells induced by different stressors by sensing changes in the impedance of a cell suspension. From these changes one can infer the presence or absence of viable cells, and the susceptibility of the cells to different stressors.
- the disclosed approaches are applicable to all prokaryotic cells or eukaryotic cells.
- the disclosed methods are particularly useful for determining the presence or absence of a pathogen and the susceptibility of the pathogen to a given concentration of a bio-active agent, such as an anti-microbial agent.
- the methods according to various embodiments of the invention include, for example, a method for rapidly monitoring a stress response of a cell to a stressor and determining the magnitude of the stress response; a method for rapidly detecting the presence or absence of a cell by monitoring a stress response of the cell if said cell is present, or the absence of the stress response if said cell is absent or dead; and a method for determining a predictive outcome for the susceptibility of a cell to a selected concentration of a bio-active agent and a level of stress of the cell at the selected concentration of the bio-active agent, wherein the level of susceptibility of the cell is previously known or unknown.
- the disclosed methods are particularly of use for testing bacteria, including pathogens of non-bacterial origin.
- the term "detecting” is intended to include, although is not limited to, determining the presence or absence of a cell, or quantifying the amount of the cells. The term thus refers to the use of the materials, compositions, and methods of the present invention for qualitative and quantitative determinations.
- Examples of eukaryotic cells suitable for use in a method according to an embodiment of the invention include protists, protozoa, fungi, a non-transformed human cell, a non-transformed animal cell, a transformed human cell, and a transformed animal cell, with the proviso that if the eukaryotic cell is adhesion-dependent, the test sample medium additionally comprises suspended micro culture beads comprising a coating of an extracellular matrix capable of adhesion with the eukaryotic cell.
- test sample medium and the reference sample medium additionally comprise suspended beads comprising a coating of specific receptors capable of adhesion with the prokaryotic or eukaryotic cells.
- the receptors can comprise biologically active components chosen from: components generated from immunological responses, components generated from nucleic acids, and components generated from other chemical or biochemical compounds that can be used to identify specific cells.
- a media suitable for use in a method according to an embodiment of the invention can be chosen from: one which will not support the viability of the cell and one which will support the viability of the cell for a period of time sufficient to measure a stress response.
- the choice of media will depend on the cell type and the nature of the test to be performed.
- suitable media include commercially available culture media, aqueous broths, gels, and agar-based media.
- the media have some electrically conductivity.
- sample refers to anything which may contain a moiety to be isolated, manipulated, measured, quantified, detected or analyzed using suitable devices according to the disclosed methods.
- the sample may be a biological sample, such as a biological fluid or a biological tissue or an environmental or industrial sample containing biological or suspected biological material.
- biological fluids include suspension of cells in a medium, such as cell culture medium, urine, blood, plasma, serum, saliva, semen, stool, sputum, cerebral spinal fluid, tears, mucus, amniotic fluid or the like.
- Examples of environmental or industrial samples include suspensions of cells in a water sample, a cosmetic sample, a food sample, a pharmaceutical sample, or the like.
- Embodiments of the present invention use impedance sensing in a way that allows for significantly more rapid detection of viable cells by detecting the impedance change due to stress response.
- the impedance response from a cell suspension correlates with the integrated metabolic activities within that suspension and provides significantly more information than other non-invasive methods that detect only increases in biomass during cell multiplication and the corresponding population growth.
- metabolic deviations can occur without cell division, and such metabolic changes would thus not be detected by other systems that rely on increases in biomass due to cell multiplication and the corresponding population growth.
- the disclosed methods of impedance sensing and analysis provide improved detection and analysis of cell stress in cell suspensions.
- the term "impedance" can be used to describe the bulk electrical properties of a sample and its respective ability to impede the flow of current. Impedance can be measured with time varying potentials or currents at some specified frequency. If a sinusoidal AC voltage is applied across the sample volume, at some frequency, v, a current will flow through the medium. The current, while alternating at the same frequency as the voltage will have some phase relationship to the applied voltage.
- the impedance of the sample is defined by the ratio of the magnitudes of the voltage and current and the relative phase angle between them.
- resistive component The physical interpretation of the impedance measurement is best described by the following two components: the resistive component and the reactive component. Resistance and reactance are properties which must be combined to find the impedance of a system. However, terms, such as “resistance” and “reactance” are sometimes loosely referred to as “impedance”, or as a representation of impedance.
- any known time-varying signal containing a set of frequency components can be used to drive a sample for the purpose of determining impedance parameters associated with the sample.
- this signal can be a voltage, a current, or some combination of voltage and current. It can contain many different frequency components simultaneously, and in the case of "bandlimited white noise", it can contain every frequency within a certain bandwidth.
- a corresponding response of current, voltage, or voltage and current can be measured.
- the impedance of the sample is the ratio of complex voltage to complex current.
- This impedance can be represented by a pair of numbers, such as magnitude and phase, or real and imaginary. Under certain conditions, the response may contain frequency components that were not in the drive signal and therefore may contain additional information about the sample.
- Alternating current allows for easier determination of a critical property, the capacitance that is relevant to the methods according to various embodiments of the present invention.
- a simple capacitor may comprise a pair of electrical conductors, such as metal plates, separated by a non-conductor or insulator. The amount of separated electrical charge that can be stored or held on the capacitor per unit of electrical potential between the conductors may be referred to as its capacitance. Measurements of a cell suspension encompassed by two electrodes can be thought of as a biological capacitor.
- each individual impedance value measured over a sample interval is no less than a two-dimensional vector and the change between every pair of samples is at least a two-dimensional vector.
- a separate set of vector data points can be generated for every possible drive signal.
- Each drive signal may be composed of a single frequency component or any realizable set of frequencies.
- the system can switch between various different drive signals during the testing of a single sample to generate even more information.
- the output frequencies will be different than the input frequencies, thus providing even more information within the impedance response profile. It can be difficult for one to think about or visualize the enormous amount of information that is contained within the impedance response, and therefore, simpler representations are often used. For example, references to capacitance, resistance, reactance or positive and negative signals can be convenient for representing and interpreting the results.
- This vast multidimensional space of the impedance response can be mathematically transformed into an infinite number of one-dimensional or multi-dimensional representation spaces. Of course, it is possible to align or transform a coordinate space to have its axes better correspond to any particular behavior or property of interest.
- any reference to a particular sign or quantity could easily be changed mathematically without impacting the principles underlying this invention.
- differential methods are used in order to obtain an improved level of precision.
- resulting impedance profiles reflect a comparison of measurements from a pair of sterile, mechanically identical chambers.
- the first chamber can be filled with a medium containing stressed cells, while the second chamber contains sterile medium and no cells.
- the first chamber can be filled with medium and un-stressed cells, and a stressor can be added to the medium.
- the second chamber serving as a reference, is positioned in close proximity to the first, so that both volumes are subjected to nearly identical thermal and mechanical perturbations, providing a means for common-mode rejection.
- a small alternating current (A.C.) voltage is applied across the two electrodes, creating a parallel plate capacitor.
- Stressed cells in the first chamber change the dielectric properties of the cell suspension in response to the stress. Some changes in the dielectric can also be seen in the second chamber derived from interactions between organic compounds in the medium, also common to the first chamber. The changes in the impedance profiles of the samples in both chambers over time are compared. Any differences detected between the two samples reflect the cellular activities caused exclusively by the stress response of the organisms.
- an initial impedance response of a test sample of the cell suspension following application of a stressor is measured.
- the "initial impedance response" of a sample such as the test sample, is an impedance change of the test sample during the period of transition from a first measurement of impedance of the test sample at about the time of applying the electric field up to and including a subsequently measured impedance of the test sample that is indicative of the stress response or non-growth.
- the subsequently measured impedance of the test sample can be at time when the non-growth would begin to be detected.
- the "initial impedance response" as described above can refer to a period of transition of a measurement of impedance of the test sample.
- the “initial impedance response” can refer to a period of transition of a measurement of impedance of a sample modified by a related measurement obtained at about a similar time.
- an Impedance Response Profile (IRP) of the test sample is determined.
- the IRP is based on the mathematical comparison of the level of the measured initial impedance response of the test sample with a standard value.
- the IRP can be based on a mathematical comparison of a measurement of the impedance of a test sample with a standard value prior to the mathematical construction of the initial impedance response.
- the standard value can be the measured initial impedance response value or the measured impedance of a first reference sample comprising the medium with or without the stressor, and wherein the first reference sample is devoid of cells.
- the standard value can be the measured initial impedance response value or the measured impedance of a second reference sample comprising the cell and the medium, wherein the cell is of the same concentration as the cell in the test sample, wherein the second reference sample is devoid of the stressor, and wherein the initial impedance response of the second reference sample is an impedance change of the second reference sample during the period of transition from a first measurement of impedance of the second reference sample at about the time of applying an electric field up to and including a subsequently measured impedance of the test sample that is indicative of the stress response or non-growth.
- the IRP reflects the metabolic deviations occurring within the suspension of cells.
- the value of IRP when the value of IRP is constantly increasing over a period of time significantly exceeding the doubling time of the cell population, growth is occurring.
- the value of the IRP When the value of the IRP is decreasing over a period of time less than or approximately equal to the doubling time of the cell, stress is occurring.
- the absence of growth (i.e. cell division) for cells under stress is defined by the measurement of a second value of the IRP that is lower than the value recorded in a first earlier measurement by an amount exceeding the statistical uncertainty of the two measurements. While a decrease of the value of the IRP is sufficient to determine stress, it is not always necessary.
- the assessment of stress or the absence of growth can be recognized by both statistically significant increasing values of the IRP followed by subsequent decreasing values, or statistically significant decreasing values of the IRP followed by subsequent increasing values over a period of time less than or approximately equal to the doubling time of the cell population. Stress can also be inferred by an IRP from stressed cells that is less than the IRP from cells that are un-stressed.
- the end of the period of stress and the corresponding start of growth can be determined by the impedance response profile at a time greater than the doubling time of the cell population at a point of infection where the slope of the impedance response profile changes from a negative slope to a positive slope.
- the measurement of the stress response can also be differentiated from growth by comparing the response profiles to data sets from previously recorded experiments. By matching the impedance behavior to known responses from similar experiments, a determination can be made at a specific time for any desired statistical confidence interval. As greater statistical confidence is desired, the length of time comprising the initial impedance response can be extended. Also, the degree to which the results being measured match stored sets of expected values may also extend the initial impedance response in order to increase statistical confidence.
- the stress and growth responses are distinct and their parameterization may be adjusted by using the doubling times of the particular cell populations within the sample being tested.
- analysis of the IRP can enable, for example, detection of a cell, determination of information regarding the response of a cell to a given stressor, and determination of the susceptibility of a cell to a given concentration of a bio-active agent.
- an embodiment of the disclosed impedance technology can be implemented in an easy-to-operate, relatively low-cost device.
- the system can be designed using a cassette housing a panel of sensitive test chambers.
- the cassette may be of a disposable type.
- all sensing elements are integrated within a planar mesoscale sized cassette having a form factor similar to a credit card and ideal for established mass production techniques.
- the use of mesoscale geometry enables the testing of samples with practical volume sizes without the additional concentration of cells while generating signals having high signal gain for sensitive measurements.
- the cassette can be inserted into a readout fixture that monitors the impedances, analyzes, displays, and records the information.
- a readout fixture that monitors the impedances, analyzes, displays, and records the information.
- Fig. 1 is a schematic diagram for a cassette (20), showing a cassette (26) based on a planar geometry. Internal to each cassette (26) is a panel of detection chambers (32) as shown in Fig. 2 . Each chamber (32) is constructed with two electrodes (34) having relatively small separation gaps. As used herein, the term "electrode” is a structure having a high electrical conductivity, that is, an electrical conductivity much higher than the electrical conductivity of the surrounding materials.
- a test sample is injected by the user directly into a fill port (22) located on the cassette (26) and the sample is distributed to the detection chamber (32).
- the cassette (26) is inserted within an analyzer device (28) for readout. The electrical impedance of each chamber is recorded, monitoring the respective changes in the dielectric properties of the cell suspensions.
- Each electrode (34) may be composed of one or more materials that may or may not produce an electrochemical effect within the sample.
- Stress may be applied to the test samples by allowing a stressor to impact the test sample, wherein the stressor is chosen from a stressor applied prior to, a stressor applied substantially simultaneously with, and a stressor applied subsequent to the applying of the electric field or the filling of the detection chambers (32).
- Fig. 2 is a schematic block diagram (30) depicting an impedance monitoring detection system.
- the platform comprises a cassette (26) containing multiple detection chambers (32), each chamber (32) having two electrodes (34); and an analyzer (28), as shown schematically in Fig. 1 , that accepts the cassette (26), and monitors the stress response of a cell suspension in real-time.
- the analyzer (28) comprises the switching relay (36), the Precision LCR meter (38), the GPIB Interface (40), the computer or PC (41), and the Thermocouple DAQ (42).
- a generalized description of operation of the system according to an embodiment of the invention follows.
- a manually filled meso-scale research grade test cassette (26) with two independent biological samples in separate detection chambers (32) is inserted into a thermally insulated mounting fixture to hold the cassette (26) stable during measurement, maintain thermal stability, and make electrical contact with the analyzer (28).
- the fixture includes two thermally controlled platens on which electrical guards are mounted to shield the cassette (26) from stray capacitances.
- the temperature of the platens is monitored using an embedded thermocouple, and recorded using a data acquisition system (DAQ) (42) (such as those manufactured by National Instruments).
- DAQ data acquisition system
- the impedance may be measured using a commercially available meter, AGILENT® 4284A Precision LCR meter (38) (AGILENT® Technologies, Inc., Palo Alto CA).
- AGILENT® Technologies, Inc. Palo Alto CA
- This impedance meter (38) was capable of monitoring only a single channel at any one time and therefore a switching relay box (36) was built to toggle between the two detection chambers (32).
- the AGILENT® meter (38) communicated with a computer (41) using a standard GPIB board interface (40).
- the computer (41) recorded, analyzed, and displayed the data.
- a software program available from BioSense Technologies, Inc., Woburn, MA, was written to provide an easy-to-use interface for both running experiments and performing basic analysis.
- the system operated on alternating current (A.C.) with measurements made at about one kiloHertz (1kHz); however adjustments can be made with no more than routine experimentation.
- A.C. alternating current
- the impedances of the two detection chambers (32) are recorded monitoring changes in the dielectric properties of the biological suspension.
- the respective dielectric properties are modified due to cellular metabolism by the net change of charged compounds from metabolic products, changes in cell morphology, surface charge effects, DNA, RNA, and other highly charged molecules, such as proteins and amino acids.
- the comparison used to determine the IRP for Example 1 was the ratio of the capacitive component of the impedance at each measurement time of the chamber containing cells to that with medium only.
- a disclosed method for rapidly monitoring a stress response of a cell to a stressor, and determining the magnitude of the stress response comprises: a) under conditions suitable for monitoring the voltage and/or the current, applying an electric field to a test sample comprising the cell and a medium; b) monitoring the voltage and/or the current; c) allowing a stressor to impact the test sample, wherein the stressor is chosen from a stressor applied prior to, a stressor applied substantially simultaneously with, and a stressor applied subsequent to the applying of the electric field; d) monitoring an initial impedance response of the test sample, wherein the initial impedance response of the test sample is an impedance change of the test sample during the period of transition from a first measurement of impedance of the test sample at about the time of applying the electric field up to and including a subsequently measured impedance of the test sample that is indicative of the stress response or non-growth, thereby monitoring the stress response of said cell to the stressor; and e) determining the level of the initial impedance response of
- the disclosed method for monitoring a stress response of a cell and determining the magnitude thereof can further comprise mathematically comparing the level of the initial impedance response of the test sample determined in step (e) with: (i) a first standard value that represents the impedance response of a first reference sample comprising the medium with or without the stressor, and wherein the first reference sample is devoid of cells; and/or (ii) a second standard value that represents the initial impedance response of a second reference sample comprising a cell and the medium, wherein the cell in the reference sample is of the same type and concentration as the cell in the test sample, and wherein the reference sample is devoid of the stressor; and determining a value for a First Impedance Response Profile of the test sample, the value for the First Impedance Response Profile based on the mathematical comparison of the level of the initial impedance response of the test sample determined in step (e) with the first standard value and/or the second standard value.
- Example 1 relates to an experiment demonstrating an immediate initial impedance response from heat-shock stressed E. coli as compared to un-stressed E. coli.
- the cassette was inserted into the thermally controlled analyzer held at 37 degrees Celsius (37°C) and the full impedance vector was recorded.
- the capacitance components of the initial impedance signals were analyzed. A similar effect can be seen by analyzing other representations of the impedance vector.
- a single colony from overnight culture on LBA was picked with sterile loop, re-suspended in phosphate buffered saline (PBS) and heated at 45 degrees Celsius (45°C) for 30 minutes. After the shock treatment was applied, the bacterial suspension was diluted in TSB and transferred directly into one of the cassette chambers while the adjacent chamber was filled with TSB. As before, the cassette was inserted into the thermally controlled analyzer held at 37 degrees Celsius (37°C) and the capacitance signals were recorded.
- PBS phosphate buffered saline
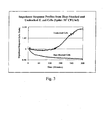
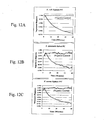
- Fig. 3 is a graphical representation of the Initial Impedance Response Profile for the un-stressed (top curve) and the heat-shocked (bottom curve) E. coli in TSB at 37 degrees Celsius (37°C).
- Initial titers were 5.6 x 10 3 CFU/ml for the un-stressed cells and 4.4 x10 3 CFU/ml for the heat-stressed cells.
- the absence of growth (i.e. cell division) for cells under stress can be defined by the measurement of a second impedance response value that is lower than the value recorded in a first earlier measurement by an amount exceeding the statistical uncertainty of the two measurements.
- an unambiguous initial impedance response is recognizable with high statistical confidence in less than 30 minutes.
- This elapsed time is also within the approximate population doubling time for this bacterial species in the sample being tested. Taking into account that these cells are in cell division arrest caused by stress, this serves as evidence of the absence of growth during the time necessary for our measurements.
- the impedance response from stressed viable cells and their consequent detection is both a faster and potentially more powerful than the impedance response observed during conventional growth (that is, cell proliferation).
- the disclosed method for rapidly detecting the presence or absence of a cell by monitoring a stress response of the cell if said cell is present, or the absence of the stress response if said cell is absent or dead comprises: a) under conditions suitable for monitoring the voltage and/or the current, applying an electric field to a test sample comprising the cell and a medium; b) monitoring the voltage and/or the current; c) allowing a stressor to impact the test sample, wherein the stressor is chosen from a stressor applied prior to, a stressor applied substantially simultaneously with, and a stressor applied subsequent to the applying of the electric field; d) at a specific time point or over a series of time points, measuring an initial impedance response of the test sample, wherein the initial impedance response of the test sample is an impedance change of the test sample during the period of transition from a first measurement of impedance of the test sample at about the time of applying the electric field up to and including a subsequently measured impedance of the test sample that is indicative of the stress response or non-
- the detection method can further comprise confirming the presence or absence of said cell in the test sample by: (i) measuring an impedance response of a first reference sample comprising the medium with or without the stressor, and wherein the first reference sample is devoid of cells; and/or (ii) measuring an initial impedance response of a second reference sample comprising said cell and the medium, wherein said cell is of the same concentration as said cell in the test sample, wherein the second reference sample is devoid of the stressor, and wherein the initial impedance response of the second reference sample is an impedance change of the second reference sample during the period of transition from a first measurement of impedance of the second reference sample at about the time of applying an electric field up to and including a subsequently measured impedance of the test sample that is indicative of the stress response or non-growth; comparing the initial impedance response of the test sample obtained in step (d) with the impedance response of the first reference sample and/or the initial impedance response of the second reference sample; and assessing the comparison of step (ii
- the Impedance Response over a 14-hour period is plotted in Figure 5 from the captured heat-shocked E. coli, along with measurements of similarly captured but un-stressed E . coli.
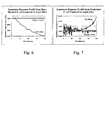
- the impedance response value from un-stressed cells begins to increase at approximately 60 minutes and is unambiguously recognizable by 180 minutes (see Figure 7 ).
- the curve eventually peaks at about 7 hours, followed by a decrease for about 2 hours before increasing once again. This increasing signal, peaking, and subsequent decrease has been correlated with oxygen consumption (hypoxic stress) and its eventual depletion in the growth medium, and corresponds to aerobic growth followed by hypoxia and anaerobic growth for the facultative anaerobe.
- Fig. 5 the impedance response from un-stressed cells is compared directly with the impedance response from stressed heat-shocked cells (lowest curve) having commensurate cell densities (approximately 1000 CFU/ml) along with a negative control containing no cells (flat, middle curve).
- the value of the impedance response during the cellular stress response is seen to dominate that from un-stressed cells both in intensity and detection time.
- the value of the impedance response from the stressed cells immediately decreases reaching a minimum at 7 hours before exhibiting a response similar to that of normal or un-stressed cells.
- the recovery and subsequent re-entering into the growth state of the heat-shocked cells, as measured by their corresponding impedance response is delayed by over 5 hours as expected.
- the intensity of the response is much greater and its onset is much faster than the impedance response from un-stressed cells, thereby demonstrating that the initial impedance response from the shocked cells is both stronger and more immediate than the impedance response for un-stressed cells.
- Fig. 6 and Fig. 7 The impedance responses during the initial measurement periods from the respective growth curves are plotted in Fig. 6 and Fig. 7 for side-by-side comparison.
- Examination of Fig. 6 shows that the unambiguous decrease in the value of the impedance response from 1.2 x 10 3 CFU/ml of stressed E. coli can be detected in as little as 15 minutes with this new method when measuring the initial impedance response, over 10 times faster than with the sensitive impedance monitoring of the growth of un-stressed bacteria. This is to be compared with 14 hours or more for conventional detection methods.
- Example 3 Impedance Response during the initial 8 hours of growth of E. coli
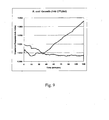
- the impedance response recorded during the initial 8 hours of growth of E. coli (spike - 120 CFU/ml) retrieved from spiked apple juice is plotted in Fig. 8 .
- the initial 120 minutes of the measurement have been expanded and re-plotted as an insert in the same figure.
- the negative sloping response seen during the first 30 minutes prior to the onset of the well-defined increasing signal is interpreted as biological activity of the viable but not dividing cells experiencing the so called "new medium" stress.
- this period of bacterial growth is called the lag phase or time necessary for bacterial adaptation to new culture conditions.
- the microbial lag phase is a complex and yet not completely understood phenomenon.
- We note that 1.) the Impedance Response from stressed cells is similar to that from un-stressed cells during lag phase and 2.) stressed cells returning to optimal growth conditions show longer lag phases.
- an inoculum of 145 CFU/ml of E. coli in a 1:1 V/V mixture of urine and TSB medium suspension was monitored in one chamber along with the medium-urine mixture only in the other.
- the Impedance Response Profile which is the calculated ratio of the respective two capacitive components of the impedance signals, is plotted in Fig. 9 along with a negative control (urine/medium only in both chambers) and characterizes the lag phase and subsequent growth occurring within the bacterial suspension.
- the "initial impedance response” comprises the decrease in the value of the impedance response profile that is observed during the initial 45 minutes of the measure and is detectable well before then.
- the onset of the well-defined increase in the impedance response profile corresponds to growth.
- the inflection point at 45 minutes where the slope of the impedance response profile changes from a negative slope to a positive slope corresponds to the end of the stress response and the beginning of the growth in population.
- the initial impedance response reflects a mild stress response of the bacterial cells resulting from the environmental stress after transfer into new media (the so-called "new media” stress). We note that these data correspond to the detection of only 4 bacterial cells (statistical estimate) within the 28.3 microliter ( ⁇ l) test volume used to generate these data.
- the invention provides a method for determining a predictive outcome for the susceptibility of a cell to a selected concentration of a bio-active agent and a level of stress of the cell at the selected concentration of the agent, the method comprising: a) i) at specific time points or over a series of time points, measuring an initial impedance response of a test sample comprising: the cell, a medium, and the selected concentration of the bio-active agent; and measuring an impedance response of a reference sample comprising the medium and the selected concentration of the bio-active agent, wherein said reference sample is devoid of cells; ii) determining a First Impedance Response Treated Profile at each of the time points, wherein the First Impedance Response Treated Profile is a mathematical comparison of the initial impedance response of the test sample determined in step a)(i) and the impedance response of the reference sample determined in step a)(i) at each time point; iii) optionally, repeating steps a)(i) and a)(
- An embodiment of the above-described method can further be characterized as follows:
- the mathematical comparison in step a) ii) of the initial impedance response of the test sample determined in step a)(i) and the impedance response of the reference sample determined in step a)(i) at each time point is chosen from: a ratio of the impedance response of the test sample determined in step a) i) and the impedance response of the reference sample determined in step a) i) at each time point, and a difference between the impedance response of the test sample determined in step a) i) and the impedance response of the reference sample determined in step a) i) at each time point.
- the algorithm used to determine the NIR is chosen from a mathematical ratio or an absolute difference between the First Impedance Response Treated Profile value and the First Impedance Response Untreated Profile value.
- the method further comprises: repeating steps a), b), and c) with a second cell having an unknown susceptibility to the bio-active agent, wherein the second cell is of the same type as the cell previously known to be susceptible to the bio-active agent, thereby determining the Normalized Impedance Response value, NIR UNK , for the cell having unknown susceptibility to the bio-active agent; comparing the NIR UNK value at the selected concentration, for the cell having unknown susceptibility to the bio-active agent, to the NIR value at the selected concentration for the cell of the strain previously known to be susceptible to the bio-active agent; and if the NIR UNK value at the selected concentration is greater than the NIR value at the selected concentration for the cell previously known to be susceptible to the bio-active agent, then predicting that the cell having unknown susceptibility to the bio-active agent is less susceptible to the bio-active agent at the
- the method further comprises: for the specific time points or for the series of time points, plotting, as a function of time, the First Impedance Response Treated Profile for each different selected concentration of the bio-active agent, and the First Impedance Response Untreated Profile of the second test sample comprising the cell and the medium, wherein the second test sample is devoid of the bio-active agent, thereby obtaining a family of curves for the selected concentrations of the bio-active agent and for the untreated cell; calculating an average slope of each curve at a selected time point; obtaining a normalized slope value for each First Impedance Response Treated Profile by dividing the value of the average slope of each curve at the selected time point by the value of the slope of the First Impedance Response Untreated Profile curve; or by otherwise modifying the value of the average slope of each curve at the selected time point by the value of the slope of the First Impedance Response Untreated Profile curve;
- the described impedance-based method overcomes this obstacle to determine the drug susceptibility of culturable and viable but non-culturable organisms rapidly by monitoring the microorganism's corresponding initial impedance response to the applied stress during exposure to antimicrobial compounds.
- Impedance data for susceptible and resistant strains of the slow-growing bacterium Mycobacterium bovis BCG ( M. bovis ) exposed to isoniazid (INH) are introduced as a demonstration of the method.
- Impedance Response profiles obtained from the target and reference capacitance signals for five INH drug concentrations (0 to 12.5 ⁇ g/ml) were obtained and are plotted in Fig. 10 .
- Each profile infers the stress response from the sensitive M. bovis strain and shows that the organism's stress response varies with the drug concentration and reflects its susceptibility to the drug.
- a spontaneous mutant of M. bovis resistant to INH was isolated and characterized. This was accomplished by isolating mutant colonies from a 7H10 drug plate containing gradient concentrations of INH ranging from 0 to 63 ⁇ g INH/ml (equivalent to 0 - 10x minimum inhibitory concentration (MIC) of the sensitive strain) followed by subsequent re-culturing on a second fresh 7H10 agar drug plate having a 25 ⁇ g/ml (4x MIC) concentration of INH.
- MIC minimum inhibitory concentration
- the drug susceptibility of this mutant was quantified using standard micro-broth dilution method and the corresponding MIC for INH R -4, the mutant selected for the impedance measurements, had a value of approximately 50 ⁇ g/ml (8x MIC of the sensitive strain) confirming its resistance.
- the impedance responses from the resistant mutant grown in the presence or absence of a drug (12.5 ⁇ g/ml INH (2x MIC)) versus a control (medium containing no cells) were obtained. These measured impedance responses were identical to each other and also similar to that of the sensitive strain grown without a drug as shown in Fig. 10 . In addition, the curves are qualitatively distinct from the flat response of a negative control containing no cells.
- the "normalized" value of the slope equals one indicating that exposure to 12.5 ⁇ g/ml of INH has no affect on the viability of the resistant mutant -- consistent with its measured susceptibility threshold of 8x MIC.
- the normalized slope value for the resistant strain, INH R -4, ( Fig. 11 -square at top right) is seen far outside of the data trend for the sensitive strain identifying it as highly resistant to INH.
- Drug susceptibility information is normally obtained from multiple drug dilution measurements via numerous single-point growth experiments or by means of a diffusion gradient. The method described here extracts this same information from multiple measurements over time but using a single drug concentration.
- the data plotted in Fig. 11 demonstrate a one-to-one relationship between drug concentration and the impedance derived parameter.
- calculation of this derived parameter from a measured time series data when plotted versus the actual drug concentration used represents the corresponding stress level inferring the susceptibility of the cell to the drug. This is accomplished by developing an algorithm and the compilation of a database for different cells and drugs.
- PC human platelet concentrates
- WBCs residual white blood cells
- RBCs red blood cells
- advantage is taken of the fragility of the platelets and other human blood cells as compared to any contaminant bacteria.
- a mild detergent was added to the PC sample lysing all blood cells while simultaneously inducing metabolic stress in any contaminant bacteria.
- the former eliminates any potential interference from metabolically active human cells that could contribute unwanted signal; the latter provides a measurable impedance response identifying presence of viable bacteria in the sample by their specific stress response.
- the suspension was passed through filters designed to pass and obstruct bacteria for the target and reference samples, respectively.
- the remainder of the PC was used for spiking with the model bacteria. In each case, spikes on the order of 10 3 CFU/ml were obtained. Immediately after the spike, the described lysis/filtration protocol was applied and the cassette detection chambers were filled. The cassette was inserted into the temperature controlled analyzer, the capacitances of the two chambers were recorded, and the Impedance Response was calculated. Starting and ending bacterial cell numbers were enumerated using standard plating methods and CFUs were consistent with no statistically significant loss in titers or viability.
- the initial impedance responses for Gram-negative Escherichia coli 4 x 10 3 CFU/ml
- Gram-positive Staphylococcus epidermidis 3.2 x 10 3 CFU/ml
- the slow growing Gram-positive anaerobe Propionibacterium acnes 2.8 x 10 3 CFU/ml
- the measured values of the impedance response from all three bacteria exposed to the stressor clearly differ from the flat impedance response of the negative control data and continuously decrease in value establishing an unambiguous trend easily detected within 15 minutes.
- the Impedance Response from stressed microorganisms in a complex sample is qualitatively similar to that from stressed microorganisms in conventional media.
- the method works equally well when detecting anaerobic bacteria ( P. acnes ) as when detecting aerobic ( S. epidermidis) or facultative anaerobic ( E. coli ) species.
- the Impedance Responses from the three different bacteria are quantitatively different. We suggest that these differences result from i.) diverse metabolic responses from the different species, ii.) varying bacterial cell numbers, iii) different sensitivity to stressor used in the study, and iv.) cassette to cassette mechanical variations resulting in different signal gain.
- kits to facilitate carrying out the methodology are disclosed herein.
- One embodiment of a disclosed kit is useful for rapidly detecting, according to the disclosed method, the presence or absence of a cell in a test sample of a medium.
- the kit comprises: at least one stressor previously known to cause a stress response in the cell, if the cell is present in the test sample; and a set of directions for using the components of the kit according to the method of Claim 6 for detecting the presence or absence of the cell in the test sample.
- kits for determining the presence or absence of a viable cell within a test sample.
- the kit comprises: a) a medium from which a suspension of a test sample and a stressor can be prepared for testing; and b) a set of directions for using the components of the kit according to the disclosed method of Claim 14 for determining the level of the initial impedance response of the test sample and stressor, a predictive outcome for the viability of the cell, and a level of stress of the cell at the selected concentration of the bio-active agent.
- kits facilitates the determination, according a disclosed method, of the susceptibility of a cell to a selected concentration of a bio-active agent and a level of stress of the cell at the selected concentration of the bio-active agent.
- the kit for determining susceptibility comprises: a) a medium from which a suspension of a test sample of the cell and a suspension of each concentration of the bio-active agent can be prepared for testing; and b) a set of directions for using the components of the kit according to a disclosed method, and to determine a level of stress of the cell at the selected concentration of the bio-active agent.
Landscapes
- Chemical & Material Sciences (AREA)
- Organic Chemistry (AREA)
- Life Sciences & Earth Sciences (AREA)
- Zoology (AREA)
- Wood Science & Technology (AREA)
- Proteomics, Peptides & Aminoacids (AREA)
- Health & Medical Sciences (AREA)
- Engineering & Computer Science (AREA)
- Microbiology (AREA)
- Biochemistry (AREA)
- Physics & Mathematics (AREA)
- Molecular Biology (AREA)
- Biotechnology (AREA)
- Biophysics (AREA)
- Analytical Chemistry (AREA)
- Immunology (AREA)
- Bioinformatics & Cheminformatics (AREA)
- General Engineering & Computer Science (AREA)
- General Health & Medical Sciences (AREA)
- Genetics & Genomics (AREA)
- Measuring Or Testing Involving Enzymes Or Micro-Organisms (AREA)
- Investigating Or Analyzing Materials By The Use Of Electric Means (AREA)
Description
- Microbial contamination and infection is one of the greatest challenges to the survival and well-being of humans and animals, and as such continues to consume huge societal resources. An essential component of the effort to combat pathogens is assessing the presence and viability of prokaryotic and eukaryotic cells. Most commercially available methods capable of assessing cell viability routinely rely on cell growth to make this determination. However, a continuing limitation of these conventional approaches is their dependence on the doubling time of the cell population as well as the practical availability of the proper culturing conditions. Especially in the case of slow-growing cells, methods based on biological growth in order to detect observable changes can require significant time. Therefore, existing methods can be ineffective for applications wherein time delays translate into economic costs and, in extreme cases, human lives. Even where existing detection methods are sufficient, more rapid detection could provide increased efficiencies and reduced costs.
- Increasing antibiotic resistance of pathogens has led to a global public health problem manifested in untreatable infections in the human population generally, and on farms. Although the problem is complex, it is known that the increasing use of antibiotics has created selective evolutionary pressures wherein many species of bacteria and infectious protozoa have developed resistance mechanisms, making the antibiotics often prescribed to treat disease no longer effective, and resulting in the spreading of bacterial strains resistant to antibiotics.
- A majority of existing methods for determining the antibiotic susceptibility of a pathogen also rely on detection of growth, and rely exclusively on biomass increase due to continuous cell division of the pathogen in culture. Standard plating methods can require many days or even weeks, in the case of slow-growing pathogen, to yield drug-susceptibility results. Optical detection methods, while less time-consuming, still require significant time for the cells to grow to a detectable level. Time delays in obtaining susceptibility test results have led to the clinical practice of empirically prescribing therapies to treat life-threatening infections. The inability to identify antimicrobial-resistant cells in a timely manner results in the prescription of inappropriate therapies and consequently, unfavorable patient outcomes. The continuing emergence of drug resistant strains threatens our ability to treat life-threatening infections through a growing use of ineffective drugs.
- There is an ongoing need to reduce the indiscriminate and non-essential use of antibiotics in order to significantly improve patient outcomes and also reduce the spread of bacteria resistant to antibiotics. The disclosed invention provides a means for identifying antibiotic-resistant pathogens rapidly, thereby reducing the number of unnecessarily-prescribed antibiotics.
- The ability to detect the presence of harmful cells rapidly and reliably is important for the safe use of numerous medical and industrial products, and the safe and efficient implementation of medical procedures and industrial processes. Rapid determination of water quality during emergency situations, such as floods and earthquakes, immediate diagnosis of trauma patients, screening of raw materials/process equipment in the food industry, monitoring of quality during the pharmaceutical manufacturing phases, and monitoring of biologies and fermentation processes are only a few examples of the applications for the disclosed invention.
- Another on-going problem relates to the fact that a functional shelf-life of a unit of platelets, a blood product transfused to control bleeding, is only five days. In order to preserve their physiological function, the platelets must be stored at room temperature. Such conditions are favorable for the growth of many contaminant species of bacteria in the stored units. If not detected, this growth could lead to post-transfusion infection and septic reactions. Methods currently used to establish the sterility of these products require 48 hours time for fast-growing cells, and significantly longer for slow-growing cells in order to grow the cells to detectable levels. Consequently, the effective lifespan of a unit of platelets is reduced to only three days. A more rapid method for identifying fast- and slow-growing contaminant bacteria growing in platelets would increase the useful lifespan of the platelets and place less pressure on an already precious resource.
- Bacterial meningitis is an infection causing inflammation of the meninges. In order to recognize bacterial cases wherein a delay in beginning treatment can be life-threatening, effective and rapid diagnosis is essential. Failure to diagnose and treat bacterial meningitis early can result in morbidity with serious, long-term complications including brain damage, hearing loss, learning disability, and death. When a patient presents symptoms of an infection, the physician may prescribe an antibiotic for a suspected bacterial infection before any testing has begun. There is an on-going clinical problem related to the fact that currently available methods cannot effectively culture bacteria in cerebrospinal fluid obtained from "pre-treated" patients, thus making it difficult to confirm the bacterial diagnosis using growth-detecting methods. Rapid and reliable detection of the pathogen and determination of the susceptibility of the pathogen to a particular pharmaceutical agent is of the utmost importance.
- One method developed and used to detect the presence of viable cells faster is the impedance sensing of biological samples that measures metabolic deviations to monitor the proliferation of cells and subsequent population growth. Historically, impedance sensing has been used as an electronic analog of the Petri dish to monitor the proliferation of cells and subsequent population growth. Commercially available systems using this approach typically measure either conductance, capacitance, or the full impedance vector, that is, both resistive and reactive components, and use geometries with detection thresholds that require growth up to a million Colony Forming Units per milliliter (106 CFU/ml) or greater in the case of bacteria. However, obtaining that high titer requires significant time, especially if the bacteria belong to a slow-growing species.
- In Caide Xiao, John H.T. Luong: "Assessment of cytotoxicity by emerging impedance spectroscopy", Toxicology and Applied Pharmacology 206 (2005) 102-112, an on-line and continuous technique based on electric cell substrate impedance sensing was developed for measuring the concentration and time response function of fibroblastic V79 cells exposed to toxicants.
- In McCoy; Wang M H; E: "Use of electric cell-substrate impedance sensing as a tool for quantifying cytopathic effect in influenza A virus infected MDCK cells in real-time", JOURNAL OF VIROLOGICAL METHODS, 20051201 Elsevier BV, NL - ISSN 0166-0934, the use of electric cell-substrate impedance sensing (ECIS) for monitoring the progression of CPE due to influenza A virus infection is illustrated.
-
US 2002/0086277 A1 describes a method of determining the efficacy of a compound in treating a subject infected with a microbe, or a method of determining the minimum inhibitory concentration of an antimicrobial agent against a microbe, wherein the method involves the measurement of an electrical parameter of a culture of the microbe. -
US 6,051,422 A describes an apparatus and method for monitoring cells and a method for monitoring changes in cells upon addition of an analyte to the cell's environment, comprising a device which includes an array of microelectrodes disposed in a cell culture chamber, upon which array a portion of cells adhere to the surfaces of the microelectrodes. -
EP 1 764 417 A1 describes a method and apparatus for electrically measuring an adverse effect of toxic substances on prokaryotic cells which includes measuring a whole intracellular change caused by the presence of toxic substances as a change in an electric signal of cell membranes of the prokaryotic cells. - Thus, a need exists for new, rapid, and improved methods of detecting viable cells and determining their susceptibility to an external agent or environmental factor. The present invention fulfills this need. Various embodiments of the disclosed invention provide such methods that yield test results significantly faster than conventional methods relying on growth or biomass increase.
- The inventors of the disclosed subject matter have now discovered a method of monitoring a stress response from a cell, using impedance sensing to obtain this information. The change in impedance from a cell suspension caused by the stress response of living organisms to a stressor is immediate and more intense than the change in impedance from a cell suspension resulting from growth. The method described herein directly monitors changes in the level of stress response induced by different stressors by sensing changes in the impedance of a cell suspension. From these changes one can infer the presence or absence of viable cells, and the susceptibility of the cells to different stressors. The invention inter alia includes the following, alone or in combination.
- In one embodiment, the invention related to a method for rapidly monitoring a stress response of a cell suspended in a medium to a stressor and determining the magnitude of the stress response, the method comprising: a) under conditions suitable for monitoring the voltage and/or the current, applying an electric field to a test sample comprising the cell suspended in the medium or to a test sample comprising the cell on a suspended micro culture bead; b) monitoring the voltage and/or the current; c) allowing a stressor to impact the test sample, wherein the stressor is chosen from a stressor applied prior to, a stressor applied substantially simultaneously with, and a stressor applied subsequent to the applying of the electric field; d) monitoring an initial impedance response of the test sample, wherein the initial impedance response of the test sample is an impedance change of the test sample during the period of transition from a first measurement of impedance of the test sample at about the time of applying the electric field up to and including a subsequently measured impedance of the test sample that is indicative of the stress response or non-growth, thereby monitoring the stress response of said cell to the stressor; and e) determining the level of the initial impedance response of the test sample, wherein the level of the initial impedance response of the test sample is an indication of the magnitude of the stress response of the cell, thereby determining the magnitude of the stress response of the cell to the stressor, the method further comprising: mathematically comparing the level of the initial impedance response of the test sample determined in step (e) with: (i) a first standard value that represents the impedance response of a first reference sample comprising the medium with or without the stressor, and wherein the first reference sample is devoid of cells; and/or (ii) a second standard value that represents the initial impedance response of a second reference sample comprising a cell and the medium, wherein the cell in the reference sample is of the same type and concentration as the cell in the test sample, and wherein the reference sample is devoid of the stressor; and determining a value for a First Impedance Response Profile of the test sample, the value for the First Impedance Response Profile based on the mathematical comparison of the level of the initial impedance response of the test sample determined in step (e) with the first standard value and/or the second standard value, wherein the initial impedance response is determined by monitoring within a period of about 45 minutes from the first measurement of impedance.
- The present invention relates, in another aspect, to a method for rapidly detecting the presence or absence of a cell by monitoring a stress response of the cell if said cell is present, or the absence of the stress response if said cell is absent or dead, the method comprising: a) under conditions suitable for monitoring the voltage and/or the current, applying an electric field to a test sample comprising the cell suspended in a medium or to a test sample comprising the cell on a suspended micro culture bead; b) monitoring the voltage and/or the current; c) allowing a stressor to impact the test sample, wherein the stressor is chosen from a stressor applied prior to, a stressor applied substantially simultaneously with, and a stressor applied subsequent to the applying of the electric field; d) at a specific time point or over a series of time points, measuring an initial impedance response of the test sample, wherein the initial impedance response of the test sample is an impedance change of the test sample during the period of transition from a first measurement of impedance of the test sample at about the time of applying the electric field up to and including a subsequently measured impedance of the test sample that is indicative of the stress response or non-growth; and e) assessing the level of the initial impedance response of the test sample at each time point, wherein the level of the initial impedance response of the test sample at each time point is an indication of the level of the stress response of said cell, thereby monitoring the stress response of said cell to the stressor if said cell is present in the test sample, or the absence of the stress response if said cell is absent from the test sample or dead; and thereby rapidly detecting the presence or absence of said cell in the test sample, the method further comprising confirming the presence or absence of said cell in the test sample by: (i) measuring an impedance response of a first reference sample comprising the medium with or without the stressor, and wherein the first reference sample is devoid of cells; and/or (ii) measuring an initial impedance response of a second reference sample comprising said cell and the medium, wherein said cell is of the same concentration as said cell in the test sample, wherein the second reference sample is devoid of the stressor, and wherein the initial impedance response of the second reference sample is an impedance change of the second reference sample during the period of transition from a first measurement of impedance of the second reference sample at about the time of applying an electric field up to and including a subsequently measured impedance of the test sample that is indicative of the stress response or non-growth; (iii) determining a value for an Impedance Response Profile by comparing the initial impedance response of the test sample obtained in step (d) with the impedance response of the first reference sample and/or the initial impedance response of the second reference sample; and (iv) assessing the comparison of step (iii), thereby confirming the presence or absence of said cell in the test sample, wherein the initial impedance response is determined by monitoring within a period of about 45 minutes from the first measurement of impedance.
- Yet another embodiment of the invention is a method for determining a predictive outcome for the susceptibility of a cell suspended in a medium to a selected concentration of a bio-active agent and a level of stress of the cell at the selected concentration of the bio-active agent, wherein the level of susceptibility of the cell is previously known or unknown, the method comprising: a) i) at specific time points or over a series of time points, measuring an initial impedance response of a test sample comprising: the cell suspended in a medium or of a test sample comprising the cell on a suspended micro culture bead, and the selected concentration of the bio-active agent; and measuring an impedance response of a reference sample comprising the medium and the selected concentration of the bio-active agent, wherein said reference sample is devoid of cells, and wherein the initial impedance response is measured within a period of about 45 minutes of the initial minutes of the measurement; ii) determining a First Impedance Response Treated Profile at each of the time points, wherein the First Impedance Response Treated Profile is a mathematical comparison of the initial impedance response of the test sample determined in step a)(i) and the impedance response of the reference sample determined in step a)(i) at each time point; iii) optionally, repeating steps a)(i) and a)(ii) for a plurality of selected concentrations of the bio-active agent to obtain the corresponding First Impedance Response Treated Profile for each different selected concentration of the known bio- active agent; b) i) at the specific time points or over a series of time points, measuring the initial impedance response of a second test sample comprising the cell suspended in the medium or comprising the cell on a suspended micro culture bead, wherein the second test sample is devoid of the bio-active agent; and measuring the impedance response of a reference sample comprising the cell suspended in the medium or comprising the cell on a suspended micro culture bead, wherein said reference sample is devoid of cells; ii) calculating a First Impedance Response Untreated Profile, wherein the First Impedance Response Untreated Profile is a mathematical comparison of the initial impedance response of the second test sample determined in step b) i) and the impedance response of the reference sample determined in step b) i) at each time point; and c) for each selected concentration of the bio-active agent, determining a Normalized Impedance Response value, NIR, wherein the NIR is a numerical value determined by an algorithm relating the First Impedance Response Treated Profile value obtained in step a) ii), and/or step a) iii), to the First Impedance Response Untreated Profile value obtained in step b) ii), such that the First Impedance Response Untreated Profile value is incorporated in the NIR, and wherein the determined NIR value is a quantitative measure of the level of stress of the cell at the selected concentration of the bio-active agent.
- Also disclosed (not claimed) herein are kits comprising materials that are helpful or required for carrying out a method of the invention, and a set of instructions for use of the kit.
- The methods according to various embodiments of the invention facilitate the rapid and reliable detection of viable cells, identification of pathogens, and determination of the susceptibility of a pathogen to a particular drug.
- The foregoing and other objects, features and advantages of the invention will be apparent from the following more particular description of illustrative embodiments of the invention, as illustrated in the accompanying drawings in which like reference characters refer to the same parts throughout the different views. The drawings are not necessarily to scale, emphasis instead being placed upon illustrating the principles of the invention.
-
Fig. 1 is a schematic diagram for a cassette concept, showing a cassette based on a planar geometry. -
Fig. 2 is a schematic diagram depicting an impedance monitoring detection system. -
Fig. 3 is a graph representing the impedance response from un-shocked (top curve) Escherichia coli (E. coli), and the initial impedance response from heat-shocked (bottom curve) E. coli in tryptic soy broth (TSB) medium at 37°C. -
Fig. 4 is a schematic description of the experimental procedure according to an embodiment of the invention. -
Fig. 5 is a graphical representation comparing the impedance response over a 14 hour period from stressed, that is, heat-shocked and from un-stressed E. coli captured from apple juice. -
Fig. 6 is a graph representing the initial impedance response from heat-shocked E. coli. -
Fig. 7 is a graph representing the impedance response from un-stressed E. coli. -
Fig. 8 is a graph representing the impedance response from the growth of 120 CFU/ml E. coli over an 8 hour period, and a graph of the impedance of a negative control; and an inset exploded view of the portion of the graph showing the impedance response from E. coli during the first 30 minutes of incubation, that is for this example, the initial impedance response. -
Fig. 9 is a graph representing the impedance response from 145 CFU/ml E. coli grown in a 1:1 mixture of urine and tryptic soy broth (TSB) medium. -
Fig. 10 is a graph representing the impedance response during metabolic deviations of approximately 5 x 10⁶ CFU/ml Mycobacterium bovis (M. bovis) after exposure to varying concentrations of isoniazid (INH), all responses scaled to equal 1.000 at the start. -
Fig. 11 is a graph representing the susceptibility of M. bovis, wherein after four hours growth, the slopes of the corresponding viability curves (Fig. 10 ) were determined and normalized to the growth of untreated M. bovis, and plotted against their respective drug concentration; the similarly normalized slope for the resistant mutant INHR-4 is plotted as a square in the upper right corner. -
Fig. 12A, Fig. 12B, and Fig. 12C are graphs representing the impedance responses, respectively, from platelet concentrates (PC) spiked with E. coli (4.0 x 10³ CFU/ml); Staphylococcus epidermidis (3.2 x 10³ CFU/ml); Propionibacterium acnes (2.8 x 10³ CFU/ml), along with negative control graph. - A description of preferred embodiments of the invention follows. It will be understood that the particular embodiments of the invention are shown by way of illustration and not as limitations of the invention. At the outset, the invention is described in broad, overall aspects, with more detailed descriptions of some aspects following. The features and other details of the compositions and methods of the invention will be further pointed out in the claims.
- The present invention is directed to methods for rapidly detecting the presence of viable cells, identifying the cell type, and rapidly determining the susceptibility of the cell to an external agent. The invention provides significantly faster detection of viable cells and their corresponding susceptibilities compared to currently-used methods which rely on detecting biomass increase due to the growth of cultured cells or the lack thereof.
- In broad terms, one aspect of the invention provides a method for monitoring a stress response from a cell to a stressor, using impedance sensing to obtain this information.
- In another aspect, the invention relates to detecting the presence or absence of a viable cell, using impedance sensing to monitor the stress response of the cell to a stressor.
- In yet another aspect, the invention provides a method for determining the susceptibility of a cell to a selected concentration of a stressor comprising a bio-active agent, and a level of stress of the cell at the selected concentration of the bio-active agent, using impedance sensing to achieve this determination.
- The growth of a viable cell population is determined by the multiplication of one or more cells comprising that population. During that growth, cells utilize available nutrients in order to accumulate energy predominantly in the form of ATP as well as NADPH and phosphoenolpyruvate (PEP), and synthesize biological macromolecules, such as DNA, RNA, proteins, lipids, and carbohydrates. For example, in the case of bacteria, all of these components are subsequently used to produce two new daughter cells by the process known as binary fission. If culture conditions remain favorable, both new cells will repeat this cycle. This usually occurs during growth, also called logarithmic growth.
- However, if cells experience unfavorable conditions, such as a hostile environment, they respond with a dramatic metabolic deviation, halting growth processes, and entering into a survival mode known as the "stress response". Consequently, regular protein synthesis is rapidly suppressed, while new regulons are activated resulting in an enhanced tolerance of the cells for the stress factor, also referred to herein as the "stressor".
- Stressors can comprise chemical stressors, physical stressors, and biological stressors. Non-limiting examples of chemical stressors include detergent treatment, alcohol treatment, antibiotic treatment, acidification or alkalization, oxidation, and contact with heavy metals. Non-limiting examples of physical stressors include temperature shift, acoustic waves, pressure shock, osmotic pressure change, ionizing radiation, electric shock, and electromagnetic radiation. Non-limiting examples of biological stressors include changes in media conditions, stationary phase after growth, nutrient deprivation, including, for example, carbon or nitrogen starvation, and hypoxia. As used herein, the terms "stress" and "stressor" refer to any combination of stressors which may be applied, modified and/or removed at various times. Under certain conditions of applied voltage and/or current, the measurement of impedance itself may be considered a stressor and can be used either alone or in conjunction with other stress factors. Activation of the stress response machinery usually occurs within minutes after the appropriate stimulus is applied and peaks at about 10 to 30 minutes, depending on the species. This response may last up to several hours or more depending on the severity of the stress. This period, which may be a different actual length for exceptional cell types, will be referred to as the initial response period.
- The chemical stressors, physical stressors, and biological stressors are bio-active agents. As the term is used herein, "bio-active agent" has the same meaning as "biologically active agent" and refers to any agent or substance that has or is capable of demonstrating any in vivo or in vitro activity. Non-limiting examples of chemical and biological bio-active agents useful in an embodiment of the invention include therapeutic substances and pharmaceutical agents, such as antimicrobial agents, antibiotics, thrombin inhibitors, antithrombogenic agents, thrombolytic agents, fibrinolytic agents, vasospasm inhibitors, calcium channel blockers, vasodilators, antihypertensive agents, inhibitors of surface glycoprotein receptors, antiplatelet agents, antimitotics, microtubule inhibitors, anti secretory agents, actin inhibitors, remodeling inhibitors, antisense nucleotides, anti metabolites, antiproliferatives (including antiangiogenesis agents), anticancer chemotherapeutic agents, anti-inflammatory steroid or non-steroidal anti-inflammatory agents, immunosuppressive agents, hormones, growth hormone antagonists, growth factors, dopamine agonists, radiotherapeutic agents, peptides, proteins, enzymes, extracellular matrix components, ACE inhibitors, free radical scavengers, chelators, antioxidants, anti polymerases, antiviral agents, photodynamic therapy agents, and gene therapy agents.
- According to an embodiment of the invention, a stressor, such as a bio-active agent is applied to the cell by a method comprising contacting the cell with the bio-active agent. In a particular embodiment, the bio-active agent is chosen from a pharmaceutically active agent, such as an anti-cancer agent; a biological toxin; a virus; and another substance capable of producing stress, and combinations thereof.
- The stressor can create a stress or biotic stress or physiological stress. As used herein, the terms "stress" and "biotic stress" have the same meaning and refer to any adverse effect on metabolism, growth or viability of a cell population. The adverse effect can be produced by a living organism, a non-living or non-biological environmental stressor, such as temperature change.
- The stress response is characterized by significant retardation and/or redirection of most of the metabolic processes related to growth. These include a decrease in the level of ATP, NADPH, and PEP; inhibition of replication, and the increase of condensation of DNA, together with local denaturation in super-coiled DNA. In addition, RNA transcription, protein translation, and lipid and carbohydrates synthesis are also down-regulated.
- At this stage, stressed cells enter conditions which are characterized as cell division arrest. Consequently, all cells become synchronized in the same stage of their "growth cycle" and hence the majority of cells will begin cell division at a similar time after successfully transitioning through the stress period. As an example, for fast-growing bacteria, Pseudomonas putida, cell division arrest after stress can last as long as four hours.
- Overall, the genes encoding stress response proteins are highly conserved among various species. Although some details of the stress responses to different factors, such as, for example, heat-shock, SOS, and oxidative stress, may differ at the molecular level, in most cases heat shock proteins (hsp) play the most important role in cell survival during and after the initial stress. Stress response proteins, especially hsp, are described for virtually all single-celled organisms and multi-cellular organisms of both prokaryotic, including the smallest known self-replicating cell, Mycoplasma genitalium, and another obligate intracellular bacterium, Chlamydophila trachomatis, and eukaryotic origin, including algae, plants, fungi, protozoa, animal and human cells. Even eukaryotic cell organelles, such as mitochondria and chloroplasts, encode their own hsp.
- Deviations in cellular metabolism are manifested by changes in the dielectric properties of a cell suspension. Cellular metabolism modifies the dielectric, reflecting a net change of charged compounds from metabolic products, changes in cell morphology, surface charge effects, and synthesis of highly charged molecules, such as DNA and RNA, along with salts, proteins, amino acids and other constituents that may be present in the medium. In an embodiment, these changes to the dielectric properties of a cell suspension are measured by recording changes in the electrical impedance of the corresponding suspension.
- We have now discovered that the change in impedance value in a cell suspension caused by the stress response of living organisms to a stressor is immediate and more intense than the change in impedance value in a cell suspension resulting from growth. The method described herein directly monitors changes in the stress response of cells induced by different stressors by sensing changes in the impedance of a cell suspension. From these changes one can infer the presence or absence of viable cells, and the susceptibility of the cells to different stressors.
- Although the impedance response from a suspension of cells is known to result from metabolic activities of the cells, the full capabilities of impedance sensing have been underutilized to date. Some prior works may have used the broader term metabolic deviations (also referred to as metabolic activity) to refer to growth, but as used here, the term "metabolic deviations" is intended to refer to all of the biological processes within the cell, not only those that are directed toward growth and reproduction. We disclose the measurement of impedance to detect the metabolic deviations associated with the stress response, rather than just those associated with growth. We have demonstrated the utility of these capabilities of impedance sensing to indicate the presence of different species of bacteria by monitoring the initial metabolic deviations of stressed cells.
- It is important to note that the stress response is general and not unique to any one cell or microorganism. Thus, the disclosed approaches are applicable to all prokaryotic cells or eukaryotic cells. The disclosed methods are particularly useful for determining the presence or absence of a pathogen and the susceptibility of the pathogen to a given concentration of a bio-active agent, such as an anti-microbial agent.
- The methods according to various embodiments of the invention include, for example, a method for rapidly monitoring a stress response of a cell to a stressor and determining the magnitude of the stress response; a method for rapidly detecting the presence or absence of a cell by monitoring a stress response of the cell if said cell is present, or the absence of the stress response if said cell is absent or dead; and a method for determining a predictive outcome for the susceptibility of a cell to a selected concentration of a bio-active agent and a level of stress of the cell at the selected concentration of the bio-active agent, wherein the level of susceptibility of the cell is previously known or unknown. The disclosed methods are particularly of use for testing bacteria, including pathogens of non-bacterial origin.
- As used herein, the term "detecting" is intended to include, although is not limited to, determining the presence or absence of a cell, or quantifying the amount of the cells. The term thus refers to the use of the materials, compositions, and methods of the present invention for qualitative and quantitative determinations.
- Examples of eukaryotic cells suitable for use in a method according to an embodiment of the invention include protists, protozoa, fungi, a non-transformed human cell, a non-transformed animal cell, a transformed human cell, and a transformed animal cell, with the proviso that if the eukaryotic cell is adhesion-dependent, the test sample medium additionally comprises suspended micro culture beads comprising a coating of an extracellular matrix capable of adhesion with the eukaryotic cell.
- It may be necessary or useful for a particular type of prokaryotic or eukaryotic cell, that the test sample medium and the reference sample medium additionally comprise suspended beads comprising a coating of specific receptors capable of adhesion with the prokaryotic or eukaryotic cells. The receptors can comprise biologically active components chosen from: components generated from immunological responses, components generated from nucleic acids, and components generated from other chemical or biochemical compounds that can be used to identify specific cells.
- A media suitable for use in a method according to an embodiment of the invention can be chosen from: one which will not support the viability of the cell and one which will support the viability of the cell for a period of time sufficient to measure a stress response. The choice of media will depend on the cell type and the nature of the test to be performed. Non-limiting examples of suitable media include commercially available culture media, aqueous broths, gels, and agar-based media. In a preferred embodiment the media have some electrically conductivity.
- As used herein, "sample" refers to anything which may contain a moiety to be isolated, manipulated, measured, quantified, detected or analyzed using suitable devices according to the disclosed methods. The sample may be a biological sample, such as a biological fluid or a biological tissue or an environmental or industrial sample containing biological or suspected biological material. Examples of biological fluids include suspension of cells in a medium, such as cell culture medium, urine, blood, plasma, serum, saliva, semen, stool, sputum, cerebral spinal fluid, tears, mucus, amniotic fluid or the like.
- Examples of environmental or industrial samples include suspensions of cells in a water sample, a cosmetic sample, a food sample, a pharmaceutical sample, or the like.
- The use of electrical impedance measurements to monitor cell growth is well-established. Commercially available systems using this approach typically measure conductance, capacitance, or the full impedance (both resistive and reactive components) and use geometries that require significant growth in order to be detected. In the case of bacteria, the typical growth threshold needed for detection with these systems is one million (106) CFU/ml or greater. Obtaining that high titer requires significant time, especially if the bacteria belong to slow-growing species.
- Embodiments of the present invention use impedance sensing in a way that allows for significantly more rapid detection of viable cells by detecting the impedance change due to stress response. The impedance response from a cell suspension correlates with the integrated metabolic activities within that suspension and provides significantly more information than other non-invasive methods that detect only increases in biomass during cell multiplication and the corresponding population growth. Moreover, metabolic deviations can occur without cell division, and such metabolic changes would thus not be detected by other systems that rely on increases in biomass due to cell multiplication and the corresponding population growth. Thus, the disclosed methods of impedance sensing and analysis provide improved detection and analysis of cell stress in cell suspensions.
- In general, the term "impedance" can be used to describe the bulk electrical properties of a sample and its respective ability to impede the flow of current. Impedance can be measured with time varying potentials or currents at some specified frequency. If a sinusoidal AC voltage is applied across the sample volume, at some frequency, v, a current will flow through the medium. The current, while alternating at the same frequency as the voltage will have some phase relationship to the applied voltage. The impedance of the sample is defined by the ratio of the magnitudes of the voltage and current and the relative phase angle between them.
- The physical interpretation of the impedance measurement is best described by the following two components: the resistive component and the reactive component. Resistance and reactance are properties which must be combined to find the impedance of a system. However, terms, such as "resistance" and "reactance" are sometimes loosely referred to as "impedance", or as a representation of impedance.
- Alternatively, any known time-varying signal containing a set of frequency components can be used to drive a sample for the purpose of determining impedance parameters associated with the sample. In general, this signal can be a voltage, a current, or some combination of voltage and current. It can contain many different frequency components simultaneously, and in the case of "bandlimited white noise", it can contain every frequency within a certain bandwidth. Using any of these drives, a corresponding response of current, voltage, or voltage and current can be measured. At any given frequency, the impedance of the sample is the ratio of complex voltage to complex current. This impedance can be represented by a pair of numbers, such as magnitude and phase, or real and imaginary. Under certain conditions, the response may contain frequency components that were not in the drive signal and therefore may contain additional information about the sample.
- Alternating current (AC) allows for easier determination of a critical property, the capacitance that is relevant to the methods according to various embodiments of the present invention. A simple capacitor may comprise a pair of electrical conductors, such as metal plates, separated by a non-conductor or insulator. The amount of separated electrical charge that can be stored or held on the capacitor per unit of electrical potential between the conductors may be referred to as its capacitance. Measurements of a cell suspension encompassed by two electrodes can be thought of as a biological capacitor.
- Although the examples presented here use measurements of capacitance to monitor a stress response, it is also within the scope of this disclosure to use any other appropriate one-dimensional or multi-dimensional electrical measurements, such as conductance, susceptance, admittance or any other representation(s) or transformation(s) of the impedance vector to measure the stress response of cells without departing from the scope of the invention encompassed by the appended claims. With no more than routine experimentation or simple adjustments, those skilled in the art could utilize not only capacitance to measure the stress response according to an embodiment of the invention, but also all representations of electrical measurements, such as impedance. Furthermore, applying an electric field may be accomplished by a variety of means including any combination of voltage and/or current. Any and all references to a dielectric may include its complete, "non-ideal" characterization and not be restricted to its reactive component of impedance.
- Although the differing times between growth and stress responses provide much valuable information, there is also an enormous amount of information contained in the impedance response. Even for a relatively simple set of impedance measurements, each individual impedance value measured over a sample interval is no less than a two-dimensional vector and the change between every pair of samples is at least a two-dimensional vector. Thus, even for a simple drive signal, a large number of change vectors and their derivatives can result. In addition to this substantial amount of information about the nature of the cellular response, a separate set of vector data points can be generated for every possible drive signal. Each drive signal may be composed of a single frequency component or any realizable set of frequencies. Furthermore, the system can switch between various different drive signals during the testing of a single sample to generate even more information. Under certain circumstances, the output frequencies will be different than the input frequencies, thus providing even more information within the impedance response profile. It can be difficult for one to think about or visualize the enormous amount of information that is contained within the impedance response, and therefore, simpler representations are often used. For example, references to capacitance, resistance, reactance or positive and negative signals can be convenient for representing and interpreting the results. This vast multidimensional space of the impedance response can be mathematically transformed into an infinite number of one-dimensional or multi-dimensional representation spaces. Of course, it is possible to align or transform a coordinate space to have its axes better correspond to any particular behavior or property of interest.
- Thus, for example, any reference to a particular sign or quantity could easily be changed mathematically without impacting the principles underlying this invention. In one embodiment of the invention, differential methods are used in order to obtain an improved level of precision.
- In one embodiment, resulting impedance profiles reflect a comparison of measurements from a pair of sterile, mechanically identical chambers. For example, the first chamber can be filled with a medium containing stressed cells, while the second chamber contains sterile medium and no cells. Alternatively, the first chamber can be filled with medium and un-stressed cells, and a stressor can be added to the medium. The second chamber, serving as a reference, is positioned in close proximity to the first, so that both volumes are subjected to nearly identical thermal and mechanical perturbations, providing a means for common-mode rejection. A small alternating current (A.C.) voltage is applied across the two electrodes, creating a parallel plate capacitor.
- Stressed cells in the first chamber change the dielectric properties of the cell suspension in response to the stress. Some changes in the dielectric can also be seen in the second chamber derived from interactions between organic compounds in the medium, also common to the first chamber. The changes in the impedance profiles of the samples in both chambers over time are compared. Any differences detected between the two samples reflect the cellular activities caused exclusively by the stress response of the organisms.
- According to an embodiment of the invention, at a specific time point or over a series of time points, an initial impedance response of a test sample of the cell suspension following application of a stressor is measured. As the term is used herein, the "initial impedance response" of a sample, such as the test sample, is an impedance change of the test sample during the period of transition from a first measurement of impedance of the test sample at about the time of applying the electric field up to and including a subsequently measured impedance of the test sample that is indicative of the stress response or non-growth. In one embodiment of the invention, the subsequently measured impedance of the test sample can be at time when the non-growth would begin to be detected.
- The "initial impedance response" as described above can refer to a period of transition of a measurement of impedance of the test sample. Alternatively, the "initial impedance response" can refer to a period of transition of a measurement of impedance of a sample modified by a related measurement obtained at about a similar time.
- Further, according to another embodiment of the invention an Impedance Response Profile (IRP) of the test sample is determined. The IRP is based on the mathematical comparison of the level of the measured initial impedance response of the test sample with a standard value. Alternatively, the IRP can be based on a mathematical comparison of a measurement of the impedance of a test sample with a standard value prior to the mathematical construction of the initial impedance response. The standard value can be the measured initial impedance response value or the measured impedance of a first reference sample comprising the medium with or without the stressor, and wherein the first reference sample is devoid of cells. Alternatively, the standard value can be the measured initial impedance response value or the measured impedance of a second reference sample comprising the cell and the medium, wherein the cell is of the same concentration as the cell in the test sample, wherein the second reference sample is devoid of the stressor, and wherein the initial impedance response of the second reference sample is an impedance change of the second reference sample during the period of transition from a first measurement of impedance of the second reference sample at about the time of applying an electric field up to and including a subsequently measured impedance of the test sample that is indicative of the stress response or non-growth.
- The IRP reflects the metabolic deviations occurring within the suspension of cells. In one embodiment, when the value of IRP is constantly increasing over a period of time significantly exceeding the doubling time of the cell population, growth is occurring. When the value of the IRP is decreasing over a period of time less than or approximately equal to the doubling time of the cell, stress is occurring. Hence, the absence of growth (i.e. cell division) for cells under stress is defined by the measurement of a second value of the IRP that is lower than the value recorded in a first earlier measurement by an amount exceeding the statistical uncertainty of the two measurements. While a decrease of the value of the IRP is sufficient to determine stress, it is not always necessary. In some cases, the assessment of stress or the absence of growth can be recognized by both statistically significant increasing values of the IRP followed by subsequent decreasing values, or statistically significant decreasing values of the IRP followed by subsequent increasing values over a period of time less than or approximately equal to the doubling time of the cell population. Stress can also be inferred by an IRP from stressed cells that is less than the IRP from cells that are un-stressed.
- The end of the period of stress and the corresponding start of growth can be determined by the impedance response profile at a time greater than the doubling time of the cell population at a point of infection where the slope of the impedance response profile changes from a negative slope to a positive slope.
- The measurement of the stress response can also be differentiated from growth by comparing the response profiles to data sets from previously recorded experiments. By matching the impedance behavior to known responses from similar experiments, a determination can be made at a specific time for any desired statistical confidence interval. As greater statistical confidence is desired, the length of time comprising the initial impedance response can be extended. Also, the degree to which the results being measured match stored sets of expected values may also extend the initial impedance response in order to increase statistical confidence. In the following examples, the stress and growth responses are distinct and their parameterization may be adjusted by using the doubling times of the particular cell populations within the sample being tested.
- Following determination of the IRP, analysis of the IRP can enable, for example, detection of a cell, determination of information regarding the response of a cell to a given stressor, and determination of the susceptibility of a cell to a given concentration of a bio-active agent.
- Turning now to the drawings, as depicted schematically in
Fig. 1 , an embodiment of the disclosed impedance technology can be implemented in an easy-to-operate, relatively low-cost device. For example, the system can be designed using a cassette housing a panel of sensitive test chambers. The cassette may be of a disposable type. In one embodiment of the invention, all sensing elements are integrated within a planar mesoscale sized cassette having a form factor similar to a credit card and ideal for established mass production techniques. The use of mesoscale geometry enables the testing of samples with practical volume sizes without the additional concentration of cells while generating signals having high signal gain for sensitive measurements. Once filled with, for example, media, and treated or untreated test samples, the cassette can be inserted into a readout fixture that monitors the impedances, analyzes, displays, and records the information. An example of a conceptual design of a multiple cassette device, a notebook-sized impedance biosensor, for use in an embodiment of the invention is shown inFig. 1 . -
Fig. 1 is a schematic diagram for a cassette (20), showing a cassette (26) based on a planar geometry. Internal to each cassette (26) is a panel of detection chambers (32) as shown inFig. 2 . Each chamber (32) is constructed with two electrodes (34) having relatively small separation gaps. As used herein, the term "electrode" is a structure having a high electrical conductivity, that is, an electrical conductivity much higher than the electrical conductivity of the surrounding materials. A test sample is injected by the user directly into a fill port (22) located on the cassette (26) and the sample is distributed to the detection chamber (32). The cassette (26) is inserted within an analyzer device (28) for readout. The electrical impedance of each chamber is recorded, monitoring the respective changes in the dielectric properties of the cell suspensions. - Although two electrodes (34) are used in these examples, the invention may be embodied in a system that uses more than two electrodes (34) per chamber (32). Each electrode (34) may be composed of one or more materials that may or may not produce an electrochemical effect within the sample.
- Stress may be applied to the test samples by allowing a stressor to impact the test sample, wherein the stressor is chosen from a stressor applied prior to, a stressor applied substantially simultaneously with, and a stressor applied subsequent to the applying of the electric field or the filling of the detection chambers (32).
-
Fig. 2 is a schematic block diagram (30) depicting an impedance monitoring detection system. The platform comprises a cassette (26) containing multiple detection chambers (32), each chamber (32) having two electrodes (34); and an analyzer (28), as shown schematically inFig. 1 , that accepts the cassette (26), and monitors the stress response of a cell suspension in real-time. The analyzer (28) comprises the switching relay (36), the Precision LCR meter (38), the GPIB Interface (40), the computer or PC (41), and the Thermocouple DAQ (42). - A generalized description of operation of the system according to an embodiment of the invention follows. A manually filled meso-scale research grade test cassette (26) with two independent biological samples in separate detection chambers (32) is inserted into a thermally insulated mounting fixture to hold the cassette (26) stable during measurement, maintain thermal stability, and make electrical contact with the analyzer (28). The fixture includes two thermally controlled platens on which electrical guards are mounted to shield the cassette (26) from stray capacitances. The temperature of the platens is monitored using an embedded thermocouple, and recorded using a data acquisition system (DAQ) (42) (such as those manufactured by National Instruments). The impedance may be measured using a commercially available meter, AGILENT® 4284A Precision LCR meter (38) (AGILENT® Technologies, Inc., Palo Alto CA). This impedance meter (38) was capable of monitoring only a single channel at any one time and therefore a switching relay box (36) was built to toggle between the two detection chambers (32). The AGILENT® meter (38) communicated with a computer (41) using a standard GPIB board interface (40). The computer (41) recorded, analyzed, and displayed the data. A software program (available from BioSense Technologies, Inc., Woburn, MA), was written to provide an easy-to-use interface for both running experiments and performing basic analysis.
- In the example illustrated, the system operated on alternating current (A.C.) with measurements made at about one kiloHertz (1kHz); however adjustments can be made with no more than routine experimentation.
- The impedances of the two detection chambers (32) are recorded monitoring changes in the dielectric properties of the biological suspension. As described above, the respective dielectric properties are modified due to cellular metabolism by the net change of charged compounds from metabolic products, changes in cell morphology, surface charge effects, DNA, RNA, and other highly charged molecules, such as proteins and amino acids.
- The comparison used to determine the IRP for Example 1 was the ratio of the capacitive component of the impedance at each measurement time of the chamber containing cells to that with medium only.
- A disclosed method for rapidly monitoring a stress response of a cell to a stressor, and determining the magnitude of the stress response, comprises: a) under conditions suitable for monitoring the voltage and/or the current, applying an electric field to a test sample comprising the cell and a medium; b) monitoring the voltage and/or the current; c) allowing a stressor to impact the test sample, wherein the stressor is chosen from a stressor applied prior to, a stressor applied substantially simultaneously with, and a stressor applied subsequent to the applying of the electric field; d) monitoring an initial impedance response of the test sample, wherein the initial impedance response of the test sample is an impedance change of the test sample during the period of transition from a first measurement of impedance of the test sample at about the time of applying the electric field up to and including a subsequently measured impedance of the test sample that is indicative of the stress response or non-growth, thereby monitoring the stress response of said cell to the stressor; and e) determining the level of the initial impedance response of the test sample, wherein the level of the initial impedance response of the test sample is an indication of the magnitude of the stress response of the cell, thereby determining the magnitude of the stress response of the cell to the stressor.
- The disclosed method for monitoring a stress response of a cell and determining the magnitude thereof, can further comprise mathematically comparing the level of the initial impedance response of the test sample determined in step (e) with: (i) a first standard value that represents the impedance response of a first reference sample comprising the medium with or without the stressor, and wherein the first reference sample is devoid of cells; and/or
(ii) a second standard value that represents the initial impedance response of a second reference sample comprising a cell and the medium, wherein the cell in the reference sample is of the same type and concentration as the cell in the test sample, and wherein the reference sample is devoid of the stressor; and determining a value for a First Impedance Response Profile of the test sample, the value for the First Impedance Response Profile based on the mathematical comparison of the level of the initial impedance response of the test sample determined in step (e) with the first standard value and/or the second standard value. - Example 1 relates to an experiment demonstrating an immediate initial impedance response from heat-shock stressed E. coli as compared to un-stressed E. coli.
- It is known that bacterial metabolism following heat shock deviates significantly from that of unshocked bacterial cells. In this example, the ability to measure the initial impedance response from stressed bacterial cells during this recovery period is shown. First, the initial impedance response from un-shocked E. coli was measured. A single colony from overnight culture on Luria-Bertani Agar (LBA) (Becton Dickinson Microbiology Systems, Sparks, MD) was picked with a sterile loop, re-suspended in TSB, and after appropriate dilution to approximately 1,000 Colony Forming Units per milliliter (103 CFU/ml) transferred directly into one of the impedance cassette chambers while the adjacent chamber was filled with TSB only. The cassette was inserted into the thermally controlled analyzer held at 37 degrees Celsius (37°C) and the full impedance vector was recorded. In the data presented here, the capacitance components of the initial impedance signals were analyzed. A similar effect can be seen by analyzing other representations of the impedance vector.
- To measure the response of stressed bacteria, a single colony from overnight culture on LBA was picked with sterile loop, re-suspended in phosphate buffered saline (PBS) and heated at 45 degrees Celsius (45°C) for 30 minutes. After the shock treatment was applied, the bacterial suspension was diluted in TSB and transferred directly into one of the cassette chambers while the adjacent chamber was filled with TSB. As before, the cassette was inserted into the thermally controlled analyzer held at 37 degrees Celsius (37°C) and the capacitance signals were recorded.
- The "Impedance Response Profile", here represented as the ratio of the respective capacitances of the chamber containing shocked cells to that with TSB only, is presented in
Fig. 3. Fig. 3 is a graphical representation of the Initial Impedance Response Profile for the un-stressed (top curve) and the heat-shocked (bottom curve) E. coli in TSB at 37 degrees Celsius (37°C). Initial titers were 5.6 x 10³ CFU/ml for the un-stressed cells and 4.4 x10³ CFU/ml for the heat-stressed cells. As expected, after a typical lag phase delay of approximately 1.5 to 2.0 hours, the un-stressed bacteria started to grow and the corresponding value of the impedance response started to increase. In contrast, the impedance response from heat-shocked bacteria reveals the opposite trend, specifically, an immediate and constant decrease in the value of the impedance response was observed that continued throughout 5 hours of data taking. This decrease in the value of the impedance response is caused by the cellular stress response. Hence, the absence of growth (i.e. cell division) for cells under stress can be defined by the measurement of a second impedance response value that is lower than the value recorded in a first earlier measurement by an amount exceeding the statistical uncertainty of the two measurements. In this example, an unambiguous initial impedance response is recognizable with high statistical confidence in less than 30 minutes. This elapsed time is also within the approximate population doubling time for this bacterial species in the sample being tested. Taking into account that these cells are in cell division arrest caused by stress, this serves as evidence of the absence of growth during the time necessary for our measurements. - Thus, the impedance response from stressed viable cells and their consequent detection is both a faster and potentially more powerful than the impedance response observed during conventional growth (that is, cell proliferation).
- To ensure that this decline was not due to bacterial death, bacterial enumeration was done by drop-plating and no significant differences in numbers of viable cells in the un-stressed and heat-shocked samples were found, further evidence that no cell growth or cell death occurred during the measurement time.
- The disclosed method for rapidly detecting the presence or absence of a cell by monitoring a stress response of the cell if said cell is present, or the absence of the stress response if said cell is absent or dead, comprises: a) under conditions suitable for monitoring the voltage and/or the current, applying an electric field to a test sample comprising the cell and a medium; b) monitoring the voltage and/or the current; c) allowing a stressor to impact the test sample, wherein the stressor is chosen from a stressor applied prior to, a stressor applied substantially simultaneously with, and a stressor applied subsequent to the applying of the electric field; d) at a specific time point or over a series of time points, measuring an initial impedance response of the test sample, wherein the initial impedance response of the test sample is an impedance change of the test sample during the period of transition from a first measurement of impedance of the test sample at about the time of applying the electric field up to and including a subsequently measured impedance of the test sample that is indicative of the stress response or non-growth; and e) assessing the level of the initial impedance response of the test sample at each time point, wherein the level of the initial impedance response of the test sample at each time point is an indication of the level of the stress response of said cell, thereby monitoring the stress response of said cell to the stressor if said cell is present in the test sample, or the absence of the stress response if said cell is absent from the test sample or dead; and thereby rapidly detecting the presence or absence of said cell in the test sample. This method can be refined as described below.
- The detection method can further comprise confirming the presence or absence of said cell in the test sample by: (i) measuring an impedance response of a first reference sample comprising the medium with or without the stressor, and wherein the first reference sample is devoid of cells; and/or (ii) measuring an initial impedance response of a second reference sample comprising said cell and the medium, wherein said cell is of the same concentration as said cell in the test sample, wherein the second reference sample is devoid of the stressor, and wherein the initial impedance response of the second reference sample is an impedance change of the second reference sample during the period of transition from a first measurement of impedance of the second reference sample at about the time of applying an electric field up to and including a subsequently measured impedance of the test sample that is indicative of the stress response or non-growth; comparing the initial impedance response of the test sample obtained in step (d) with the impedance response of the first reference sample and/or the initial impedance response of the second reference sample; and assessing the comparison of step (iii), thereby confirming the presence or absence of said cell in the test sample. Non-limiting examples of this method of detection include the following.
- As a demonstration of the rapid and specific detection of cells in a sample, data are presented for the capture and detection of E. coli in apple juice. A series of experiments were conducted to compare the detection of E. coli in deliberately contaminated apple juice monitoring directly the growth and stress response. A schematic description of the experimental procedure is shown in
Figure 4 . A 10 ml volume of sterile apple juice was spiked with approximately 103 CFU/ml of E. coli O157:H7 (SeeFig. 4A ). Magnetic beads (Dynal Biotech, Oslo, Norway) pre-coated with antibodies specific for our strain on E. coli were added (SeeFig. 4B ). - Our protocol for cell capture strictly adhered to the manufacturer's recommendations. Once captured, the cell-antibody complexes were retrieved using the magnetic beads, and were washed and re-suspended in TSB (See
Fig. 4C ), and the resulting suspension was loaded into the cassette (SeeFig. 4D ). The adjacent chamber (reference) was loaded with similar medium but without cells. To study the stress response, bacteria recovered from the spiked apple juice were heat-treated for 30 minutes at 45 °C. The impedance signals from these suspensions were recorded over time and analyzed. All suspensions were also enumerated using standard plating methods. - Results. The Impedance Response over a 14-hour period is plotted in
Figure 5 from the captured heat-shocked E. coli, along with measurements of similarly captured but un-stressed E. coli. The impedance response value from un-stressed cells (top curve) begins to increase at approximately 60 minutes and is unambiguously recognizable by 180 minutes (seeFigure 7 ). The curve eventually peaks at about 7 hours, followed by a decrease for about 2 hours before increasing once again. This increasing signal, peaking, and subsequent decrease has been correlated with oxygen consumption (hypoxic stress) and its eventual depletion in the growth medium, and corresponds to aerobic growth followed by hypoxia and anaerobic growth for the facultative anaerobe. - In
Fig. 5 the impedance response from un-stressed cells is compared directly with the impedance response from stressed heat-shocked cells (lowest curve) having commensurate cell densities (approximately 1000 CFU/ml) along with a negative control containing no cells (flat, middle curve). The value of the impedance response during the cellular stress response is seen to dominate that from un-stressed cells both in intensity and detection time. - To further contrast the difference between stressed and un-stressed cell response, the value of the impedance response from the stressed cells immediately decreases reaching a minimum at 7 hours before exhibiting a response similar to that of normal or un-stressed cells. As is seen here, the recovery and subsequent re-entering into the growth state of the heat-shocked cells, as measured by their corresponding impedance response, is delayed by over 5 hours as expected. In addition, the intensity of the response is much greater and its onset is much faster than the impedance response from un-stressed cells, thereby demonstrating that the initial impedance response from the shocked cells is both stronger and more immediate than the impedance response for un-stressed cells.
- The impedance responses during the initial measurement periods from the respective growth curves are plotted in
Fig. 6 and Fig. 7 for side-by-side comparison. Examination ofFig. 6 shows that the unambiguous decrease in the value of the impedance response from 1.2 x 10³ CFU/ml of stressed E. coli can be detected in as little as 15 minutes with this new method when measuring the initial impedance response, over 10 times faster than with the sensitive impedance monitoring of the growth of un-stressed bacteria. This is to be compared with 14 hours or more for conventional detection methods. - The impedance response recorded during the initial 8 hours of growth of E. coli (spike - 120 CFU/ml) retrieved from spiked apple juice is plotted in
Fig. 8 . The initial 120 minutes of the measurement have been expanded and re-plotted as an insert in the same figure. The negative sloping response seen during the first 30 minutes prior to the onset of the well-defined increasing signal is interpreted as biological activity of the viable but not dividing cells experiencing the so called "new medium" stress. In classical microbiology, this period of bacterial growth is called the lag phase or time necessary for bacterial adaptation to new culture conditions. The microbial lag phase is a complex and yet not completely understood phenomenon. We note that 1.) the Impedance Response from stressed cells is similar to that from un-stressed cells during lag phase and 2.) stressed cells returning to optimal growth conditions show longer lag phases. - Based on these two observations we interpret the lag phase seen in
Fig. 8 as being metabolically equivalent to mild stress conditions. Thus, with an initial cell concentration as low as only 120 CFU/ml, a mild stress response from environmental change alone produced a detectable decrease in the value of the impedance response sufficiently strong to identify the presence of viable cells in less than 30 minutes, thus demonstrating the sensitivity of the method. - As an additional example of the sensitivity of the method, an inoculum of 145 CFU/ml of E. coli in a 1:1 V/V mixture of urine and TSB medium suspension was monitored in one chamber along with the medium-urine mixture only in the other. The Impedance Response Profile, which is the calculated ratio of the respective two capacitive components of the impedance signals, is plotted in
Fig. 9 along with a negative control (urine/medium only in both chambers) and characterizes the lag phase and subsequent growth occurring within the bacterial suspension. - The "initial impedance response" comprises the decrease in the value of the impedance response profile that is observed during the initial 45 minutes of the measure and is detectable well before then. The onset of the well-defined increase in the impedance response profile corresponds to growth. The inflection point at 45 minutes where the slope of the impedance response profile changes from a negative slope to a positive slope corresponds to the end of the stress response and the beginning of the growth in population. The initial impedance response reflects a mild stress response of the bacterial cells resulting from the environmental stress after transfer into new media (the so-called "new media" stress). We note that these data correspond to the detection of only 4 bacterial cells (statistical estimate) within the 28.3 microliter (µl) test volume used to generate these data.
- In another aspect, the invention provides a method for determining a predictive outcome for the susceptibility of a cell to a selected concentration of a bio-active agent and a level of stress of the cell at the selected concentration of the agent, the method comprising: a) i) at specific time points or over a series of time points, measuring an initial impedance response of a test sample comprising: the cell, a medium, and the selected concentration of the bio-active agent; and measuring an impedance response of a reference sample comprising the medium and the selected concentration of the bio-active agent, wherein said reference sample is devoid of cells; ii) determining a First Impedance Response Treated Profile at each of the time points, wherein the First Impedance Response Treated Profile is a mathematical comparison of the initial impedance response of the test sample determined in step a)(i) and the impedance response of the reference sample determined in step a)(i) at each time point; iii) optionally, repeating steps a)(i) and a)(ii) for a plurality of selected concentrations of the bio-active agent to obtain the corresponding First Impedance Response Treated Profile for each different selected concentration of the known bio-active agent; b) i) at the specific time points or over a series of time points, measuring the initial impedance response of a second test sample comprising the cell and the medium, wherein the second test sample is devoid of the bio-active agent; and measuring the impedance response of a reference sample comprising the medium, wherein said reference sample is devoid of cells; ii) calculating a First Impedance Response Untreated Profile, wherein the First Impedance Response Untreated Profile is a mathematical comparison of the initial impedance response of the second test sample determined in step b) i) and the impedance response of the reference sample determined in step b) i) at each time point; c) for each selected concentration of the bio-active agent, determining a Normalized Impedance Response value, NIR, wherein the NIR is a numerical value determined by an algorithm relating the First Impedance Response Treated Profile value obtained in step a) ii), and/or step a) iii), to the First Impedance Response Untreated Profile value obtained in step b) ii), such that the First Impedance Response Untreated Profile value is incorporated in the NIR, and wherein the determined NIR value is a quantitative measure of the level of stress of the cell at the selected concentration of the bio-active agent.
- An embodiment of the above-described method can further be characterized as follows: The mathematical comparison in step a) ii) of the initial impedance response of the test sample determined in step a)(i) and the impedance response of the reference sample determined in step a)(i) at each time point is chosen from: a ratio of the impedance response of the test sample determined in step a) i) and the impedance response of the reference sample determined in step a) i) at each time point, and a difference between the impedance response of the test sample determined in step a) i) and the impedance response of the reference sample determined in step a) i) at each time point.
- Further, in an embodiment of the above invention, the algorithm used to determine the NIR is chosen from a mathematical ratio or an absolute difference between the First Impedance Response Treated Profile value and the First Impedance Response Untreated Profile value.
- In yet another aspect of the method of determining susceptibility to a bio-active agent, wherein the cell is previously known to be susceptible to the bio-active agent, the method further comprises: repeating steps a), b), and c) with a second cell having an unknown susceptibility to the bio-active agent, wherein the second cell is of the same type as the cell previously known to be susceptible to the bio-active agent, thereby determining the Normalized Impedance Response value, NIRUNK, for the cell having unknown susceptibility to the bio-active agent; comparing the NIRUNK value at the selected concentration, for the cell having unknown susceptibility to the bio-active agent, to the NIR value at the selected concentration for the cell of the strain previously known to be susceptible to the bio-active agent; and if the NIRUNK value at the selected concentration is greater than the NIR value at the selected concentration for the cell previously known to be susceptible to the bio-active agent, then predicting that the cell having unknown susceptibility to the bio-active agent is less susceptible to the bio-active agent at the selected concentration, than the cell previously known to be susceptible to the bio-active agent.
- In yet another aspect of the method of determining susceptibility to a bio-active agent, wherein the cell is of a strain known or determined to be susceptible to the bio-active agent, the method further comprises: for the specific time points or for the series of time points, plotting, as a function of time, the First Impedance Response Treated Profile for each different selected concentration of the bio-active agent, and the First Impedance Response Untreated Profile of the second test sample comprising the cell and the medium, wherein the second test sample is devoid of the bio-active agent, thereby obtaining a family of curves for the selected concentrations of the bio-active agent and for the untreated cell; calculating an average slope of each curve at a selected time point; obtaining a normalized slope value for each First Impedance Response Treated Profile by dividing the value of the average slope of each curve at the selected time point by the value of the slope of the First Impedance Response Untreated Profile curve; or by otherwise modifying the value of the average slope of each curve at the selected time point by the value of the slope of the First Impedance Response Untreated Profile curve; plotting the normalized slope of each First Impedance Response Treated Profile as a function of the corresponding concentration of the bio-active agent, thereby obtaining a Normalized Rate of Change Curve that can be used to predict an effective concentration of the bio-active agent for the cell; determining the normalized slope value for an unknown cell strain, wherein if the normalized slope value for the unknown cell strain lies above the Normalized Rate of Change Curve of the cell strain known to be susceptible to the bio-active agent; then determining that the unknown cell strain is resistant to the bio-active agent, as determined by other methods.
- A non-limiting example of rapid drug susceptibility testing follows.
- As previously stated, culturing infectious samples is currently time consuming because of the time required for observable growth of the biological constituents to occur, the major obstacle in rapid drug resistance testing. Instead of relying on growth, the described impedance-based method overcomes this obstacle to determine the drug susceptibility of culturable and viable but non-culturable organisms rapidly by monitoring the microorganism's corresponding initial impedance response to the applied stress during exposure to antimicrobial compounds. Impedance data for susceptible and resistant strains of the slow-growing bacterium Mycobacterium bovis BCG (M. bovis) exposed to isoniazid (INH) (Sigma-Aldrich, St. Louis, MO) are introduced as a demonstration of the method.
- These data show that drug susceptibility results normally requiring many weeks using standard plating methods, can be obtained in as little as four hours time. In these experiments a starting inoculum of 5 x 10⁶ CFU/ml of M. bovis cells suspended in 7H9T broth (Becton Dickinson Microbiology Systems, Sparks, MD) was mixed with a predetermined concentration of INH and injected into one chamber of the cassette. In the adjacent chamber a mixture of the identical broth with the appropriate concentration of the drug but without cells was injected and was used as the reference.
- Impedance Response profiles obtained from the target and reference capacitance signals for five INH drug concentrations (0 to 12.5 µg/ml) were obtained and are plotted in
Fig. 10 . Each profile infers the stress response from the sensitive M. bovis strain and shows that the organism's stress response varies with the drug concentration and reflects its susceptibility to the drug. - All responses have been scaled to equal 1.000 at the start. A family of curves is seen unambiguously differentiating changes in the stress response of the cell as a function of drug concentration for the compound.
- Each point on these curves represents the value of the capacitance signal of the cell-medium-drug suspension divided by that of the medium-drug mixture at the different measurement times. Because these data are constructed as ratios, the reference (control) measurement is automatically incorporated and the effects from background are minimized. Overall, the slope of the Impedance Response Profile decreases as the drug concentration is increased indicating a more significant stress response and corresponding reduction in cell viability when compared with the growth. This trend was confirmed by corresponding plate counts obtained at the end of each experiment.
- Measurement of Drug Resistance. A spontaneous mutant of M. bovis resistant to INH was isolated and characterized. This was accomplished by isolating mutant colonies from a 7H10 drug plate containing gradient concentrations of INH ranging from 0 to 63 µg INH/ml (equivalent to 0 - 10x minimum inhibitory concentration (MIC) of the sensitive strain) followed by subsequent re-culturing on a second fresh 7H10 agar drug plate having a 25 µg/ml (4x MIC) concentration of INH. The drug susceptibility of this mutant was quantified using standard micro-broth dilution method and the corresponding MIC for INHR-4, the mutant selected for the impedance measurements, had a value of approximately 50 µg/ml (8x MIC of the sensitive strain) confirming its resistance.
- The impedance responses from the resistant mutant grown in the presence or absence of a drug (12.5 µg/ml INH (2x MIC)) versus a control (medium containing no cells) were obtained. These measured impedance responses were identical to each other and also similar to that of the sensitive strain grown without a drug as shown in
Fig. 10 . In addition, the curves are qualitatively distinct from the flat response of a negative control containing no cells. - Impedance Response Correlations with Drug Concentration. The different impedance responses plotted in
Fig. 10 can be presented in a succinct form amenable to easy interpretation. Drug concentration-impedance response correlations are revealed by calculating a relative rate of change at a single fixed time point and plotting the result as a function of the corresponding drug concentration. For these data, the value of the impedance response for each curve was obtained at only four hours, a fraction of the population doubling time for this species and well before bacterial growth may start. The average slope was calculated using that value and the common starting value (i.e, Impedance Response = 1.000 Arbitrary Units). - Next, the respective values of these slopes were divided by the value from the growth data to obtain "normalized" values. These final values are plotted against the drug concentration in
Fig. 11 . These "normalized" data points are part of a locust of points (indicated by the curve) quantifying the microorganism's stress response to the drug and are a representation of its susceptibility. Specifically, the locus of points plotted inFig. 11 describe the stress response of the sensitive M. bovis strain (determined a priori using conventional methods) to the drug INH and serves as the basis for a predictive measure for determining the susceptibility of the cells to an antimicrobial compound. For a given drug concentration, a different M. bovis strain having a measured normalized value lying above the corresponding point on the locus of points representing the stress response from a susceptible cell would indicate drug resistance; similarly, a point below the standard would indicate enhanced sensitivity. - For example, since the impedance responses measured for the resistant mutant in the presence and absence of INH are the same, the "normalized" value of the slope equals one indicating that exposure to 12.5 µg/ml of INH has no affect on the viability of the resistant mutant -- consistent with its measured susceptibility threshold of 8x MIC. The normalized slope value for the resistant strain, INHR-4, (
Fig. 11 -square at top right) is seen far outside of the data trend for the sensitive strain identifying it as highly resistant to INH. - Stress and Susceptibility. Drug susceptibility information is normally obtained from multiple drug dilution measurements via numerous single-point growth experiments or by means of a diffusion gradient. The method described here extracts this same information from multiple measurements over time but using a single drug concentration. The data plotted in
Fig. 11 demonstrate a one-to-one relationship between drug concentration and the impedance derived parameter. Thus, calculation of this derived parameter from a measured time series data when plotted versus the actual drug concentration used represents the corresponding stress level inferring the susceptibility of the cell to the drug. This is accomplished by developing an algorithm and the compilation of a database for different cells and drugs. - To summarize, the respective impedance responses for the different organism/drug concentration combinations measured were plotted together as a family of curves (
Fig. 10 ) fully mapping out the corresponding stress responses of the treated organism. An efficient analytical parameterization was created and applied to produce these dose-viability curves (Fig. 11 ). The parameterization used is relative to the growth of untreated cells (obtained simultaneously) to ensure that all measurements are internally controlled. - To demonstrate the effectiveness of the method in complex sample matrices, human platelet concentrates (PC) were spiked with different species of bacteria and subjected to detection using the BioSense impedance platform. Additional consideration must be taken when working with complex samples. For example, in the case of blood, platelets, residual white blood cells (WBCs), and red blood cells (RBCs) are metabolically active and consume oxygen and/or glucose and may interfere with the impedance measurement of the bacterial stress response. Thus, their presence must be minimized to ensure a sensitive measurement. In addition, bacteria embedded in blood and/or other cells or adhering to their surface must be liberated to ensure that all bacteria are detected and false negative results do not occur.
- In the following example, advantage is taken of the fragility of the platelets and other human blood cells as compared to any contaminant bacteria. Prior to impedance sensing, a mild detergent was added to the PC sample lysing all blood cells while simultaneously inducing metabolic stress in any contaminant bacteria. The former eliminates any potential interference from metabolically active human cells that could contribute unwanted signal; the latter provides a measurable impedance response identifying presence of viable bacteria in the sample by their specific stress response. Once lysis was complete, the suspension was passed through filters designed to pass and obstruct bacteria for the target and reference samples, respectively.
- This protocol addresses all of the essential considerations for a practical assay. For example, the pass-through efficiency of filtering S. epidermidis after lysis was measured to be nearly 100 percent with our protocol. For comparision, Ortolando et al. measured the transmission of S. epidermidis after filtering similar but unlysed leukocyte-reduced platelet concentrates to be only approximately 50 percent indicating the effectiveness and advantage of our approach.
- Spiked PC Experiments. Fresh units of PC were spiked with our model bacteria, stressed and filtered, and the respective Impedance Responses were measured. Fresh units of PC were obtained and 2 ml sample was subjected to lysis with PBS added instead of bacterial spike. The lysate was then diluted with BHI (1:1 V/V), passed through a 5 µm syringe filter to sift out large fragments and possible platelet aggregates but not bacteria. A portion of this filtrate was passed through a 0.2 µm syringe filter to remove all bacterial cells. The two cassette detection chambers were filled with the respective samples and the capacitance signals were recorded. The flat baseline Impedance Response from the PC lysates containing no bacteria is plotted in
Figure 12 (red curve labeled "Negative Control"). The minor increase in impedance response seen during the first 5 minutes is attributed to thermal differences between the two chambers. - The remainder of the PC was used for spiking with the model bacteria. In each case, spikes on the order of 103 CFU/ml were obtained. Immediately after the spike, the described lysis/filtration protocol was applied and the cassette detection chambers were filled. The cassette was inserted into the temperature controlled analyzer, the capacitances of the two chambers were recorded, and the Impedance Response was calculated. Starting and ending bacterial cell numbers were enumerated using standard plating methods and CFUs were consistent with no statistically significant loss in titers or viability.
- The initial impedance responses for Gram-negative Escherichia coli (4 x 10³ CFU/ml), Gram-positive Staphylococcus epidermidis (3.2 x 10³ CFU/ml), and the slow growing Gram-positive anaerobe Propionibacterium acnes (2.8 x 10³ CFU/ml) are plotted together with the same negative control in
Fig. 12A, Fig, 12B, and Fig, 12C , respectively. The measured values of the impedance response from all three bacteria exposed to the stressor clearly differ from the flat impedance response of the negative control data and continuously decrease in value establishing an unambiguous trend easily detected within 15 minutes. - The brief increase in the S. epidermis and P. acnes responses before the onset of the decrease is attributed again to thermal differences prior to equilibrium and is evident because the signals sizes are quantitatively closer in scale with that from the negative control compared to the response from highly stressed E. coli. It is important to note that since E. coli is highly susceptible to poor survival in plasma, a culture sequentially cycled three times in different platelets was isolated and used to ensure adapted survival of this bacterium in PC.
- The following observations are drawn from a comparison of the data from all three organisms:
- The Impedance Responses for all three bacterial species are qualitatively similar, decreasing in value, and well-differentiated from the flat response of the negative control (unspiked PC supernatant).
- The Impedance Response from stressed microorganisms in a complex sample is qualitatively similar to that from stressed microorganisms in conventional media.
- The method works equally well when detecting anaerobic bacteria (P. acnes) as when detecting aerobic (S. epidermidis) or facultative anaerobic (E. coli) species.
- All responses are immediate providing definitive results between 10 and 30 minutes irrespective of the actual doubling time of the microorganism underlining that our method of detection is a truly rapid method.
- The Impedance Responses from the three different bacteria are quantitatively different. We suggest that these differences result from i.) diverse metabolic responses from the different species, ii.) varying bacterial cell numbers, iii) different sensitivity to stressor used in the study, and iv.) cassette to cassette mechanical variations resulting in different signal gain.
- Disclosed herein are various kits to facilitate carrying out the methodology according to various embodiments. One embodiment of a disclosed kit is useful for rapidly detecting, according to the disclosed method, the presence or absence of a cell in a test sample of a medium. The kit comprises: at least one stressor previously known to cause a stress response in the cell, if the cell is present in the test sample; and a set of directions for using the components of the kit according to the method of
Claim 6 for detecting the presence or absence of the cell in the test sample. - Another disclosed kit is described for determining the presence or absence of a viable cell within a test sample. The kit comprises: a) a medium from which a suspension of a test sample and a stressor can be prepared for testing; and b) a set of directions for using the components of the kit according to the disclosed method of
Claim 14 for determining the level of the initial impedance response of the test sample and stressor, a predictive outcome for the viability of the cell, and a level of stress of the cell at the selected concentration of the bio-active agent. - Yet another disclosed kit facilitates the determination, according a disclosed method, of the susceptibility of a cell to a selected concentration of a bio-active agent and a level of stress of the cell at the selected concentration of the bio-active agent. The kit for determining susceptibility comprises: a) a medium from which a suspension of a test sample of the cell and a suspension of each concentration of the bio-active agent can be prepared for testing; and b) a set of directions for using the components of the kit according to a disclosed method, and to determine a level of stress of the cell at the selected concentration of the bio-active agent.
Claims (10)
- A method for rapidly monitoring a stress response of a cell suspended in a medium to a stressor and determining the magnitude of the stress response, the method comprising:a) under conditions suitable for monitoring the voltage and/or the current, applying an electric field to a test sample comprising the cell suspended in the medium or to a test sample comprising the cell on a suspended micro culture bead;b) monitoring the voltage and/or the current;c) allowing a stressor to impact the test sample, wherein the stressor is chosen from a stressor applied prior to, a stressor applied substantially simultaneously with, and a stressor applied subsequent to the applying of the electric field;d) monitoring an initial impedance response of the test sample, wherein the initial impedance response of the test sample is an impedance change of the test sample during the period of transition from a first measurement of impedance of the test sample at about the time of applying the electric field up to and including a subsequently measured impedance of the test sample that is indicative of the stress response or non-growth, thereby monitoring the stress response of said cell to the stressor; ande) determining the level of the initial impedance response of the test sample, wherein the level of the initial impedance response of the test sample is an indication of the magnitude of the stress response of the cell, thereby determining the magnitude of the stress response of the cell to the stressor,the method further comprising: mathematically comparing the level of the initial impedance response of the test sample determined in step (e) with:(i) a first standard value that represents the impedance response of a first reference sample comprising the medium with or without the stressor, and wherein the first reference sample is devoid of cells; and/or(ii) a second standard value that represents the initial impedance response of a second reference sample comprising a cell and the medium, wherein the cell in the reference sample is of the same type and concentration as the cell in the test sample, and wherein the reference sample is devoid of the stressor; and determining a value for a First Impedance Response Profile of the test sample, the value for the First Impedance Response Profile based on the mathematical comparison of the level of the initial impedance response of the test sample determined in step (e) with the first standard value and/or the second standard value,wherein the initial impedance response is determined by monitoring within a period of about 45 minutes from the first measurement of impedance.
- A method for rapidly detecting the presence or absence of a cell by monitoring a stress response of the cell if said cell is present, or the absence of the stress response if said cell is absent or dead, the method comprising:a) under conditions suitable for monitoring the voltage and/or the current, applying an electric field to a test sample comprising the cell suspended in a medium or to a test sample comprising the cell on a suspended micro culture bead;b) monitoring the voltage and/or the current;c) allowing a stressor to impact the test sample, wherein the stressor is chosen from a stressor applied prior to, a stressor applied substantially simultaneously with, and a stressor applied subsequent to the applying of the electric field;d) at a specific time point or over a series of time points, measuring an initial impedance response of the test sample, wherein the initial impedance response of the test sample is an impedance change of the test sample during the period of transition from a first measurement of impedance of the test sample at about the time of applying the electric field up to and including a subsequently measured impedance of the test sample that is indicative of the stress response or non-growth; ande) assessing the level of the initial impedance response of the test sample at each time point, wherein the level of the initial impedance response of the test sample at each time point is an indication of the level of the stress response of said cell, thereby monitoring the stress response of said cell to the stressor if said cell is present in the test sample, or the absence of the stress response if said cell is absent from the test sample or dead; and thereby rapidly detecting the presence or absence of said cell in the test sample,the method further comprising confirming the presence or absence of said cell in the test sample by:(i) measuring an impedance response of a first reference sample comprising the medium with or without the stressor, and wherein the first reference sample is devoid of cells; and/or(ii) measuring an initial impedance response of a second reference sample comprising said cell and the medium, wherein said cell is of the same concentration as said cell in the test sample, wherein the second reference sample is devoid of the stressor, and wherein the initial impedance response of the second reference sample is an impedance change of the second reference sample during the period of transition from a first measurement of impedance of the second reference sample at about the time of applying an electric field up to and including a subsequently measured impedance of the test sample that is indicative of the stress response or non-growth;(iii) determining a value for an Impedance Response Profile by comparing the initial impedance response of the test sample obtained in step (d) with the impedance response of the first reference sample and/or the initial impedance response of the second reference sample; and(iv) assessing the comparison of step (iii), thereby confirming the presence or absence of said cell in the test sample,wherein the initial impedance response is determined by monitoring within a period of about 45 minutes from the first measurement of impedance.
- A method as claimed in any of claims 1 or 2, wherein the stressor applied to the cell comprises contacting the cell with a known bio-active agent; optionally, wherein the known bio-active agent is chosen from a pharmaceutically active agent, an anti-cancer agent, a biological toxin, a virus, and another substance capable of producing stress, and combinations thereof.
- A method for determining a predictive outcome for the susceptibility of a cell suspended in a medium to a selected concentration of a bio-active agent and a level of stress of the cell at the selected concentration of the bio-active agent, wherein the level of susceptibility of the cell is previously known or unknown, the method comprising:a) i) at specific time points or over a series of time points, measuring an initial impedance response of a test sample comprising: the cell suspended in a medium or of a test sample comprising the cell on a suspended micro culture bead, and the selected concentration of the bio-active agent; and measuring an impedance response of a reference sample comprising the medium and the selected concentration of the bio-active agent, wherein said reference sample is devoid of cells, and wherein the initial impedance response is measured within a period of about 45 minutes of the initial minutes of the measurement;ii) determining a First Impedance Response Treated Profile at each of the time points, wherein the First Impedance Response Treated Profile is a mathematical comparison of the initial impedance response of the test sample determined in step a)(i) and the impedance response of the reference sample determined in step a)(i) at each time point;iii) optionally, repeating steps a)(i) and a)(ii) for a plurality of selected concentrations of the bio-active agent to obtain the corresponding First Impedance Response Treated Profile for each different selected concentration of the known bio- active agent;b) i) at the specific time points or over a series of time points, measuring the initial impedance response of a second test sample comprising the cell suspended in the medium or comprising the cell on a suspended micro culture bead, wherein the second test sample is devoid of the bio-active agent; and measuring the impedance response of a reference sample comprising the cell suspended in the medium or comprising the cell on a suspended micro culture bead, wherein said reference sample is devoid of cells;ii) calculating a First Impedance Response Untreated Profile, wherein the First Impedance Response Untreated Profile is a mathematical comparison of the initial impedance response of the second test sample determined in step b) i) and the impedance response of the reference sample determined in step b) i) at each time point; andc) for each selected concentration of the bio-active agent, determining a Normalized Impedance Response value, NIR, wherein the NIR is a numerical value determined by an algorithm relating the First Impedance Response Treated Profile value obtained in step a) ii), and/or step a) iii), to the First Impedance Response Untreated Profile value obtained in step b) ii), such that the First Impedance Response Untreated Profile value is incorporated in the NIR, and wherein the determined NIR value is a quantitative measure of the level of stress of the cell at the selected concentration of the bio-active agent.
- A method as claimed in claim 4, wherein the mathematical comparison in step a) ii) of the initial impedance response of the test sample determined in step a)(i) and the impedance response of the reference sample determined in step a)(i) at each time point is chosen from:a ratio of the impedance response of the test sample determined in step a) i) and the impedance response of the reference sample determined in step a) i) at each time point, anda difference between the impedance response of the test sample determined in step a) i) and the impedance response of the reference sample determined in step a) i) at each time point.
- A method as claimed in claim 4, wherein the algorithm used to determine the NIR is chosen from a mathematical ratio or an absolute difference between the First Impedance Response Treated Profile value and the First Impedance Response Untreated Profile value.
- A method as claimed in claim 4, wherein the cell is previously known to be susceptible to the bio-active agent, the method further comprising:repeating steps a), b), and c) with a second cell having an unknown susceptibility to the bio-active agent, wherein the second cell is of the same type as the cell previously known to be susceptible to the bio-active agent, thereby determining the Normalized Impedance Response value, NIRUNK, for the cell having unknown susceptibility to the bio-active agent; comparing the NIRUNK value at the selected concentration, for the cell having unknown susceptibility to the bio-active agent, to the NIR value at the selected concentration for the cell of the strain previously known to be susceptible to the bio-active agent; and if the NIRUNK value at the selected concentration is greater than the NIR value at the selected concentration for the cell previously known to be susceptible to the bio-active agent, then predicting that the cell having unknown susceptibility to the bio-active agent is less susceptible to the bio-active agent at the selected concentration, than the cell previously known to be susceptible to the bio-active agent.
- A method as claimed in claim 4, wherein the cell is of a strain known or determined to be susceptible to the bio-active agent, further comprising:for the specific time points or for the series of time points, plotting, as a function of time, the First Impedance Response Treated Profile for each different selected concentration of the bio-active agent, and the First Impedance Response Untreated Profile of the second test sample comprising the cell and the medium, wherein the second test sample is devoid of the bio-active agent, thereby obtaining a family of curves for the selected concentrations and for the untreated cell;calculating an average slope of each curve at a selected time point;obtaining a normalized slope value for each First Impedance Response Treated Profile by dividing the value of the average slope of each curve at the selected time point by the value of the slope of the First Impedance Response Untreated Profile curve; or by otherwise modifying the value of the average slope of each curve at the selected time point by the value of the slope of the First Impedance Response Untreated Profile curve;plotting the normalized slope of each First Impedance Response Treated Profile as a function of the corresponding concentration of the bio-active agent, thereby obtaining a Normalized Rate of Change Curve that can be used to predict an effective concentration of the bio-active agent for the cell;determining the normalized slope value for an unknown cell strain, wherein if the normalized slope value for the unknown cell strain lies above the Normalized Rate of Change Curve of the cell strain known to be susceptible to the bio-active agent; thendetermining that the unknown cell strain is resistant to the bio-active agent, as determined by other methods.
- A method as claimed in any preceding claim, wherein the cell is chosen from a prokaryotic cell and a eukaryotic cell.
- A method as claimed in any preceding claim, wherein:(a) the cell is a eukaryotic cell chosen from protists, fungi, a non-transformed human cell, a non-transformed animal cell, a transformed human cell, and a transformed animal cell, with the proviso that if the eukaryotic cell is adhesion-dependent, the test sample medium additionally comprises suspended micro culture beads comprising a coating of an extracellular matrix capable of adhering to the eukaryotic cell; or(b) the cell is a prokaryotic or eukaryotic cell, the test sample medium and the reference sample medium additionally comprise suspended beads comprising a coating of specific receptors capable of adhering to the prokaryotic or eukaryotic cells; optionally wherein the receptors comprise biologically active components chosen from: components generated from immunological responses, components generated from nucleic acids, and components generated from other chemical compounds that can be used to identify specific cells.
Applications Claiming Priority (2)
| Application Number | Priority Date | Filing Date | Title |
|---|---|---|---|
| US75836206P | 2006-01-12 | 2006-01-12 | |
| PCT/US2007/000682 WO2008042003A2 (en) | 2006-01-12 | 2007-01-11 | Method and composition for rapid viability testing of cells |
Publications (3)
| Publication Number | Publication Date |
|---|---|
| EP1981983A2 EP1981983A2 (en) | 2008-10-22 |
| EP1981983A4 EP1981983A4 (en) | 2009-03-11 |
| EP1981983B1 true EP1981983B1 (en) | 2015-02-18 |
Family
ID=39268929
Family Applications (1)
| Application Number | Title | Priority Date | Filing Date |
|---|---|---|---|
| EP07861206.6A Not-in-force EP1981983B1 (en) | 2006-01-12 | 2007-01-11 | Method and composition for rapid viability testing of cells |
Country Status (5)
| Country | Link |
|---|---|
| US (1) | US8364409B2 (en) |
| EP (1) | EP1981983B1 (en) |
| JP (1) | JP5268175B2 (en) |
| ES (1) | ES2535836T3 (en) |
| WO (1) | WO2008042003A2 (en) |
Families Citing this family (27)
| Publication number | Priority date | Publication date | Assignee | Title |
|---|---|---|---|---|
| JP4773348B2 (en) | 2003-07-12 | 2011-09-14 | アクセラー8 テクノロジー コーポレイション | Sensitive and rapid biodetection method |
| US9434937B2 (en) | 2011-03-07 | 2016-09-06 | Accelerate Diagnostics, Inc. | Rapid cell purification systems |
| US10254204B2 (en) | 2011-03-07 | 2019-04-09 | Accelerate Diagnostics, Inc. | Membrane-assisted purification |
| SE537311C2 (en) * | 2011-11-16 | 2015-04-07 | Observe Medical Aps | Arrangement and method for detecting the surface degeneration of a measuring chamber during measurement of urine production |
| CN104685346B (en) | 2012-05-02 | 2018-05-29 | 查尔斯河实验室公司 | Cell capture system and its use |
| US8993259B2 (en) | 2012-05-02 | 2015-03-31 | Charles River Laboratories, Inc. | Method of viability staining with membrane permeable fluorescent dye and membrane impermeable fluorescence quencher |
| EP2780707B1 (en) | 2012-05-02 | 2016-02-24 | Charles River Laboratories, Inc. | Method of detecting viable cells in a cell sample |
| US20160299132A1 (en) | 2013-03-15 | 2016-10-13 | Ancera, Inc. | Systems and methods for bead-based assays in ferrofluids |
| US9677109B2 (en) | 2013-03-15 | 2017-06-13 | Accelerate Diagnostics, Inc. | Rapid determination of microbial growth and antimicrobial susceptibility |
| WO2014144782A2 (en) | 2013-03-15 | 2014-09-18 | Ancera, Inc. | Systems and methods for active particle separation |
| CN109055297A (en) * | 2013-06-26 | 2018-12-21 | 瓦里泰细胞有限公司 | The method for determining or predicting cell characteristic |
| EP2944958A1 (en) | 2014-04-04 | 2015-11-18 | Techno-Path (Distribution) | A method of predicting phenotypic instability in a cell |
| US10253355B2 (en) | 2015-03-30 | 2019-04-09 | Accelerate Diagnostics, Inc. | Instrument and system for rapid microorganism identification and antimicrobial agent susceptibility testing |
| AU2016243656A1 (en) | 2015-03-30 | 2017-11-09 | Accelerate Diagnostics, Inc. | Instrument and system for rapid microorganism identification and antimicrobial agent susceptibility testing |
| EP3075844A1 (en) | 2015-04-01 | 2016-10-05 | Valitacell Limited | A method of determining a compositional or functional characteristic of a cell culture media |
| US11285490B2 (en) | 2015-06-26 | 2022-03-29 | Ancera, Llc | Background defocusing and clearing in ferrofluid-based capture assays |
| US20170067840A1 (en) * | 2015-09-03 | 2017-03-09 | Telemedicine Up Close, Inc., dba DxUpClose | Diagnostic device for evaluating microbial content of a sample |
| DE102017109443B3 (en) * | 2017-05-03 | 2018-07-12 | Schulz Farben- Und Lackfabrik Gmbh | Method and associated apparatus for producing slurries for building paints with microbiological real-time analysis |
| US11209405B2 (en) * | 2017-12-01 | 2021-12-28 | Shimadzu Corporation | Liquid chromatograph analysis system |
| GB201813114D0 (en) | 2018-08-10 | 2018-09-26 | Aber Instruments Ltd | Analysis of a test sample |
| CN113544507A (en) * | 2019-01-25 | 2021-10-22 | 埃克森生物系统公司 | Devices and systems with integrated electrodes or optics for monitoring cell cultures and related methods |
| JP7362119B2 (en) * | 2020-02-03 | 2023-10-17 | 国立研究開発法人物質・材料研究機構 | measuring device |
| SG10202103157SA (en) * | 2020-03-30 | 2021-10-28 | Helios Bioelectronics Inc | Method for pathogen detection |
| US20230294097A1 (en) * | 2020-05-04 | 2023-09-21 | The Regents Of The University Of California | Electrochemical cellular circuits |
| CN112098384B (en) * | 2020-09-22 | 2023-09-01 | 华东交通大学 | A Simple Method to Rapidly Predict Whether Water Quality Is Biostable |
| CN114397510B (en) * | 2021-12-29 | 2024-11-15 | 重庆金山医疗技术研究院有限公司 | A method, device and medium for determining the impedance value of an impedance pressure measuring device |
| CN119125235A (en) * | 2024-10-12 | 2024-12-13 | 江苏中天智感生命数据有限公司 | A method for rapid quantification of differences in plant leaf physiological functions |
Family Cites Families (14)
| Publication number | Priority date | Publication date | Assignee | Title |
|---|---|---|---|---|
| US211559A (en) * | 1879-01-21 | Improvement in corn-planters | ||
| JPS54109494A (en) * | 1978-02-16 | 1979-08-28 | Teikoku Hormone Mfg Co Ltd | Method of measuring antigennantibody reaction |
| NZ260609A (en) | 1994-05-26 | 1995-07-26 | Food Industry Research & Dev I | Detecting antimicrobial compound presence in a sample by growing a microorganism susceptible to the compound in media containing the sample and using an electrical parameter of the culture to indicate growth |
| EP0778533B1 (en) * | 1995-11-16 | 2003-10-22 | Fujitsu Limited | Electromagnetic field intensity calculation apparatus and method |
| US5981268A (en) | 1997-05-30 | 1999-11-09 | Board Of Trustees, Leland Stanford, Jr. University | Hybrid biosensors |
| CA2229354C (en) * | 1998-02-13 | 2005-02-08 | Agricultural Instruments Canada Ltd. | Somatic cell analyser |
| US20020086277A1 (en) | 1998-05-05 | 2002-07-04 | Tsung Chain Chang | Determination of antibiotic efficacy in treating microbial infection |
| JP3669182B2 (en) * | 1998-10-27 | 2005-07-06 | 松下電器産業株式会社 | Microorganism count measuring apparatus and microorganism count measuring method |
| US6942771B1 (en) * | 1999-04-21 | 2005-09-13 | Clinical Micro Sensors, Inc. | Microfluidic systems in the electrochemical detection of target analytes |
| US7306924B2 (en) * | 2000-04-17 | 2007-12-11 | Purdue Research Foundation | Biosensor and related method |
| US20050059105A1 (en) * | 2003-07-25 | 2005-03-17 | Board Of Trustees Of Michigan State University | Impedimetric biosensor and its use for rapid detection of bacterial pathogens in solution |
| US20050142537A1 (en) * | 2003-12-24 | 2005-06-30 | Ronald Rieder | System and method for rapid detection of metabolic deviations of a biological sample |
| US20050208592A1 (en) * | 2004-03-17 | 2005-09-22 | National Research Council Of Canada | Method and apparatus for the detection of microorganisms |
| KR100801694B1 (en) | 2005-09-15 | 2008-02-11 | 삼성전자주식회사 | Electrical analysis method and analysis device of toxic substance harmfulness using prokaryotic cells |
-
2007
- 2007-01-11 US US11/664,325 patent/US8364409B2/en not_active Expired - Fee Related
- 2007-01-11 EP EP07861206.6A patent/EP1981983B1/en not_active Not-in-force
- 2007-01-11 WO PCT/US2007/000682 patent/WO2008042003A2/en not_active Ceased
- 2007-01-11 ES ES07861206.6T patent/ES2535836T3/en active Active
- 2007-01-11 JP JP2008550390A patent/JP5268175B2/en not_active Expired - Fee Related
Also Published As
| Publication number | Publication date |
|---|---|
| US20090197243A1 (en) | 2009-08-06 |
| WO2008042003A3 (en) | 2008-08-21 |
| US8364409B2 (en) | 2013-01-29 |
| EP1981983A2 (en) | 2008-10-22 |
| EP1981983A4 (en) | 2009-03-11 |
| ES2535836T3 (en) | 2015-05-18 |
| WO2008042003A2 (en) | 2008-04-10 |
| JP2009523419A (en) | 2009-06-25 |
| JP5268175B2 (en) | 2013-08-21 |
Similar Documents
| Publication | Publication Date | Title |
|---|---|---|
| US8364409B2 (en) | Method and composition for rapid viability testing of cells | |
| Paredes et al. | Real time monitoring of the impedance characteristics of Staphylococcal bacterial biofilm cultures with a modified CDC reactor system | |
| Pavlou et al. | Detection of Mycobacterium tuberculosis (TB) in vitro and in situ using an electronic nose in combination with a neural network system | |
| Paredes et al. | Label-free interdigitated microelectrode based biosensors for bacterial biofilm growth monitoring using Petri dishes | |
| US8637233B2 (en) | Device and method for identifying microbes and counting microbes and determining antimicrobial sensitivity | |
| US20140162310A1 (en) | Rapid detection of viable bacteria system and method | |
| Su et al. | Dielectrophoretic monitoring and interstrain separation of intact Clostridium difficile based on their S (Surface)-layers | |
| EP3356511B1 (en) | Methods for detecting viable infectious agents in a fluid sample using an electrolyte-insulator-semiconductor sensor | |
| CN105473740A (en) | Targeted approach to antibiotic susceptibility testing | |
| JP2016524465A (en) | Mass spectrum tolerance judgment by growth measurement | |
| US11518973B2 (en) | Device and method for automated antibiotic susceptibility testing of gram-negative bacteria | |
| Kargupta et al. | Rapid culture-based detection of living mycobacteria using microchannel electrical impedance spectroscopy (m-EIS) | |
| Yang et al. | Phenotypic and genotypic perspectives on detection methods for bacterial antimicrobial resistance in a One Health context: research progress and prospects | |
| Hasan et al. | Rapid ultrasensitive and high-throughput bioburden detection: microfluidics and instrumentation | |
| Samuels et al. | Classification of select category A and B bacteria by Fourier transform infrared spectroscopy | |
| Rodrigues et al. | Characterization of dual-species biofilms formed by bacteria isolated from milk | |
| Zabrocka et al. | A microfluidic device for real-time monitoring of Bacillus subtilis bacterial spores during germination based on non-specific physicochemical interactions on the nanoscale level | |
| EP3049531B1 (en) | Method for pathogen diagnosis using an electric field | |
| He et al. | A new MSPQC system for rapid detection of pathogens in clinical samples | |
| Yan et al. | ATP bioluminescence rapid detection of total viable count in soy sauce | |
| Abu Rumaila et al. | Electronic tongue for determining the limit of detection of human pathogenic bacteria | |
| Kargupta et al. | Detection by death: A rapid way to detect viable slow-growing microorganisms achieved using microchannel Electrical Impedance Spectroscopy (m-EIS) | |
| US20190293584A1 (en) | Detection of Living Cells | |
| Rieder et al. | Direct detection of the bacterial stress response in intact samples of platelets by differential impedance | |
| Dridi et al. | Characterization of prokaryotes using MALDI-TOF mass spectrometry |
Legal Events
| Date | Code | Title | Description |
|---|---|---|---|
| PUAI | Public reference made under article 153(3) epc to a published international application that has entered the european phase |
Free format text: ORIGINAL CODE: 0009012 |
|
| 17P | Request for examination filed |
Effective date: 20080821 |
|
| AK | Designated contracting states |
Kind code of ref document: A2 Designated state(s): AT BE BG CH CY CZ DE DK EE ES FI FR GB GR HU IE IS IT LI LT LU LV MC NL PL PT RO SE SI SK TR |
|
| AX | Request for extension of the european patent |
Extension state: AL BA HR MK RS |
|
| A4 | Supplementary search report drawn up and despatched |
Effective date: 20090209 |
|
| 17Q | First examination report despatched |
Effective date: 20090514 |
|
| DAX | Request for extension of the european patent (deleted) | ||
| GRAP | Despatch of communication of intention to grant a patent |
Free format text: ORIGINAL CODE: EPIDOSNIGR1 |
|
| INTG | Intention to grant announced |
Effective date: 20141017 |
|
| RIN1 | Information on inventor provided before grant (corrected) |
Inventor name: RIEDER, RONALD J. Inventor name: ZAVIZION, BORIS A. |
|
| GRAS | Grant fee paid |
Free format text: ORIGINAL CODE: EPIDOSNIGR3 |
|
| GRAA | (expected) grant |
Free format text: ORIGINAL CODE: 0009210 |
|
| AK | Designated contracting states |
Kind code of ref document: B1 Designated state(s): AT BE BG CH CY CZ DE DK EE ES FI FR GB GR HU IE IS IT LI LT LU LV MC NL PL PT RO SE SI SK TR |
|
| REG | Reference to a national code |
Ref country code: GB Ref legal event code: FG4D |
|
| REG | Reference to a national code |
Ref country code: CH Ref legal event code: EP |
|
| REG | Reference to a national code |
Ref country code: AT Ref legal event code: REF Ref document number: 710689 Country of ref document: AT Kind code of ref document: T Effective date: 20150315 |
|
| REG | Reference to a national code |
Ref country code: IE Ref legal event code: FG4D |
|
| REG | Reference to a national code |
Ref country code: DE Ref legal event code: R096 Ref document number: 602007040294 Country of ref document: DE Effective date: 20150402 |
|
| REG | Reference to a national code |
Ref country code: ES Ref legal event code: FG2A Ref document number: 2535836 Country of ref document: ES Kind code of ref document: T3 Effective date: 20150518 |
|
| REG | Reference to a national code |
Ref country code: NL Ref legal event code: VDEP Effective date: 20150218 |
|
| REG | Reference to a national code |
Ref country code: AT Ref legal event code: MK05 Ref document number: 710689 Country of ref document: AT Kind code of ref document: T Effective date: 20150218 |
|
| REG | Reference to a national code |
Ref country code: LT Ref legal event code: MG4D |
|
| PG25 | Lapsed in a contracting state [announced via postgrant information from national office to epo] |
Ref country code: FI Free format text: LAPSE BECAUSE OF FAILURE TO SUBMIT A TRANSLATION OF THE DESCRIPTION OR TO PAY THE FEE WITHIN THE PRESCRIBED TIME-LIMIT Effective date: 20150218 Ref country code: SE Free format text: LAPSE BECAUSE OF FAILURE TO SUBMIT A TRANSLATION OF THE DESCRIPTION OR TO PAY THE FEE WITHIN THE PRESCRIBED TIME-LIMIT Effective date: 20150218 Ref country code: LT Free format text: LAPSE BECAUSE OF FAILURE TO SUBMIT A TRANSLATION OF THE DESCRIPTION OR TO PAY THE FEE WITHIN THE PRESCRIBED TIME-LIMIT Effective date: 20150218 |
|
| PG25 | Lapsed in a contracting state [announced via postgrant information from national office to epo] |
Ref country code: NL Free format text: LAPSE BECAUSE OF FAILURE TO SUBMIT A TRANSLATION OF THE DESCRIPTION OR TO PAY THE FEE WITHIN THE PRESCRIBED TIME-LIMIT Effective date: 20150218 Ref country code: AT Free format text: LAPSE BECAUSE OF FAILURE TO SUBMIT A TRANSLATION OF THE DESCRIPTION OR TO PAY THE FEE WITHIN THE PRESCRIBED TIME-LIMIT Effective date: 20150218 Ref country code: IS Free format text: LAPSE BECAUSE OF FAILURE TO SUBMIT A TRANSLATION OF THE DESCRIPTION OR TO PAY THE FEE WITHIN THE PRESCRIBED TIME-LIMIT Effective date: 20150618 Ref country code: LV Free format text: LAPSE BECAUSE OF FAILURE TO SUBMIT A TRANSLATION OF THE DESCRIPTION OR TO PAY THE FEE WITHIN THE PRESCRIBED TIME-LIMIT Effective date: 20150218 Ref country code: GR Free format text: LAPSE BECAUSE OF FAILURE TO SUBMIT A TRANSLATION OF THE DESCRIPTION OR TO PAY THE FEE WITHIN THE PRESCRIBED TIME-LIMIT Effective date: 20150519 |
|
| PG25 | Lapsed in a contracting state [announced via postgrant information from national office to epo] |
Ref country code: CZ Free format text: LAPSE BECAUSE OF FAILURE TO SUBMIT A TRANSLATION OF THE DESCRIPTION OR TO PAY THE FEE WITHIN THE PRESCRIBED TIME-LIMIT Effective date: 20150218 Ref country code: DK Free format text: LAPSE BECAUSE OF FAILURE TO SUBMIT A TRANSLATION OF THE DESCRIPTION OR TO PAY THE FEE WITHIN THE PRESCRIBED TIME-LIMIT Effective date: 20150218 Ref country code: EE Free format text: LAPSE BECAUSE OF FAILURE TO SUBMIT A TRANSLATION OF THE DESCRIPTION OR TO PAY THE FEE WITHIN THE PRESCRIBED TIME-LIMIT Effective date: 20150218 Ref country code: SK Free format text: LAPSE BECAUSE OF FAILURE TO SUBMIT A TRANSLATION OF THE DESCRIPTION OR TO PAY THE FEE WITHIN THE PRESCRIBED TIME-LIMIT Effective date: 20150218 |
|
| REG | Reference to a national code |
Ref country code: RO Ref legal event code: EPE |
|
| REG | Reference to a national code |
Ref country code: DE Ref legal event code: R097 Ref document number: 602007040294 Country of ref document: DE |
|
| PG25 | Lapsed in a contracting state [announced via postgrant information from national office to epo] |
Ref country code: PL Free format text: LAPSE BECAUSE OF FAILURE TO SUBMIT A TRANSLATION OF THE DESCRIPTION OR TO PAY THE FEE WITHIN THE PRESCRIBED TIME-LIMIT Effective date: 20150218 |
|
| PLBE | No opposition filed within time limit |
Free format text: ORIGINAL CODE: 0009261 |
|
| STAA | Information on the status of an ep patent application or granted ep patent |
Free format text: STATUS: NO OPPOSITION FILED WITHIN TIME LIMIT |
|
| REG | Reference to a national code |
Ref country code: FR Ref legal event code: PLFP Year of fee payment: 10 |
|
| 26N | No opposition filed |
Effective date: 20151119 |
|
| PG25 | Lapsed in a contracting state [announced via postgrant information from national office to epo] |
Ref country code: SI Free format text: LAPSE BECAUSE OF FAILURE TO SUBMIT A TRANSLATION OF THE DESCRIPTION OR TO PAY THE FEE WITHIN THE PRESCRIBED TIME-LIMIT Effective date: 20150218 |
|
| PG25 | Lapsed in a contracting state [announced via postgrant information from national office to epo] |
Ref country code: BE Free format text: LAPSE BECAUSE OF FAILURE TO SUBMIT A TRANSLATION OF THE DESCRIPTION OR TO PAY THE FEE WITHIN THE PRESCRIBED TIME-LIMIT Effective date: 20150218 |
|
| PG25 | Lapsed in a contracting state [announced via postgrant information from national office to epo] |
Ref country code: LU Free format text: LAPSE BECAUSE OF FAILURE TO SUBMIT A TRANSLATION OF THE DESCRIPTION OR TO PAY THE FEE WITHIN THE PRESCRIBED TIME-LIMIT Effective date: 20160111 |
|
| REG | Reference to a national code |
Ref country code: CH Ref legal event code: PL |
|
| PG25 | Lapsed in a contracting state [announced via postgrant information from national office to epo] |
Ref country code: MC Free format text: LAPSE BECAUSE OF FAILURE TO SUBMIT A TRANSLATION OF THE DESCRIPTION OR TO PAY THE FEE WITHIN THE PRESCRIBED TIME-LIMIT Effective date: 20150218 |
|
| PG25 | Lapsed in a contracting state [announced via postgrant information from national office to epo] |
Ref country code: CH Free format text: LAPSE BECAUSE OF NON-PAYMENT OF DUE FEES Effective date: 20160131 Ref country code: LI Free format text: LAPSE BECAUSE OF NON-PAYMENT OF DUE FEES Effective date: 20160131 |
|
| REG | Reference to a national code |
Ref country code: IE Ref legal event code: MM4A |
|
| REG | Reference to a national code |
Ref country code: FR Ref legal event code: PLFP Year of fee payment: 11 |
|
| PG25 | Lapsed in a contracting state [announced via postgrant information from national office to epo] |
Ref country code: IE Free format text: LAPSE BECAUSE OF NON-PAYMENT OF DUE FEES Effective date: 20160111 |
|
| PGFP | Annual fee paid to national office [announced via postgrant information from national office to epo] |
Ref country code: RO Payment date: 20170105 Year of fee payment: 11 |
|
| PGFP | Annual fee paid to national office [announced via postgrant information from national office to epo] |
Ref country code: BG Payment date: 20170120 Year of fee payment: 11 |
|
| REG | Reference to a national code |
Ref country code: FR Ref legal event code: PLFP Year of fee payment: 12 |
|
| PG25 | Lapsed in a contracting state [announced via postgrant information from national office to epo] |
Ref country code: CY Free format text: LAPSE BECAUSE OF FAILURE TO SUBMIT A TRANSLATION OF THE DESCRIPTION OR TO PAY THE FEE WITHIN THE PRESCRIBED TIME-LIMIT Effective date: 20150218 Ref country code: HU Free format text: LAPSE BECAUSE OF FAILURE TO SUBMIT A TRANSLATION OF THE DESCRIPTION OR TO PAY THE FEE WITHIN THE PRESCRIBED TIME-LIMIT; INVALID AB INITIO Effective date: 20070111 |
|
| PG25 | Lapsed in a contracting state [announced via postgrant information from national office to epo] |
Ref country code: PT Free format text: LAPSE BECAUSE OF FAILURE TO SUBMIT A TRANSLATION OF THE DESCRIPTION OR TO PAY THE FEE WITHIN THE PRESCRIBED TIME-LIMIT Effective date: 20150218 Ref country code: TR Free format text: LAPSE BECAUSE OF FAILURE TO SUBMIT A TRANSLATION OF THE DESCRIPTION OR TO PAY THE FEE WITHIN THE PRESCRIBED TIME-LIMIT Effective date: 20150218 |
|
| PG25 | Lapsed in a contracting state [announced via postgrant information from national office to epo] |
Ref country code: RO Free format text: LAPSE BECAUSE OF NON-PAYMENT OF DUE FEES Effective date: 20180111 |
|
| PG25 | Lapsed in a contracting state [announced via postgrant information from national office to epo] |
Ref country code: BG Free format text: LAPSE BECAUSE OF NON-PAYMENT OF DUE FEES Effective date: 20180806 |
|
| PGFP | Annual fee paid to national office [announced via postgrant information from national office to epo] |
Ref country code: IT Payment date: 20190129 Year of fee payment: 13 Ref country code: DE Payment date: 20190121 Year of fee payment: 13 Ref country code: FR Payment date: 20190122 Year of fee payment: 13 Ref country code: ES Payment date: 20190215 Year of fee payment: 13 Ref country code: GB Payment date: 20190124 Year of fee payment: 13 |
|
| REG | Reference to a national code |
Ref country code: DE Ref legal event code: R119 Ref document number: 602007040294 Country of ref document: DE |
|
| GBPC | Gb: european patent ceased through non-payment of renewal fee |
Effective date: 20200111 |
|
| PG25 | Lapsed in a contracting state [announced via postgrant information from national office to epo] |
Ref country code: DE Free format text: LAPSE BECAUSE OF NON-PAYMENT OF DUE FEES Effective date: 20200801 Ref country code: FR Free format text: LAPSE BECAUSE OF NON-PAYMENT OF DUE FEES Effective date: 20200131 Ref country code: GB Free format text: LAPSE BECAUSE OF NON-PAYMENT OF DUE FEES Effective date: 20200111 |
|
| PG25 | Lapsed in a contracting state [announced via postgrant information from national office to epo] |
Ref country code: IT Free format text: LAPSE BECAUSE OF NON-PAYMENT OF DUE FEES Effective date: 20200111 |
|
| REG | Reference to a national code |
Ref country code: ES Ref legal event code: FD2A Effective date: 20210602 |
|
| PG25 | Lapsed in a contracting state [announced via postgrant information from national office to epo] |
Ref country code: ES Free format text: LAPSE BECAUSE OF NON-PAYMENT OF DUE FEES Effective date: 20200112 |