EP1955077B1 - Mass spectrometry assays for acetyltransferase/deacetylase activity - Google Patents
Mass spectrometry assays for acetyltransferase/deacetylase activity Download PDFInfo
- Publication number
- EP1955077B1 EP1955077B1 EP06844714A EP06844714A EP1955077B1 EP 1955077 B1 EP1955077 B1 EP 1955077B1 EP 06844714 A EP06844714 A EP 06844714A EP 06844714 A EP06844714 A EP 06844714A EP 1955077 B1 EP1955077 B1 EP 1955077B1
- Authority
- EP
- European Patent Office
- Prior art keywords
- sirtuin
- peptide
- peptide substrate
- sirt1
- assay
- Prior art date
- Legal status (The legal status is an assumption and is not a legal conclusion. Google has not performed a legal analysis and makes no representation as to the accuracy of the status listed.)
- Not-in-force
Links
- 230000000694 effects Effects 0.000 title claims abstract description 109
- 238000004949 mass spectrometry Methods 0.000 title claims abstract description 92
- 238000003556 assay Methods 0.000 title description 127
- 102000005421 acetyltransferase Human genes 0.000 title description 10
- 108020002494 acetyltransferase Proteins 0.000 title description 10
- 108090000765 processed proteins & peptides Proteins 0.000 claims abstract description 241
- 239000000758 substrate Substances 0.000 claims abstract description 215
- 238000000034 method Methods 0.000 claims abstract description 131
- 150000001875 compounds Chemical class 0.000 claims abstract description 119
- 230000021736 acetylation Effects 0.000 claims abstract description 24
- 238000006640 acetylation reaction Methods 0.000 claims abstract description 24
- 108050002485 Sirtuin Proteins 0.000 claims description 148
- 102000011990 Sirtuin Human genes 0.000 claims description 146
- 102000000344 Sirtuin 1 Human genes 0.000 claims description 143
- 108010041191 Sirtuin 1 Proteins 0.000 claims description 143
- 238000006243 chemical reaction Methods 0.000 claims description 62
- QNVSXXGDAPORNA-UHFFFAOYSA-N Resveratrol Natural products OC1=CC=CC(C=CC=2C=C(O)C(O)=CC=2)=C1 QNVSXXGDAPORNA-UHFFFAOYSA-N 0.000 claims description 49
- LUKBXSAWLPMMSZ-OWOJBTEDSA-N Trans-resveratrol Chemical compound C1=CC(O)=CC=C1\C=C\C1=CC(O)=CC(O)=C1 LUKBXSAWLPMMSZ-OWOJBTEDSA-N 0.000 claims description 49
- 235000021283 resveratrol Nutrition 0.000 claims description 49
- 229940016667 resveratrol Drugs 0.000 claims description 49
- 102000004196 processed proteins & peptides Human genes 0.000 claims description 35
- 238000012360 testing method Methods 0.000 claims description 32
- 239000000203 mixture Substances 0.000 claims description 23
- 125000003588 lysine group Chemical group [H]N([H])C([H])([H])C([H])([H])C([H])([H])C([H])([H])C([H])(N([H])[H])C(*)=O 0.000 claims description 22
- 230000003213 activating effect Effects 0.000 claims description 16
- 238000000132 electrospray ionisation Methods 0.000 claims description 16
- 230000007423 decrease Effects 0.000 claims description 12
- 239000011159 matrix material Substances 0.000 claims description 10
- 150000003384 small molecules Chemical class 0.000 claims description 8
- 238000003795 desorption Methods 0.000 claims description 5
- 108090000623 proteins and genes Proteins 0.000 abstract description 57
- 102000004169 proteins and genes Human genes 0.000 abstract description 52
- IAZDPXIOMUYVGZ-UHFFFAOYSA-N Dimethylsulphoxide Chemical compound CS(C)=O IAZDPXIOMUYVGZ-UHFFFAOYSA-N 0.000 description 128
- 210000004027 cell Anatomy 0.000 description 110
- ZKHQWZAMYRWXGA-KQYNXXCUSA-N Adenosine triphosphate Chemical compound C1=NC=2C(N)=NC=NC=2N1[C@@H]1O[C@H](COP(O)(=O)OP(O)(=O)OP(O)(O)=O)[C@@H](O)[C@H]1O ZKHQWZAMYRWXGA-KQYNXXCUSA-N 0.000 description 66
- ZKHQWZAMYRWXGA-UHFFFAOYSA-N Adenosine triphosphate Natural products C1=NC=2C(N)=NC=NC=2N1C1OC(COP(O)(=O)OP(O)(=O)OP(O)(O)=O)C(O)C1O ZKHQWZAMYRWXGA-UHFFFAOYSA-N 0.000 description 66
- 229960001456 adenosine triphosphate Drugs 0.000 description 66
- 235000018102 proteins Nutrition 0.000 description 45
- FAPWRFPIFSIZLT-UHFFFAOYSA-M Sodium chloride Chemical compound [Na+].[Cl-] FAPWRFPIFSIZLT-UHFFFAOYSA-M 0.000 description 43
- TWRXJAOTZQYOKJ-UHFFFAOYSA-L Magnesium chloride Chemical compound [Mg+2].[Cl-].[Cl-] TWRXJAOTZQYOKJ-UHFFFAOYSA-L 0.000 description 38
- 102000004190 Enzymes Human genes 0.000 description 32
- 108090000790 Enzymes Proteins 0.000 description 32
- 229940088598 enzyme Drugs 0.000 description 32
- 239000000047 product Substances 0.000 description 32
- 235000001014 amino acid Nutrition 0.000 description 30
- BAWFJGJZGIEFAR-NNYOXOHSSA-O NAD(+) Chemical compound NC(=O)C1=CC=C[N+]([C@H]2[C@@H]([C@H](O)[C@@H](COP(O)(=O)OP(O)(=O)OC[C@@H]3[C@H]([C@@H](O)[C@@H](O3)N3C4=NC=NC(N)=C4N=C3)O)O2)O)=C1 BAWFJGJZGIEFAR-NNYOXOHSSA-O 0.000 description 29
- 229940024606 amino acid Drugs 0.000 description 26
- 150000001413 amino acids Chemical class 0.000 description 26
- 239000006166 lysate Substances 0.000 description 25
- 102100025064 Cellular tumor antigen p53 Human genes 0.000 description 24
- 101000721661 Homo sapiens Cellular tumor antigen p53 Proteins 0.000 description 24
- 230000001413 cellular effect Effects 0.000 description 24
- 230000002209 hydrophobic effect Effects 0.000 description 23
- 102000000478 Sirtuin 3 Human genes 0.000 description 22
- BDAGIHXWWSANSR-UHFFFAOYSA-N methanoic acid Natural products OC=O BDAGIHXWWSANSR-UHFFFAOYSA-N 0.000 description 22
- 239000003981 vehicle Substances 0.000 description 22
- 230000014509 gene expression Effects 0.000 description 21
- 239000011780 sodium chloride Substances 0.000 description 21
- QKNYBSVHEMOAJP-UHFFFAOYSA-N 2-amino-2-(hydroxymethyl)propane-1,3-diol;hydron;chloride Chemical compound Cl.OCC(N)(CO)CO QKNYBSVHEMOAJP-UHFFFAOYSA-N 0.000 description 20
- 125000003275 alpha amino acid group Chemical group 0.000 description 20
- 229910001629 magnesium chloride Inorganic materials 0.000 description 19
- DFPAKSUCGFBDDF-UHFFFAOYSA-N Nicotinamide Chemical compound NC(=O)C1=CC=CN=C1 DFPAKSUCGFBDDF-UHFFFAOYSA-N 0.000 description 18
- 230000004913 activation Effects 0.000 description 17
- 239000000523 sample Substances 0.000 description 17
- ZSLZBFCDCINBPY-ZSJPKINUSA-N acetyl-CoA Chemical compound O[C@@H]1[C@H](OP(O)(O)=O)[C@@H](COP(O)(=O)OP(O)(=O)OCC(C)(C)[C@@H](O)C(=O)NCCC(=O)NCCSC(=O)C)O[C@H]1N1C2=NC=NC(N)=C2N=C1 ZSLZBFCDCINBPY-ZSJPKINUSA-N 0.000 description 16
- 239000000126 substance Substances 0.000 description 16
- 108010041218 Sirtuin 3 Proteins 0.000 description 15
- 102000004243 Tubulin Human genes 0.000 description 14
- 108090000704 Tubulin Proteins 0.000 description 14
- 125000000539 amino acid group Chemical group 0.000 description 14
- 239000000872 buffer Substances 0.000 description 14
- 238000001262 western blot Methods 0.000 description 14
- 108010033040 Histones Proteins 0.000 description 13
- 210000000265 leukocyte Anatomy 0.000 description 13
- 238000011282 treatment Methods 0.000 description 13
- 239000012224 working solution Substances 0.000 description 13
- 231100000582 ATP assay Toxicity 0.000 description 12
- 102000000477 Sirtuin 2 Human genes 0.000 description 12
- 108010041216 Sirtuin 2 Proteins 0.000 description 12
- 230000015572 biosynthetic process Effects 0.000 description 12
- 238000000423 cell based assay Methods 0.000 description 12
- 230000003833 cell viability Effects 0.000 description 12
- 238000001514 detection method Methods 0.000 description 12
- 238000002474 experimental method Methods 0.000 description 12
- 210000001519 tissue Anatomy 0.000 description 12
- OSWFIVFLDKOXQC-UHFFFAOYSA-N 4-(3-methoxyphenyl)aniline Chemical compound COC1=CC=CC(C=2C=CC(N)=CC=2)=C1 OSWFIVFLDKOXQC-UHFFFAOYSA-N 0.000 description 11
- 125000002777 acetyl group Chemical group [H]C([H])([H])C(*)=O 0.000 description 11
- 235000019253 formic acid Nutrition 0.000 description 11
- 239000012634 fragment Substances 0.000 description 11
- 238000002360 preparation method Methods 0.000 description 11
- 239000012190 activator Substances 0.000 description 10
- 230000002438 mitochondrial effect Effects 0.000 description 10
- XLYOFNOQVPJJNP-UHFFFAOYSA-N water Substances O XLYOFNOQVPJJNP-UHFFFAOYSA-N 0.000 description 10
- 102000003964 Histone deacetylase Human genes 0.000 description 9
- 108090000353 Histone deacetylase Proteins 0.000 description 9
- 230000000875 corresponding effect Effects 0.000 description 9
- LOKCTEFSRHRXRJ-UHFFFAOYSA-I dipotassium trisodium dihydrogen phosphate hydrogen phosphate dichloride Chemical compound P(=O)(O)(O)[O-].[K+].P(=O)(O)([O-])[O-].[Na+].[Na+].[Cl-].[K+].[Cl-].[Na+] LOKCTEFSRHRXRJ-UHFFFAOYSA-I 0.000 description 9
- 238000004128 high performance liquid chromatography Methods 0.000 description 9
- 238000000099 in vitro assay Methods 0.000 description 9
- 238000004811 liquid chromatography Methods 0.000 description 9
- 229960003966 nicotinamide Drugs 0.000 description 9
- 235000005152 nicotinamide Nutrition 0.000 description 9
- 239000011570 nicotinamide Substances 0.000 description 9
- 239000012071 phase Substances 0.000 description 9
- 239000002953 phosphate buffered saline Substances 0.000 description 9
- 230000008569 process Effects 0.000 description 9
- 230000035945 sensitivity Effects 0.000 description 9
- -1 E2F Proteins 0.000 description 8
- LRQKBLKVPFOOQJ-YFKPBYRVSA-N L-norleucine Chemical compound CCCC[C@H]([NH3+])C([O-])=O LRQKBLKVPFOOQJ-YFKPBYRVSA-N 0.000 description 8
- 241001465754 Metazoa Species 0.000 description 8
- 108091005770 SIRT3 Proteins 0.000 description 8
- 230000006196 deacetylation Effects 0.000 description 8
- 238000003381 deacetylation reaction Methods 0.000 description 8
- 239000000975 dye Substances 0.000 description 8
- 239000008188 pellet Substances 0.000 description 8
- 238000012216 screening Methods 0.000 description 8
- 239000000243 solution Substances 0.000 description 8
- KDXKERNSBIXSRK-UHFFFAOYSA-N Lysine Natural products NCCCCC(N)C(O)=O KDXKERNSBIXSRK-UHFFFAOYSA-N 0.000 description 7
- 101000654471 Mus musculus NAD-dependent protein deacetylase sirtuin-1 Proteins 0.000 description 7
- 239000012491 analyte Substances 0.000 description 7
- 239000000463 material Substances 0.000 description 7
- 229920001184 polypeptide Polymers 0.000 description 7
- 238000012546 transfer Methods 0.000 description 7
- YBJHBAHKTGYVGT-ZKWXMUAHSA-N (+)-Biotin Chemical compound N1C(=O)N[C@@H]2[C@H](CCCCC(=O)O)SC[C@@H]21 YBJHBAHKTGYVGT-ZKWXMUAHSA-N 0.000 description 6
- WEVYAHXRMPXWCK-UHFFFAOYSA-N Acetonitrile Chemical compound CC#N WEVYAHXRMPXWCK-UHFFFAOYSA-N 0.000 description 6
- 102100037458 Dephospho-CoA kinase Human genes 0.000 description 6
- 102100034523 Histone H4 Human genes 0.000 description 6
- OKKJLVBELUTLKV-UHFFFAOYSA-N Methanol Chemical compound OC OKKJLVBELUTLKV-UHFFFAOYSA-N 0.000 description 6
- 241000699666 Mus <mouse, genus> Species 0.000 description 6
- 238000004458 analytical method Methods 0.000 description 6
- 238000013459 approach Methods 0.000 description 6
- 239000012131 assay buffer Substances 0.000 description 6
- 239000003153 chemical reaction reagent Substances 0.000 description 6
- 108010049285 dephospho-CoA kinase Proteins 0.000 description 6
- 239000003112 inhibitor Substances 0.000 description 6
- 238000004895 liquid chromatography mass spectrometry Methods 0.000 description 6
- 239000002773 nucleotide Substances 0.000 description 6
- 125000003729 nucleotide group Chemical group 0.000 description 6
- 238000006467 substitution reaction Methods 0.000 description 6
- 239000006228 supernatant Substances 0.000 description 6
- 108091003079 Bovine Serum Albumin Proteins 0.000 description 5
- 241000283707 Capra Species 0.000 description 5
- 102000003893 Histone acetyltransferases Human genes 0.000 description 5
- 108090000246 Histone acetyltransferases Proteins 0.000 description 5
- DTERQYGMUDWYAZ-ZETCQYMHSA-N N(6)-acetyl-L-lysine Chemical compound CC(=O)NCCCC[C@H]([NH3+])C([O-])=O DTERQYGMUDWYAZ-ZETCQYMHSA-N 0.000 description 5
- 240000004808 Saccharomyces cerevisiae Species 0.000 description 5
- 239000002253 acid Substances 0.000 description 5
- 239000011324 bead Substances 0.000 description 5
- 230000008859 change Effects 0.000 description 5
- 239000003795 chemical substances by application Substances 0.000 description 5
- 231100000673 dose–response relationship Toxicity 0.000 description 5
- 238000007876 drug discovery Methods 0.000 description 5
- 239000012091 fetal bovine serum Substances 0.000 description 5
- 238000004817 gas chromatography Methods 0.000 description 5
- 230000002401 inhibitory effect Effects 0.000 description 5
- 230000005764 inhibitory process Effects 0.000 description 5
- 150000002500 ions Chemical class 0.000 description 5
- 238000001840 matrix-assisted laser desorption--ionisation time-of-flight mass spectrometry Methods 0.000 description 5
- 238000005259 measurement Methods 0.000 description 5
- 238000000746 purification Methods 0.000 description 5
- 238000004007 reversed phase HPLC Methods 0.000 description 5
- 238000003786 synthesis reaction Methods 0.000 description 5
- QTBSBXVTEAMEQO-UHFFFAOYSA-M Acetate Chemical compound CC([O-])=O QTBSBXVTEAMEQO-UHFFFAOYSA-M 0.000 description 4
- 108020004414 DNA Proteins 0.000 description 4
- 238000004252 FT/ICR mass spectrometry Methods 0.000 description 4
- 102000006947 Histones Human genes 0.000 description 4
- 101000654472 Homo sapiens NAD-dependent protein deacetylase sirtuin-1 Proteins 0.000 description 4
- 101000863566 Homo sapiens NAD-dependent protein deacetylase sirtuin-3, mitochondrial Proteins 0.000 description 4
- 108060001084 Luciferase Proteins 0.000 description 4
- 206010028980 Neoplasm Diseases 0.000 description 4
- 108090000854 Oxidoreductases Proteins 0.000 description 4
- 102000004316 Oxidoreductases Human genes 0.000 description 4
- VYPSYNLAJGMNEJ-UHFFFAOYSA-N Silicium dioxide Chemical compound O=[Si]=O VYPSYNLAJGMNEJ-UHFFFAOYSA-N 0.000 description 4
- 238000003149 assay kit Methods 0.000 description 4
- 238000000065 atmospheric pressure chemical ionisation Methods 0.000 description 4
- 210000004369 blood Anatomy 0.000 description 4
- 239000008280 blood Substances 0.000 description 4
- 208000037265 diseases, disorders, signs and symptoms Diseases 0.000 description 4
- 238000001952 enzyme assay Methods 0.000 description 4
- 230000005284 excitation Effects 0.000 description 4
- 238000002866 fluorescence resonance energy transfer Methods 0.000 description 4
- 230000012010 growth Effects 0.000 description 4
- 239000003276 histone deacetylase inhibitor Substances 0.000 description 4
- 102000056482 human SIRT1 Human genes 0.000 description 4
- 238000011534 incubation Methods 0.000 description 4
- 210000004185 liver Anatomy 0.000 description 4
- 230000007246 mechanism Effects 0.000 description 4
- 125000001360 methionine group Chemical group N[C@@H](CCSC)C(=O)* 0.000 description 4
- 210000003205 muscle Anatomy 0.000 description 4
- 210000003098 myoblast Anatomy 0.000 description 4
- 102000039446 nucleic acids Human genes 0.000 description 4
- 108020004707 nucleic acids Proteins 0.000 description 4
- 150000007523 nucleic acids Chemical class 0.000 description 4
- 239000011535 reaction buffer Substances 0.000 description 4
- 238000009738 saturating Methods 0.000 description 4
- 238000000926 separation method Methods 0.000 description 4
- 239000011550 stock solution Substances 0.000 description 4
- 238000004448 titration Methods 0.000 description 4
- 229940040064 ubiquinol Drugs 0.000 description 4
- FUZYTVDVLBBXDL-UHFFFAOYSA-N 6-chloro-2,3,4,9-tetrahydro-1H-carbazole-1-carboxamide Chemical compound N1C2=CC=C(Cl)C=C2C2=C1C(C(=O)N)CCC2 FUZYTVDVLBBXDL-UHFFFAOYSA-N 0.000 description 3
- QTBSBXVTEAMEQO-UHFFFAOYSA-N Acetic acid Chemical compound CC(O)=O QTBSBXVTEAMEQO-UHFFFAOYSA-N 0.000 description 3
- WFDIJRYMOXRFFG-UHFFFAOYSA-N Acetic anhydride Chemical compound CC(=O)OC(C)=O WFDIJRYMOXRFFG-UHFFFAOYSA-N 0.000 description 3
- 0 COc(c(*)c1)ccc1S(Nc(cccc1)c1-c1nc2ccccc2[n]1)(=O)=O Chemical compound COc(c(*)c1)ccc1S(Nc(cccc1)c1-c1nc2ccccc2[n]1)(=O)=O 0.000 description 3
- 101100422412 Catharanthus roseus SSRP1 gene Proteins 0.000 description 3
- IGXWBGJHJZYPQS-SSDOTTSWSA-N D-Luciferin Chemical compound OC(=O)[C@H]1CSC(C=2SC3=CC=C(O)C=C3N=2)=N1 IGXWBGJHJZYPQS-SSDOTTSWSA-N 0.000 description 3
- 101000981495 Drosophila melanogaster Protein pangolin, isoform J Proteins 0.000 description 3
- 101000981512 Drosophila melanogaster Protein pangolin, isoforms A/H/I/S Proteins 0.000 description 3
- 102100031690 Erythroid transcription factor Human genes 0.000 description 3
- 101710100588 Erythroid transcription factor Proteins 0.000 description 3
- DHMQDGOQFOQNFH-UHFFFAOYSA-N Glycine Chemical compound NCC(O)=O DHMQDGOQFOQNFH-UHFFFAOYSA-N 0.000 description 3
- 101150004167 HMG gene Proteins 0.000 description 3
- 102100039869 Histone H2B type F-S Human genes 0.000 description 3
- 101001035372 Homo sapiens Histone H2B type F-S Proteins 0.000 description 3
- 102100022248 Krueppel-like factor 1 Human genes 0.000 description 3
- ZDXPYRJPNDTMRX-VKHMYHEASA-N L-glutamine Chemical compound OC(=O)[C@@H](N)CCC(N)=O ZDXPYRJPNDTMRX-VKHMYHEASA-N 0.000 description 3
- AGPKZVBTJJNPAG-WHFBIAKZSA-N L-isoleucine Chemical compound CC[C@H](C)[C@H](N)C(O)=O AGPKZVBTJJNPAG-WHFBIAKZSA-N 0.000 description 3
- FFEARJCKVFRZRR-BYPYZUCNSA-N L-methionine Chemical compound CSCC[C@H](N)C(O)=O FFEARJCKVFRZRR-BYPYZUCNSA-N 0.000 description 3
- 239000005089 Luciferase Substances 0.000 description 3
- 239000004472 Lysine Substances 0.000 description 3
- 241000124008 Mammalia Species 0.000 description 3
- GXCLVBGFBYZDAG-UHFFFAOYSA-N N-[2-(1H-indol-3-yl)ethyl]-N-methylprop-2-en-1-amine Chemical compound CN(CCC1=CNC2=C1C=CC=C2)CC=C GXCLVBGFBYZDAG-UHFFFAOYSA-N 0.000 description 3
- 241000283973 Oryctolagus cuniculus Species 0.000 description 3
- DNIAPMSPPWPWGF-UHFFFAOYSA-N Propylene glycol Chemical compound CC(O)CO DNIAPMSPPWPWGF-UHFFFAOYSA-N 0.000 description 3
- 108010087776 Proto-Oncogene Proteins c-myb Proteins 0.000 description 3
- 102000009096 Proto-Oncogene Proteins c-myb Human genes 0.000 description 3
- CZMRCDWAGMRECN-UGDNZRGBSA-N Sucrose Chemical compound O[C@H]1[C@H](O)[C@@H](CO)O[C@@]1(CO)O[C@@H]1[C@H](O)[C@@H](O)[C@H](O)[C@@H](CO)O1 CZMRCDWAGMRECN-UGDNZRGBSA-N 0.000 description 3
- PZBFGYYEXUXCOF-UHFFFAOYSA-N TCEP Chemical compound OC(=O)CCP(CCC(O)=O)CCC(O)=O PZBFGYYEXUXCOF-UHFFFAOYSA-N 0.000 description 3
- 101001023030 Toxoplasma gondii Myosin-D Proteins 0.000 description 3
- 238000002820 assay format Methods 0.000 description 3
- 229960002685 biotin Drugs 0.000 description 3
- 235000020958 biotin Nutrition 0.000 description 3
- 239000011616 biotin Substances 0.000 description 3
- 239000013592 cell lysate Substances 0.000 description 3
- 210000000170 cell membrane Anatomy 0.000 description 3
- 239000006285 cell suspension Substances 0.000 description 3
- 238000007796 conventional method Methods 0.000 description 3
- 230000003247 decreasing effect Effects 0.000 description 3
- 230000001419 dependent effect Effects 0.000 description 3
- 238000010790 dilution Methods 0.000 description 3
- 239000012895 dilution Substances 0.000 description 3
- 201000010099 disease Diseases 0.000 description 3
- 239000003814 drug Substances 0.000 description 3
- 238000002330 electrospray ionisation mass spectrometry Methods 0.000 description 3
- 238000005516 engineering process Methods 0.000 description 3
- 108010089558 erythroid Kruppel-like factor Proteins 0.000 description 3
- 238000009472 formulation Methods 0.000 description 3
- 238000002290 gas chromatography-mass spectrometry Methods 0.000 description 3
- 238000013537 high throughput screening Methods 0.000 description 3
- 102000045076 human SIRT3 Human genes 0.000 description 3
- 230000000984 immunochemical effect Effects 0.000 description 3
- 238000000338 in vitro Methods 0.000 description 3
- 238000001727 in vivo Methods 0.000 description 3
- 239000007788 liquid Substances 0.000 description 3
- 238000001294 liquid chromatography-tandem mass spectrometry Methods 0.000 description 3
- 239000002609 medium Substances 0.000 description 3
- 229930182817 methionine Natural products 0.000 description 3
- 210000003470 mitochondria Anatomy 0.000 description 3
- 230000010627 oxidative phosphorylation Effects 0.000 description 3
- 230000000144 pharmacologic effect Effects 0.000 description 3
- 229920005862 polyol Polymers 0.000 description 3
- 150000003077 polyols Chemical class 0.000 description 3
- 238000011002 quantification Methods 0.000 description 3
- 238000011160 research Methods 0.000 description 3
- 238000000527 sonication Methods 0.000 description 3
- 238000001228 spectrum Methods 0.000 description 3
- 238000012289 standard assay Methods 0.000 description 3
- 238000004885 tandem mass spectrometry Methods 0.000 description 3
- 230000001225 therapeutic effect Effects 0.000 description 3
- 239000013598 vector Substances 0.000 description 3
- 230000035899 viability Effects 0.000 description 3
- 239000012116 Alexa Fluor 680 Substances 0.000 description 2
- 108010017384 Blood Proteins Proteins 0.000 description 2
- 102000004506 Blood Proteins Human genes 0.000 description 2
- LFQSCWFLJHTTHZ-UHFFFAOYSA-N Ethanol Chemical compound CCO LFQSCWFLJHTTHZ-UHFFFAOYSA-N 0.000 description 2
- PEDCQBHIVMGVHV-UHFFFAOYSA-N Glycerine Chemical compound OCC(O)CO PEDCQBHIVMGVHV-UHFFFAOYSA-N 0.000 description 2
- 241000282412 Homo Species 0.000 description 2
- 101000825628 Homo sapiens NAD-dependent protein deacetylase sirtuin-2 Proteins 0.000 description 2
- QNAYBMKLOCPYGJ-REOHCLBHSA-N L-alanine Chemical compound C[C@H](N)C(O)=O QNAYBMKLOCPYGJ-REOHCLBHSA-N 0.000 description 2
- 229930182816 L-glutamine Natural products 0.000 description 2
- COLNVLDHVKWLRT-QMMMGPOBSA-N L-phenylalanine Chemical compound OC(=O)[C@@H](N)CC1=CC=CC=C1 COLNVLDHVKWLRT-QMMMGPOBSA-N 0.000 description 2
- QIVBCDIJIAJPQS-VIFPVBQESA-N L-tryptophane Chemical compound C1=CC=C2C(C[C@H](N)C(O)=O)=CNC2=C1 QIVBCDIJIAJPQS-VIFPVBQESA-N 0.000 description 2
- 102100026934 Mitochondrial intermediate peptidase Human genes 0.000 description 2
- 108010047660 Mitochondrial intermediate peptidase Proteins 0.000 description 2
- 108010042046 Mitochondrial processing peptidase Proteins 0.000 description 2
- 208000022873 Ocular disease Diseases 0.000 description 2
- 108091034117 Oligonucleotide Proteins 0.000 description 2
- 108091005804 Peptidases Proteins 0.000 description 2
- 239000012979 RPMI medium Substances 0.000 description 2
- 102100037486 Reverse transcriptase/ribonuclease H Human genes 0.000 description 2
- 238000012300 Sequence Analysis Methods 0.000 description 2
- 229930006000 Sucrose Natural products 0.000 description 2
- 102000040945 Transcription factor Human genes 0.000 description 2
- 108091023040 Transcription factor Proteins 0.000 description 2
- QIVBCDIJIAJPQS-UHFFFAOYSA-N Tryptophan Natural products C1=CC=C2C(CC(N)C(O)=O)=CNC2=C1 QIVBCDIJIAJPQS-UHFFFAOYSA-N 0.000 description 2
- JLCPHMBAVCMARE-UHFFFAOYSA-N [3-[[3-[[3-[[3-[[3-[[3-[[3-[[3-[[3-[[3-[[3-[[5-(2-amino-6-oxo-1H-purin-9-yl)-3-[[3-[[3-[[3-[[3-[[3-[[5-(2-amino-6-oxo-1H-purin-9-yl)-3-[[5-(2-amino-6-oxo-1H-purin-9-yl)-3-hydroxyoxolan-2-yl]methoxy-hydroxyphosphoryl]oxyoxolan-2-yl]methoxy-hydroxyphosphoryl]oxy-5-(5-methyl-2,4-dioxopyrimidin-1-yl)oxolan-2-yl]methoxy-hydroxyphosphoryl]oxy-5-(6-aminopurin-9-yl)oxolan-2-yl]methoxy-hydroxyphosphoryl]oxy-5-(6-aminopurin-9-yl)oxolan-2-yl]methoxy-hydroxyphosphoryl]oxy-5-(6-aminopurin-9-yl)oxolan-2-yl]methoxy-hydroxyphosphoryl]oxy-5-(6-aminopurin-9-yl)oxolan-2-yl]methoxy-hydroxyphosphoryl]oxyoxolan-2-yl]methoxy-hydroxyphosphoryl]oxy-5-(5-methyl-2,4-dioxopyrimidin-1-yl)oxolan-2-yl]methoxy-hydroxyphosphoryl]oxy-5-(4-amino-2-oxopyrimidin-1-yl)oxolan-2-yl]methoxy-hydroxyphosphoryl]oxy-5-(5-methyl-2,4-dioxopyrimidin-1-yl)oxolan-2-yl]methoxy-hydroxyphosphoryl]oxy-5-(5-methyl-2,4-dioxopyrimidin-1-yl)oxolan-2-yl]methoxy-hydroxyphosphoryl]oxy-5-(6-aminopurin-9-yl)oxolan-2-yl]methoxy-hydroxyphosphoryl]oxy-5-(6-aminopurin-9-yl)oxolan-2-yl]methoxy-hydroxyphosphoryl]oxy-5-(4-amino-2-oxopyrimidin-1-yl)oxolan-2-yl]methoxy-hydroxyphosphoryl]oxy-5-(4-amino-2-oxopyrimidin-1-yl)oxolan-2-yl]methoxy-hydroxyphosphoryl]oxy-5-(4-amino-2-oxopyrimidin-1-yl)oxolan-2-yl]methoxy-hydroxyphosphoryl]oxy-5-(6-aminopurin-9-yl)oxolan-2-yl]methoxy-hydroxyphosphoryl]oxy-5-(4-amino-2-oxopyrimidin-1-yl)oxolan-2-yl]methyl [5-(6-aminopurin-9-yl)-2-(hydroxymethyl)oxolan-3-yl] hydrogen phosphate Polymers Cc1cn(C2CC(OP(O)(=O)OCC3OC(CC3OP(O)(=O)OCC3OC(CC3O)n3cnc4c3nc(N)[nH]c4=O)n3cnc4c3nc(N)[nH]c4=O)C(COP(O)(=O)OC3CC(OC3COP(O)(=O)OC3CC(OC3COP(O)(=O)OC3CC(OC3COP(O)(=O)OC3CC(OC3COP(O)(=O)OC3CC(OC3COP(O)(=O)OC3CC(OC3COP(O)(=O)OC3CC(OC3COP(O)(=O)OC3CC(OC3COP(O)(=O)OC3CC(OC3COP(O)(=O)OC3CC(OC3COP(O)(=O)OC3CC(OC3COP(O)(=O)OC3CC(OC3COP(O)(=O)OC3CC(OC3COP(O)(=O)OC3CC(OC3COP(O)(=O)OC3CC(OC3COP(O)(=O)OC3CC(OC3COP(O)(=O)OC3CC(OC3CO)n3cnc4c(N)ncnc34)n3ccc(N)nc3=O)n3cnc4c(N)ncnc34)n3ccc(N)nc3=O)n3ccc(N)nc3=O)n3ccc(N)nc3=O)n3cnc4c(N)ncnc34)n3cnc4c(N)ncnc34)n3cc(C)c(=O)[nH]c3=O)n3cc(C)c(=O)[nH]c3=O)n3ccc(N)nc3=O)n3cc(C)c(=O)[nH]c3=O)n3cnc4c3nc(N)[nH]c4=O)n3cnc4c(N)ncnc34)n3cnc4c(N)ncnc34)n3cnc4c(N)ncnc34)n3cnc4c(N)ncnc34)O2)c(=O)[nH]c1=O JLCPHMBAVCMARE-UHFFFAOYSA-N 0.000 description 2
- 239000013543 active substance Substances 0.000 description 2
- 235000004279 alanine Nutrition 0.000 description 2
- 125000001931 aliphatic group Chemical group 0.000 description 2
- 239000002246 antineoplastic agent Substances 0.000 description 2
- 230000006907 apoptotic process Effects 0.000 description 2
- 238000011948 assay development Methods 0.000 description 2
- 238000005415 bioluminescence Methods 0.000 description 2
- 230000029918 bioluminescence Effects 0.000 description 2
- 239000000090 biomarker Substances 0.000 description 2
- 210000004899 c-terminal region Anatomy 0.000 description 2
- 201000011510 cancer Diseases 0.000 description 2
- 238000004113 cell culture Methods 0.000 description 2
- 230000010261 cell growth Effects 0.000 description 2
- 238000003776 cleavage reaction Methods 0.000 description 2
- 101150018117 cobB gene Proteins 0.000 description 2
- 239000013078 crystal Substances 0.000 description 2
- 230000009089 cytolysis Effects 0.000 description 2
- 238000013461 design Methods 0.000 description 2
- 239000003599 detergent Substances 0.000 description 2
- 238000011161 development Methods 0.000 description 2
- 230000018109 developmental process Effects 0.000 description 2
- 239000003937 drug carrier Substances 0.000 description 2
- 238000009509 drug development Methods 0.000 description 2
- 230000002255 enzymatic effect Effects 0.000 description 2
- MMXKVMNBHPAILY-UHFFFAOYSA-N ethyl laurate Chemical compound CCCCCCCCCCCC(=O)OCC MMXKVMNBHPAILY-UHFFFAOYSA-N 0.000 description 2
- 238000013401 experimental design Methods 0.000 description 2
- 235000019197 fats Nutrition 0.000 description 2
- 230000009036 growth inhibition Effects 0.000 description 2
- 239000001963 growth medium Substances 0.000 description 2
- 102000050401 human SIRT2 Human genes 0.000 description 2
- 230000003834 intracellular effect Effects 0.000 description 2
- 238000005040 ion trap Methods 0.000 description 2
- 238000004020 luminiscence type Methods 0.000 description 2
- 230000014759 maintenance of location Effects 0.000 description 2
- 238000004519 manufacturing process Methods 0.000 description 2
- 238000001819 mass spectrum Methods 0.000 description 2
- 239000012528 membrane Substances 0.000 description 2
- 230000008437 mitochondrial biogenesis Effects 0.000 description 2
- 230000004898 mitochondrial function Effects 0.000 description 2
- 238000010369 molecular cloning Methods 0.000 description 2
- 239000013642 negative control Substances 0.000 description 2
- 201000001119 neuropathy Diseases 0.000 description 2
- 230000007823 neuropathy Effects 0.000 description 2
- 231100000252 nontoxic Toxicity 0.000 description 2
- 230000003000 nontoxic effect Effects 0.000 description 2
- 239000003960 organic solvent Substances 0.000 description 2
- 230000003647 oxidation Effects 0.000 description 2
- 238000007254 oxidation reaction Methods 0.000 description 2
- 230000002093 peripheral effect Effects 0.000 description 2
- 208000033808 peripheral neuropathy Diseases 0.000 description 2
- 230000035699 permeability Effects 0.000 description 2
- 239000008194 pharmaceutical composition Substances 0.000 description 2
- 239000000546 pharmaceutical excipient Substances 0.000 description 2
- 239000000825 pharmaceutical preparation Substances 0.000 description 2
- COLNVLDHVKWLRT-UHFFFAOYSA-N phenylalanine Natural products OC(=O)C(N)CC1=CC=CC=C1 COLNVLDHVKWLRT-UHFFFAOYSA-N 0.000 description 2
- 230000009467 reduction Effects 0.000 description 2
- 230000002829 reductive effect Effects 0.000 description 2
- PYWVYCXTNDRMGF-UHFFFAOYSA-N rhodamine B Chemical compound [Cl-].C=12C=CC(=[N+](CC)CC)C=C2OC2=CC(N(CC)CC)=CC=C2C=1C1=CC=CC=C1C(O)=O PYWVYCXTNDRMGF-UHFFFAOYSA-N 0.000 description 2
- 230000007017 scission Effects 0.000 description 2
- 239000000377 silicon dioxide Substances 0.000 description 2
- 101150084733 sir-2.1 gene Proteins 0.000 description 2
- 101150089009 sir2 gene Proteins 0.000 description 2
- 239000007787 solid Substances 0.000 description 2
- 238000010561 standard procedure Methods 0.000 description 2
- 230000000638 stimulation Effects 0.000 description 2
- UCSJYZPVAKXKNQ-HZYVHMACSA-N streptomycin Chemical compound CN[C@H]1[C@H](O)[C@@H](O)[C@H](CO)O[C@H]1O[C@@H]1[C@](C=O)(O)[C@H](C)O[C@H]1O[C@@H]1[C@@H](NC(N)=N)[C@H](O)[C@@H](NC(N)=N)[C@H](O)[C@H]1O UCSJYZPVAKXKNQ-HZYVHMACSA-N 0.000 description 2
- 230000035882 stress Effects 0.000 description 2
- 239000005720 sucrose Substances 0.000 description 2
- 230000009885 systemic effect Effects 0.000 description 2
- ABZLKHKQJHEPAX-UHFFFAOYSA-N tetramethylrhodamine Chemical compound C=12C=CC(N(C)C)=CC2=[O+]C2=CC(N(C)C)=CC=C2C=1C1=CC=CC=C1C([O-])=O ABZLKHKQJHEPAX-UHFFFAOYSA-N 0.000 description 2
- 229940124597 therapeutic agent Drugs 0.000 description 2
- 231100000440 toxicity profile Toxicity 0.000 description 2
- HDTRYLNUVZCQOY-UHFFFAOYSA-N α-D-glucopyranosyl-α-D-glucopyranoside Natural products OC1C(O)C(O)C(CO)OC1OC1C(O)C(O)C(O)C(CO)O1 HDTRYLNUVZCQOY-UHFFFAOYSA-N 0.000 description 1
- 125000003088 (fluoren-9-ylmethoxy)carbonyl group Chemical group 0.000 description 1
- NEAQRZUHTPSBBM-UHFFFAOYSA-N 2-hydroxy-3,3-dimethyl-7-nitro-4h-isoquinolin-1-one Chemical compound C1=C([N+]([O-])=O)C=C2C(=O)N(O)C(C)(C)CC2=C1 NEAQRZUHTPSBBM-UHFFFAOYSA-N 0.000 description 1
- NCGICGYLBXGBGN-UHFFFAOYSA-N 3-morpholin-4-yl-1-oxa-3-azonia-2-azanidacyclopent-3-en-5-imine;hydrochloride Chemical compound Cl.[N-]1OC(=N)C=[N+]1N1CCOCC1 NCGICGYLBXGBGN-UHFFFAOYSA-N 0.000 description 1
- 238000010600 3H thymidine incorporation assay Methods 0.000 description 1
- FWMNVWWHGCHHJJ-SKKKGAJSSA-N 4-amino-1-[(2r)-6-amino-2-[[(2r)-2-[[(2r)-2-[[(2r)-2-amino-3-phenylpropanoyl]amino]-3-phenylpropanoyl]amino]-4-methylpentanoyl]amino]hexanoyl]piperidine-4-carboxylic acid Chemical compound C([C@H](C(=O)N[C@H](CC(C)C)C(=O)N[C@H](CCCCN)C(=O)N1CCC(N)(CC1)C(O)=O)NC(=O)[C@H](N)CC=1C=CC=CC=1)C1=CC=CC=C1 FWMNVWWHGCHHJJ-SKKKGAJSSA-N 0.000 description 1
- 208000036762 Acute promyelocytic leukaemia Diseases 0.000 description 1
- 229920001817 Agar Polymers 0.000 description 1
- GUBGYTABKSRVRQ-XLOQQCSPSA-N Alpha-Lactose Chemical compound O[C@@H]1[C@@H](O)[C@@H](O)[C@@H](CO)O[C@H]1O[C@@H]1[C@@H](CO)O[C@H](O)[C@H](O)[C@H]1O GUBGYTABKSRVRQ-XLOQQCSPSA-N 0.000 description 1
- 102000006589 Alpha-ketoglutarate dehydrogenase Human genes 0.000 description 1
- 108020004306 Alpha-ketoglutarate dehydrogenase Proteins 0.000 description 1
- 101100178203 Arabidopsis thaliana HMGB3 gene Proteins 0.000 description 1
- 241000416162 Astragalus gummifer Species 0.000 description 1
- 241000894006 Bacteria Species 0.000 description 1
- 241000283690 Bos taurus Species 0.000 description 1
- BPZMCULAMQKURX-UHFFFAOYSA-N CC(C)c(cc1)cc2c1[o]c(-c1cccc(NC(c(cc3)cc(OC)c3OC)=O)c1)n2 Chemical compound CC(C)c(cc1)cc2c1[o]c(-c1cccc(NC(c(cc3)cc(OC)c3OC)=O)c1)n2 BPZMCULAMQKURX-UHFFFAOYSA-N 0.000 description 1
- WDJFNUOFMAWUTO-UHFFFAOYSA-N CN(C)c(cc1)ccc1C(Nc(cc1)ccc1-c1nc2ncccc2[o]1)=O Chemical compound CN(C)c(cc1)ccc1C(Nc(cc1)ccc1-c1nc2ncccc2[o]1)=O WDJFNUOFMAWUTO-UHFFFAOYSA-N 0.000 description 1
- ZBZHYCKSERTJLS-UHFFFAOYSA-N CN(C)c1cc(C(Nc2cc(-c3nc4ccncc4[s]3)ccc2)=O)ccc1 Chemical compound CN(C)c1cc(C(Nc2cc(-c3nc4ccncc4[s]3)ccc2)=O)ccc1 ZBZHYCKSERTJLS-UHFFFAOYSA-N 0.000 description 1
- WBUSOAFSLIQXSQ-UHFFFAOYSA-N CN(C)c1cc(C(Nc2cccc(-c3nc(nccc4)c4[o]3)n2)=O)ccc1 Chemical compound CN(C)c1cc(C(Nc2cccc(-c3nc(nccc4)c4[o]3)n2)=O)ccc1 WBUSOAFSLIQXSQ-UHFFFAOYSA-N 0.000 description 1
- CRWSIHHNKDYNJB-UHFFFAOYSA-N CN(C)c1cccc(C(N(CC2)C=CCN2c2nc3ccccc3[o]2)=O)c1 Chemical compound CN(C)c1cccc(C(N(CC2)C=CCN2c2nc3ccccc3[o]2)=O)c1 CRWSIHHNKDYNJB-UHFFFAOYSA-N 0.000 description 1
- VLBRKWHXLFWFFW-UHFFFAOYSA-N CN(C)c1cccc(C(Nc2cccc(-c3cc4cccnc4[o]3)c2)=O)c1 Chemical compound CN(C)c1cccc(C(Nc2cccc(-c3cc4cccnc4[o]3)c2)=O)c1 VLBRKWHXLFWFFW-UHFFFAOYSA-N 0.000 description 1
- RCUWULIGQLTADU-UHFFFAOYSA-N COC(c1cc(-c2nc(nccc3)c3[o]2)cc(NC(c(cc2OC)ccc2OC)=O)c1)=O Chemical compound COC(c1cc(-c2nc(nccc3)c3[o]2)cc(NC(c(cc2OC)ccc2OC)=O)c1)=O RCUWULIGQLTADU-UHFFFAOYSA-N 0.000 description 1
- FTPMCWPNLDTGMY-UHFFFAOYSA-N COc(cc1)cc(OC)c1C(Nc(cc1)ccc1-c1nc2ccccc2[nH]1)=O Chemical compound COc(cc1)cc(OC)c1C(Nc(cc1)ccc1-c1nc2ccccc2[nH]1)=O FTPMCWPNLDTGMY-UHFFFAOYSA-N 0.000 description 1
- NEKGNEYRMMLISR-UHFFFAOYSA-N COc(cc1)ccc1C(Nc(cc1)ccc1-c1nc(nccc2)c2[o]1)=O Chemical compound COc(cc1)ccc1C(Nc(cc1)ccc1-c1nc(nccc2)c2[o]1)=O NEKGNEYRMMLISR-UHFFFAOYSA-N 0.000 description 1
- YEHFBQOOVWKZDB-UHFFFAOYSA-N COc(ccc(C(Nc1cc(-c2cc3cccnc3[o]2)ccc1)=O)c1)c1OC Chemical compound COc(ccc(C(Nc1cc(-c2cc3cccnc3[o]2)ccc1)=O)c1)c1OC YEHFBQOOVWKZDB-UHFFFAOYSA-N 0.000 description 1
- LAKICHWDNHAZTP-UHFFFAOYSA-N COc(ccc(C([n]1c(-c2ccccn2)nc2ccccc12)=O)c1)c1OC Chemical compound COc(ccc(C([n]1c(-c2ccccn2)nc2ccccc12)=O)c1)c1OC LAKICHWDNHAZTP-UHFFFAOYSA-N 0.000 description 1
- BQGWKHAOWUHKHM-UHFFFAOYSA-N COc(ccc(S(Nc1cc(-c2nc(ccnc3)c3[s]2)ccc1)(=O)=O)c1)c1OC Chemical compound COc(ccc(S(Nc1cc(-c2nc(ccnc3)c3[s]2)ccc1)(=O)=O)c1)c1OC BQGWKHAOWUHKHM-UHFFFAOYSA-N 0.000 description 1
- UDOXOXIEAAINNF-UHFFFAOYSA-N COc1cc(C(N(CCC2)CCN2c2nc3ccccc3[o]2)=O)cc(OC)c1OC Chemical compound COc1cc(C(N(CCC2)CCN2c2nc3ccccc3[o]2)=O)cc(OC)c1OC UDOXOXIEAAINNF-UHFFFAOYSA-N 0.000 description 1
- GXYUSCMWRLDMDZ-UHFFFAOYSA-N COc1cc(C(Nc2cc(C(O)=O)cc(-c3nc4ccncc4[s]3)c2)=O)cc(OC)c1OC Chemical compound COc1cc(C(Nc2cc(C(O)=O)cc(-c3nc4ccncc4[s]3)c2)=O)cc(OC)c1OC GXYUSCMWRLDMDZ-UHFFFAOYSA-N 0.000 description 1
- UJYCHLORMNMWOC-UHFFFAOYSA-N COc1cc(C(Nc2cc(CO)cc(-c3nc4ccncc4[s]3)c2)=O)cc(OC)c1OC Chemical compound COc1cc(C(Nc2cc(CO)cc(-c3nc4ccncc4[s]3)c2)=O)cc(OC)c1OC UJYCHLORMNMWOC-UHFFFAOYSA-N 0.000 description 1
- IQGMYLAITMBQAE-UHFFFAOYSA-N COc1cc(C(Nc2cccc(-c3nc(cccn4)c4[s]3)c2)=O)cc(OC)c1OC Chemical compound COc1cc(C(Nc2cccc(-c3nc(cccn4)c4[s]3)c2)=O)cc(OC)c1OC IQGMYLAITMBQAE-UHFFFAOYSA-N 0.000 description 1
- ACXZLFQBVHEJGC-UHFFFAOYSA-N COc1cc(C(Nc2ccccc2-c2c[n](cccc3)c3n2)=O)cc(OC)c1OC Chemical compound COc1cc(C(Nc2ccccc2-c2c[n](cccc3)c3n2)=O)cc(OC)c1OC ACXZLFQBVHEJGC-UHFFFAOYSA-N 0.000 description 1
- CSXSCNQOHMJWRI-UHFFFAOYSA-O COc1cc([OH+]C)ccc1C(N(CCC1)CCN1c1nc2ccccc2[o]1)=O Chemical compound COc1cc([OH+]C)ccc1C(N(CCC1)CCN1c1nc2ccccc2[o]1)=O CSXSCNQOHMJWRI-UHFFFAOYSA-O 0.000 description 1
- IDBQQGZRWSUMED-UHFFFAOYSA-N COc1ccc(C(Nc2cccc(-c3nc4ncccc4[o]3)n2)=O)c(OC)c1 Chemical compound COc1ccc(C(Nc2cccc(-c3nc4ncccc4[o]3)n2)=O)c(OC)c1 IDBQQGZRWSUMED-UHFFFAOYSA-N 0.000 description 1
- 241000282465 Canis Species 0.000 description 1
- CURLTUGMZLYLDI-UHFFFAOYSA-N Carbon dioxide Chemical compound O=C=O CURLTUGMZLYLDI-UHFFFAOYSA-N 0.000 description 1
- 208000024172 Cardiovascular disease Diseases 0.000 description 1
- 101000832687 Cavia porcellus 3-alpha-hydroxysteroid sulfotransferase Proteins 0.000 description 1
- 101000643834 Cavia porcellus 3-beta-hydroxysteroid sulfotransferase Proteins 0.000 description 1
- LRDZGWMFKMBGMO-UHFFFAOYSA-N Cc(c(OC)ccc1)c1C(Nc(cc1)ccc1-c1nc2ncccc2[o]1)=O Chemical compound Cc(c(OC)ccc1)c1C(Nc(cc1)ccc1-c1nc2ncccc2[o]1)=O LRDZGWMFKMBGMO-UHFFFAOYSA-N 0.000 description 1
- VPZSFCGLWRJZJA-UHFFFAOYSA-N Cc1ccc(C(Nc2cccc(-c3nc4ncccc4[o]3)c2)=O)c(OC)c1 Chemical compound Cc1ccc(C(Nc2cccc(-c3nc4ncccc4[o]3)c2)=O)c(OC)c1 VPZSFCGLWRJZJA-UHFFFAOYSA-N 0.000 description 1
- RMELJCAICXGYTB-UHFFFAOYSA-N Cc1nc(-c2cccc(NC(c(c(OC)c3)ccc3OC)=O)c2)c[s]1 Chemical compound Cc1nc(-c2cccc(NC(c(c(OC)c3)ccc3OC)=O)c2)c[s]1 RMELJCAICXGYTB-UHFFFAOYSA-N 0.000 description 1
- TUWPFVSRPSCDSA-UHFFFAOYSA-N Cc1nc(-c2cccc(Nc3nc(cccc4)c4[o]3)c2)c[s]1 Chemical compound Cc1nc(-c2cccc(Nc3nc(cccc4)c4[o]3)c2)c[s]1 TUWPFVSRPSCDSA-UHFFFAOYSA-N 0.000 description 1
- 102000008169 Co-Repressor Proteins Human genes 0.000 description 1
- 108010060434 Co-Repressor Proteins Proteins 0.000 description 1
- 206010053567 Coagulopathies Diseases 0.000 description 1
- 229920002261 Corn starch Polymers 0.000 description 1
- 229920000858 Cyclodextrin Polymers 0.000 description 1
- FBPFZTCFMRRESA-FSIIMWSLSA-N D-Glucitol Natural products OC[C@H](O)[C@H](O)[C@@H](O)[C@H](O)CO FBPFZTCFMRRESA-FSIIMWSLSA-N 0.000 description 1
- FBPFZTCFMRRESA-KVTDHHQDSA-N D-Mannitol Chemical compound OC[C@@H](O)[C@@H](O)[C@H](O)[C@H](O)CO FBPFZTCFMRRESA-KVTDHHQDSA-N 0.000 description 1
- FBPFZTCFMRRESA-JGWLITMVSA-N D-glucitol Chemical compound OC[C@H](O)[C@@H](O)[C@H](O)[C@H](O)CO FBPFZTCFMRRESA-JGWLITMVSA-N 0.000 description 1
- CYCGRDQQIOGCKX-UHFFFAOYSA-N Dehydro-luciferin Natural products OC(=O)C1=CSC(C=2SC3=CC(O)=CC=C3N=2)=N1 CYCGRDQQIOGCKX-UHFFFAOYSA-N 0.000 description 1
- 101710088194 Dehydrogenase Proteins 0.000 description 1
- 206010061818 Disease progression Diseases 0.000 description 1
- LVGKNOAMLMIIKO-UHFFFAOYSA-N Elaidinsaeure-aethylester Natural products CCCCCCCCC=CCCCCCCCC(=O)OCC LVGKNOAMLMIIKO-UHFFFAOYSA-N 0.000 description 1
- 241000196324 Embryophyta Species 0.000 description 1
- 239000001856 Ethyl cellulose Substances 0.000 description 1
- ZZSNKZQZMQGXPY-UHFFFAOYSA-N Ethyl cellulose Chemical compound CCOCC1OC(OC)C(OCC)C(OCC)C1OC1C(O)C(O)C(OC)C(CO)O1 ZZSNKZQZMQGXPY-UHFFFAOYSA-N 0.000 description 1
- 206010073306 Exposure to radiation Diseases 0.000 description 1
- 241000282324 Felis Species 0.000 description 1
- 102100028075 Fibroblast growth factor 6 Human genes 0.000 description 1
- BJGNCJDXODQBOB-UHFFFAOYSA-N Fivefly Luciferin Natural products OC(=O)C1CSC(C=2SC3=CC(O)=CC=C3N=2)=N1 BJGNCJDXODQBOB-UHFFFAOYSA-N 0.000 description 1
- 229930091371 Fructose Natural products 0.000 description 1
- RFSUNEUAIZKAJO-ARQDHWQXSA-N Fructose Chemical compound OC[C@H]1O[C@](O)(CO)[C@@H](O)[C@@H]1O RFSUNEUAIZKAJO-ARQDHWQXSA-N 0.000 description 1
- 239000005715 Fructose Substances 0.000 description 1
- 230000005526 G1 to G0 transition Effects 0.000 description 1
- 108010010803 Gelatin Proteins 0.000 description 1
- 108010008945 General Transcription Factors Proteins 0.000 description 1
- 102000006580 General Transcription Factors Human genes 0.000 description 1
- 102100033840 General transcription factor IIF subunit 1 Human genes 0.000 description 1
- WQZGKKKJIJFFOK-GASJEMHNSA-N Glucose Natural products OC[C@H]1OC(O)[C@H](O)[C@@H](O)[C@@H]1O WQZGKKKJIJFFOK-GASJEMHNSA-N 0.000 description 1
- 102000005720 Glutathione transferase Human genes 0.000 description 1
- 108010070675 Glutathione transferase Proteins 0.000 description 1
- 239000004471 Glycine Substances 0.000 description 1
- HVLSXIKZNLPZJJ-TXZCQADKSA-N HA peptide Chemical compound C([C@@H](C(=O)N[C@@H](CC(O)=O)C(=O)N[C@@H](C(C)C)C(=O)N1[C@@H](CCC1)C(=O)N[C@@H](CC(O)=O)C(=O)N[C@@H](CC=1C=CC(O)=CC=1)C(=O)N[C@@H](C)C(O)=O)NC(=O)[C@H]1N(CCC1)C(=O)[C@@H](N)CC=1C=CC(O)=CC=1)C1=CC=C(O)C=C1 HVLSXIKZNLPZJJ-TXZCQADKSA-N 0.000 description 1
- 101150091750 HMG1 gene Proteins 0.000 description 1
- 108700010013 HMGB1 Proteins 0.000 description 1
- 101150021904 HMGB1 gene Proteins 0.000 description 1
- 101150021206 HST3 gene Proteins 0.000 description 1
- 101150077931 HST4 gene Proteins 0.000 description 1
- 102100037907 High mobility group protein B1 Human genes 0.000 description 1
- 102100022128 High mobility group protein B2 Human genes 0.000 description 1
- 101001045791 Homo sapiens High mobility group protein B2 Proteins 0.000 description 1
- 101001054793 Homo sapiens Importin subunit alpha-7 Proteins 0.000 description 1
- 101000866795 Homo sapiens Non-histone chromosomal protein HMG-14 Proteins 0.000 description 1
- 101000866805 Homo sapiens Non-histone chromosomal protein HMG-17 Proteins 0.000 description 1
- 101000602930 Homo sapiens Nuclear receptor coactivator 2 Proteins 0.000 description 1
- 108010070875 Human Immunodeficiency Virus tat Gene Products Proteins 0.000 description 1
- 102100027002 Importin subunit alpha-7 Human genes 0.000 description 1
- 206010061218 Inflammation Diseases 0.000 description 1
- 241000102542 Kara Species 0.000 description 1
- XUJNEKJLAYXESH-REOHCLBHSA-N L-Cysteine Chemical compound SC[C@H](N)C(O)=O XUJNEKJLAYXESH-REOHCLBHSA-N 0.000 description 1
- ONIBWKKTOPOVIA-BYPYZUCNSA-N L-Proline Chemical compound OC(=O)[C@@H]1CCCN1 ONIBWKKTOPOVIA-BYPYZUCNSA-N 0.000 description 1
- ROHFNLRQFUQHCH-YFKPBYRVSA-N L-leucine Chemical compound CC(C)C[C@H](N)C(O)=O ROHFNLRQFUQHCH-YFKPBYRVSA-N 0.000 description 1
- KZSNJWFQEVHDMF-BYPYZUCNSA-N L-valine Chemical compound CC(C)[C@H](N)C(O)=O KZSNJWFQEVHDMF-BYPYZUCNSA-N 0.000 description 1
- GUBGYTABKSRVRQ-QKKXKWKRSA-N Lactose Natural products OC[C@H]1O[C@@H](O[C@H]2[C@H](O)[C@@H](O)C(O)O[C@@H]2CO)[C@H](O)[C@@H](O)[C@H]1O GUBGYTABKSRVRQ-QKKXKWKRSA-N 0.000 description 1
- 241000254158 Lampyridae Species 0.000 description 1
- ROHFNLRQFUQHCH-UHFFFAOYSA-N Leucine Natural products CC(C)CC(N)C(O)=O ROHFNLRQFUQHCH-UHFFFAOYSA-N 0.000 description 1
- DDWFXDSYGUXRAY-UHFFFAOYSA-N Luciferin Natural products CCc1c(C)c(CC2NC(=O)C(=C2C=C)C)[nH]c1Cc3[nH]c4C(=C5/NC(CC(=O)O)C(C)C5CC(=O)O)CC(=O)c4c3C DDWFXDSYGUXRAY-UHFFFAOYSA-N 0.000 description 1
- 229930195725 Mannitol Natural products 0.000 description 1
- 206010027476 Metastases Diseases 0.000 description 1
- 108020005196 Mitochondrial DNA Proteins 0.000 description 1
- 102000006404 Mitochondrial Proteins Human genes 0.000 description 1
- 108010058682 Mitochondrial Proteins Proteins 0.000 description 1
- 102000016943 Muramidase Human genes 0.000 description 1
- 108010014251 Muramidase Proteins 0.000 description 1
- 101100477601 Mus musculus Sirt3 gene Proteins 0.000 description 1
- 241000699670 Mus sp. Species 0.000 description 1
- 108010062010 N-Acetylmuramoyl-L-alanine Amidase Proteins 0.000 description 1
- 102100030710 NAD-dependent protein deacetylase sirtuin-3, mitochondrial Human genes 0.000 description 1
- 102100031353 Non-histone chromosomal protein HMG-14 Human genes 0.000 description 1
- 102100031346 Non-histone chromosomal protein HMG-17 Human genes 0.000 description 1
- 108090001146 Nuclear Receptor Coactivator 1 Proteins 0.000 description 1
- 108090001145 Nuclear Receptor Coactivator 3 Proteins 0.000 description 1
- 108050001461 Nuclear receptor coactivator Proteins 0.000 description 1
- 102000011244 Nuclear receptor coactivator Human genes 0.000 description 1
- 102100037223 Nuclear receptor coactivator 1 Human genes 0.000 description 1
- 102100037226 Nuclear receptor coactivator 2 Human genes 0.000 description 1
- 102100022883 Nuclear receptor coactivator 3 Human genes 0.000 description 1
- 108091028043 Nucleic acid sequence Proteins 0.000 description 1
- RXQFHKKWCMFBPR-UHFFFAOYSA-N O=C(c1cc(-c2nc(nccc3)c3[o]2)ccc1)NCc1ccc2OCOc2c1 Chemical compound O=C(c1cc(-c2nc(nccc3)c3[o]2)ccc1)NCc1ccc2OCOc2c1 RXQFHKKWCMFBPR-UHFFFAOYSA-N 0.000 description 1
- XXBOROGIEISETB-UHFFFAOYSA-N O=C(c1cccnc1)NNc1c(cccc2)c2nc2c1cccc2 Chemical compound O=C(c1cccnc1)NNc1c(cccc2)c2nc2c1cccc2 XXBOROGIEISETB-UHFFFAOYSA-N 0.000 description 1
- DBUXZETYBKERCD-UHFFFAOYSA-N O=S(c1ccc(N2CCOCC2)nc1)(Nc1cc(C2=NC3=CC=NCC3S2)ccc1)=O Chemical compound O=S(c1ccc(N2CCOCC2)nc1)(Nc1cc(C2=NC3=CC=NCC3S2)ccc1)=O DBUXZETYBKERCD-UHFFFAOYSA-N 0.000 description 1
- AWZJFZMWSUBJAJ-UHFFFAOYSA-N OG-514 dye Chemical compound OC(=O)CSC1=C(F)C(F)=C(C(O)=O)C(C2=C3C=C(F)C(=O)C=C3OC3=CC(O)=C(F)C=C32)=C1F AWZJFZMWSUBJAJ-UHFFFAOYSA-N 0.000 description 1
- 208000008589 Obesity Diseases 0.000 description 1
- 235000019483 Peanut oil Nutrition 0.000 description 1
- 229930182555 Penicillin Natural products 0.000 description 1
- JGSARLDLIJGVTE-MBNYWOFBSA-N Penicillin G Chemical compound N([C@H]1[C@H]2SC([C@@H](N2C1=O)C(O)=O)(C)C)C(=O)CC1=CC=CC=C1 JGSARLDLIJGVTE-MBNYWOFBSA-N 0.000 description 1
- 102000007079 Peptide Fragments Human genes 0.000 description 1
- 108010033276 Peptide Fragments Proteins 0.000 description 1
- 108090000310 Peroxisome Proliferator-Activated Receptor Gamma Coactivator 1-alpha Proteins 0.000 description 1
- 102000003921 Peroxisome Proliferator-Activated Receptor Gamma Coactivator 1-alpha Human genes 0.000 description 1
- 241000254064 Photinus pyralis Species 0.000 description 1
- 239000002202 Polyethylene glycol Substances 0.000 description 1
- 241000288906 Primates Species 0.000 description 1
- ONIBWKKTOPOVIA-UHFFFAOYSA-N Proline Natural products OC(=O)C1CCCN1 ONIBWKKTOPOVIA-UHFFFAOYSA-N 0.000 description 1
- 239000004365 Protease Substances 0.000 description 1
- LCTONWCANYUPML-UHFFFAOYSA-M Pyruvate Chemical compound CC(=O)C([O-])=O LCTONWCANYUPML-UHFFFAOYSA-M 0.000 description 1
- BDJDTKYGKHEMFF-UHFFFAOYSA-M QSY7 succinimidyl ester Chemical compound [Cl-].C=1C=C2C(C=3C(=CC=CC=3)S(=O)(=O)N3CCC(CC3)C(=O)ON3C(CCC3=O)=O)=C3C=C\C(=[N+](\C)C=4C=CC=CC=4)C=C3OC2=CC=1N(C)C1=CC=CC=C1 BDJDTKYGKHEMFF-UHFFFAOYSA-M 0.000 description 1
- 101150085390 RPM1 gene Proteins 0.000 description 1
- 241000700159 Rattus Species 0.000 description 1
- 108020004511 Recombinant DNA Proteins 0.000 description 1
- 102000007056 Recombinant Fusion Proteins Human genes 0.000 description 1
- 108010008281 Recombinant Fusion Proteins Proteins 0.000 description 1
- 241000283984 Rodentia Species 0.000 description 1
- 235000019485 Safflower oil Nutrition 0.000 description 1
- 229920005654 Sephadex Polymers 0.000 description 1
- 239000012507 Sephadex™ Substances 0.000 description 1
- 101150044628 Sin1 gene Proteins 0.000 description 1
- 229920002472 Starch Polymers 0.000 description 1
- 229920001615 Tragacanth Polymers 0.000 description 1
- GYDJEQRTZSCIOI-UHFFFAOYSA-N Tranexamic acid Chemical compound NCC1CCC(C(O)=O)CC1 GYDJEQRTZSCIOI-UHFFFAOYSA-N 0.000 description 1
- HDTRYLNUVZCQOY-WSWWMNSNSA-N Trehalose Natural products O[C@@H]1[C@@H](O)[C@@H](O)[C@@H](CO)O[C@@H]1O[C@@H]1[C@H](O)[C@@H](O)[C@@H](O)[C@@H](CO)O1 HDTRYLNUVZCQOY-WSWWMNSNSA-N 0.000 description 1
- DTQVDTLACAAQTR-UHFFFAOYSA-N Trifluoroacetic acid Chemical compound OC(=O)C(F)(F)F DTQVDTLACAAQTR-UHFFFAOYSA-N 0.000 description 1
- GLNADSQYFUSGOU-GPTZEZBUSA-J Trypan blue Chemical compound [Na+].[Na+].[Na+].[Na+].C1=C(S([O-])(=O)=O)C=C2C=C(S([O-])(=O)=O)C(/N=N/C3=CC=C(C=C3C)C=3C=C(C(=CC=3)\N=N\C=3C(=CC4=CC(=CC(N)=C4C=3O)S([O-])(=O)=O)S([O-])(=O)=O)C)=C(O)C2=C1N GLNADSQYFUSGOU-GPTZEZBUSA-J 0.000 description 1
- KZSNJWFQEVHDMF-UHFFFAOYSA-N Valine Natural products CC(C)C(N)C(O)=O KZSNJWFQEVHDMF-UHFFFAOYSA-N 0.000 description 1
- PTFCDOFLOPIGGS-UHFFFAOYSA-N Zinc dication Chemical compound [Zn+2] PTFCDOFLOPIGGS-UHFFFAOYSA-N 0.000 description 1
- 230000002159 abnormal effect Effects 0.000 description 1
- 238000009825 accumulation Methods 0.000 description 1
- FEQPWZXKGNCPSP-UHFFFAOYSA-N acetic acid;1-hydroxypyrrolidine-2,5-dione Chemical compound CC(O)=O.ON1C(=O)CCC1=O FEQPWZXKGNCPSP-UHFFFAOYSA-N 0.000 description 1
- DPXJVFZANSGRMM-UHFFFAOYSA-N acetic acid;2,3,4,5,6-pentahydroxyhexanal;sodium Chemical compound [Na].CC(O)=O.OCC(O)C(O)C(O)C(O)C=O DPXJVFZANSGRMM-UHFFFAOYSA-N 0.000 description 1
- 150000007513 acids Chemical class 0.000 description 1
- 230000009471 action Effects 0.000 description 1
- 238000001042 affinity chromatography Methods 0.000 description 1
- 239000008272 agar Substances 0.000 description 1
- 230000032683 aging Effects 0.000 description 1
- 239000000783 alginic acid Substances 0.000 description 1
- 235000010443 alginic acid Nutrition 0.000 description 1
- 229920000615 alginic acid Polymers 0.000 description 1
- 229960001126 alginic acid Drugs 0.000 description 1
- 150000004781 alginic acids Chemical class 0.000 description 1
- 125000000217 alkyl group Chemical group 0.000 description 1
- HDTRYLNUVZCQOY-LIZSDCNHSA-N alpha,alpha-trehalose Chemical compound O[C@@H]1[C@@H](O)[C@H](O)[C@@H](CO)O[C@@H]1O[C@@H]1[C@H](O)[C@@H](O)[C@H](O)[C@@H](CO)O1 HDTRYLNUVZCQOY-LIZSDCNHSA-N 0.000 description 1
- WNROFYMDJYEPJX-UHFFFAOYSA-K aluminium hydroxide Chemical compound [OH-].[OH-].[OH-].[Al+3] WNROFYMDJYEPJX-UHFFFAOYSA-K 0.000 description 1
- 150000001412 amines Chemical class 0.000 description 1
- 125000003277 amino group Chemical group 0.000 description 1
- 210000004102 animal cell Anatomy 0.000 description 1
- 230000000845 anti-microbial effect Effects 0.000 description 1
- 229940041181 antineoplastic drug Drugs 0.000 description 1
- 239000012062 aqueous buffer Substances 0.000 description 1
- 239000008346 aqueous phase Substances 0.000 description 1
- 239000003125 aqueous solvent Substances 0.000 description 1
- 125000003118 aryl group Chemical group 0.000 description 1
- 238000000668 atmospheric pressure chemical ionisation mass spectrometry Methods 0.000 description 1
- 230000004888 barrier function Effects 0.000 description 1
- 230000008901 benefit Effects 0.000 description 1
- WQZGKKKJIJFFOK-VFUOTHLCSA-N beta-D-glucose Chemical compound OC[C@H]1O[C@@H](O)[C@H](O)[C@@H](O)[C@@H]1O WQZGKKKJIJFFOK-VFUOTHLCSA-N 0.000 description 1
- 230000004071 biological effect Effects 0.000 description 1
- 210000000601 blood cell Anatomy 0.000 description 1
- 230000023555 blood coagulation Effects 0.000 description 1
- 239000007853 buffer solution Substances 0.000 description 1
- 239000006172 buffering agent Substances 0.000 description 1
- RIWJDBCSXNTKST-UHFFFAOYSA-N c1cc([o]c(-c2cc(Nc3nc4ccccc4[s]3)ccc2)n2)c2nc1 Chemical compound c1cc([o]c(-c2cc(Nc3nc4ccccc4[s]3)ccc2)n2)c2nc1 RIWJDBCSXNTKST-UHFFFAOYSA-N 0.000 description 1
- 238000005251 capillar electrophoresis Methods 0.000 description 1
- 235000011089 carbon dioxide Nutrition 0.000 description 1
- 125000003178 carboxy group Chemical group [H]OC(*)=O 0.000 description 1
- 239000001768 carboxy methyl cellulose Substances 0.000 description 1
- 230000011712 cell development Effects 0.000 description 1
- 230000033077 cellular process Effects 0.000 description 1
- 230000007541 cellular toxicity Effects 0.000 description 1
- 239000001913 cellulose Substances 0.000 description 1
- 229920002678 cellulose Polymers 0.000 description 1
- 229920002301 cellulose acetate Polymers 0.000 description 1
- 238000005119 centrifugation Methods 0.000 description 1
- 238000012512 characterization method Methods 0.000 description 1
- 239000007795 chemical reaction product Substances 0.000 description 1
- 230000000973 chemotherapeutic effect Effects 0.000 description 1
- 108091006090 chromatin-associated proteins Proteins 0.000 description 1
- 238000010367 cloning Methods 0.000 description 1
- 229940110456 cocoa butter Drugs 0.000 description 1
- 235000019868 cocoa butter Nutrition 0.000 description 1
- 235000005687 corn oil Nutrition 0.000 description 1
- 239000002285 corn oil Substances 0.000 description 1
- 239000008120 corn starch Substances 0.000 description 1
- 230000002596 correlated effect Effects 0.000 description 1
- 235000012343 cottonseed oil Nutrition 0.000 description 1
- 239000002385 cottonseed oil Substances 0.000 description 1
- 238000013211 curve analysis Methods 0.000 description 1
- 231100000433 cytotoxic Toxicity 0.000 description 1
- 230000001472 cytotoxic effect Effects 0.000 description 1
- 238000004925 denaturation Methods 0.000 description 1
- 230000036425 denaturation Effects 0.000 description 1
- 206010012601 diabetes mellitus Diseases 0.000 description 1
- 238000003745 diagnosis Methods 0.000 description 1
- 238000000502 dialysis Methods 0.000 description 1
- 235000005911 diet Nutrition 0.000 description 1
- 230000037213 diet Effects 0.000 description 1
- 230000004069 differentiation Effects 0.000 description 1
- 239000003085 diluting agent Substances 0.000 description 1
- 230000008034 disappearance Effects 0.000 description 1
- 230000006806 disease prevention Effects 0.000 description 1
- 230000005750 disease progression Effects 0.000 description 1
- 208000037765 diseases and disorders Diseases 0.000 description 1
- 208000035475 disorder Diseases 0.000 description 1
- 239000012153 distilled water Substances 0.000 description 1
- 230000003828 downregulation Effects 0.000 description 1
- 229940079593 drug Drugs 0.000 description 1
- 239000000890 drug combination Substances 0.000 description 1
- 230000005684 electric field Effects 0.000 description 1
- 238000002101 electrospray ionisation tandem mass spectrometry Methods 0.000 description 1
- 238000001437 electrospray ionisation time-of-flight quadrupole detection Methods 0.000 description 1
- 238000010828 elution Methods 0.000 description 1
- 150000002148 esters Chemical class 0.000 description 1
- 235000019441 ethanol Nutrition 0.000 description 1
- 235000019325 ethyl cellulose Nutrition 0.000 description 1
- 229920001249 ethyl cellulose Polymers 0.000 description 1
- LVGKNOAMLMIIKO-QXMHVHEDSA-N ethyl oleate Chemical compound CCCCCCCC\C=C/CCCCCCCC(=O)OCC LVGKNOAMLMIIKO-QXMHVHEDSA-N 0.000 description 1
- 229940093471 ethyl oleate Drugs 0.000 description 1
- 230000007717 exclusion Effects 0.000 description 1
- 239000000284 extract Substances 0.000 description 1
- 238000000605 extraction Methods 0.000 description 1
- 239000000945 filler Substances 0.000 description 1
- 238000011049 filling Methods 0.000 description 1
- GNBHRKFJIUUOQI-UHFFFAOYSA-N fluorescein Chemical compound O1C(=O)C2=CC=CC=C2C21C1=CC=C(O)C=C1OC1=CC(O)=CC=C21 GNBHRKFJIUUOQI-UHFFFAOYSA-N 0.000 description 1
- MHMNJMPURVTYEJ-UHFFFAOYSA-N fluorescein-5-isothiocyanate Chemical compound O1C(=O)C2=CC(N=C=S)=CC=C2C21C1=CC=C(O)C=C1OC1=CC(O)=CC=C21 MHMNJMPURVTYEJ-UHFFFAOYSA-N 0.000 description 1
- 238000002875 fluorescence polarization Methods 0.000 description 1
- 239000007850 fluorescent dye Substances 0.000 description 1
- 238000011010 flushing procedure Methods 0.000 description 1
- 238000013467 fragmentation Methods 0.000 description 1
- 238000006062 fragmentation reaction Methods 0.000 description 1
- 238000004108 freeze drying Methods 0.000 description 1
- 108020001507 fusion proteins Proteins 0.000 description 1
- 102000037865 fusion proteins Human genes 0.000 description 1
- 239000008273 gelatin Substances 0.000 description 1
- 229920000159 gelatin Polymers 0.000 description 1
- 235000019322 gelatine Nutrition 0.000 description 1
- 235000011852 gelatine desserts Nutrition 0.000 description 1
- 239000008103 glucose Substances 0.000 description 1
- 235000011187 glycerol Nutrition 0.000 description 1
- 150000002334 glycols Chemical class 0.000 description 1
- 230000036541 health Effects 0.000 description 1
- ZFGMDIBRIDKWMY-PASTXAENSA-N heparin Chemical compound CC(O)=N[C@@H]1[C@@H](O)[C@H](O)[C@@H](COS(O)(=O)=O)O[C@@H]1O[C@@H]1[C@@H](C(O)=O)O[C@@H](O[C@H]2[C@@H]([C@@H](OS(O)(=O)=O)[C@@H](O[C@@H]3[C@@H](OC(O)[C@H](OS(O)(=O)=O)[C@H]3O)C(O)=O)O[C@@H]2O)CS(O)(=O)=O)[C@H](O)[C@H]1O ZFGMDIBRIDKWMY-PASTXAENSA-N 0.000 description 1
- 229920000669 heparin Polymers 0.000 description 1
- 210000005260 human cell Anatomy 0.000 description 1
- 230000007062 hydrolysis Effects 0.000 description 1
- 238000006460 hydrolysis reaction Methods 0.000 description 1
- 125000002887 hydroxy group Chemical group [H]O* 0.000 description 1
- 210000001822 immobilized cell Anatomy 0.000 description 1
- 230000001900 immune effect Effects 0.000 description 1
- 230000006698 induction Effects 0.000 description 1
- 230000004054 inflammatory process Effects 0.000 description 1
- 230000000266 injurious effect Effects 0.000 description 1
- 239000002198 insoluble material Substances 0.000 description 1
- 238000005342 ion exchange Methods 0.000 description 1
- 238000004255 ion exchange chromatography Methods 0.000 description 1
- 238000000534 ion trap mass spectrometry Methods 0.000 description 1
- 238000000752 ionisation method Methods 0.000 description 1
- 230000000302 ischemic effect Effects 0.000 description 1
- 238000002955 isolation Methods 0.000 description 1
- AGPKZVBTJJNPAG-UHFFFAOYSA-N isoleucine Natural products CCC(C)C(N)C(O)=O AGPKZVBTJJNPAG-UHFFFAOYSA-N 0.000 description 1
- 229960000310 isoleucine Drugs 0.000 description 1
- BPHPUYQFMNQIOC-NXRLNHOXSA-N isopropyl beta-D-thiogalactopyranoside Chemical compound CC(C)S[C@@H]1O[C@H](CO)[C@H](O)[C@H](O)[C@H]1O BPHPUYQFMNQIOC-NXRLNHOXSA-N 0.000 description 1
- 238000002372 labelling Methods 0.000 description 1
- 239000008101 lactose Substances 0.000 description 1
- 150000002605 large molecules Chemical class 0.000 description 1
- 230000000670 limiting effect Effects 0.000 description 1
- 244000144972 livestock Species 0.000 description 1
- 239000012139 lysis buffer Substances 0.000 description 1
- 239000004325 lysozyme Substances 0.000 description 1
- 229960000274 lysozyme Drugs 0.000 description 1
- 235000010335 lysozyme Nutrition 0.000 description 1
- VTHJTEIRLNZDEV-UHFFFAOYSA-L magnesium dihydroxide Chemical compound [OH-].[OH-].[Mg+2] VTHJTEIRLNZDEV-UHFFFAOYSA-L 0.000 description 1
- 239000000347 magnesium hydroxide Substances 0.000 description 1
- 229910001862 magnesium hydroxide Inorganic materials 0.000 description 1
- 210000004962 mammalian cell Anatomy 0.000 description 1
- 210000001161 mammalian embryo Anatomy 0.000 description 1
- 239000000594 mannitol Substances 0.000 description 1
- 235000010355 mannitol Nutrition 0.000 description 1
- 101150010039 mapkap1 gene Proteins 0.000 description 1
- 238000001906 matrix-assisted laser desorption--ionisation mass spectrometry Methods 0.000 description 1
- 230000036630 mental development Effects 0.000 description 1
- 230000037323 metabolic rate Effects 0.000 description 1
- 230000009401 metastasis Effects 0.000 description 1
- MYWUZJCMWCOHBA-VIFPVBQESA-N methamphetamine Chemical compound CN[C@@H](C)CC1=CC=CC=C1 MYWUZJCMWCOHBA-VIFPVBQESA-N 0.000 description 1
- 244000005700 microbiome Species 0.000 description 1
- 230000000116 mitigating effect Effects 0.000 description 1
- 230000004048 modification Effects 0.000 description 1
- 238000012986 modification Methods 0.000 description 1
- 239000003068 molecular probe Substances 0.000 description 1
- 238000012544 monitoring process Methods 0.000 description 1
- 230000004770 neurodegeneration Effects 0.000 description 1
- 208000015122 neurodegenerative disease Diseases 0.000 description 1
- 229930027945 nicotinamide-adenine dinucleotide Natural products 0.000 description 1
- BOPGDPNILDQYTO-NNYOXOHSSA-N nicotinamide-adenine dinucleotide Chemical compound C1=CCC(C(=O)N)=CN1[C@H]1[C@H](O)[C@H](O)[C@@H](COP(O)(=O)OP(O)(=O)OC[C@@H]2[C@H]([C@@H](O)[C@@H](O2)N2C3=NC=NC(N)=C3N=C2)O)O1 BOPGDPNILDQYTO-NNYOXOHSSA-N 0.000 description 1
- QJGQUHMNIGDVPM-UHFFFAOYSA-N nitrogen group Chemical group [N] QJGQUHMNIGDVPM-UHFFFAOYSA-N 0.000 description 1
- 238000010606 normalization Methods 0.000 description 1
- 238000007899 nucleic acid hybridization Methods 0.000 description 1
- 235000020824 obesity Nutrition 0.000 description 1
- 239000003921 oil Substances 0.000 description 1
- 235000019198 oils Nutrition 0.000 description 1
- 108010007425 oligomycin sensitivity conferring protein Proteins 0.000 description 1
- 238000002515 oligonucleotide synthesis Methods 0.000 description 1
- 229920001542 oligosaccharide Polymers 0.000 description 1
- 150000002482 oligosaccharides Chemical class 0.000 description 1
- 239000004006 olive oil Substances 0.000 description 1
- 235000008390 olive oil Nutrition 0.000 description 1
- BRJCLSQFZSHLRL-UHFFFAOYSA-N oregon green 488 Chemical compound OC(=O)C1=CC(C(=O)O)=CC=C1C1=C2C=C(F)C(=O)C=C2OC2=CC(O)=C(F)C=C21 BRJCLSQFZSHLRL-UHFFFAOYSA-N 0.000 description 1
- 239000000312 peanut oil Substances 0.000 description 1
- 229940049954 penicillin Drugs 0.000 description 1
- 238000010647 peptide synthesis reaction Methods 0.000 description 1
- 210000003819 peripheral blood mononuclear cell Anatomy 0.000 description 1
- 239000002831 pharmacologic agent Substances 0.000 description 1
- 239000008363 phosphate buffer Substances 0.000 description 1
- 229940080469 phosphocellulose Drugs 0.000 description 1
- 239000000902 placebo Substances 0.000 description 1
- 229940068196 placebo Drugs 0.000 description 1
- 239000013612 plasmid Substances 0.000 description 1
- 239000004033 plastic Substances 0.000 description 1
- 229920003023 plastic Polymers 0.000 description 1
- 229920001223 polyethylene glycol Polymers 0.000 description 1
- 229920000642 polymer Polymers 0.000 description 1
- 102000040430 polynucleotide Human genes 0.000 description 1
- 108091033319 polynucleotide Proteins 0.000 description 1
- 239000002157 polynucleotide Substances 0.000 description 1
- 239000013641 positive control Substances 0.000 description 1
- 230000007943 positive regulation of appetite Effects 0.000 description 1
- 229920001592 potato starch Polymers 0.000 description 1
- 239000000843 powder Substances 0.000 description 1
- 239000003755 preservative agent Substances 0.000 description 1
- BDERNNFJNOPAEC-UHFFFAOYSA-N propan-1-ol Chemical compound CCCO BDERNNFJNOPAEC-UHFFFAOYSA-N 0.000 description 1
- 235000019419 proteases Nutrition 0.000 description 1
- 125000006239 protecting group Chemical group 0.000 description 1
- 238000002331 protein detection Methods 0.000 description 1
- 230000002285 radioactive effect Effects 0.000 description 1
- 239000011541 reaction mixture Substances 0.000 description 1
- 230000035484 reaction time Effects 0.000 description 1
- 230000009257 reactivity Effects 0.000 description 1
- 230000006798 recombination Effects 0.000 description 1
- 230000007115 recruitment Effects 0.000 description 1
- 230000022983 regulation of cell cycle Effects 0.000 description 1
- 239000011347 resin Substances 0.000 description 1
- 229920005989 resin Polymers 0.000 description 1
- 230000004043 responsiveness Effects 0.000 description 1
- 230000002441 reversible effect Effects 0.000 description 1
- 235000005713 safflower oil Nutrition 0.000 description 1
- 239000003813 safflower oil Substances 0.000 description 1
- 150000003839 salts Chemical class 0.000 description 1
- 238000005070 sampling Methods 0.000 description 1
- HFHDHCJBZVLPGP-UHFFFAOYSA-N schardinger α-dextrin Chemical compound O1C(C(C2O)O)C(CO)OC2OC(C(C2O)O)C(CO)OC2OC(C(C2O)O)C(CO)OC2OC(C(O)C2O)C(CO)OC2OC(C(C2O)O)C(CO)OC2OC2C(O)C(O)C1OC2CO HFHDHCJBZVLPGP-UHFFFAOYSA-N 0.000 description 1
- 238000002821 scintillation proximity assay Methods 0.000 description 1
- 238000002864 sequence alignment Methods 0.000 description 1
- 239000008159 sesame oil Substances 0.000 description 1
- 235000011803 sesame oil Nutrition 0.000 description 1
- 238000004513 sizing Methods 0.000 description 1
- 235000019812 sodium carboxymethyl cellulose Nutrition 0.000 description 1
- 229920001027 sodium carboxymethylcellulose Polymers 0.000 description 1
- 239000007790 solid phase Substances 0.000 description 1
- 238000010532 solid phase synthesis reaction Methods 0.000 description 1
- 239000006104 solid solution Substances 0.000 description 1
- 239000002904 solvent Substances 0.000 description 1
- 239000000600 sorbitol Substances 0.000 description 1
- 235000010356 sorbitol Nutrition 0.000 description 1
- 239000003549 soybean oil Substances 0.000 description 1
- 235000012424 soybean oil Nutrition 0.000 description 1
- 241000894007 species Species 0.000 description 1
- 235000019698 starch Nutrition 0.000 description 1
- 239000007858 starting material Substances 0.000 description 1
- 229960005322 streptomycin Drugs 0.000 description 1
- 235000000346 sugar Nutrition 0.000 description 1
- 150000008163 sugars Chemical class 0.000 description 1
- 239000013589 supplement Substances 0.000 description 1
- 239000000829 suppository Substances 0.000 description 1
- 230000001629 suppression Effects 0.000 description 1
- 239000000454 talc Substances 0.000 description 1
- 229910052623 talc Inorganic materials 0.000 description 1
- MPLHNVLQVRSVEE-UHFFFAOYSA-N texas red Chemical compound [O-]S(=O)(=O)C1=CC(S(Cl)(=O)=O)=CC=C1C(C1=CC=2CCCN3CCCC(C=23)=C1O1)=C2C1=C(CCC1)C3=[N+]1CCCC3=C2 MPLHNVLQVRSVEE-UHFFFAOYSA-N 0.000 description 1
- 238000001269 time-of-flight mass spectrometry Methods 0.000 description 1
- 231100000419 toxicity Toxicity 0.000 description 1
- 230000001988 toxicity Effects 0.000 description 1
- 239000000196 tragacanth Substances 0.000 description 1
- 235000010487 tragacanth Nutrition 0.000 description 1
- 229940116362 tragacanth Drugs 0.000 description 1
- 238000013518 transcription Methods 0.000 description 1
- 230000035897 transcription Effects 0.000 description 1
- 108010014677 transcription factor TFIIE Proteins 0.000 description 1
- 108010014678 transcription factor TFIIF Proteins 0.000 description 1
- 108091006106 transcriptional activators Proteins 0.000 description 1
- 230000009261 transgenic effect Effects 0.000 description 1
- 238000013519 translation Methods 0.000 description 1
- YNJBWRMUSHSURL-UHFFFAOYSA-N trichloroacetic acid Chemical compound OC(=O)C(Cl)(Cl)Cl YNJBWRMUSHSURL-UHFFFAOYSA-N 0.000 description 1
- PIEPQKCYPFFYMG-UHFFFAOYSA-N tris acetate Chemical compound CC(O)=O.OCC(N)(CO)CO PIEPQKCYPFFYMG-UHFFFAOYSA-N 0.000 description 1
- 210000004881 tumor cell Anatomy 0.000 description 1
- 230000007306 turnover Effects 0.000 description 1
- 230000003827 upregulation Effects 0.000 description 1
- 239000004474 valine Substances 0.000 description 1
- 231100000747 viability assay Toxicity 0.000 description 1
- 238000003026 viability measurement method Methods 0.000 description 1
- 239000002699 waste material Substances 0.000 description 1
- 239000001993 wax Substances 0.000 description 1
- 230000004584 weight gain Effects 0.000 description 1
- 235000019786 weight gain Nutrition 0.000 description 1
- 239000011592 zinc chloride Substances 0.000 description 1
- JIAARYAFYJHUJI-UHFFFAOYSA-L zinc dichloride Chemical compound [Cl-].[Cl-].[Zn+2] JIAARYAFYJHUJI-UHFFFAOYSA-L 0.000 description 1
Images








Classifications
-
- G—PHYSICS
- G01—MEASURING; TESTING
- G01N—INVESTIGATING OR ANALYSING MATERIALS BY DETERMINING THEIR CHEMICAL OR PHYSICAL PROPERTIES
- G01N33/00—Investigating or analysing materials by specific methods not covered by groups G01N1/00 - G01N31/00
- G01N33/48—Biological material, e.g. blood, urine; Haemocytometers
- G01N33/50—Chemical analysis of biological material, e.g. blood, urine; Testing involving biospecific ligand binding methods; Immunological testing
- G01N33/68—Chemical analysis of biological material, e.g. blood, urine; Testing involving biospecific ligand binding methods; Immunological testing involving proteins, peptides or amino acids
- G01N33/6803—General methods of protein analysis not limited to specific proteins or families of proteins
- G01N33/6848—Methods of protein analysis involving mass spectrometry
- G01N33/6851—Methods of protein analysis involving laser desorption ionisation mass spectrometry
-
- C—CHEMISTRY; METALLURGY
- C12—BIOCHEMISTRY; BEER; SPIRITS; WINE; VINEGAR; MICROBIOLOGY; ENZYMOLOGY; MUTATION OR GENETIC ENGINEERING
- C12Q—MEASURING OR TESTING PROCESSES INVOLVING ENZYMES, NUCLEIC ACIDS OR MICROORGANISMS; COMPOSITIONS OR TEST PAPERS THEREFOR; PROCESSES OF PREPARING SUCH COMPOSITIONS; CONDITION-RESPONSIVE CONTROL IN MICROBIOLOGICAL OR ENZYMOLOGICAL PROCESSES
- C12Q1/00—Measuring or testing processes involving enzymes, nucleic acids or microorganisms; Compositions therefor; Processes of preparing such compositions
- C12Q1/25—Measuring or testing processes involving enzymes, nucleic acids or microorganisms; Compositions therefor; Processes of preparing such compositions involving enzymes not classifiable in groups C12Q1/26 - C12Q1/66
-
- G—PHYSICS
- G01—MEASURING; TESTING
- G01N—INVESTIGATING OR ANALYSING MATERIALS BY DETERMINING THEIR CHEMICAL OR PHYSICAL PROPERTIES
- G01N33/00—Investigating or analysing materials by specific methods not covered by groups G01N1/00 - G01N31/00
- G01N33/48—Biological material, e.g. blood, urine; Haemocytometers
- G01N33/50—Chemical analysis of biological material, e.g. blood, urine; Testing involving biospecific ligand binding methods; Immunological testing
- G01N33/68—Chemical analysis of biological material, e.g. blood, urine; Testing involving biospecific ligand binding methods; Immunological testing involving proteins, peptides or amino acids
- G01N33/6803—General methods of protein analysis not limited to specific proteins or families of proteins
- G01N33/6842—Proteomic analysis of subsets of protein mixtures with reduced complexity, e.g. membrane proteins, phosphoproteins, organelle proteins
-
- G—PHYSICS
- G01—MEASURING; TESTING
- G01N—INVESTIGATING OR ANALYSING MATERIALS BY DETERMINING THEIR CHEMICAL OR PHYSICAL PROPERTIES
- G01N2333/00—Assays involving biological materials from specific organisms or of a specific nature
- G01N2333/90—Enzymes; Proenzymes
- G01N2333/914—Hydrolases (3)
- G01N2333/978—Hydrolases (3) acting on carbon to nitrogen bonds other than peptide bonds (3.5)
- G01N2333/98—Hydrolases (3) acting on carbon to nitrogen bonds other than peptide bonds (3.5) acting on amide bonds in linear amides (3.5.1)
Definitions
- HATs histone acetyltransferases
- Histone acetyltransferases catalyze the transfer of an acetyl group from acetyl-CoA to the ⁇ -amino group of a lysine residue on the target protein.
- Many HAT enzymes have been characterized from eukaryotic organisms ( Sterner and Berger, Microbiol. Mol. Biol. Rev. 2000, 64, 435-459 ).
- HDAC enzymes utilize a zinc ion at the active site of the protein to catalyze the removal of the acetyl group from acetyllysine in the form of acetate.
- Members of the Sir2 family of enzymes use NAD as a cofactor in the hydrolysis of acetyllysine.
- acetylation state of histone proteins plays a major role in gene expression and in cell-cycle control, and appears to play a role in certain forms of cancer.
- abnormal recruitment of histone deacetylases by corepressor proteins has been shown to promote the development of promyelocytic leukemia.
- HDAC inhibitors can lead to growth inhibition, growth arrest, terminal differentiation, and/or apoptosis.
- In vivo studies have demonstrated growth inhibition of tumors and a reduction in tumor metastasis as a result of treatment with HDAC inhibitors ( Kramer et al. Trends Endocrinol. Metab. 2001, 12, 294-300 ).
- Histone acetyltransferase assays are typically radioactivity-based. In these formats, acetyl-CoA radiolabeled on the acetyl group is reacted with a peptide corresponding to a histone amino acid sequence. Transfer of radiolabeled acetate to the peptide is quantified by binding of the peptide to affinity resin ( Ait-Si-Ali et al. Nucleic Acids Res. 1998, 26, 3869-3870 ), phosphocellulose paper ( Tanner et al. J. Biol. Chem. 1999, 274, 18157-18160 ), or scintillation microplates ( Wynne Aheme et al.
- Methods 2002, 26, 245-53 and measurement of the associated radioactivity.
- the free CoA formed in the acetyltransferase reaction serves as a substrate for ⁇ -ketoglutarate dehydrogenase or pyruvate dehydrogenase. Formation of NADH serves as a measure of the rate of acetyltransferase activity ( Kim et al. Anal. Biochem. 2000, 280, 308-314 ).
- the most common deacetylase assay methodology involves labeling lysine groups in histone peptides with radiolabeled acetate.
- the deacetylase enzyme removes the acetyl group as acetate, which is subsequently isolated by extraction and quantified on the basis of its radioactivity ( Inoue and Fujimoto, Biochim. Biophys. Acta 1970, 220, 307-316 ).
- a scintillation proximity assay peptides derivatized with radiolabeled acetyl groups are attached to a bead containing scintillant that emits light upon exposure to radiation.
- a non-radioactivity-based assay uses peptides containing an acetyllysine group and a fluorescent tag. Reactivity is measured by high-performance liquid chromatography, using the difference in retention time of the acetylated and non-acetylated peptides to isolate and quantify the reaction products ( Hoffmann et al. Nucleic Acids Res. 1999, 27, 2057-8 ; Hoffinann et al. Bioconjug Chem. 2001, 12, 51-5 ; Hoffmann et al.
- a commercial assay uses a two-step detection protocol.
- a peptide containing an acetyllysine is reacted with a deacetylase for a given period of time.
- the reaction is quenched and the exposed lysine is reacted with a developing agent that produces a fluorophore, and the amount of deacetylated lysine is quantified using the fluorescence of the product (Biomol, Oak Meeting, Pa., USA).
- the activity of SIRT1 can be monitored.
- the loss of an acetyl group by the disappearance of the 1959.89 peak can be monitored ( figure 2 ).
- a decrease in acetylation can be measured which indicates that the protein is a substrate for SIRT1 which transmits the activity of SIRT1.
- a method for identifying a compound that activates a sirtuin comprising:
- the sirtuin may be, for example, a SIRT1 protein.
- the deacetylase may be a purified protein or provided as part of a mixture, such as a cell or tissue lysate.
- sequence of the peptide substrate may be derived from a histone, an HMG protein, p53, c-Myb, GATA-1, EKLF, MyoD, E2F, dTCF, or HIV Tat, or a fragment thereof.
- the mass spectrometry may be electrospray ionization (ESI) mass spectrometry or matrix-assisted laser desorption/ionization (MALDI) mass spectrometry.
- ESI electrospray ionization
- MALDI matrix-assisted laser desorption/ionization
- a compound that increases the activity of the deacetylase is identified.
- a decrease in the level of acetylation in the substrate pool in the presence of the test compound as compared to a control is indicative of a compound that increases the activity of the deacetylase.
- the concentration of peptide substrate in the peptide substrate pool may is below the Km of the sirtuin for the peptide substrate. In certain embodiments, the concentration of peptide substrate in the peptide substrate pool may be at least about 2-fold, 5-fold, 10-fold, 20-fold, 25-fold, or more, below the Km of the deacetylase for the peptide substrate.
- a compound that activates a sirtuin to a greater extent than resveratrol may be identified.
- a compound that has sirtuin activating activity at least about, 2-fold, 5-fold, 10-fold, 20-fold, 50-fold, 100-fold, or more, greater than the sirtuin activating activity of resveratrol may be identified.
- the compound is a small molecule.
- a method for identifying a compound that activates a sirtuin may further comprise one or more of the following: (i) preparing a quantity of the compound, or an analog thereof; (ii) conducting therapeutic profiling of the compound, or an analog thereof, for efficacy and toxicity in animals; (iii) formulating the compound, or analog thereof, in a pharmaceutical formulation; (iv) manufacturing a pharmaceutical preparation of a compound, or an analog thereof, having a suitable animal toxicity profile; (v) marketing a pharmaceutical preparation of a compound, or an analog thereof, having a suitable animal toxicity profile to healthcare providers.
- a method for determining the deacetylase activity of a sirtuin comprising:
- the concentration of peptide substrate in the peptide substrate pool may be below the Km of the deacetylase for the peptide substrate. In certain embodiments, the concentration of peptide substrate in the peptide substrate pool may be at least 10 fold below the Km of the deacetylase for the peptide substrate.
- the substrate peptide pool may comprise a single peptide species. In other embodiments, the substrate peptide pool may comprise a mixture of two or more peptides.
- the method for identifying a compound that modulates the activity of a sirtuin protein may further comprise assaying the compound for sirtuin modulating activity using an in vitro assay.
- in vitro assays may be conducted, for example, using mass spectrometry and/or fluorescent substrate to determine sirtuin activity.
- the in vitro assay may be carried out before contacting the sample of cells with the putative sirtuin modulating compound.
- the methods may further comprise comparing the results of the in vitro assay to the average ATP level per viable cell.
- the sample of cells may comprise NCI-H358 and/or MCF7 cells.
- the average ATP level per viable cell may be determined about 36-60 hours, or about 48 hours, after contacting the sample of cells with the putative sirtuin modulating compound.
- the sirtuin may be, for example, a SIRT1 protein.
- amino acid residue refers to an amino acid that is a member of a group of amino acids having certain common properties.
- conservative amino acid substitution refers to the substitution (conceptually or otherwise) of an amino acid from one such group with a different amino acid from the same group.
- a functional way to define common properties between individual amino acids is to analyze the normalized frequencies of amino acid changes between corresponding proteins of homologous organisms (Schulz, G. E. and R. H. Schirmer., Principles of Protein Structure, Springer-Verlag). According to such analyses, groups of amino acids may be defined where amino acids within a group exchange preferentially with each other, and therefore resemble each other most in their impact on the overall protein structure (Schulz, G. E. and R.
- One example of a set of amino acid groups defined in this manner include: (i) a charged group, consisting of Glu and Asp, Lys, Arg and His, (ii) a positively-charged group, consisting of Lys, Arg and His, (iii) a negatively-charged group, consisting of Glu and Asp, (iv) an aromatic group, consisting of Phe, Tyr and Trp, (v) a nitrogen ring group, consisting of His and Trp, (vi) a large aliphatic nonpolar group, consisting of Val, Leu and Ile, (vii) a slightly-polar group, consisting of Met and Cys, (viii) a small-residue group, consisting of Ser, Thr, Asp, Asn, Gly, Ala, Glu, Gln and Pro, (ix) an aliphatic group consisting of Val, Leu, Ile, Met and Cys, and (
- mammals include humans, primates, livestock animals (including bovines, porcines, etc.), companion animals (e.g., canines, felines, etc.) and rodents (e.g., mice and rats).
- livestock animals including bovines, porcines, etc.
- companion animals e.g., canines, felines, etc.
- rodents e.g., mice and rats.
- modulate when used in reference to the activity of an deacetylase, refers to the up regulation (e.g., activation or stimulation), down regulation (e.g., inhibition or suppression), or other change in a quality of such acetyltransferase or deacetylase activity.
- percent identical refers to sequence identity between two amino acid sequences or between two nucleotide sequences. Identity can each be determined by comparing a position in each sequence which may be aligned for purposes of comparison. When an equivalent position in the compared sequences is occupied by the same base or amino acid, then the molecules are identical at that position; when the equivalent site occupied by the same or a similar amino acid residue (e.g., similar in steric and/or electronic nature), then the molecules can be referred to as homologous (similar) at that position.
- Expression as a percentage of homology, similarity, or identity refers to a function of the number of identical or similar amino acids at positions shared by the compared sequences.
- FASTA FASTA
- BLAST BLAST
- ENTREZ is available through the National Center for Biotechnology Information, National Library of Medicine, National Institutes of Health, Bethesda, MD.
- the percent identity of two sequences can be determined by the GCG program with a gap weight of 1, e.g., each amino acid gap is weighted as if it were a single amino acid or nucleotide mismatch between the two sequences.
- MPSRCH uses a Smith-Waterman algorithm to score sequences on a massively parallel computer. This approach improves ability to pick up distantly related matches, and is especially tolerant of small gaps and nucleotide sequence errors. Nucleic acid-encoded amino acid sequences can be used to search both protein and DNA databases.
- pharmaceutically acceptable carrier refers to a pharmaceutically-acceptable material, composition or vehicle, such as a liquid or solid filler, diluent, excipient, solvent or encapsulating material, involved in carrying or transporting any subject composition or component thereof.
- a pharmaceutically-acceptable material such as a liquid or solid filler, diluent, excipient, solvent or encapsulating material, involved in carrying or transporting any subject composition or component thereof.
- Each carrier must be “acceptable” in the sense of being compatible with the subject composition and its components and not injurious to the patient.
- materials which may serve as pharmaceutically acceptable carriers include: (1) sugars, such as lactose, glucose and sucrose; (2) starches, such as corn starch and potato starch; (3) cellulose, and its derivatives, such as sodium carboxymethyl cellulose, ethyl cellulose and cellulose acetate; (4) powdered tragacanth; (5) malt; (6) gelatin; (7) talc; (8) excipients, such as cocoa butter and suppository waxes; (9) oils, such as peanut oil, cottonseed oil, safflower oil, sesame oil, olive oil, corn oil and soybean oil; (10) glycols, such as propylene glycol; (11) polyols, such as glycerin, sorbitol, mannitol and polyethylene glycol; (12) esters, such as ethyl oleate and ethyl laurate; (13) agar; (14) buffering agents, such as magnesium hydroxide and aluminum hydroxide;
- substantially homologous when used in connection with amino acid sequences, refers to sequences which are substantially identical to or similar in sequence with each other, giving rise to a homology of conformation and thus to retention, to a useful degree, of one or more biological (including immunological) activities. The term is not intended to imply a common evolution of the sequences.
- therapeutic agent is art-recognized and refers to any chemical moiety that is a biologically, physiologically, or pharmacologically active substance that acts locally or systemically in a subject.
- the term also means any substance intended for use in the diagnosis, cure, mitigation, treatment or prevention of disease or in the enhancement of desirable physical or mental development and/or conditions in an animal or human.
- therapeutic effect is art-recognized and refers to a local or systemic effect in animals, particularly mammals, and more particularly humans caused by a pharmacologically active substance.
- therapeutically-effective amount means that amount of such a substance that produces some desired local or systemic effect at a reasonable benefit/risk ratio applicable to any treatment.
- the therapeutically effective amount of such substance will vary depending upon the subject and disease condition being treated, the weight and age of the subject, the severity of the disease condition, the manner of administration and the like, which can readily be determined by one of ordinary skill in the art.
- the methods may involve, for example, contacting a substrate peptide pool with a sirtuin and determining the aceylation level of the substrate pool using mass spectrometry.
- the deacetylase that is used in accordance with the methods described herein is a sirtuin protein.
- a sirtuin protein refers to a member of the sirtuin deacetylase protein family, or preferably to the sir2 family, which include yeast Sir2 (GenBank Accession No. P53685), C. elegans Sir-2.1 (GenBank Accession No. NP_501912), and human S1RT1 (GenBank Accession No. NM_012238 and NP_036370 (or AF083106)) and SIRT2 (GenBank Accession No.
- HST genes h omologues of Sir two
- HST1, HST2, HST3 and HST4 the five other human homologues hSIRT3, hSIRT4, hSIRT5, hSIRT6 and hSIRT7
- HST genes h omologues of Sir two
- HST1, HST2, HST3 and HST4 the five other human homologues
- hSIRT3, hSIRT4, hSIRT5, hSIRT6 and hSIRT7 Brachmann et al. (1995) Genes Dev. 9:2888 and Frye et al. (1999) BBRC 260:273 .
- Homologs e.g., orthologs and paralogs, domains, fragments, variants and derivatives of the foregoing may also be used in accordance with the methods described herein.
- Class III HDACs form a structurally distant class of NAD dependent enzymes that are related to the yeast SIR2 proteins and are not inhibited by hydroxamic acid-based HDAC inhibitors.
- a SIRT1 protein refers to a member of the sir2 family of sirtuin deacetylases.
- a SIRT1 protein includes yeast Sir2 (GenBank Accession No. P53685), C. elegans Sir-2.1 (GenBank Accession No. NP_501912), human SIRT1 (GenBank Accession No. NM_012238 or NP_036370 (or AF083106)), and human SIRT2 (GenBank Accession No.
- a SIRT1 protein includes a polypeptide comprising a sequence consisting of, or consisting essentially of, the amino acid sequence set forth in GenBank Accession Nos. NP_036370, NP_501912, NP_085096, NP_036369, or P53685.
- SIRT1 proteins include polypeptides comprising all or a portion of the amino acid sequence set forth in GenBank Accession Nos.
- NP_036370, NP_501912, NP_085096, NP_036369, or P53685 the amino acid sequence set forth in GenBank Accession Nos. NP_036370, NP_501912, NP_085096, NP_036369, or P53685 with 1 to about 2, 3, 5, 7, 10, 15, 20, 30, 50, 75 or more conservative amino acid substitutions; an amino acid sequence that is at least 60%, 70%, 80%, 90%, 95%, 96%, 97%, 98%, or 99% identical to GenBank Accession Nos. NP_036370, NP_501912, NP_085096, NP_036369, or P53685, and functional fragments thereof.
- SIRT1 proteins also include homologs (e.g., orthologs and paralogs), variants, or fragments, of GenBank Accession Nos. NP_036370, NP_501912, NP_085096, NP_036369, or P53685.
- homologs e.g., orthologs and paralogs
- variants or fragments, of GenBank Accession Nos. NP_036370, NP_501912, NP_085096, NP_036369, or P53685.
- a SIRT3 protein refers to a member of the sirtuin deacetylase protein family and/or to a homolog of a SIRT1 protein.
- a SIRT3 protein includes human SIRT3 (GenBank Accession. No. AAH01042, NP_036371, or NP_001017524) and mouse SIRT3 (GenBank Accession No. NP_071878) proteins, and equivalents and fragments thereof.
- a SIRT3 protein includes a polypeptide comprising a sequence consisting of, or consisting essentially of, the amino acid sequence set forth in GenBank Accession Nos.
- SIRT3 proteins include polypeptides comprising all or a portion of the amino acid sequence set forth in GenBank Accession AAH01042, NP_036371, NP_001017524, or NP_071878; the amino acid sequence set forth in GenBank Accession Nos. AAH01042, NP_036371, NP_001017524, or NP_071878 with 1 to about 2, 3, 5, 7, 10, 15, 20, 30, 50, 75 or more conservative amino acid substitutions; an amino acid sequence that is at least 60%, 70%, 80%, 90%, 95%, 96%, 97%, 98%, or 99% identical to GenBank Accession Nos.
- SIRT3 proteins also include homologs. (e.g., orthologs and paralogs), variants, or fragments, of GenBank Accession Nos. AAH01042, NP_036371, NP_001017524, or NP_071878.
- a biologically active portion of a sirtuin may be used in accordance with the methods described herein.
- a biologically active portion of a sirtuin refers to a portion of a sirtuin protein having a biological activity, such as the ability to deacetylate.
- Biologically active portions of sirtuins may comprise the core domain of a sirtuin.
- Biologically active portions of SIRT1 having GenBank Accession No. NP_036370 that encompass the NAD+ binding domain and the substrate binding domain for example, may include without limitation, amino acids 62-293 of GenBank Accession No. NP_ 036370, which are encoded by nucleotides 237 to 932 ofGenBank Accession No.
- NP_036370 Other biologically active portions of SIRT1, also sometimes referred to as core domains, include about amino acids 261 to 447 of GenBank Accession No. NP_036370, which are encoded by nucleotides 834 to 1394 of GenBank Accession No. NM_012238; about amino acids 242 to 493 of GenBank Accession No. NP_036370, which are encoded by nucleotides 777 to 1532 of GenBank Accession No. NM_012238; or about amino acids 254 to 495 of GenBank Accession. No. NP_036370, which are encoded by nucleotides 813 to 1538 of GenBank Accession No.
- a biologically active portion of a sirtuin may be a fragment of a SIRT3 protein that is produced by cleavage with a mitochondrial matrix processing peptidase (MPP) and/or a mitochondrial intermediate peptidase (MIP).
- MPP mitochondrial matrix processing peptidase
- MIP mitochondrial intermediate peptidase
- the deacetylase enzymes that may be used in accordance with the methods described herein may be endogenous proteins, recombinant proteins, purified proteins, or proteins present in a mixture, such as a cell or tissue lysate.
- suitable enzymes for use in accordance with the methods described herein may be purchased commercially or purified using standard procedures.
- human SIRT1 Catalog #SE-239
- human SIRT2 Catalog #SE-251
- human SIRT3 Catalog #SE-270
- Methods for expression and purification of human SIRT1 and human SIRT3 are described, tor example, in PCT Publication No. WO 2006/094239 .
- suitable enzymes for use in accordance with the methods described herein may be provided as part of a mixture, such as, for example, a cell or tissue lysate or fractionated lysate.
- Suitable lysates include raw lysates including all components of the cell or tissue or lysates from which one or more components have been removed, such as, for example, nucleic acids, insoluble materials, membrane materials, etc.
- the lysate may be obtained from a variety of sources such as a blood cell sample, tissue sample, cell culture, etc.
- the peptide substrate utilized in the reaction comprises at least one acetylated lysine residue.
- the sequence of the peptide substrate may be obtained, or derived, from a protein that may be deacetylated by a deacetylase.
- exemplary substrates for acetyltransferases and deacetylases include, for example, histones (e.g., H1, H2, H2A, H2B, H3 and H4), nonhistone chromatin proteins (e.g., HMG1, HMG2, Yeast Sin1, HMG14, HMG17, and HMG I(Y)), transcriptional activators (e.g., p53, c-Myb, GATA-1, EKLF, MyoD, E2F, dTCF, and HIV Tat), nuclear receptor coactivators (e.g., ACTR, SRC-1, TIF2), general transcription factors (e.g., TFIIE and TFIIF), importin- ⁇ 7, Rch1, and ⁇ -tubulin.
- histones e.g., H1, H2, H2A,
- Substrate peptides used in accordance with the methods described herein may comprise an entire substrate protein or a portion thereof containing at least one lysine residue.
- a substrate peptide that contains only a single lysine residue.
- One or more lysine residues may be removed from a peptide substrate sequence by replacing the amino acid residue with a different amino acid residue or by deleting the amino acid residue from the sequence without substitution of a different amino acid.
- one or more lysine residues may be replaced using a conservative amino acid substitution.
- the invention provides a method for identifying compounds that activate a sirtuin protein, such as, for example, a SIRT1 protein.
- the methods utilize a substrate peptide that is a sirtuin activatable substrate peptide.
- a sirtuin activatable substrate peptide is a peptide substrate that is suitable for use in a mass spectrometry based assay to identify activators of sirtuin activity.
- a sirtuin activatable substrate peptide may be identified using a variety of sirtuin assays, including for example, the mass spectrometry assay described herein and the other sirtuin activity assays described herein below.
- sirtuin activatable substrate peptides are provided herein in Tables 1 and 2 below.
- the sequence of a sirtuin activatable substrate peptide is derived from a known sirtuin substrate, such as, for example, an HMG protein, p53, c-Myb, GATA-1, EKLF, MyoD, E2F, dTCF, or HIV Tat, or a fragment thereof.
- a sirtuin activatable substrate peptide may be from about 5-100, about 10-100, about 10-75, about 10-50, about 20-100, about 20-75, about 20-50, about 20-30, or about 20-25 amino acids in length.
- a sirtuin activatable substrate peptide comprises at least one hydrophobic region.
- a hydrophobic region may be located at or near one or both ends of the sirtuin activatable substrate peptide, e.g., the N-terminal and/or C-terminal ends.
- a hydrophobic region may be naturally occurring in the sequence of the sirtuin activatable substrate peptide, e.g., at least a portion of a sirtuin substrate protein comprising a hydrophobic region may be used as the substrate peptide.
- a hydrophobic region may be added to a sirtuin activatable substrate peptide.
- a hydrophobic region may be added to a substrate peptide by modifying the sequence of the peptide to increase the number of hydrophobic amino acid residues in a desired region, e.g., by adding 1, 2, 3, 4, 5, 6, 7, 8, 9, 10, or more, hydrophobic amino acid residues to a peptide either by the addition of new amino acid residues or by the replacement of existing non-hydrophobic (or less hydrophobic) amino acid residues with hydrophobic (or more strongly hydrophobic) amino acid residues.
- a hydrophobic region may be region of about 2, 3, 4, 5, 6, 7, 8, 9, 10 or more hydrophobic amino acid residues in a contiguous or substantially contiguous stretch within the peptide.
- Hydrophobic amino acid residues include alanine, phenylalanine, glycine, isoleucine, leucine, methionine, proline, valine, and tryptophan.
- hydrophobic regions comprise one or more tryptophan, alanine and/or phenylalanine amino acid residues.
- a hydrophobic region may be added to a substrate peptide by chemically modifying the peptide to increase its hydrophobicity.
- a hydrophobic region may be introduced into a peptide by covalently attaching a hydrophobic chemical moiety to the peptide.
- Examples of chemical moieties include, for example, fluorophores, such as, AF 350, AF 430, AF 488, AF 532, AF 546, AF 568, AF 594, AF 633, AF 647, AF 660, AF 680, dintrophenyl, AMCA, Cascade Blue, Marina Blue, Fluorescein/FITC, Oregon Green 488, Rhodamine Green, BODIPY FL, BODIPY TMR, BODIPY TR, Oregon Green 514, Rhodamine Red, Tetramethylrhodamine, Texas Red, BODIIPY 630/650, BODTPY 650/665, QSY 7, FluorX, Cy2 bis, Cy3 mono, Cy3.5 mono, Cy5 mono, Cy5.5 mono, Cy7 mono, DEAC, R6G, TAMRA, and MR 121.
- fluorophores such as, AF 350, AF 430, AF 488, AF 532, AF 546, AF
- the hydrophobic chemical moiety may be covalently linked or conjugated to the peptide so as not to interfere with acetylation or deacetylation of the lysine residue(s).
- Substrate peptides that may be used in accordance with the methods described herein can be synthesized according to conventional methods.
- the substrate peptides may include naturally occurring peptides, peptides prepared by genetic recombination techniques, and synthetic peptides.
- the peptides may be fused with other peptides (for example, glutathione-S-transferase, HA tag, FLAG tag, etc.) for convenience of purification, etc.
- the peptide may comprise structural units other than amino acids so long as it serves as a substrate for a deacetylase or acetyl transferase.
- the synthesis of a peptide is achieved by adding amino acids, residue by residue, from the carboxyl terminus of the amino acid sequence of interest. Further, some of the peptide fragments synthesized in that way may be linked together to from a larger peptide molecule.
- the substrate peptide For measuring deacetylase activity, the substrate peptide needs to be acetylated before the reaction is conducted.
- An exemplary method of amino acid acetylation includes acetylation of amino acids, whose ⁇ -amino groups and side-chain amino groups are blocked with protecting groups, with acetic anhydride, N-hydroxysuccinimide acetate, or similar reagents.
- acetylated amino acids are then used to synthesize peptides comprising acetylated lysine residues, for example, using the solid-phase method.
- acetylated peptides can be synthesized using a peptide synthesizer according to the Fmoc method.
- commercial suppliers who provide custom peptide synthesis services, can synthesize peptides having specified amino acid sequences comprising residues acetylated at predetermined positions.
- peptide substrates for Sirt 1, Sirt2 and Sirt3 deacetylases that may be used in accordance with the methods described herein are shown below in Tables 1 and 2.
- Table 1 Sirt1, Sirt2 and Sirt3 peptide substrates having covalently attached chemical moieties.
- the invention provides a peptide substrate for use in determining the activity of a sirtuin using mass spectrometry wherein the substrate comprises one or more of SEQ ID NOs: 1-35.
- the methods described herein are carried out under conditions which permit deacetylation of the peptide substrate by a deacetylase.
- the substrate peptide pool comprises a plurality of copies of one or more substrate peptides.
- a substrate peptide pool comprises a plurality of copies of the same peptide substrate.
- Such peptide substrate pools may comprise the peptide substrate free floating in solution or attached to a solid surface such as a plate, bead, filter, etc. Combinations of free floating and anchored peptide substrate molecules may also be used in accordance with the methods described herein.
- the methods described herein may be carried out in a single reaction vessel without the need to remove reagents from the reaction mixture (e.g., a homogenous assay).
- the components of the reactions described herein may be added sequentially or simultaneously.
- the invention provides a method for identifying a compound that activates a sirtuin.
- the methods may involve comparing the activity of a sirtuin in the presence of a test compound to the activity of the sirtuin in a control reaction.
- the control reaction may simply be a duplicate reaction in which the test compound is not included.
- the control reaction may be a duplicate reaction in the presence of a compound having a known effect on the sirtuin deacetylase activity (e.g., an activator, an inhibitor, or a compound having no effect on enzyme activity).
- peptide substrates Due to the flexibility available in designing peptide substrates for the mass spectrometry based methods described herein, it is possible to optimize the peptide substrates to provide a low apparent Km thus permitting a lower concentration of substrate to be used in association with the methods.
- Table 3 shown below provides the Km values for a sirtuin peptide substrate provided in accordance with the methods described herein in comparison to the Km values of several published or commercially available sirtuin assays. Accordingly, in certain embodiments, the substrate peptides for use in accordance with the methods described herein may be optimized to provide a low apparent Km. Table 3. Km comparisons for various sirtuin assays.
- Mass spectrometry encompasses any spectrometric technique or process in which molecules are ionized and separated and/or analyzed based on their respective molecular weights.
- mass spectrometry and MS encompass any type of ionization method, including without limitation electrospray ionization (ESI), atmospheric-pressure chemical ionization (APCI) and other forms of atmospheric pressure ionization (API), and laser irradiation.
- ESI electrospray ionization
- APCI atmospheric-pressure chemical ionization
- API atmospheric pressure ionization
- laser irradiation irradiation.
- Mass spectrometers may be combined with separation methods such as gas chromatography (GC) and liquid chromatography (LC).
- GC or LC separates the components in a mixture, and the components are then individually introduced into the mass spectrometer; such techniques are generally called GC/MS and LC/MS, respectively.
- MS/MS is an analogous technique where the first-stage separation device is another mass spectrometer.
- the separation methods comprise liquid chromatography and MS. Any combination (e.g., GC/MS/MS, GC/LC/MS, GC/LC/MS/MS, etc.) of methods can be used to practice the methods described herein.
- MS can refer to any form of mass spectrometry; by way of non-limiting example, LC/MS encompasses LC/ESI MS and LC/MALDI-TOF MS.
- mass spectrometry and MS include without limitation APCI MS; ESI MS; GC MS; MALDI-TOF MS; LC/MS combinations; LC/MS/MS combinations; MS/MS combinations; etc.
- Other examples of MS include, for example, MALDI-TOF-TOF MS, MALDI Quadrupole-time-of-flight (Q-TOF) MS, electrospray ionization (ESI)-TOF MS, ESI-Q-TOF, ESI-TOF-TOF, ESI-ion trap MS, ESI Triple quadrupole MS, ESI Fourier Transform Mass Spectrometry (FTMS), MALDI-FTMS, MALDI-Ion Trap-TOF, ESI-Ion Trap TOF, surface-enhanced laser desorption/ionization (SELDI), MS/MS/MS, ESI-MS/MS, quadrupole time-of-flight mass spectrometer QqTOF MS, MALD
- MS MS-chromatography
- High-pressure liquid chromatography is a separative and quantitative analytical tool that is generally robust, reliable and flexible.
- Reverse-phase is a commonly used stationary phase that is characterized by alkyl chains of specific length immobilized to a silica bead support.
- RP-HPLC is suitable for the separation and analysis of various types of compounds including without limitation biomolecules, (e.g., glycoconjugates, proteins, peptides, and nucleic acids, and, with mobile phase supplements, oligonucleotides).
- biomolecules e.g., glycoconjugates, proteins, peptides, and nucleic acids, and, with mobile phase supplements, oligonucleotides.
- EI electrospray ionization
- liquid samples can be introduced into a mass spectrometer by a process that creates multiple charged ions ( Wilm et al., Anal. Chem. 68:1, 1996 ).
- multiple ions can result in complex spectra and reduced sensitivity.
- peptides and proteins are injected into a column, typically silica based C18.
- An aqueous buffer is used to elute the salts, while the peptides and proteins are eluted with a mixture of aqueous solvent (water) and organic solvent (acetonitrile, methanol, propanol).
- the aqueous phase is generally HPLC grade water with 0.1% acid and the organic solvent phase is generally an HPLC grade acetonitrile or methanol with 0.1% acid.
- the acid is used to improve the chromatographic peak shape and to provide a source of protons in reverse phase LC/MS.
- the acids most commonly used are formic acid, triflouroacetic acid, and acetic acid.
- MALDI-TOF MS matrix-assisted laser desorption time-of-flight mass spectrometry
- the method may be used for detection and characterization of biomolecules, such as proteins, peptides, oligosaccharides and oligonucleotides, with molecular masses between about 400 and about 500,000 Da, or higher.
- MALDI-MS is a sensitive technique that allows the detection of low (10 -15 to 10 -18 mole) quantities of analyte in a sample.
- Electrospray ionization may be used for both very large and small molecules.
- the electrospray process produces multiply charged analytes, making it somewhat easier to detect larger analytes such as proteins.
- small molecules can be measured readily in the absence of matrix.
- the MALDI process requires a matrix, which may make it more difficult to analyze small molecules, for example, with molecular weights of less than about 700 daltons.
- sensitivity decreases as the molecular weight of a molecule increases.
- the detection sensitivity of molecules with molecular weights in the range of about 10,000 daltons may be an order of magnitude or more lower than detection sensitivity of molecules with molecular weights in the range of about 1,000 daltons.
- Use and detection of a coding moiety and/or labels with a different, for example lower, molecular weight than the analyte can therefore enhance the sensitivity of the assay.
- Sensitivity can also be increased by using a coding moiety and/or that is very amenable to ionization.
- a mass spectrometer such as a quadropole, an ion trap, a TOF, a FTICR, or a tandem mass spectrometer
- the higher molecular weight compounds for example, proteins are observed as ions having a variable number of charge states. While the multiple charge phenomenon increases sensitivity, the spectra are more complex and difficult to interpret. Use and detection of a coding moiety with a less complex mass spectrum than the analyte can therefore enhance the resolution of the assay.
- mass spectrometers may be used in accordance with the methods described herein.
- Representative examples include: triple quadrupole mass spectrometers, magnetic sector instruments (magnetic tandem mass spectrometer, JEOL, Peabody, Mass.), ionspray mass spectrometers ( Bruins et al., Anal Chem. 59:2642-2647, 1987 ), electrospray mass spectrometers (including tandem, nano- and nano-electrospray tandem) ( Fenn et al., Science 246:64-71, 1989 ), laser desorption time-of-flight mass spectrometers ( Karas and Hillenkamp, Anal. Chem. 60:2299-2301, 1988 ), and a Fourier Transform Ion Cyclotron Resonance Mass Spectrometer (Extrel Corp., Pittsburgh, Mass.).
- the mass spectrometry based assay methods described herein are conducted in a high throughput manner as described in C.C. Ozbal, et al., Assay and Drug Development Technologies 2: 373-381 (2004 ).
- the high throughput mass spectrometry based assay methods described herein utilize an integrated microfluidic system which uses an atmospheric pressure ionization triple quadrupole mass spectrometer as the detection system with electrospray ionization (ESI) or atmospheric pressure chemical ionization (APCI).
- ESI electrospray ionization
- APCI atmospheric pressure chemical ionization
- the invention provides methods for screening for compounds that activate a deacetylase.
- the methods described herein may be used to identify a test compound that increases deacetylase activity by at least about 10%, 25%, 50%, 75%, 80%, 90%, or 100%, or more, relative to the absence of the test compound.
- the methods described herein may be used to identify a sirtuin activating compound that increases deacetylase activity by at least about 10%, 25%, 50%, 75%, 80%, 90%, or 100%, or more, relative to the sirtuin activating activity of resveratrol.
- the concentration of the peptide substrate in the reaction is below the Km of the enzyme for the peptide substrate.
- the concentration of the peptide substrate in the reaction may be at least 2-fold, 5-fold, 10-fold, 15-fold, 20-fold, 25-fold, 30-fold, or more, below the Km of the enzyme for the peptide substrate.
- Test compounds can be pharmacologic agents already known in the art or can be compounds previously unknown to have any pharmacological activity.
- the compounds can be naturally occurring or designed in the laboratory. They can be isolated from microorganisms, animals, or plants, and can be produced recombinantly, or synthesized by chemical methods known in the art. If desired, test compounds can be obtained using any of the numerous combinatorial library methods known in the art, including but not limited to, biological libraries, spatially addressable parallel solid phase or solution phase libraries, synthetic library methods requiring deconvolution, the "one-bead one-compound” library method, and synthetic library methods using affinity chromatography selection.
- the biological library approach is limited to polypeptide libraries, while the other four approaches are applicable to polypeptide, non-peptide oligomer, or small molecule libraries of compounds. See Lam, Anticancer Drug Des. 12, 145, 1997 .
- Test compounds can be screened for the ability to modulate acetyltransferase or deacetylase activity using high throughput screening. Using high throughput screening, many discrete compounds can be tested in parallel so that large numbers of test compounds can be quickly screened.
- the most widely established techniques utilize 96-well microtiter plates. In addition to the plates, many instruments, materials, pipettors, robotics, plate washers, and plate readers are commercially available to fit the 96-well format.
- free format assays or assays that have no physical barrier between samples, can be used.
- Assays involving free formats are described, for example, in Jayawickreme et al., Proc. Natl. Acad. Sci. U.S.A. 19, 1614-18 (1994 ); Chelsky, "Strategies for Screening Combinatorial Libraries: Novel and Traditional Approaches," reported at the First Annual Conference of The Society for Biomolecular Screening in Philadelphia, Pa. (Nov. 7-10, 1995 ); and Salmon et al., Molecular Diversity 2, 57-63 (1996 ).
- Another high throughput screening method is described in Beutel et al., U.S. Pat. No. 5,976,813 .
- Such kits may be useful for research purposes, drug discovery, diagnostic purposes, etc.
- kits may comprise a peptide substrate (as described above) and one or more of the following: a sirtuin, one or more test compounds, a positive control, a negative control, instructions for use, a reaction vessel, buffers, a MALDI matrix, etc.
- Kits for determination of deacetylase activity may comprise a previously acetylated substrate peptide.
- the peptide substrate may also comprise a hydrophobic region.
- each component e.g., the substrate peptide, the deacetylase, and/or test compound, may be packaged separately.
- kits may be combined so as to realize a final concentration that is suitable for the reaction.
- the kit may comprise a buffer that gives a condition suitable for the reaction.
- the enzyme preparation and the substrate peptide may be combined with other components that stabilize proteins.
- the kit components may be stored and/or shipped in the presence of about 1% BSA and about 1% polyols (e.g., sucrose or fructose) to prevent protein denaturation after lyophilization.
- Each component of the kit can be provided in liquid form or dried form.
- Detergents, preservatives, buffers, and so on, commonly used in the art may be added to the components so long as they do not inhibit the measurement of the deacetylase activity.
- sirtuin deacetylase activity which can be selected according to the method for screening of the present invention, are useful as candidate compounds for antimicrobial substances, anti-cancer agents, and a variety of other uses.
- compounds that activate a sirtuin deacetylase protein may be useful for increasing the lifespan of a cell, and treating and/or preventing a wide variety of diseases and disorders including, for example, diseases or disorders related to aging or stress, diabetes, obesity, neurodegenerative diseases, chemotherapeutic induced neuropathy, neuropathy associated with an ischemic event, ocular diseases and/or disorders, cardiovascular disease, blood clotting disorders, inflammation, and/or flushing, etc.
- Sirtuin deacetylase inhibitors may be useful for a variety of therapeutic applications including, for example, increasing cellular sensitivity to stress, increasing apoptosis, treatment of cancer, stimulation of appetite, and/or stimulation of weight gain, etc.
- the mass spectrometry assays described herein do not utilize a peptide substrate that is obtained or derived from an HIV Tat protein.
- the invention provides a method for identifying a compound that activates a sirtuin protein comprising (a) contacting a peptide substrate pool with a sirtuin in the presence of a test compound, wherein members of said peptide substrate pool have the amino acid sequence set forth in SEQ ID NO: 34; and (b) determining the level of acetylation of the peptide substrate pool using mass spectrometry, wherein a decrease in the level of acetylation of the peptide substrate pool in the presence of the test compound as compared to a control is indicative of a compound that activates a sirtuin.
- the invention provides a method for identifying a compound that activates a deacetylase, comprising (a) contacting a peptide substrate pool with a deacetylase in the presence of a test compound, wherein members of said peptide substrate pool comprise at least one acetylated lysine residue, and (b) determining the level of acetylation of the peptide substrate pool using mass spectrometry, wherein a decrease in the level of acetylation of the peptide substrate pool in the presence of the test compound as compared to a control is indicative of a compound that activates a deacetylase, with the proviso that the method does not comprise contacting a peptide substrate pool with a sirtuin in the presence of a test compound, wherein members of said peptide substrate pool have the amino acid sequence set forth in SEQ ID NO: 34.
- the application describes cell based methods for determining sirtuin activity.
- the assays comprise contacting a cell with a putative sirtuin modulating compound and then determining cell viability and ATP levels in the cell.
- An increase in the average ATP level per viable cell is indicative of an increase in sirtuin activity (e.g., a sirtuin activating compound) whereas a decrease in the average ATP level per viable cell is indicative of a decrease in sirtuin activity (e.g., a sirtuin inhibiting compound).
- the assays may further comprise conducting an in vitro assay to determine if the compound has sirtuin modulating activity.
- Such in vitro assays may be carried out before, after, or simultaneously with the cell based assays.
- the cell based assays described herein may be used as a secondary screen to further characterize a putative sirtuin modulating compound.
- the cell based assays may be used to confirm that a sirtuin modulating compound identified in vitro has sirtuin modulating activity in a cellular environment, provide information about cell membrane permeability and/or cellular toxicity.
- Compounds that show a lower level of sirtuin modulating activity in a cell based assay as compared to an in vitro assay may be indicative of compounds that have low cell membrane permeability or compounds that are cell membrane impermeable.
- compounds that show sirtuin activating activity in an in vitro assay but show sirtuin inhibiting activity in a cell based assay may be indicative of compounds that are cytotoxic. Accordingly, such cell based assays will provide useful information for developing therapeutic agents.
- the cell based methods described herein may be used to determine the effect of a putative sirtuin modulating compound on mitochondrial biogenesis.
- the cell based methods for determining sirtuin activity described herein may utilize a sirtuin activatable cell line.
- a sirtuin activatable cell line is a cell line that is suitable for use in the cell based sirtuin activating assays described herein.
- a sirtuin activatable cell line comprises a relatively low endogenous level of one or more sirtuin proteins (e.g., the amount of sirtuin activity in the cell is not saturating and an increase in activity is observable) and a relatively low level of mitochondria and/or oxidative phosphorylation capacity (e.g., the amount of mitochondria and/or oxidative phosphorylation in the cell is not saturating and an increase in ATP levels is observable).
- a sirtuin activatable cell line may be identified using the methods described in the Exemplification section below. Exemplary sirtuin activatable cell lines include, for example, NCI-H358 and MCS7.
- the cell based methods for determining sirtuin activity described herein involve determination of ATP levels in a cell or sample of cells. ATP levels can be determined by any method known in the art or any method yet to be discovered.
- Reagent formulations containing luciferase and luciferin for assaying ATP in a sample are known in the art.
- U.S. Pat. No. 6,004,767 of Crouch et al. discloses a bioluminescent reagent as a freeze dried powder, to be reconstituted prior to use.
- U.S. Pat. No. 5,558,986 of Lundin discloses such reagent formulation for use in combination with a cyclodextrin.
- kits for determining ATP levels are commercially available from a variety of sources, including, for example, ATP Assay Kit (Calbiochem, San Diego, CA), ATP Determination Kit (Molecular Probes (Invitrogen), Eugene, OR), ENLITEN ATP Assay System (Promega, Madison, WI), ATP Bioluminescence Assay Kit (Roche Applied Science, Indianapolis, IN), Adenosine 5'-triphosphate (ATP) Bioluminescent Assay Kit (Sigma-Aldrich, St. Louis, MO), ATP Assay Kit (thermo Electron Corporation, Milford, MA).
- the cell based methods for determining sirtuin activity described herein involve determination of cell viability in sample of cells.
- Cell viability can be determined by any method known in the art or any method yet to be discovered.
- Exemplary methods for determining cell viability include, for example, Alamar Blue, Brd U, MTT, Trypan Blue exclusion, 3 H-thymidine incorporation, and XTT assays. Kits for determining cell viability are commercially available from a variety of sources.
- the cell based methods for determining sirtuin activity described herein may further comprise determination of sirtuin activity in an in vitro assay.
- Sirtuin activity can be determined by any method known in the art or any method yet to be discovered.
- Assays for determining sirtuin activity may be conducted in a cell based or cell free format.
- an assay may comprise incubating (or contacting) a sirtuin with a test agent under conditions in which a sirtuin can be activated by an agent known to activate the sirtuin, and monitoring or determining the level of activation of the sirtuin in the presence of the test agent relative to the absence of the test agent.
- the level of activation of a sirtuin can be determined by determining its ability to deacetylate a substrate.
- exemplary substrates are acetylated peptides, for example, peptides from BIOMOL (Plymouth Meeting, PA), peptides of p53 (such as those comprising an acetylated K382), the Fluor de Lys-SIRT1 (BIOMOL) acetylated peptide (Arg-His-Lys-Lys), peptides from human histones H3 and H4, an acetylated amino acid, and the other peptide substrates described herein.
- the HDAC fluorescent activity assay/drug discovery kit (AK-500, BIOMOL Research Laboratories) may be used to determine the level of acetylation. Methods for determining sirtuin activity have been described. For example, Bitterman et al. (2002) J. Biol. Chem. 277:45099 describe a fluorescence based assay for determination of sirtuin activity. Additionally, fluorescent enzyme assay kits for determining sirtuin activity are commercially available (Biomol International L.P., Plymouth Meeting, PA). Other suitable assays for identifying sirtuin activators include a fluorescence polarization based assay described in PCT/US06/07748 or the mass spectrometry assays described herein.
- the cell based assays described herein may comprise determination of ATP levels and cell viability at one or more fixed time points after contacting the cells with a potential sirtuin modulating compound.
- ATP level and cell viability are determined at about 12-84 hours, about 24-72 hours, about 36-60 hours, or at about 48 hours after exposure of the cells to a potential sirtuin modulating compound.
- the cell based assays described herein may comprise determination of ATP level and cell viability in a sample of cells that are growing logrhythmically (e.g., log phase growth).
- controls include duplicate assays in which cell samples are contacted with vehicle alone or with a sirtuin modulating compound having known activity (e.g., a sirtuin activating compound, sirtuin inhibiting compound, and/or a compound having no sirtuin modulating activity).
- a sirtuin modulating compound having known activity e.g., a sirtuin activating compound, sirtuin inhibiting compound, and/or a compound having no sirtuin modulating activity.
- the mass spectrometry based assay utilizes a peptide having 20 amino acid residues as follows: Ac-EE-K(biotin)-GQSTSSHSK(Ac)NIeSTEG-K(5TMR)-EE-NH2 (SEQ ID NO: 34) wherein K(Ac) is an acetylated lysine residue and Nle is a norleucine.
- the peptide is labeled with the fluorophore 5TMR (excitation 540 nm/emission 580 nm) at the C-terminus.
- the sequence of the peptide substrate is based on p53 with several modifications.
- the methionine residue naturally present in the sequence was replaced with the norleucine because the methionine may be susceptible to oxidation during synthesis and purification.
- An identical peptide lacking the acetyl group on the lysine was also synthesized as a standard for the expected product in the mass spectrometry assay.
- This second peptide having 20 amino acid residues is as follows: Ac-EE-K(biotin)-GQSTSSHSKNIeSTEG-K(5TMR)-EE-NH2 (SEQ ID NO: 35) wherein Nle is a norleucine.
- the peptide is also labeled with the fluorophore 5TMR (excitation 540 nm/emission 580 nm) at the C-terminus.
- the methionine residue naturally present in the sequence was replaced with the norleucine because the methionine may be susceptible to oxidation during synthesis and purification.
- SIRT1 acetylated and deacetylated peptide substrates were obtained from Biopeptide, Inc. (San Diego, CA).
- Mass spectrometry can be used to detect the change in mass observed in a peptide substrate following deacetylation as deacetylation results in a mass change of 44 atomic mass units (AMU) in the peptide substrate (i.e. the difference in expected mass units between the peptide corresponding to SEQ ID NO: 34 and SEQ ID NO: 35).
- a mass spectrometry analytical method for the detection of SIRT1 Acetylated Peptide Substrate and SIRT1 Deacetylated Peptide Substrate was developed using substrate and product peptide standards. Mass Spectrometry was done via high throughput as described in Ozbal et al. (Assay and Drug Development Technologies, 2 (4), 2004 ).
- this method can be used to screen NCEs, in a HTS (High Throughput Screen) manner, against SIRT1 to identify inhibitors and/or activators.
- SIRT1 protein was expressed and purified as follows.
- the SirT1 gene was cloned into a T7-promoter containing vector and transformed into BL21 (DE3).
- the protein was expressed by induction with 1 mM IPTG as an N-terminal His-tag fusion protein at 18°C overnight and harvested at 30,000 x g.
- Cells were lysed with lysozyme in lysis buffer (50 mM Tris-HCl, 2 mM Tris[2-carboxyethyl] phosphine (TCEP), 10 ⁇ M ZnCl 2 , 200 mM NaCl) and further treated with sonication for 10 min for complete lysis.
- lysis buffer 50 mM Tris-HCl, 2 mM Tris[2-carboxyethyl] phosphine (TCEP), 10 ⁇ M ZnCl 2 , 200 mM NaCl
- the protein was purified over a Ni-NTA column (Amersham) and fractions containing pure protein were pooled, concentrated and run over a sizing column (Sephadex S200 26/60 global). The peak containing soluble protein was collected and run on an Ion-exchange column (MonoQ). Gradient elution (200 mM - 500 mM NaCl) yielded pure protein. This protein was concentrated and dialyzed against dialysis buffer (20 mM Tris-HCl, 2 mM TCEP) overnight. The protein was aliquoted and frozen at -80°C until further use.
- the assay employs mass spectrometry to monitor the conversion of Acetylated Peptide Substrate to Deacetylated Peptide Product by SIRT1.
- a schematic of the assay is shown in Figure 1 .
- Substrate Working Solution (1 ⁇ M SIRT I Acetylated Peptide Substrate, 240 ⁇ M NAD + , 50 mM Tris HCl pH 8.0, 137 mM NaCl, 2.7 mM KCI, 1 mM MgCl 2 , 5 mM DTT, and 0.05% BSA was added to all wells of the 96-well assay plate.
- the final conditions of the assay were SIRT1 (40, 20, 10, 5, 2.5, 1.25, 0.63 or 0.031 nM), 0.5 ⁇ M SIRT1 Acetylated Peptide Substrate, 120 ⁇ M NAD + , 50 mM Tris HCl pH 8.0, 137 mM NaCl, 2.7 mM KCI, 1 mM MgCl 2 , 5 mM DTT, 0.05% BSA and 25 °C.
- SIRT1 ability of SIRT1 to convert Acetylated Peptide Substrate into Deacetylated Peptide Product was evaluated at 8 different concentrations of SIRT1, in the presence of vehicle (DMSO), at multiple time points. The rate of product formation versus time was plotted for each concentration of SIRT1 enzyme tested. The rate in the linear part of the curve was determined.
- Figure 2 shows the initial velocity determined at each SIRT1 concentration tested.
- SIRT1 deacetylation activity is dependent on both enzyme concentration and incubation time. Concentrations of enzyme between 5-20 nM result in product formation well above background. Based on these results, 10 nM SIRT1 was selected as the standard condition for the assay.
- the linear rate was determined at twelve concentrations of Acetylated Peptide Substrate (50, 25, 12.5, 6.25, 3.12, 1.56, 0.78, 0.39, 0.19, 0.098, 0.049, and 0.024 ⁇ M) in the presence of vehicle (1% DMSO).
- a schematic of the assay is shown in Figure 3 .
- Wells A2, A3, A4, A5, A6, A7, A8, A9, A10, A11 and A12 of a Costar 2 mL 96 well Assay Block were filled with 600 ⁇ L of Substrate Dilution Working Solution (SDWS; 4 mM NAD + , 50 mM Tris HCl pH 8.0, 137 mM NaCl, 2.7 mM KCI, I mM MgCl 2 , 5 mM DTT, and 0.05% BSA).
- SDWS Substrate Dilution Working Solution
- Acetylated Peptide Substrate Top Dose Working Solution (APSTD-WS; 100 ⁇ M SIRT1 Acetylated Peptide Substrate, 4 mM NAD + , 50 mM Tris HCl pH 8.0, 137 mM NaCl, 2.7 mM KCI, 1 mM MgCl 2 , 5 mM DTT, and 0.05% BSA) was added to well A1 of the Costar 2 mL 96 well Assay Block.
- the APSTD-WS was serially diluted into SDWS by transferring 600 ⁇ L of APSTD-WS from well A1 to Well B1 of the Costar 2 mL 96 well Assay Block. The solution was mixed 5 times and the process was continued by moving across row A, until well A12 was reached.
- the Enzyme Working Solution (20 nM SIRT1, 50 mM Tris HCl pH 8.0, 137 mM NaCl, 2.7 mM KCl, 1 mM MgCl 2 ), 5 mM DTT, 0.05% BSA) was prepared. 50 ⁇ L of serial diluted APSTD-WS was transferred from the entire row A of the Costar 2 mL 96 well Assay Block to each row of the 96-well assay plate using a 12 channel pipette (e.g. from row A of the 2mL Assay block, to row A, B, C, D, E, F, G, H of the 96-well assay plate). To initiate the reaction, 50 ⁇ L of Enzyme Working Solution was added to each well of the 96-well assay plate using the Multidrop.
- a 12 channel pipette e.g. from row A of the 2mL Assay block, to row A, B, C, D, E, F, G, H of the 96-well
- the final conditions of the assay were 10 nM SIRT1, 50, 25, 12.5, 6.25, 3.12, 1.56, 0.78, 0.39, 0.19, 0.098, 0.049, or 0.024 ⁇ M SIRT I Acetylated Peptide Substrate, 2 mM NAD + , 50 mM Tris HCl pH 8.0, 137 mM NaCl, 2.7 mM KCI, 1 mM MgCl 2 , 5 mM DTT, 0.05% BSA and 25 °C.
- the Km of SIRT1 for the Acetylated Peptide Substrate was determined in the presence of vehicle (1% DMSO).
- SIRT1 enzyme activity at 12 concentrations of SIRT1 Acetylated Peptide Substrate was monitored by comparing the percent conversion of Acetylated Peptide Substrate to Deacetylated Peptide Product over time.
- the reaction rate at each substrate concentration was determined as the slope of the product formation versus time plot in the linear range. The rates obtained were then plotted against the substrate concentration to generate a plot for determination of the Km.
- the Km of SIRT1 for Acetylated Peptide Substrate was determined in 2 replicate plates to be 11.2 ⁇ M and 11.9 ⁇ M resulting in a mean Km of 11.6 ⁇ M.
- the standard assay conditions were established at sub-Km concentrations (0.5 ⁇ M Acetylated Peptide Substrate) of peptide substrate in order to maximize the effect of Km-type activators.
- the linear rate was determined at 8 concentrations of NAD + (2000, 1000, 500, 250, 125, 62.5, 31.25 and 15.6 ⁇ M) in vehicle (1% DMSO).
- a schematic of the assay design is shown in Figure 5 .
- NAD + was serially diluted in a Costar 2 mL 96 well Assay Block by first filling wells B1, C1, D1, E1, F1, G1, H1 with 600 ⁇ L of Substrate Dilution Working Solution (SDWS; 100 ⁇ M Acetylated Peptide Substrate, 50 mM Tris HCl pH 8.0, 137 mM NaCl, 2.7 mM KCI, 1 mM MgCl 2 , 5 mM DTT, and 0.05% BSA).
- SDWS Substrate Dilution Working Solution
- NADTD-WS Top Dose Working Solution
- 4 mM NAD + 50 mM Tris HCl pH 8.0, 137 mM NaCl, 2.7 mM KCl, I mM MgCl 2 , 5 mM DTT, and 0.05% BSA
- the NADTD-WS was serially diluted into SDWS by transferring 600 ⁇ L of NADTD-WS from well A1 to well B1 of the Costar 2 mL 96 well Assay Block.
- the solutions were mixed 5 times and the process was repeated until well H1 was reached.
- the Enzyme Working Solution (20 nM SIRT1, 50 mM Tris HCl pH 8.0, 137 mM NaCl, 2.7 mM KCl, 1 mM MgCl 2 , 5 mM DTT, and 0.05% BSA) was prepared.
- the serial diluted NADTD-WS (50 ⁇ L) was transferred to every column of the 96-well assay plate from the entire column 1 of the Costar 2 mL 96 well Assay Block using an 8 Channel Pipette (e.g. from column 1 of the 2 mL Assay block, to columns 1-12 off the 96-well assay plate).
- 50 ⁇ L of Enzyme Working Solution was added to each well of the 96-well assay plate using the Multidrop.
- the reaction was stopped with 10% formic acid and the conversion of substrate to product was determined by mass spectrometry.
- the activity at each concentration of NAD + was monitored by comparing the percent conversion of Acetylated Peptide Substrate to Deacetylated Peptide Product over time.
- the final conditions of the assay were 10 nM S1RT1, 2000, 1000, 500, 250, 125, 62.5, 31.25 or 15.6 ⁇ M NAD + , 50 ⁇ M SIRT1 Acetylated Peptide Substrate, 50 mM Tris HCl pH 8.0, 137 mM NaCl, 2.7 mM KCI, I mM MgCl 2 , 5 mM DTT, 0.05% BSA and 25 °C.
- the Km of SIRT1 for NAD + was determined in the presence of vehicle (1 % DMSO).
- SIRT1 enzyme activity at 8 concentrations of NAD + was monitored by comparing the percent conversion of Acetylated Peptide Substrate to Deacetylated Peptide Product over time.
- the reaction rate at each NAD + concentration was determined as the slope of the product formation versus time plot in the linear range. The rates obtained were then plotted against the NAD + concentration to generate a plot for determination of the Km.
- the Km of SIRT1 for NAD + was determined to be 220 ⁇ M ( Figure 6 ).
- the standard assay conditions were established at sub-Km concentrations (120 ⁇ M NAD + ) of peptide substrate in order to maximize the effect of Km-type activators.
- This DMSO titration was prepared by making a 2000 ⁇ L solution of 40% DMSO in 50 mM Tris HCl pH 8.0, 137 mM, NaCl, 2.7 mM, KCl, 1 mM MgCl 2 , 5 mM DTT, and 0.05% BSA in well A1 of a Costar 2 mL 96 well Assay Block.
- Dilution Working Solution 1000 ⁇ L; 50 mM Tris HCl pH 8.0, 137 mM, NaCl, 2.7 mM, KCI, 1 mM MgCl 2 , 5 mM DTT, and 0.05% BSA
- 1000 ⁇ L of the 40% DMSO in buffer solution was transferred from A1 to A2 and the solution was mixed 5 times. This process was repeated with wells in column I until well H1 was reached.
- Enzyme Working Solution (40 nM SIRT1, 50 mM Tris HCl pH 8.0, 137 mM, NaCl, 2.7 mM, KCI, 1 mM MgCl 2 , 5 mM DTT, and 0.05% BSA) was prepared and added to each well of the 96-well round bottom assay plate.
- Substrate Working Solution 2 ⁇ M SIRT1 Acetylated Peptide Substrate, 480 ⁇ M NAD, 50 mM Tris HCl pH 8.0, 137 mM NaCl, 2.7 mM KCl, 1 mM MgCl 2 , 5 mM DTT, and 0.05% BSA was added to all wells of the 96-well assay plate.
- the reaction was stopped with 10% formic acid and the conversion of substrate to product was determined by mass spectrometry.
- the activity of SIRT1 at each concentration of DMSO was monitored by comparing the percent conversion of Acetylated Peptide Substrate to Deacetylated Peptide Product over time.
- the final conditions of the assay were 10 nM SIRT1, 0.5 ⁇ M SIRT1 Acetylated Peptide Substrate, 120 ⁇ M NAD, 50 mM Tris HCl pH 8.0, 137 mM NaCl, 2.7 mM KCl, 1 mM MgCl 2 , 5 mM DTT, 0.05% BSA, and DMSO (20%, 10%, 5%, 2.5%, 1.25%, 0.63% or 0.031 %, 0.156%)
- Product formation versus time was plotted for each concentration of DMSO tested. The rate was determined by taking the slope from the linear part of the time course. The rate was plotted versus the DMSO concentration in a bar graph for comparison of the different treatments.
- the purpose of this example was to address the mechanism by which the small molecule, resveratrol, activates SIRT1 enzyme activity.
- the effect of resveratrol on the Km of human SIRT1 enzyme for Acetylated Peptide Substrate was examined using the SIRT1 Mass Spectrometry Assay described in the previous examples.
- the experimental design is diagrammed in Figure 9 .
- the Km of SIRT1 enzyme for peptide substrate was determined at five concentrations of resveratrol (100, 33, 11, 3.7, 1.2 ⁇ M) and also in the presence of DMSO vehicle alone.
- the linear rate was determined at 12 concentrations of Acetylated Peptide Substrate (50, 25, 12.5, 6.25, 3.12, 1.56, 0.78, 0.39, 0.19, 0.098, 0.049, and 0.024 ⁇ M) for each of the resveratrol concentrations and for the vehicle control.
- SIRT1 enzyme, NAD + , and 0-50 ⁇ M Acetylated Peptide Substrate are incubated with 0-100 ⁇ M resveratrol at 25 °C. At 0, 3, 6, 9, 12, 15, 20, and 25 minutes, the reaction was stopped with 10% formic acid and the conversion of substrates to products determined by mass spectrometry.
- Resveratrol was weighed and placed in a brown vial. The material was dissolved in 100% vehicle (DMSO) to yield a final concentration of 10 mM (stock solution). The stock solution was serially diluted with 100% DMSO in a deep well 96-well plate.
- DMSO 100% vehicle
- the Km of SIRT1 for the Acetylated Peptide Substrate was determined at 5 different concentrations of resveratrol and in the presence of vehicle alone. To determine the Km, the rate of conversion of substrate to product was determined at multiple time points in the linear range of the assay.
- the purpose of this example is to describe the effect of SIRT1 small molecule activators on the Km of SIRT1 for the Acetylated Peptide Substrate by mass spectrometry.
- the mechanism of activation appears to be due at least in part to a lowering of the Km for the peptide substrate. Assessing the magnitude of the Km effect provides a means for tracking the potency of compounds with a single value instead using both the EC 50 and fold activation values.
- the Km 50 which is determined as described in this example is defined as the concentration of compound required to lower the Km for the Acetylated Peptide Substrate by 50%. Based on the previous example, the Km 50 for resveratrol is > 100 uM.
- the mass spectrometry assay is conducted as follows: 0.5 ⁇ M peptide substrate (SEQ ID NO: 34) and 120 ⁇ M ⁇ NAD + is incubated with 10 nM SIRT1 for 25 minutes at 25°C in a reaction buffer (50 mM Tris-acetate pH 8, 137 mM NaCl, 2.7 mM KCI, 1 mM MgCl 2 , 5 mM DTT, 0.05% BSA). Test compounds may be added to the reaction as described above.
- the SirT1 gene is cloned into a T7-promoter containing vector and transformed into BL21(DE3). After the 25 minute incubation with SIRT1, 10 ⁇ L of 10% formic acid is added to stop the reaction. Reactions are sealed and frozen for later mass spec analysis. Determination of the mass of the substrate peptide allows for precise determination of the degree of acetylation (i.e. starting material) as compared to deacetylated peptide (product).
- a control for inhibition of sirtuin activity is conducted by adding I ⁇ L of 500 mM nicotinamide as a negative control at the start of the reaction (e.g., permits determination of maximum sirtuin inhibition).
- a control for activation of sirtuin activity is conducted using 10 nM of sirtuin protein, with 1 ⁇ L of DMSO in place of compound, to determinine the amount of deacteylation of the substrate at a given timepoint within the linear range of the assay. This timepoint is the same as that used for test compounds and, within the linear range, the endpoint represents a change in velocity.
- Sirtuin modulating compounds that activated SIRT1 were identified using the assay described above and are shown below in Table 5.
- NA means the compound was not active and NT means that the compound was not tested using the indicated assay.
- Fold activation, as determined by mass spectrometry (MS) is represented by A (Fold activation >250%), B (Fold Activation ⁇ 250%), or C (no fold activation).
- the ED 50 of resveratrol for activation of SIRT1 is 16 ⁇ M and the fold activation of resveratrol for SIRT1 in the MS assay is approximately 200%. Table 5. ED 50 and fold activation values for indicated compounds. COMPOUND NO STRUCTURE ED 50 MS ASSAY FOLD ACTIVATION MS 19 D C 20 D C 21 D C 22 D C 24 D C 27 D C 29 D C 31 D C 32 D C 33 D C 34 D C 35 D C 36 D C 37 D C 38 D C 39 D C 40 D C 41 D C 42 A B 43 A B 45 D C 46 D C 48 D C 49 A B 50 D 51 A B 52 A B 53 D C 54 D NT 55 A B 56 A B 57 A NT 60 A NT 63 A NT 64 A NT 66 A NT 67 A NT 68 A NT 69 A B 70 A B 71 A B 74 D C 75 A B 76 A B 77 A B 79 D C 80 A B 81 A B 82 C NT
- EXAMPLE 8 ATP Cell-Based Assay
- This example describes the effect of the SIRT1 activator, resveratrol on cellular ATP levels in NCI-H358 cells.
- Cellular ATP levels are an indirect measurement of cellular metabolic rates and, by extension, mitochondrial function.
- SIRT1 activation has been linked to increased mitochondrial biogenesis in vivo, this study is designed to determine if resveratrol increases mitochondrial function, using cellular ATP levels as the readout.
- the ATP assay is combined with a cellular viability assay so that cellular ATP levels can be normalized to viable cells.
- Cellular ATP levels were measured using the ATPLite 1 Step Kit (PerkinElmer) and cellular viability was measured using the cell permeable dye, AlamarBlue TM .
- the Cellular ATP Assay is a multiplexed assay that measures both ATP levels and viability of a given cell sample. This assay is run in a 96-well Assay Plate and data are reported as the [ATP]/viability for each well in the Assay Plate.
- the ATPLite 1 Step TM Kit is a single-step luminescent cell-based assay for detection of ATP.
- the kit contains lyophilized substrate mixture, comprised of D-luciferin and the firefly ( Photinus pyralis ) enzyme luciferase. Additionally, the kit contains a detergent-based reconstitution buffer that induces the lysis of cellular membranes.
- the luciferase in the assay mixture catalyzes a reaction between the free cellular ATP and D-luciferin to produce bioluminescence according to the schematic reaction outlined below. The amount of light produced is proportional to the cellular ATP concentration.
- the AlamarBlueTM Assay is a single-step assay that utilizes a soluble, non-toxic, cell permeable dye that is added to cell growth media. This dye undergoes electron reduction in viable cells but not dead cells. The reduced dye product gives a fluorescent signal which can be monitored with a fluorescence plate reader (excitation 545 nm and emission 575 nm). The amount of fluorescence generated in a given well is proportional to the number of viable cells. The viability signal generated by this assay is used to normalize the ATP signal from the ATPLite I StepTM assay results.
- resveratrol was weighed and placed in a brown vial. The material was dissolved in 100% vehicle (DMSO) to yield a final concentration of 10 mM (stock solution). The stock solution was serially diluted with 100% DMSO as described in SOP 7.10. The final concentrations of Resveratrol in the compound plate were 0.008, 0.023, 0.069, 0.206, 0.617, 1.852, 5.556, 16.667, 50 and 150 ⁇ M.
- NCI-H358 cells obtained from the American Tissue Culture Collection, ATCC
- the NCI-H358 Growth Culture Media consists of RPM1 1640 Media supplemented with 10% FBS, 100 mg/mL streptomycin, and 100 units/mL penicillin.
- This wash was removed, and 200 ⁇ l of I x ATPLite 1 Step reagent was added to each well. Luminescence was then measured using a plate reader. The ATP signal for each well, measured by the luminescence scan, was normalized to its coresponding cell viability value, measured by the fluorescence scan, to generate the average ATP level per viable cell unit (ATP/vCell). The ATP/vCell for each treatment was then normalized to the average vehicle ATP/vCell for its respective cell microplate, yielding the normalized ATP/vCell (norm. ATP/vCell). Finally, the norm. ATP/vCell for each unique treatment was averaged across plate replicates, generating the average norm. ATP/vCell.
- resveratrol that increase cellular ATP levels have normalized ATP/vCell values greater than 1.0.
- ATP levels of cells treated with 10 concentrations of resveratrol or vehicle alone were measured. Each of these ATP levels was normalized to the cell viability in the corresponding treatment well, generating the ATP/vCell value. Each ATP/vCell value was subsequently normalized to its average Vehicle ATP/vCell values for its respective cell microplate.
- Figure 12 shows the best-fit, sigmoidal dose-response curve for the 10 concentrations of resveratrol plotted against their corresponding normalized ATP/vCell values. These values represent an average of three plate replicates, resveratrol increases cellular ATP levels in NCI-H358 cells in a dose-dependent manner. The maximum increase in cellular ATP levels was 3.0 fold and occurred with treatment of 50 ⁇ M resveratrol. The EC 50 ATP for resveratrol was determined to be 29 ⁇ M.
- a number of compounds were screened for their affect on ATP levels in the assay as described in Example 8. Results are shown in Table 6.
- NA means that the compound was not tested using the indicated assay.
- ED 50 values for IC 50 values for sirtuin activating and inhibiting compounds respectively.
- Figure 13 shows the results of a western blot experiment to determine the levels of SIRT 1 expression levels in a variety of cell lines. Equal amounts of cell lysates were analyzed by western analysis for expression of endogenous SIRT1. Blots were probed with a primary rabbit polyclonal antibody to SIRT1 (Abcam, Cat. # AB 13749) and a secondary goat anti-rabbit IgG conjugated to HRP (Santa Cruz, Cat.# SC-2054). As can be seen, SIRT1 expression varies widely across different cell lines with maximum expression observed in HEK293 and minimal expression observed in IMR90 and H358 cells.
- Figure 14 shows the results of a western blot experiment to determine expression levels of SIRT1 protein normalized to the expression level of tubulin in a variety of cell lines.
- SIRT1 expression was normalized to alpha tubulin expression. All samples were assayed in duplicate.
- Protein quantification was preformed using infrared dye labeled secondary antibodies followed by blot scan using the Licor ® Odyssey ® scanner.
- the primary antibodies used are mouse monoclonal to alpha tubulin, (Santa Cruz Biotech, Cat # SC-8035) and rabbit polyclonal to SIRT I (Abcam, Cat. # AB 13749).
- IRDye 800 conjugated Anti-Rabbit IgG (Goat) (Rockland Immunochemicals, Cat.# 611-132-122) and for tubulin expression was AlexaFluor 680 goat anti-mouse IgG (InVitrogen Cat. # A21057).
- the cell lines were also tested in the cellular ATP assays described above to identify cell lines that had relatively lower levels of mitochondria and/or oxidative phosphorylation such that an increase in ATP levels upon exposure to a sirtuin activating compound would be observable.
- Cell lines NCl-H358 and MCF7 were identified as suitable cell lines for conducting the cellular ATP assays described above. Both cell lines had relatively low endogenous levels of SIRT1 expression and permitted observation of an increase in ATP levels upon exposure to a sirtuin activating compound.
- Figure 15 shows the results of a western blot experiment to determine the levels of several mitochondrial mass biomarkers after exposure of cells to various concentrations of resveratrol.
- NCI-H538 cells were treated for 48 hours with either 0, 1, 10 or 100 uM resveratrol.
- Cell lysates were then prepared and specific mitochondrial proteins were quantitated by western analysis using antibodies specific to the following proteins: Succinate-Ubiquinol Oxidoreductase (Mitochondrial Complex II Protein, mouse monoclonal, InVitrogen, Cat.
- ATP synthase F1 F0 Mitochondrial Complex V Protein, mouse monoclonal, InVitrogen, Cat.# A21350
- NADH-Ubiquinol Oxidoreductase Mitochondrial Complex I Protein, mouse monoclonal, InVitrogen, Cat. #A21344
- Normalization was to alpha tubulin using a rabbit polyclonal (Santa Cruz Biotech, Cat # SC-9104).
- the reaction utilizes endogenous Sirt1 enzyme from cell or tissue extracts. This allows for the determination of endogenous sirtuin activity.
- the cells or tissues can be pretreated with Sirt1 modulators or other control compounds either following isolation or following pharmacological intervention in vivo.
- this measurement of endogenous sirtuin activity can be measured in various clinical samples following physiological manipulation (diet, exercise, age, disease progression, etc.) or following pharmacological intervention including studies designed to study dose responsiveness and escalation, vehicle or placebo control, dosing regimen, drug combination and synergy, etc.
- WBC white blood cells
- Peripheral Blood Mononuclear Cells viable (living) white blood cells (also called “Peripheral Blood Mononuclear Cells”) from whole blood. This procedure is based on approximately 6 ml of whole blood (Vacutainer format). This is the content of a standard tube (Becton Dickinson VacutainerTM CPTTM Cell Preparation Tubes with Sodium Heparin, cat.# 362753). Mix the blood before centrifugation by 10 times gently inverting the tube up and down. Centrifuge the CPT-tubes 20 minutes at 1700 RCF (3100 RPM) at room temperature (18-25°C) with the brake off. Open the CPT tube and remove the plasma (4 ml) without disturbing the cell phase. Store the plasma if necessary.
- WBC white blood cells
- the cells must remain on wet ice for the remainder of the process and should be frozen as soon as possible.
- Six mililiters of blood gives around 10 million WBC, containing around 4 ⁇ g total RNA, 40 ⁇ g total cell proteins and 0.15 ng SIRT1 protein.
- the WBC are thawed and collected in a single 15mL falcon tube at 4 degrees Celsius.
- the assay buffer consists of 10x reaction buffer, 5mM DTT and 0.05% BSA.
- the reaction buffer is prepared as a 10x stock and consists of 500 mM Tris HCl pH 8.0, 1370 mM NaCl, 27 mM KCI, and 10 mM MgCl 2 .
- the buffer is stored at room temperature. Prior to use the final assay buffer is chilled at 4 degrees Celsius. 700 ⁇ L of assay buffer is added to the collected WBC and gently mixed.
- Cells are sonicated on ice for 2 minutes with intervals (15 seconds sonication, 30 seconds pause) at a power output level of 1.5 with a small sonicator probe (Virsonic sonicator).
- the sonicated cells are centrifuged for 5 minutes at 3000 rpm and the supernatant (referred to as "lysate”) is removed for further use in the activity assay.
- lysates can be prepared from tissue, such as liver, fat or muscle.
- tissue such as liver, fat or muscle.
- two to six pieces of one liver (approx, 500mg) or two pieces of muscle (approx, 180mg) corresponding to ⁇ 0.26nM of SIRT1 in 20 ⁇ L of final lysate are used for a standard experiment to measure the activity of SIRT1 with five time points in triplicate for two given sets of experiment.
- the amount of SIRT1 in each preparation is again determined initially by Western-Blot analysis using different amounts of mouse liver lysates or muscle lysates with a given SIRT1 standard (purified SIRT1, bacterially expressed). 700 ⁇ L of assay buffer are added to the collected tissues and gently mixed.
- tissue homogenized on ice using a Polytron for 20 seconds at maximum speed. (Omni International GLH). The homogenized tissues are centrifuged for 5 minutes at 13,000 rpm and the supernatant (referred to as "lysate”) is removed for further use in the activity assay.
- lysates can also be prepared from cell lines, such as those derived from liver, muscle, fat etc.
- myoblast C2C12 cell line Myoblast cells are grown to 80% confluence and harvested with TrypLE (Invitrogen), then washed twice with PBS buffer (Invitrogen) and stored at -80 degree Celsius prior to use.
- a C2C12 myoblast cell pellet ⁇ 100 to 200mg corresponding to ⁇ 0.26nM of SIRT1 in 20 ⁇ L of final lysate is used for a standard experiment to measure the activity of SIRT1 with five time points in triplicate for two given sets of experiment.
- the amount of SIRT1 in each preparation is determined initially by Western-Blot analysis using different amounts of cells with a given SIRT1 standard (purified SIRTI, bacterially expressed). 700 ⁇ L of assay buffer are added to the collected myoblast cells and gently mixed. Then these cells are sonicated on ice for 2 minutes with intervals (15 seconds sonication, 30 seconds pause) at a power output level of 1.5 with a small sonicator probe (Virsonic sonicator). The sonicated cells are centrifuged for 5 minutes at 3000 rpm and the supernatant (referred as "lysate”) is removed for further use in the activity assay. 20uL of lysate are taken typically for one well of a 96 well plate with a final total reaction volume of 100uL.
- 20uL of lysate are taken typically for one well of a 96 well plate with a final total reaction volume of 100uL.
- 1 ⁇ L of DMSO is added to each of the wells to give a final concentration of 1%.
- 29uL of assay buffer are added to an initial volume of 50uL.
- Stop buffer (10% trichloroacetic acid and 500mM Nicotinamide) is added to the wells designated to zero time points.
- the activity assay is started by adding 50uL of substrate buffer to each well.
- the substrate buffer consists of 20 ⁇ M Tamra peptide Ac-Glu-Glu-Lys(Biotin)-Gly-Gln-Ser-Thr-Ser-Ser-His-Ser-Lys(Ac)-Nle-Ser-Thr-Glu-Gly-Lys(5TMR)-Glu-Glu-NH2 (SEQ ID NO: 34) wherein K(Ac) is an acetylated lysine residue and Nle is a norleucine.
- the peptide is labeled with the fluorophore 5TMR (excitation 540 nm/emission 580 nm) at the C-terminus for use in the FP assay described above.
- the peptide substrate is prepared as a 1 mM stock in distilled water and stored in aliquots at -20°C), 5mM DTT, 0.05% BSA, 4mM NAD + and 10x reaction buffer. The reaction is performed at room termperature. For each time point the reaction will be stopped with stop buffer. After the final time point is collected the plates are sealed and analyzed by mass spectrometry.
- 6-chloro-2,3,4,9-tetrahydro-1-H-carbazole-1-carboxamide 5 ⁇ M
- TSA 1 ⁇ M
- nicotinamide 5mM
- 6-chloro-2,3,4,9-tetrahydro-1-H-carbazole-1-carboxamide and TSA are prepared in DMSO. Nicotinamide preparations are made in water. The final concentration of DMSO in each well is 1%. 1 ⁇ L of DMSO is added to wells containing Nicotinamide as inhibitor. The reactions are run in duplicate over a time period of 90 to 120 minutes with at least 5 time points taken.
- Assay plates are transferred to BioTrove, Inc. (Woburn, MA) on dry ice for mass spectrometry analysis. Thawed reactions are analyzed using an Agilent 1100 HPLC with a microplate autosampler linked in series with a Sciex API-4000 mass spectrometer. Proprietary equipment (developed by BioTrove, Inc.) has been incorporated into this LC-MS system to allow for rapid sampling and rapid sample clean-up (4-5 sec per well). Both substrate and product are tracked in the MS and the area of the MS curve for both product and substrate are reported back in arbitrary units.
- Figures 16A and 16B show the results of sirtuin activity in cell lysates as determined using mass spectrometry.
- Figure 16A shows sirtuin activity in lysates of C2C12 cells that were pretreated as indicated and
- Figure 16B shows sirtuin activity in lysates of human peripheral white blood cells that were pretreated as indicated.
- Any polynucleotide and polypeptide sequences which reference an accession number correlate to an entry in a public database, such as those maintained by The Institute for Genomic Research (TIGR) (www.tigr.org) and/or the National Center for Biotechnology Information (NCBI) (www.ncbi.nlm.nih.gov).
- TIGR The Institute for Genomic Research
- NCBI National Center for Biotechnology Information
Landscapes
- Life Sciences & Earth Sciences (AREA)
- Health & Medical Sciences (AREA)
- Engineering & Computer Science (AREA)
- Molecular Biology (AREA)
- Physics & Mathematics (AREA)
- Chemical & Material Sciences (AREA)
- Bioinformatics & Cheminformatics (AREA)
- Immunology (AREA)
- Bioinformatics & Computational Biology (AREA)
- Biophysics (AREA)
- Proteomics, Peptides & Aminoacids (AREA)
- Biomedical Technology (AREA)
- Hematology (AREA)
- Urology & Nephrology (AREA)
- Organic Chemistry (AREA)
- Biotechnology (AREA)
- General Health & Medical Sciences (AREA)
- Analytical Chemistry (AREA)
- Microbiology (AREA)
- Biochemistry (AREA)
- Spectroscopy & Molecular Physics (AREA)
- Wood Science & Technology (AREA)
- Food Science & Technology (AREA)
- Cell Biology (AREA)
- General Physics & Mathematics (AREA)
- Pathology (AREA)
- Zoology (AREA)
- Medicinal Chemistry (AREA)
- Optics & Photonics (AREA)
- General Engineering & Computer Science (AREA)
- Genetics & Genomics (AREA)
- Measuring Or Testing Involving Enzymes Or Micro-Organisms (AREA)
- Other Investigation Or Analysis Of Materials By Electrical Means (AREA)
- Peptides Or Proteins (AREA)
- Enzymes And Modification Thereof (AREA)
Abstract
Description
- Acetylation and deacetylation of histone proteins, transcription factors, and related proteins play a major role in the control of cellular processes. In particular, the acetylation state of histones controls how tightly the histone proteins interact with DNA, and therefore how accessible the DNA is to transcription factors. Enzymes that add acetyl groups to histones or other proteins are called histone acetyltransferases (HATs). Enzymes that remove the acetyl groups fall into two families: the histone deacetylases (HDACs) and the Sir2 family of deacetylases. Currently there are eleven known members of the mammalian HDAC family (Gray and Ekstrom, Exper. Cell Res. 2001, 262, 75-83; Zhou, et al. Proc. Natl. Acad. Sci. USA 2001, 98, 10572-10577; Kao et al. J. Biol. Chem. 2002, 277, 187-193; Gao et al. J. Biol. Chem. 2002, 277, 25748-25755) and seven members of the Sir2 family (Gray and Ekstrom, Exper. Cell Res. 2001, 262, 75-83).
- Histone acetyltransferases catalyze the transfer of an acetyl group from acetyl-CoA to the ε-amino group of a lysine residue on the target protein. Many HAT enzymes have been characterized from eukaryotic organisms (Sterner and Berger, Microbiol. Mol. Biol. Rev. 2000, 64, 435-459). HDAC enzymes utilize a zinc ion at the active site of the protein to catalyze the removal of the acetyl group from acetyllysine in the form of acetate. Members of the Sir2 family of enzymes use NAD as a cofactor in the hydrolysis of acetyllysine.
- The acetylation state of histone proteins plays a major role in gene expression and in cell-cycle control, and appears to play a role in certain forms of cancer. In particular, abnormal recruitment of histone deacetylases by corepressor proteins has been shown to promote the development of promyelocytic leukemia. In tumor cell lines, several studies have shown that treatment with HDAC inhibitors can lead to growth inhibition, growth arrest, terminal differentiation, and/or apoptosis. In vivo studies have demonstrated growth inhibition of tumors and a reduction in tumor metastasis as a result of treatment with HDAC inhibitors (Kramer et al. Trends Endocrinol. Metab. 2001, 12, 294-300).
- Effective study of the enzymology and modulation of HATs, HDACs, and Sir2 enzymes depends on the availability of robust assays capable of being performed in a high-throughput manner. Several assay methodologies have been developed for these enzymes, with varying degrees of utility for inhibitor and activator screening.
- Histone acetyltransferase assays are typically radioactivity-based. In these formats, acetyl-CoA radiolabeled on the acetyl group is reacted with a peptide corresponding to a histone amino acid sequence. Transfer of radiolabeled acetate to the peptide is quantified by binding of the peptide to affinity resin (Ait-Si-Ali et al. Nucleic Acids Res. 1998, 26, 3869-3870), phosphocellulose paper (Tanner et al. J. Biol. Chem. 1999, 274, 18157-18160), or scintillation microplates (Wynne Aheme et al. Methods 2002, 26, 245-53) and measurement of the associated radioactivity. In a non-radioactive coupled assay format, the free CoA formed in the acetyltransferase reaction serves as a substrate for α-ketoglutarate dehydrogenase or pyruvate dehydrogenase. Formation of NADH serves as a measure of the rate of acetyltransferase activity (Kim et al. Anal. Biochem. 2000, 280, 308-314).
- The most common deacetylase assay methodology involves labeling lysine groups in histone peptides with radiolabeled acetate. The deacetylase enzyme removes the acetyl group as acetate, which is subsequently isolated by extraction and quantified on the basis of its radioactivity (Inoue and Fujimoto, Biochim. Biophys. Acta 1970, 220, 307-316). In a variant of this approach, a scintillation proximity assay, peptides derivatized with radiolabeled acetyl groups are attached to a bead containing scintillant that emits light upon exposure to radiation. In this assay format, cleavage of the acetyl groups causes a decrease in the light emission from the scintillant (Nare, et al., Anal. Biochem. 1999, 267, 390-396). A non-radioactivity-based assay uses peptides containing an acetyllysine group and a fluorescent tag. Reactivity is measured by high-performance liquid chromatography, using the difference in retention time of the acetylated and non-acetylated peptides to isolate and quantify the reaction products (Hoffmann et al. Nucleic Acids Res. 1999, 27, 2057-8; Hoffinann et al. Bioconjug Chem. 2001, 12, 51-5; Hoffmann et al. Arch Pharm (Weinheim) 2001, 334, 248-52). A commercial assay uses a two-step detection protocol. In the first step, a peptide containing an acetyllysine is reacted with a deacetylase for a given period of time. Following this, the reaction is quenched and the exposed lysine is reacted with a developing agent that produces a fluorophore, and the amount of deacetylated lysine is quantified using the fluorescence of the product (Biomol, Plymouth Meeting, Pa., USA). More recently, a two-step, protease-coupled assay was reported, in which a peptide was designed containing a fluorescence resonance energy transfer (FRET) donor-quencher pair and an acetyllysine. After the deacetylase reaction has been allowed to run, the reaction is quenched and the amount of deacetylated peptide is quantified by reaction of the deacetylated peptide with a protease enzyme that cleaves specifically after lysine residues (Frey et al. Presented at 224th National Meeting of the American Chemical Society, Boston, Mass., August 2002; paper MEDI-121, Marcotte et al., Anal. Biochem.,332: 90 (2004)). ,
- Blander et al. ( Journal of Biological Chemistry March 18, 2005, Vol. 280 , No. 11, pages 9780-9785) describes the use of mass spectrometry in a method for analysing SIRT1 deacetylation products using substrates which comprise at least one acetylated lysine residue (Fmoc-MASTGG-AcK-DSTEMAEEE),The method comprises additional steps of modifying the amine on the peptide substrates and capturing the biotinylated deacetylated peptide substrates. The action of SIRT1 results in deacetylation of the substrates, which means that when the enzyme is active, a 1895.56 peak becomes visible in the mass [m/z] spectra (
figure 2 ). With other words, the activity of SIRT1 can be monitored. At the same time the loss of an acetyl group by the disappearance of the 1959.89 peak can be monitored (figure 2 ). Thus, a decrease in acetylation can be measured which indicates that the protein is a substrate for SIRT1 which transmits the activity of SIRT1. - Features of the above assay formats limit their utility. Assays based on radioactivity tend to be costly, and require special handling precautions. Also, they are often difficult to perform in a high-throughput manner. Accordingly, improved assays for measuring the activity of acetyltransferases or deacetylases are needed.
- Provided herein are methods for identifying compounds that modulate the activity of an deacetylase.
- A method for identifying a compound that activates a sirtuin, comprising:
- contacting a peptide substrate pool with a sirtuin in the presence of a test compound, wherein the concentration of peptide substrate in the peptide substrate pool is below the Km of the sirtuin for the peptide substrate, and wherein the members of said peptide substrate pool comprise at least one acetylated lysine residue, and
- determining the level of acetylation of the peptide substrate pool using mass spectrometry, wherein a decrease in the level of acetylation of the peptide substrate pool in the presence of the test compound as compared to a control reaction in which the test compound is not included is indicative of a compound that activates a sirtuin.
- In certain embodiments, the sirtuin may be, for example, a SIRT1 protein. In certain embodiments, the deacetylase may be a purified protein or provided as part of a mixture, such as a cell or tissue lysate.
- In certain embodiments, the sequence of the peptide substrate may be derived from a histone, an HMG protein, p53, c-Myb, GATA-1, EKLF, MyoD, E2F, dTCF, or HIV Tat, or a fragment thereof.
- In certain embodiments, the mass spectrometry may be electrospray ionization (ESI) mass spectrometry or matrix-assisted laser desorption/ionization (MALDI) mass spectrometry.
- In certain embodiments, a compound that increases the activity of the deacetylase is identified. In such embodiments, a decrease in the level of acetylation in the substrate pool in the presence of the test compound as compared to a control is indicative of a compound that increases the activity of the deacetylase.
- In accordance with the invention, the concentration of peptide substrate in the peptide substrate pool may is below the Km of the sirtuin for the peptide substrate. In certain embodiments, the concentration of peptide substrate in the peptide substrate pool may be at least about 2-fold, 5-fold, 10-fold, 20-fold, 25-fold, or more, below the Km of the deacetylase for the peptide substrate.
- In certain embodiments, a compound that activates a sirtuin to a greater extent than resveratrol may be identified. In certain embodiments, a compound that has sirtuin activating activity at least about, 2-fold, 5-fold, 10-fold, 20-fold, 50-fold, 100-fold, or more, greater than the sirtuin activating activity of resveratrol may be identified.
- In certain embodiments, the compound is a small molecule.
- Further described is a method for identifying a compound that activates a sirtuin may further comprise one or more of the following: (i) preparing a quantity of the compound, or an analog thereof; (ii) conducting therapeutic profiling of the compound, or an analog thereof, for efficacy and toxicity in animals; (iii) formulating the compound, or analog thereof, in a pharmaceutical formulation; (iv) manufacturing a pharmaceutical preparation of a compound, or an analog thereof, having a suitable animal toxicity profile; (v) marketing a pharmaceutical preparation of a compound, or an analog thereof, having a suitable animal toxicity profile to healthcare providers.
- In a further aspect there is provided a method for determining the deacetylase activity of a sirtuin, comprising:
- (a) contacting a peptide substrate pool with a sirtuin, wherein the concentration of peptide substrate in the peptide substrate pool is below the Km of the sirtuin for the peptide substrate, and wherein the members of said substrate pool comprise at least one acetylated lysine residue; and
- (b) determining the level of acetylation of the peptide substrate pool using mass spectrometry, wherein a decrease in the level of acetylation of the peptide substrate pool is indicative of the sirtuin deacetylase activity.
- In certain embodiments, the concentration of peptide substrate in the peptide substrate pool may be below the Km of the deacetylase for the peptide substrate. In certain embodiments, the concentration of peptide substrate in the peptide substrate pool may be at least 10 fold below the Km of the deacetylase for the peptide substrate.
- In certain embodiments, the substrate peptide pool may comprise a single peptide species. In other embodiments, the substrate peptide pool may comprise a mixture of two or more peptides.
- In certain embodiments, the method for identifying a compound that modulates the activity of a sirtuin protein may further comprise assaying the compound for sirtuin modulating activity using an in vitro assay. Such in vitro assays may be conducted, for example, using mass spectrometry and/or fluorescent substrate to determine sirtuin activity. In certain embodiments, the in vitro assay may be carried out before contacting the sample of cells with the putative sirtuin modulating compound. In certain embodiments, the methods may further comprise comparing the results of the in vitro assay to the average ATP level per viable cell.
- In certain embodiments, the sample of cells may comprise NCI-H358 and/or MCF7 cells.
- In certain embodiments, the average ATP level per viable cell may be determined about 36-60 hours, or about 48 hours, after contacting the sample of cells with the putative sirtuin modulating compound.
- In certain embodiments, the sirtuin may be, for example, a SIRT1 protein.
- The practice of the present methods will employ, unless otherwise indicated, conventional techniques of cell biology, cell culture, molecular biology, transgenic biology, microbiology, recombinant DNA, and immunology, which are within the skill of the art. Such techniques are explained fully in the literature. See, for example, Molecular Cloning A Laboratory Manual, 2nd Ed., ed. by Sambrook, Fritsch and Maniatis (Cold Spring Harbor Laboratory Press: 1989); DNA Cloning, Volumes I and II (D. N. Glover ed., 1985); Oligonucleotide Synthesis (M. J. Gait ed., 1984);
Mullis et al. U.S. Patent No: 4,683,195 ; Nucleic Acid Hybridization (B. D. Hames & S. J. Higgins eds. 1984); Transcription And Translation (B. D. Hames & S. J. Higgins eds. 1984); Culture Of Animal Cells (R. 1. Freshney, Alan R. Liss, Inc., 1987); Immobilized Cells And Enzymes (IRL Press, 1986); B. Perbal, A Practical Guide To Molecular Cloning (1984); the treatise, Methods In Enzymology (Academic Press, Inc., N.Y.); Gene Transfer Vectors For Mammalian Cells (J. H. Miller and M. P. Calos eds., 1987, Cold Spring Harbor Laboratory); Methods In Enzymology, Vols. 154 and 155 (Wu et al. eds.), Immunochemical Methods In Cell And Molecular Biology (Mayer and Walker, eds., Academic Press, London, 1987); Handbook Of Experimental Immunology, Volumes I-IV (D. M. Weir and C. C. Blackwell, eds., 1986); Manipulating the Mouse Embryo, (Cold Spring Harbor Laboratory Press, Cold Spring Harbor, N.Y., 1986). -
-
FIGURE 1 shows a schematic outline of a SIRT1 titration mass spectrometry assay. -
FIGURE 2 shows a bar plot of aSIRT 1 enzyme titration time course MS mass spectrometry assay (top panel) and a plot of initial velocity vs. enzyme concentration (bottom panel). -
FIGURE 3 shows a schematic outline of a SIRT1 Km for acetylated peptide substrate assay. -
FIGURE 4 shows a representative plot of a SIRT1 Km for acetylated peptide substrate. -
FIGURE 5 shows a schematic outline of a SIRT1 Km for NAD+ assay. -
FIGURE 6 shows a plot of SIRT1 Km for NAD+. -
FIGURE 7 shows a schematic of a SIRT1 DMSO tolerance mass spectrometry assay. -
FIGURE 8 shows a bar plot of SIRT1 mass spectrometry initial velocity vs. DMSO concentration. -
FIGURE 9 shows a schematic of a Km mass spectrometry assay. -
FIGURE 10 shows the effect of resveratrol on the Km of SIRT1 for the acetylated peptide substrate. The top panel shows a plot of resveratrol concentration (µM) vs. %DMSO Km and the bottom panel shows a bar plot of resveratrol concentration (µM) vs. Km for peptide (µM). -
FIGURE 11 shows a schematic of a cellular ATP assay. -
FIGURE 12 shows a dose-response curve for resveratrol treatment. -
FIGURE 13 shows a western blot to identify cell lines having a relatively low endogenous level of SIRT1 expression. -
FIGURE 14 shows a western blot of SIRT1 versus Tubulin levels in a variety of cell types and a corresponding bar plot showing normalized SIRT1 expression for a variety of cell types. -
FIGURE 15 shows a bar plot of normalized protein signal for three mitochondrial markers after a 48 hour exposure of NCI-H358 cells to several concentrations of resveratrol. Succ-Ubi-Ox is Succinate-Ubiquinol Oxidoreductase; F1F0 ATP Syn. is ATP synthase F1F0; and NADH-UBI is NADH-Ubiquinol Oxidoreductase. -
FIGURE 16A and 16B shows the effect of pretreatment of lysates prepared from C2C12 cells (Figure 16A ) or human peripheral white blood cells (Figure 16B ) with 6-chloro-2,3,4,9-tetrahydro-1-H-carbazole-1-carboxamide (Sirt Inh, 5µM), TSA (1µM) and nicotinamide (NAM, 5mM) on deacetylase activity as described in Example 12. - As used herein, the following terms and phrases shall have the meanings set forth below. Unless defined otherwise, all technical and scientific terms used herein have the same meaning as commonly understood to one of ordinary skill in the art.
- The singular forms "a," "an," and "the" include plural reference unless the context clearly dictates otherwise.
- The terms "comprise" and "comprising" are used in the inclusive, open sense, meaning that additional elements may be included.
- The term "conserved residue" refers to an amino acid that is a member of a group of amino acids having certain common properties. The term "conservative amino acid substitution" refers to the substitution (conceptually or otherwise) of an amino acid from one such group with a different amino acid from the same group. A functional way to define common properties between individual amino acids is to analyze the normalized frequencies of amino acid changes between corresponding proteins of homologous organisms (Schulz, G. E. and R. H. Schirmer., Principles of Protein Structure, Springer-Verlag). According to such analyses, groups of amino acids may be defined where amino acids within a group exchange preferentially with each other, and therefore resemble each other most in their impact on the overall protein structure (Schulz, G. E. and R. H. Schirmer, Principles of Protein Structure, Springer-Verlag). One example of a set of amino acid groups defined in this manner include: (i) a charged group, consisting of Glu and Asp, Lys, Arg and His, (ii) a positively-charged group, consisting of Lys, Arg and His, (iii) a negatively-charged group, consisting of Glu and Asp, (iv) an aromatic group, consisting of Phe, Tyr and Trp, (v) a nitrogen ring group, consisting of His and Trp, (vi) a large aliphatic nonpolar group, consisting of Val, Leu and Ile, (vii) a slightly-polar group, consisting of Met and Cys, (viii) a small-residue group, consisting of Ser, Thr, Asp, Asn, Gly, Ala, Glu, Gln and Pro, (ix) an aliphatic group consisting of Val, Leu, Ile, Met and Cys, and (x) a small hydroxyl group consisting of Ser and Thr.
- The term "including" is used to mean "including but not limited to". "including" and "including but not limited to" are used interchangeably.
- The term "mammal" is known in the art, and exemplary mammals include humans, primates, livestock animals (including bovines, porcines, etc.), companion animals (e.g., canines, felines, etc.) and rodents (e.g., mice and rats).
- The term "modulate", when used in reference to the activity of an deacetylase, refers to the up regulation (e.g., activation or stimulation), down regulation (e.g., inhibition or suppression), or other change in a quality of such acetyltransferase or deacetylase activity.
- The term "percent identical" refers to sequence identity between two amino acid sequences or between two nucleotide sequences. Identity can each be determined by comparing a position in each sequence which may be aligned for purposes of comparison. When an equivalent position in the compared sequences is occupied by the same base or amino acid, then the molecules are identical at that position; when the equivalent site occupied by the same or a similar amino acid residue (e.g., similar in steric and/or electronic nature), then the molecules can be referred to as homologous (similar) at that position. Expression as a percentage of homology, similarity, or identity refers to a function of the number of identical or similar amino acids at positions shared by the compared sequences. Expression as a percentage of homology, similarity, or identity refers to a function of the number of identical or similar amino acids at positions shared by the compared sequences. Various alignment algorithms and/or programs may be used, including FASTA, BLAST, or ENTREZ. FASTA and BLAST are available as a part of the GCG sequence analysis package (University of Wisconsin, Madison, Wis.), and can be used with, e.g., default settings. ENTREZ is available through the National Center for Biotechnology Information, National Library of Medicine, National Institutes of Health, Bethesda, MD. In one embodiment, the percent identity of two sequences can be determined by the GCG program with a gap weight of 1, e.g., each amino acid gap is weighted as if it were a single amino acid or nucleotide mismatch between the two sequences.
- Other techniques for alignment are described in Methods in Enzymology, vol. 266: Computer Methods for Macromolecular Sequence Analysis (1996), ed. Doolittle, Academic Press, Inc., a division of Harcourt Brace & Co., San Diego, California, USA. Preferably, an alignment program that permits gaps in the sequence is utilized to align the sequences. The Smith-Waterman is one type of algorithm that permits gaps in sequence alignments. See Meth. Mol. Biol. 70: 173-187 (1997). Also, the GAP program using the Needleman and Wunsch alignment method can be utilized to align sequences. An alternative search strategy uses MPSRCH software, which runs on a MASPAR computer. MPSRCH uses a Smith-Waterman algorithm to score sequences on a massively parallel computer. This approach improves ability to pick up distantly related matches, and is especially tolerant of small gaps and nucleotide sequence errors. Nucleic acid-encoded amino acid sequences can be used to search both protein and DNA databases.
- The term "pharmaceutically acceptable carrier" is art-recognized and refers to a pharmaceutically-acceptable material, composition or vehicle, such as a liquid or solid filler, diluent, excipient, solvent or encapsulating material, involved in carrying or transporting any subject composition or component thereof. Each carrier must be "acceptable" in the sense of being compatible with the subject composition and its components and not injurious to the patient. Some examples of materials which may serve as pharmaceutically acceptable carriers include: (1) sugars, such as lactose, glucose and sucrose; (2) starches, such as corn starch and potato starch; (3) cellulose, and its derivatives, such as sodium carboxymethyl cellulose, ethyl cellulose and cellulose acetate; (4) powdered tragacanth; (5) malt; (6) gelatin; (7) talc; (8) excipients, such as cocoa butter and suppository waxes; (9) oils, such as peanut oil, cottonseed oil, safflower oil, sesame oil, olive oil, corn oil and soybean oil; (10) glycols, such as propylene glycol; (11) polyols, such as glycerin, sorbitol, mannitol and polyethylene glycol; (12) esters, such as ethyl oleate and ethyl laurate; (13) agar; (14) buffering agents, such as magnesium hydroxide and aluminum hydroxide; (15) alginic acid; (16) pyrogen-free water; (17) isotonic saline; (18) Ringer's solution; (19) ethyl alcohol; (20) phosphate buffer solutions; and (21) other non-toxic compatible substances employed in pharmaceutical formulations.
- The term "substantially homologous" when used in connection with amino acid sequences, refers to sequences which are substantially identical to or similar in sequence with each other, giving rise to a homology of conformation and thus to retention, to a useful degree, of one or more biological (including immunological) activities. The term is not intended to imply a common evolution of the sequences.
- The term "synthetic" is art-recognized and refers to production by in vitro chemical or enzymatic synthesis.
- The term "therapeutic agent" is art-recognized and refers to any chemical moiety that is a biologically, physiologically, or pharmacologically active substance that acts locally or systemically in a subject. The term also means any substance intended for use in the diagnosis, cure, mitigation, treatment or prevention of disease or in the enhancement of desirable physical or mental development and/or conditions in an animal or human.
- The term "therapeutic effect" is art-recognized and refers to a local or systemic effect in animals, particularly mammals, and more particularly humans caused by a pharmacologically active substance. The phrase "therapeutically-effective amount" means that amount of such a substance that produces some desired local or systemic effect at a reasonable benefit/risk ratio applicable to any treatment. The therapeutically effective amount of such substance will vary depending upon the subject and disease condition being treated, the weight and age of the subject, the severity of the disease condition, the manner of administration and the like, which can readily be determined by one of ordinary skill in the art.
- Provided herein are methods for determining the deactylation activity of a sirtuin. The methods may involve, for example, contacting a substrate peptide pool with a sirtuin and determining the aceylation level of the substrate pool using mass spectrometry.
- In accordance with the invention, the deacetylase that is used in accordance with the methods described herein is a sirtuin protein. A sirtuin protein refers to a member of the sirtuin deacetylase protein family, or preferably to the sir2 family, which include yeast Sir2 (GenBank Accession No. P53685), C. elegans Sir-2.1 (GenBank Accession No. NP_501912), and human S1RT1 (GenBank Accession No. NM_012238 and NP_036370 (or AF083106)) and SIRT2 (GenBank Accession No. NM_012237, NM_030593, NP_036369, NP_085096, and AF083107) proteins. Other family members include the four additional yeast Sir2-like genes termed "HST genes" (homologues of Sir two) HST1, HST2, HST3 and HST4, and the five other human homologues hSIRT3, hSIRT4, hSIRT5, hSIRT6 and hSIRT7 (Brachmann et al. (1995) Genes Dev. 9:2888 and Frye et al. (1999) BBRC 260:273). Homologs, e.g., orthologs and paralogs, domains, fragments, variants and derivatives of the foregoing may also be used in accordance with the methods described herein. Class III HDACs form a structurally distant class of NAD dependent enzymes that are related to the yeast SIR2 proteins and are not inhibited by hydroxamic acid-based HDAC inhibitors.
- In accordance with the invention, the methods described herein may be used to determine the activity of a SIRT1 protein. A SIRT1 protein refers to a member of the sir2 family of sirtuin deacetylases. In one embodiment, a SIRT1 protein includes yeast Sir2 (GenBank Accession No. P53685), C. elegans Sir-2.1 (GenBank Accession No. NP_501912), human SIRT1 (GenBank Accession No. NM_012238 or NP_036370 (or AF083106)), and human SIRT2 (GenBank Accession No. NM_012237, NM_030593, NP_036369, NP_085096, or AF083107) proteins, and equivalents and fragments thereof. In another embodiment, a SIRT1 protein includes a polypeptide comprising a sequence consisting of, or consisting essentially of, the amino acid sequence set forth in GenBank Accession Nos. NP_036370, NP_501912, NP_085096, NP_036369, or P53685. SIRT1 proteins include polypeptides comprising all or a portion of the amino acid sequence set forth in GenBank Accession Nos. NP_036370, NP_501912, NP_085096, NP_036369, or P53685; the amino acid sequence set forth in GenBank Accession Nos. NP_036370, NP_501912, NP_085096, NP_036369, or P53685 with 1 to about 2, 3, 5, 7, 10, 15, 20, 30, 50, 75 or more conservative amino acid substitutions; an amino acid sequence that is at least 60%, 70%, 80%, 90%, 95%, 96%, 97%, 98%, or 99% identical to GenBank Accession Nos. NP_036370, NP_501912, NP_085096, NP_036369, or P53685, and functional fragments thereof. SIRT1 proteins also include homologs (e.g., orthologs and paralogs), variants, or fragments, of GenBank Accession Nos. NP_036370, NP_501912, NP_085096, NP_036369, or P53685.
- In one embodiment, the methods described herein may be used to determine the activity of a SIRT3 protein. A SIRT3 protein refers to a member of the sirtuin deacetylase protein family and/or to a homolog of a SIRT1 protein. In one embodiment, a SIRT3 protein includes human SIRT3 (GenBank Accession. No. AAH01042, NP_036371, or NP_001017524) and mouse SIRT3 (GenBank Accession No. NP_071878) proteins, and equivalents and fragments thereof. In another embodiment, a SIRT3 protein includes a polypeptide comprising a sequence consisting of, or consisting essentially of, the amino acid sequence set forth in GenBank Accession Nos. AAH01042, NP_036371, NP_001017524, or NP_071878. SIRT3 proteins include polypeptides comprising all or a portion of the amino acid sequence set forth in GenBank Accession AAH01042, NP_036371, NP_001017524, or NP_071878; the amino acid sequence set forth in GenBank Accession Nos. AAH01042, NP_036371, NP_001017524, or NP_071878 with 1 to about 2, 3, 5, 7, 10, 15, 20, 30, 50, 75 or more conservative amino acid substitutions; an amino acid sequence that is at least 60%, 70%, 80%, 90%, 95%, 96%, 97%, 98%, or 99% identical to GenBank Accession Nos. AAH01042, NP_036371, NP_001017524, or NP_071878, and functional fragments thereof. SIRT3 proteins also include homologs. (e.g., orthologs and paralogs), variants, or fragments, of GenBank Accession Nos. AAH01042, NP_036371, NP_001017524, or NP_071878.
- In another embodiment, a biologically active portion of a sirtuin may be used in accordance with the methods described herein. A biologically active portion of a sirtuin refers to a portion of a sirtuin protein having a biological activity, such as the ability to deacetylate. Biologically active portions of sirtuins may comprise the core domain of a sirtuin. Biologically active portions of SIRT1 having GenBank Accession No. NP_036370 that encompass the NAD+ binding domain and the substrate binding domain, for example, may include without limitation, amino acids 62-293 of GenBank Accession No. NP_ 036370, which are encoded by nucleotides 237 to 932 ofGenBank Accession No. NM_012238. Therefore, this region is sometimes referred to as the core domain. Other biologically active portions of SIRT1, also sometimes referred to as core domains, include about amino acids 261 to 447 of GenBank Accession No. NP_036370, which are encoded by nucleotides 834 to 1394 of GenBank Accession No. NM_012238; about amino acids 242 to 493 of GenBank Accession No. NP_036370, which are encoded by nucleotides 777 to 1532 of GenBank Accession No. NM_012238; or about amino acids 254 to 495 of GenBank Accession. No. NP_036370, which are encoded by nucleotides 813 to 1538 of GenBank Accession No. NM_012238. In another embodiment, a biologically active portion of a sirtuin may be a fragment of a SIRT3 protein that is produced by cleavage with a mitochondrial matrix processing peptidase (MPP) and/or a mitochondrial intermediate peptidase (MIP).
- The deacetylase enzymes that may be used in accordance with the methods described herein may be endogenous proteins, recombinant proteins, purified proteins, or proteins present in a mixture, such as a cell or tissue lysate. In certain embodiments, suitable enzymes for use in accordance with the methods described herein may be purchased commercially or purified using standard procedures. For example, human SIRT1 (Catalog #SE-239), human SIRT2 (Catalog #SE-251) and human SIRT3 (Catalog #SE-270) may be purchased from Biomol International (Plymouth Meeting, PA). Methods for expression and purification of human SIRT1 and human SIRT3 are described, tor example, in
PCT Publication No. WO 2006/094239 . In other embodiments, suitable enzymes for use in accordance with the methods described herein may be provided as part of a mixture, such as, for example, a cell or tissue lysate or fractionated lysate. Suitable lysates include raw lysates including all components of the cell or tissue or lysates from which one or more components have been removed, such as, for example, nucleic acids, insoluble materials, membrane materials, etc. The lysate may be obtained from a variety of sources such as a blood cell sample, tissue sample, cell culture, etc. - A wide variety of peptide substrates may be used in accordance with the methods described herein. When determining the activity of a deacetylase, the peptide substrate utilized in the reaction comprises at least one acetylated lysine residue.
- In certain embodiments, the sequence of the peptide substrate may be obtained, or derived, from a protein that may be deacetylated by a deacetylase. Exemplary substrates for acetyltransferases and deacetylases include, for example, histones (e.g., H1, H2, H2A, H2B, H3 and H4), nonhistone chromatin proteins (e.g., HMG1, HMG2, Yeast Sin1, HMG14, HMG17, and HMG I(Y)), transcriptional activators (e.g., p53, c-Myb, GATA-1, EKLF, MyoD, E2F, dTCF, and HIV Tat), nuclear receptor coactivators (e.g., ACTR, SRC-1, TIF2), general transcription factors (e.g., TFIIE and TFIIF), importin-α7, Rch1, and α-tubulin. Substrate peptides used in accordance with the methods described herein may comprise an entire substrate protein or a portion thereof containing at least one lysine residue. In certain embodiments, it may be desirable to modify the sequence of a substrate protein, or a fragment thereof, to add, remove and/or change the location of one or more lysine residues. For example, it may be desirable to have a substrate peptide that contains one or more lysine residues located only in desired locations within the substrate peptide, e.g., toward the center of the substrate, toward an end of the substrate (e.g., N-terminal or C-terminal end), having multiple lysine residues clustered together, having lysine residues spread across the peptide, etc. In certain embodiments, it may be desirable to have a substrate peptide that contains only a single lysine residue. One or more lysine residues may be removed from a peptide substrate sequence by replacing the amino acid residue with a different amino acid residue or by deleting the amino acid residue from the sequence without substitution of a different amino acid. In certain embodiments, one or more lysine residues may be replaced using a conservative amino acid substitution.
- In exemplary embodiments, the invention provides a method for identifying compounds that activate a sirtuin protein, such as, for example, a SIRT1 protein. In such embodiments, the methods utilize a substrate peptide that is a sirtuin activatable substrate peptide. A sirtuin activatable substrate peptide is a peptide substrate that is suitable for use in a mass spectrometry based assay to identify activators of sirtuin activity. A sirtuin activatable substrate peptide may be identified using a variety of sirtuin assays, including for example, the mass spectrometry assay described herein and the other sirtuin activity assays described herein below. Exemplary sirtuin activatable substrate peptides are provided herein in Tables 1 and 2 below. In certain embodiments, the sequence of a sirtuin activatable substrate peptide is derived from a known sirtuin substrate, such as, for example, an HMG protein, p53, c-Myb, GATA-1, EKLF, MyoD, E2F, dTCF, or HIV Tat, or a fragment thereof, In certain embodiments, a sirtuin activatable substrate peptide may be from about 5-100, about 10-100, about 10-75, about 10-50, about 20-100, about 20-75, about 20-50, about 20-30, or about 20-25 amino acids in length. In certain embodiments, a sirtuin activatable substrate peptide comprises at least one hydrophobic region. In certain embodiments, a hydrophobic region may be located at or near one or both ends of the sirtuin activatable substrate peptide, e.g., the N-terminal and/or C-terminal ends. A hydrophobic region may be naturally occurring in the sequence of the sirtuin activatable substrate peptide, e.g., at least a portion of a sirtuin substrate protein comprising a hydrophobic region may be used as the substrate peptide. In the alternative, or in addition, a hydrophobic region may be added to a sirtuin activatable substrate peptide. For example, a hydrophobic region may be added to a substrate peptide by modifying the sequence of the peptide to increase the number of hydrophobic amino acid residues in a desired region, e.g., by adding 1, 2, 3, 4, 5, 6, 7, 8, 9, 10, or more, hydrophobic amino acid residues to a peptide either by the addition of new amino acid residues or by the replacement of existing non-hydrophobic (or less hydrophobic) amino acid residues with hydrophobic (or more strongly hydrophobic) amino acid residues. In certain embodiments, a hydrophobic region may be region of about 2, 3, 4, 5, 6, 7, 8, 9, 10 or more hydrophobic amino acid residues in a contiguous or substantially contiguous stretch within the peptide. Hydrophobic amino acid residues include alanine, phenylalanine, glycine, isoleucine, leucine, methionine, proline, valine, and tryptophan. In exemplary embodiments, hydrophobic regions comprise one or more tryptophan, alanine and/or phenylalanine amino acid residues. Alternatively, a hydrophobic region may be added to a substrate peptide by chemically modifying the peptide to increase its hydrophobicity. For example, a hydrophobic region may be introduced into a peptide by covalently attaching a hydrophobic chemical moiety to the peptide. Examples of chemical moieties include, for example, fluorophores, such as, AF 350, AF 430, AF 488, AF 532, AF 546, AF 568, AF 594, AF 633, AF 647, AF 660, AF 680, dintrophenyl, AMCA, Cascade Blue, Marina Blue, Fluorescein/FITC, Oregon Green 488, Rhodamine Green, BODIPY FL, BODIPY TMR, BODIPY TR, Oregon Green 514, Rhodamine Red, Tetramethylrhodamine, Texas Red, BODIIPY 630/650, BODTPY 650/665,
QSY 7, FluorX, Cy2 bis, Cy3 mono, Cy3.5 mono, Cy5 mono, Cy5.5 mono, Cy7 mono, DEAC, R6G, TAMRA, and MR 121. Methods for covalently modifying a peptide with a chemical moiety such as a fluorophore are known in the art, and thus, can be conducted according to conventional methods. In exemplary embodiments, the hydrophobic chemical moiety may be covalently linked or conjugated to the peptide so as not to interfere with acetylation or deacetylation of the lysine residue(s). - Substrate peptides that may be used in accordance with the methods described herein can be synthesized according to conventional methods. The substrate peptides may include naturally occurring peptides, peptides prepared by genetic recombination techniques, and synthetic peptides. The peptides may be fused with other peptides (for example, glutathione-S-transferase, HA tag, FLAG tag, etc.) for convenience of purification, etc. Further, the peptide may comprise structural units other than amino acids so long as it serves as a substrate for a deacetylase or acetyl transferase. Typically, the synthesis of a peptide is achieved by adding amino acids, residue by residue, from the carboxyl terminus of the amino acid sequence of interest. Further, some of the peptide fragments synthesized in that way may be linked together to from a larger peptide molecule. For measuring deacetylase activity, the substrate peptide needs to be acetylated before the reaction is conducted. An exemplary method of amino acid acetylation includes acetylation of amino acids, whose α-amino groups and side-chain amino groups are blocked with protecting groups, with acetic anhydride, N-hydroxysuccinimide acetate, or similar reagents. These acetylated amino acids are then used to synthesize peptides comprising acetylated lysine residues, for example, using the solid-phase method. Generally, acetylated peptides can be synthesized using a peptide synthesizer according to the Fmoc method. For example, commercial suppliers, who provide custom peptide synthesis services, can synthesize peptides having specified amino acid sequences comprising residues acetylated at predetermined positions.
- Exemplary peptide substrates for
Sirt 1, Sirt2 and Sirt3 deacetylases that may be used in accordance with the methods described herein are shown below in Tables 1 and 2.Table 1. Sirt1, Sirt2 and Sirt3 peptide substrates having covalently attached chemical moieties. Enzyme/ Basis for Peptide sequence Sequence SEQ ID NO Sirt1/ p53 Ac-EEKGQSTSSHS-K(Ac)-Nle-STEG-K(MR121)-EE-NH2 SEQ ID NO: 1 Sirt1/ p53 Ac-EEKGQSTSSHS-K(Ac)-Nle-STEG-K(5-TMR)-EE-NH2 SEQ ID NO: 2 Sirt1 / PGC 1 alpha TNPAIV-K(Ac)-TENS-K(MR121)-NH2 SEQ ID NO: 3 Sirt1/PGC1alpha TNPAIV-K(Ac)-TENS-K(5-TMR)-NHZ SEQ ID NO: 4 Sirt1/PGC1alpha QHLQA-K(Ac)-PTTLS-K(MR121)-NH2 SEQ ID NO: 5 Sirt1/ PGC1alpha QHLQA-K(Ac)-PTTLS-K(5-TMR)-NH2 SEQ ID NO: 6 Sirt2/ alpha-Tubulin MPSD-K(Ac)-TIGG-K(MR121)-NH2 SEQ ID NO: 7 Sirt2/ alpha-Tubulin MPSD-K(Ac)-TIGG-K(5-TMR)-NH2 SEQ ID NO: 8 Sirt2/ alpha-Tubulin Nle-PSD-K(Ac)-TIGG-K(MR121)-NH2 SEQ ID NO: 9 Sirt2/ alpha-Tubulin Nle-PSD-K(Ac)-TIGG-K(5-TMR)-NH2 SEQ ID NO: 10 Sirt2/ alpha-Tubulin GQ-Nle-PSD-K(Ac)-TIGG-K(MR121),-NH2 SEQ ID NO: 11 Sirt2/ alpha-Tubulin GQ-Nle-PSD-K(Ac)-TIGG-K(5-TMR)-NH2 SEQ ID NO: 12 Sirt3/ Acetyl CoA Synthase 2 SG-K(Ac)-1M-K(MR121)-NH2 SEQ ID NO: 13 Sirt3/ Acetyl CoA Synthase 2 SG-K(Ac)-IM-K(5-TMR)-NH2 SEQ ID NO: 14 Sirt3/ Acetyl CoA Synthase 2 TSSG-K(Ac)-I-Nle-S-K(MR121)-NH2 SEQ ID NO: 15 Sirt3/ Acetyl CoA Synthase 2 TSSG-K(Ac)-1-Nle-S-K(5-TMR)-NH2 SEQ ID NO: 16 Sirt3/ Acetyl CoA Synthase 2 PSTSSG-K(Ac)-I-Nle-SS-K(MR121)-NH2 SEQ ID NO: 17 Sirt3/ Acetyl CoA Synthase 2 PSTSSG-K(Ac)-I-Nle-SS-K(5-TMR)-NH2 SEQ ID NO: 18 Sirt3/ Histone H4 SGSG-K(Ac)-GGS-K(MR121)-NH2 SEQ ID NO: 19 Sirt3/ Histone H4 SGSG-K(Ac)-GGS-K(5-TMR)-NH2 SEQ ID NO: 20 Sirt3/ Histone H4 GSGGA-K(Ac)-SHS-K(MR121)-NH2 SEQ ID NO: 21 Sirt3/ Histone H4 GSGGA-K(Ac)-SHS-K(5-TMR)-NH2 SEQ ID NO: 22 Sirt3/ Histone H4 GASSHS-K(Ac)-VL-K(MR121)-NH2 SEQ ID NO: 23 Sirt3/ Histone H4 GASSHS-K(Ac)-V L-K(5-TMR)-NH2 SEQ ID NO: 24 Table 2. Sirtuin peptide substrates having hydrophobic amino acid regions. Enzyme/ Basis for Peptide sequence Sequence SEQ ID NO p53 Ac-EEKGQSTSSHS-K(Ac)-Nle-STEGKWEE-NH2 SEQ ID NO: 25 p53 Ac-EEKGQSTSSHS-K(Ac)-Nle-STEGKWAWEE-NH2 SEQ ID NO: 26 p53 Ac-EEKGQSTSSHS-K(Ac)-Nle-STEGKWWFEE-NH2 SEQ ID NO: 27 p53 Ac-EEKGQSTSSHS-K(Ac)-Nle-STEGKWWWEE-NH2 SEQ ID NO: 28 p53 Ac-EEKGQSTSSHS-K(Ac)-Nle-STEGWEE-NH2 SEQ ID NO: 29 p53 Ac-EEKGQSTSSHS-K(Ac)-Nle-STEGWAWEE-NH2 SEQ ID NO: 30 p53 Ac-EEKGQSTSSHS-K(Ac)-Nle-STEGWWFEE-NH2 SEQ ID NO: 31 p53 Ac-EEKGQSTSSHS-K(Ac)-Nle-STEGWWWEE-NH2 SEQ ID NO: 32 p53 Ac-EEKGQSTSSHS-K(Ac)-Nle-STEGKWWWWWEE-NH2 SEQ ID NO: 33 - In accordance with the invention, the invention provides a peptide substrate for use in determining the activity of a sirtuin using mass spectrometry wherein the substrate comprises one or more of SEQ ID NOs: 1-35.
- In certain embodiments, the methods described herein are carried out under conditions which permit deacetylation of the peptide substrate by a deacetylase.
- In certain embodiments, the substrate peptide pool comprises a plurality of copies of one or more substrate peptides. In an exemplary embodiment, a substrate peptide pool comprises a plurality of copies of the same peptide substrate. Such peptide substrate pools may comprise the peptide substrate free floating in solution or attached to a solid surface such as a plate, bead, filter, etc. Combinations of free floating and anchored peptide substrate molecules may also be used in accordance with the methods described herein.
- In certain embodiments, the methods described herein may be carried out in a single reaction vessel without the need to remove reagents from the reaction mixture (e.g., a homogenous assay). In various embodiments, the components of the reactions described herein may be added sequentially or simultaneously.
- In accordance with the invention, the invention provides a method for identifying a compound that activates a sirtuin. The methods may involve comparing the activity of a sirtuin in the presence of a test compound to the activity of the sirtuin in a control reaction. The control reaction may simply be a duplicate reaction in which the test compound is not included. Alternatively, the control reaction may be a duplicate reaction in the presence of a compound having a known effect on the sirtuin deacetylase activity (e.g., an activator, an inhibitor, or a compound having no effect on enzyme activity).
- Due to the flexibility available in designing peptide substrates for the mass spectrometry based methods described herein, it is possible to optimize the peptide substrates to provide a low apparent Km thus permitting a lower concentration of substrate to be used in association with the methods. Table 3 shown below provides the Km values for a sirtuin peptide substrate provided in accordance with the methods described herein in comparison to the Km values of several published or commercially available sirtuin assays. Accordingly, in certain embodiments, the substrate peptides for use in accordance with the methods described herein may be optimized to provide a low apparent Km.
Table 3. Km comparisons for various sirtuin assays. Reference Assay Enzyme Peptide substrate (*FL with fluorescent label) Peptide Km (uM) NAD Km (uM) Biomol (Fluor de Lys)1 Fluorescent Sirt1 p53 (aa 379-382) *FL 64 558 Fluorescent Sirt2 p53 (aa 317-320) *FL 186 547 Fluorescent Sirt3 p53 (aa 317-320) *FL 32 2034 2Kaeberlein et al. Nicotinamide release Sirt1 p53 (aa 368-386) no FL 10.3 132.5 Nicotinamide release Sirt1 p53 (aa 368-386) *FL 87.6 192 3Marcotte et al. FRET Sirt1 p53 20 mer (aa 372-387) * FL ND 90 FRET Sirt2 p53 20 mer (aa 372-387) *FL ND 42 4McDonagh et al. Nicotinamide release Sirt1 p53 19 mer (aa 368-386) no FL 10.3 133 Present invention Mass Spectrometry Sirt1 SEQ ID NO: 34 11.6 464 1Biomol (Fluor de Lys) as described in product literature for SIRT1 Fluorimetric Drug Discovery Kit (AK-555), SIRT2 Fluorimetric Drug Discovery Kit (AK-556), SIRT3 Fluorimetric Drug Discovery Kit (AK-557) (Biomol International, Plymouth Meeting, PA); 2 Kaeberlein et al., JBC, 280 (17), 17038, 2005; 3 Marcotte et al., Anal. Biochem., 332, 90, 2004; 4 McDonagh et al., Methods, 36, 346, 2005. - The methods described herein utilize mass spectrometry for determining the level of acetylated and/or deacetylated substrate in a reaction. Mass spectrometry (or simply MS) encompasses any spectrometric technique or process in which molecules are ionized and separated and/or analyzed based on their respective molecular weights. Thus, mass spectrometry and MS encompass any type of ionization method, including without limitation electrospray ionization (ESI), atmospheric-pressure chemical ionization (APCI) and other forms of atmospheric pressure ionization (API), and laser irradiation. Mass spectrometers may be combined with separation methods such as gas chromatography (GC) and liquid chromatography (LC). GC or LC separates the components in a mixture, and the components are then individually introduced into the mass spectrometer; such techniques are generally called GC/MS and LC/MS, respectively. MS/MS is an analogous technique where the first-stage separation device is another mass spectrometer. In LC/MS/MS, the separation methods comprise liquid chromatography and MS. Any combination (e.g., GC/MS/MS, GC/LC/MS, GC/LC/MS/MS, etc.) of methods can be used to practice the methods described herein. In such combinations, MS can refer to any form of mass spectrometry; by way of non-limiting example, LC/MS encompasses LC/ESI MS and LC/MALDI-TOF MS. Thus, mass spectrometry and MS include without limitation APCI MS; ESI MS; GC MS; MALDI-TOF MS; LC/MS combinations; LC/MS/MS combinations; MS/MS combinations; etc. Other examples of MS include, for example, MALDI-TOF-TOF MS, MALDI Quadrupole-time-of-flight (Q-TOF) MS, electrospray ionization (ESI)-TOF MS, ESI-Q-TOF, ESI-TOF-TOF, ESI-ion trap MS, ESI Triple quadrupole MS, ESI Fourier Transform Mass Spectrometry (FTMS), MALDI-FTMS, MALDI-Ion Trap-TOF, ESI-Ion Trap TOF, surface-enhanced laser desorption/ionization (SELDI), MS/MS/MS, ESI-MS/MS, quadrupole time-of-flight mass spectrometer QqTOF MS, MALDI-QqTOFMS, ESI-QqTOF MS, and chip capillary electrophoresis (chip-CE)-QqTOF MS, etc.
- It is often necessary to prepare samples comprising an analyte of interest for MS. Such preparations include without limitation purification and/or buffer exchange. Any appropriate method, or combination of methods, can be used to prepare samples for MS. One type of MS preparative method is liquid chromatography (LC), including without limitation HPLC and RP-HPLC.
- High-pressure liquid chromatography (HPLC) is a separative and quantitative analytical tool that is generally robust, reliable and flexible. Reverse-phase (RP) is a commonly used stationary phase that is characterized by alkyl chains of specific length immobilized to a silica bead support. RP-HPLC is suitable for the separation and analysis of various types of compounds including without limitation biomolecules, (e.g., glycoconjugates, proteins, peptides, and nucleic acids, and, with mobile phase supplements, oligonucleotides). One of the most important reasons that RP-HPLC has been the technique of choice amongst all HPLC techniques is its compatibility with electrospray ionization (ESI). During ESI, liquid samples can be introduced into a mass spectrometer by a process that creates multiple charged ions (Wilm et al., Anal. Chem. 68:1, 1996). However, multiple ions can result in complex spectra and reduced sensitivity.
- In HPLC, peptides and proteins are injected into a column, typically silica based C18. An aqueous buffer is used to elute the salts, while the peptides and proteins are eluted with a mixture of aqueous solvent (water) and organic solvent (acetonitrile, methanol, propanol). The aqueous phase is generally HPLC grade water with 0.1% acid and the organic solvent phase is generally an HPLC grade acetonitrile or methanol with 0.1% acid. The acid is used to improve the chromatographic peak shape and to provide a source of protons in reverse phase LC/MS. The acids most commonly used are formic acid, triflouroacetic acid, and acetic acid. In RP HPLC, compounds are separated based on their hydrophobic character. With an LC system coupled to the mass spectrometer through an ESI source and the ability to perform data-dependant scanning, it is now possible in at least some instances to distinguish proteins in complex mixtures containing more than 50 components without first purifying each protein to homogeneity. Where the complexity of the mixture is extreme, it is possible to couple ion exchange chromatography and RP-HPLC in tandem to identify proteins from mixtures containing in excess of 1,000 proteins.
- A particular type of MS technique, matrix-assisted laser desorption time-of-flight mass spectrometry (MALDI-TOF MS) (Karas et al., Int. J. Mass Spectrom. Ion Processes 78:53, 1987), has received prominence in analysis of biological polymers for its desirable characteristics, such as relative ease of sample preparation, predominance of singly charged ions in mass spectra, sensitivity and high speed. MALDI-TOF MS is a technique in which a UV-light absorbing matrix and a molecule of interest (analyte) are mixed and co-precipitated, thus forming analyte:matrix crystals. The crystals are irradiated by a nanosecond laser pulse. Most of the laser energy is absorbed by the matrix, which prevents unwanted fragmentation of the biomolecule. Nevertheless, matrix molecules transfer their energy to analyte molecules, causing them to vaporize and ionize. The ionized molecules are accelerated in an electric field and enter the flight tube. During their flight in this tube, different molecules are separated according to their mass to charge (m/z) ratio and reach the detector at different times. Each molecule yields a distinct signal. The method may be used for detection and characterization of biomolecules, such as proteins, peptides, oligosaccharides and oligonucleotides, with molecular masses between about 400 and about 500,000 Da, or higher. MALDI-MS is a sensitive technique that allows the detection of low (10-15 to 10-18 mole) quantities of analyte in a sample.
- Electrospray ionization may be used for both very large and small molecules. The electrospray process produces multiply charged analytes, making it somewhat easier to detect larger analytes such as proteins. Also, small molecules can be measured readily in the absence of matrix. The MALDI process requires a matrix, which may make it more difficult to analyze small molecules, for example, with molecular weights of less than about 700 daltons.
- With certain mass spectrometers, for example, MALDI-TOF, sensitivity decreases as the molecular weight of a molecule increases. For example, the detection sensitivity of molecules with molecular weights in the range of about 10,000 daltons may be an order of magnitude or more lower than detection sensitivity of molecules with molecular weights in the range of about 1,000 daltons. Use and detection of a coding moiety and/or labels with a different, for example lower, molecular weight than the analyte can therefore enhance the sensitivity of the assay. Sensitivity can also be increased by using a coding moiety and/or that is very amenable to ionization.
- In electrospray mass spectrometry, sample introduction into a mass spectrometer such as a quadropole, an ion trap, a TOF, a FTICR, or a tandem mass spectrometer, the higher molecular weight compounds, for example, proteins are observed as ions having a variable number of charge states. While the multiple charge phenomenon increases sensitivity, the spectra are more complex and difficult to interpret. Use and detection of a coding moiety with a less complex mass spectrum than the analyte can therefore enhance the resolution of the assay.
- Various mass spectrometers may be used in accordance with the methods described herein. Representative examples include: triple quadrupole mass spectrometers, magnetic sector instruments (magnetic tandem mass spectrometer, JEOL, Peabody, Mass.), ionspray mass spectrometers (Bruins et al., Anal Chem. 59:2642-2647, 1987), electrospray mass spectrometers (including tandem, nano- and nano-electrospray tandem) (Fenn et al., Science 246:64-71, 1989), laser desorption time-of-flight mass spectrometers (Karas and Hillenkamp, Anal. Chem. 60:2299-2301, 1988), and a Fourier Transform Ion Cyclotron Resonance Mass Spectrometer (Extrel Corp., Pittsburgh, Mass.).
- For additional information regarding mass spectrometers, see, e.g., Principles of Instrumental Analysis, 3rd ed., Skoog, Saunders College Publishing, Philadelphia, 1985; Kirk-Othmer Encyclopedia of Chemical Technology, 4th ed. Vol. 15 (John Wiley & Sons, New York 1995), pp. 1071-1094;
Chemushevich and Thomson (EP1006559 );Verentchikov et al. (WO/0077823 Clemmer and Reilly (WO/0070335 Hager (WO/0073750 WO99/01889 Krutchinsky et al., WO 99/38185 - In an exemplary embodiment, the mass spectrometry based assay methods described herein are conducted in a high throughput manner as described in C.C. Ozbal, et al., Assay and Drug Development Technologies 2: 373-381 (2004). In certain embodiments, the high throughput mass spectrometry based assay methods described herein utilize an integrated microfluidic system which uses an atmospheric pressure ionization triple quadrupole mass spectrometer as the detection system with electrospray ionization (ESI) or atmospheric pressure chemical ionization (APCI).
- In certain embodiments, the invention provides methods for screening for compounds that activate a deacetylase. In certain embodiments, the methods described herein may be used to identify a test compound that increases deacetylase activity by at least about 10%, 25%, 50%, 75%, 80%, 90%, or 100%, or more, relative to the absence of the test compound. In an exemplary embodiment, the methods described herein may be used to identify a sirtuin activating compound that increases deacetylase activity by at least about 10%, 25%, 50%, 75%, 80%, 90%, or 100%, or more, relative to the sirtuin activating activity of resveratrol.
- In accordance with the invention, the concentration of the peptide substrate in the reaction is below the Km of the enzyme for the peptide substrate. In certain embodiments, the concentration of the peptide substrate in the reaction may be at least 2-fold, 5-fold, 10-fold, 15-fold, 20-fold, 25-fold, 30-fold, or more, below the Km of the enzyme for the peptide substrate.
- Test compounds can be pharmacologic agents already known in the art or can be compounds previously unknown to have any pharmacological activity. The compounds can be naturally occurring or designed in the laboratory. They can be isolated from microorganisms, animals, or plants, and can be produced recombinantly, or synthesized by chemical methods known in the art. If desired, test compounds can be obtained using any of the numerous combinatorial library methods known in the art, including but not limited to, biological libraries, spatially addressable parallel solid phase or solution phase libraries, synthetic library methods requiring deconvolution, the "one-bead one-compound" library method, and synthetic library methods using affinity chromatography selection. The biological library approach is limited to polypeptide libraries, while the other four approaches are applicable to polypeptide, non-peptide oligomer, or small molecule libraries of compounds. See Lam, Anticancer Drug Des. 12, 145, 1997.
- Methods for the synthesis of molecular libraries are well known in the art (see, for example, DeWitt et al., Proc. Natl. Acad. Sci. U.S.A. 90, 6909, 1993; Erb et al. Proc. Natl. Acad. Sci. U.S.A. 91, 11422, 1994; Zuckermann et al., J Med Chem. 37,2678, 1994; Cho et al., Science 261, 1303, 1993; Carell et al., Angew. Chem. Int. Ed Engl. 33, 2059, 1994; Carell et al., Angew. Chem. Int. Ed. Engl. 33, 2061; Gallop et al., J. Med Chem. 37, 1233, 1994). Libraries of compounds can be presented in solution (see, e.g., Houghten, BioTechniques 13, 412-421, 1992), or on beads (Lam, Nature 354, 82-84, 1991), chips (Fodor, Nature 364, 555-556, 1993), bacteria or spores (
Ladner, U.S. Pat. No. 5,223,409 ), plasmids (Cull et al., Proc. Natl. Acad Sci. U.S.A. 89, 1865-1869, 1992), or phage (Scott & Smith, Science 249, 386-390, 1990; Devlin, Science 249, 404-406, 1990); Cwirla et al., Proc. Natl. Acad. Sci. 97, 6378-6382, 1990; Felici, J. Mol. Biol. 222, 301-310, 1991; andLadner, U.S. Pat. No. 5,223,409 ). - Test compounds can be screened for the ability to modulate acetyltransferase or deacetylase activity using high throughput screening. Using high throughput screening, many discrete compounds can be tested in parallel so that large numbers of test compounds can be quickly screened. The most widely established techniques utilize 96-well microtiter plates. In addition to the plates, many instruments, materials, pipettors, robotics, plate washers, and plate readers are commercially available to fit the 96-well format.
- Alternatively, free format assays, or assays that have no physical barrier between samples, can be used. Assays involving free formats are described, for example, in Jayawickreme et al., Proc. Natl. Acad. Sci. U.S.A. 19, 1614-18 (1994); Chelsky, "Strategies for Screening Combinatorial Libraries: Novel and Traditional Approaches," reported at the First Annual Conference of The Society for Biomolecular Screening in Philadelphia, Pa. (Nov. 7-10, 1995); and Salmon et al., ). Another high throughput screening method is described in
Beutel et al., U.S. Pat. No. 5,976,813 . - The invention further describes kits for measuring the activity of an acetyltransferase or a deacetylase and screening for compounds that inhibit or enhance the acetyltransferase or deacetylase activity as described above. Such kits may be useful for research purposes, drug discovery, diagnostic purposes, etc.
- A kit may comprise a peptide substrate (as described above) and one or more of the following: a sirtuin, one or more test compounds, a positive control, a negative control, instructions for use, a reaction vessel, buffers, a MALDI matrix, etc. Kits for determination of deacetylase activity may comprise a previously acetylated substrate peptide. The peptide substrate may also comprise a hydrophobic region. In certain embodiments, each component, e.g., the substrate peptide, the deacetylase, and/or test compound, may be packaged separately.
- Respective components of the kit may be combined so as to realize a final concentration that is suitable for the reaction. Further, in addition to these components, the kit may comprise a buffer that gives a condition suitable for the reaction. The enzyme preparation and the substrate peptide may be combined with other components that stabilize proteins. For example, the kit components may be stored and/or shipped in the presence of about 1% BSA and about 1% polyols (e.g., sucrose or fructose) to prevent protein denaturation after lyophilization.
- Each component of the kit can be provided in liquid form or dried form. Detergents, preservatives, buffers, and so on, commonly used in the art may be added to the components so long as they do not inhibit the measurement of the deacetylase activity.
- Compounds that activate deacetylase activity, which can be selected according to the method for screening of the present invention, are useful as candidate compounds for antimicrobial substances, anti-cancer agents, and a variety of other uses. For example, compounds that activate a sirtuin deacetylase protein may be useful for increasing the lifespan of a cell, and treating and/or preventing a wide variety of diseases and disorders including, for example, diseases or disorders related to aging or stress, diabetes, obesity, neurodegenerative diseases, chemotherapeutic induced neuropathy, neuropathy associated with an ischemic event, ocular diseases and/or disorders, cardiovascular disease, blood clotting disorders, inflammation, and/or flushing, etc. Sirtuin deacetylase inhibitors may be useful for a variety of therapeutic applications including, for example, increasing cellular sensitivity to stress, increasing apoptosis, treatment of cancer, stimulation of appetite, and/or stimulation of weight gain, etc.
- In certain embodiments, the mass spectrometry assays described herein do not utilize a peptide substrate that is obtained or derived from an HIV Tat protein.
- In certain embodiments, the invention provides a method for identifying a compound that activates a sirtuin protein comprising (a) contacting a peptide substrate pool with a sirtuin in the presence of a test compound, wherein members of said peptide substrate pool have the amino acid sequence set forth in SEQ ID NO: 34; and (b) determining the level of acetylation of the peptide substrate pool using mass spectrometry, wherein a decrease in the level of acetylation of the peptide substrate pool in the presence of the test compound as compared to a control is indicative of a compound that activates a sirtuin.
- In another embodiment, the invention provides a method for identifying a compound that activates a deacetylase, comprising (a) contacting a peptide substrate pool with a deacetylase in the presence of a test compound, wherein members of said peptide substrate pool comprise at least one acetylated lysine residue, and (b) determining the level of acetylation of the peptide substrate pool using mass spectrometry, wherein a decrease in the level of acetylation of the peptide substrate pool in the presence of the test compound as compared to a control is indicative of a compound that activates a deacetylase, with the proviso that the method does not comprise contacting a peptide substrate pool with a sirtuin in the presence of a test compound, wherein members of said peptide substrate pool have the amino acid sequence set forth in SEQ ID NO: 34.
- In addition, the application describes cell based methods for determining sirtuin activity. The assays comprise contacting a cell with a putative sirtuin modulating compound and then determining cell viability and ATP levels in the cell. An increase in the average ATP level per viable cell is indicative of an increase in sirtuin activity (e.g., a sirtuin activating compound) whereas a decrease in the average ATP level per viable cell is indicative of a decrease in sirtuin activity (e.g., a sirtuin inhibiting compound). In certain embodiments, the assays may further comprise conducting an in vitro assay to determine if the compound has sirtuin modulating activity. Such in vitro assays may be carried out before, after, or simultaneously with the cell based assays. The cell based assays described herein may be used as a secondary screen to further characterize a putative sirtuin modulating compound. For example, the cell based assays may be used to confirm that a sirtuin modulating compound identified in vitro has sirtuin modulating activity in a cellular environment, provide information about cell membrane permeability and/or cellular toxicity. Compounds that show a lower level of sirtuin modulating activity in a cell based assay as compared to an in vitro assay may be indicative of compounds that have low cell membrane permeability or compounds that are cell membrane impermeable. Additionally, compounds that show sirtuin activating activity in an in vitro assay but show sirtuin inhibiting activity in a cell based assay may be indicative of compounds that are cytotoxic. Accordingly, such cell based assays will provide useful information for developing therapeutic agents. In certain embodiments, the cell based methods described herein may be used to determine the effect of a putative sirtuin modulating compound on mitochondrial biogenesis.
- The cell based methods for determining sirtuin activity described herein may utilize a sirtuin activatable cell line. A sirtuin activatable cell line is a cell line that is suitable for use in the cell based sirtuin activating assays described herein. A sirtuin activatable cell line comprises a relatively low endogenous level of one or more sirtuin proteins (e.g., the amount of sirtuin activity in the cell is not saturating and an increase in activity is observable) and a relatively low level of mitochondria and/or oxidative phosphorylation capacity (e.g., the amount of mitochondria and/or oxidative phosphorylation in the cell is not saturating and an increase in ATP levels is observable). A sirtuin activatable cell line may be identified using the methods described in the Exemplification section below. Exemplary sirtuin activatable cell lines include, for example, NCI-H358 and MCS7.
- The cell based methods for determining sirtuin activity described herein involve determination of ATP levels in a cell or sample of cells. ATP levels can be determined by any method known in the art or any method yet to be discovered. Reagent formulations containing luciferase and luciferin for assaying ATP in a sample are known in the art. For example,
U.S. Pat. No. 6,004,767 of Crouch et al. discloses a bioluminescent reagent as a freeze dried powder, to be reconstituted prior to use.U.S. Pat. No. 5,558,986 of Lundin discloses such reagent formulation for use in combination with a cyclodextrin.US patent application No. 2001/0046687 of DiCesare also discloses the use of such formulation, wherein trehalose is used to enhance the emission of light intensity.Published international patent application, WO 94/11528 of Foote and Grant U.S. Pat. Nos. 5,618,682 ;3,933,592 ;4,303,752 ;U.S. Patent Publication Nos. 2006/0073537 ;200/50124018 ;2003/0104507 ;2006/0008860 ; andPCT Publication No. WO 00/18953 - The cell based methods for determining sirtuin activity described herein involve determination of cell viability in sample of cells. Cell viability can be determined by any method known in the art or any method yet to be discovered. Exemplary methods for determining cell viability include, for example, Alamar Blue, Brd U, MTT, Trypan Blue exclusion, 3H-thymidine incorporation, and XTT assays. Kits for determining cell viability are commercially available from a variety of sources.
- In certain embodiments, the cell based methods for determining sirtuin activity described herein may further comprise determination of sirtuin activity in an in vitro assay. Sirtuin activity can be determined by any method known in the art or any method yet to be discovered. Assays for determining sirtuin activity may be conducted in a cell based or cell free format. For example, an assay may comprise incubating (or contacting) a sirtuin with a test agent under conditions in which a sirtuin can be activated by an agent known to activate the sirtuin, and monitoring or determining the level of activation of the sirtuin in the presence of the test agent relative to the absence of the test agent. The level of activation of a sirtuin can be determined by determining its ability to deacetylate a substrate. Exemplary substrates are acetylated peptides, for example, peptides from BIOMOL (Plymouth Meeting, PA), peptides of p53 (such as those comprising an acetylated K382), the Fluor de Lys-SIRT1 (BIOMOL) acetylated peptide (Arg-His-Lys-Lys), peptides from human histones H3 and H4, an acetylated amino acid, and the other peptide substrates described herein. The HDAC fluorescent activity assay/drug discovery kit (AK-500, BIOMOL Research Laboratories) may be used to determine the level of acetylation. Methods for determining sirtuin activity have been described. For example, Bitterman et al. (2002) J. Biol. Chem. 277:45099 describe a fluorescence based assay for determination of sirtuin activity. Additionally, fluorescent enzyme assay kits for determining sirtuin activity are commercially available (Biomol International L.P., Plymouth Meeting, PA). Other suitable assays for identifying sirtuin activators include a fluorescence polarization based assay described in
PCT/US06/07748 or the mass spectrometry assays described herein. - The cell based assays described herein may comprise determination of ATP levels and cell viability at one or more fixed time points after contacting the cells with a potential sirtuin modulating compound. In exemplary embodiments, ATP level and cell viability are determined at about 12-84 hours, about 24-72 hours, about 36-60 hours, or at about 48 hours after exposure of the cells to a potential sirtuin modulating compound.
- The cell based assays described herein may comprise determination of ATP level and cell viability in a sample of cells that are growing logrhythmically (e.g., log phase growth).
- The cell based assays described herein may utilize controls. For example, controls include duplicate assays in which cell samples are contacted with vehicle alone or with a sirtuin modulating compound having known activity (e.g., a sirtuin activating compound, sirtuin inhibiting compound, and/or a compound having no sirtuin modulating activity).
- The invention now being generally described, it will be more readily understood by reference to the following examples which are included merely for purposes of illustration of certain aspects and embodiments of the present invention.
- This example describes the development of the SIRT1 in vitro mass spectrometry enzyme assay for the NAD+-dependent deacetylase, SIRT1. The mass spectrometry based assay utilizes a peptide having 20 amino acid residues as follows: Ac-EE-K(biotin)-GQSTSSHSK(Ac)NIeSTEG-K(5TMR)-EE-NH2 (SEQ ID NO: 34) wherein K(Ac) is an acetylated lysine residue and Nle is a norleucine. The peptide is labeled with the fluorophore 5TMR (excitation 540 nm/emission 580 nm) at the C-terminus. The sequence of the peptide substrate is based on p53 with several modifications. In addition, the methionine residue naturally present in the sequence was replaced with the norleucine because the methionine may be susceptible to oxidation during synthesis and purification. An identical peptide lacking the acetyl group on the lysine was also synthesized as a standard for the expected product in the mass spectrometry assay. This second peptide having 20 amino acid residues is as follows: Ac-EE-K(biotin)-GQSTSSHSKNIeSTEG-K(5TMR)-EE-NH2 (SEQ ID NO: 35) wherein Nle is a norleucine. The peptide is also labeled with the fluorophore 5TMR (excitation 540 nm/emission 580 nm) at the C-terminus. In addition, the methionine residue naturally present in the sequence was replaced with the norleucine because the methionine may be susceptible to oxidation during synthesis and purification. SIRT1 acetylated and deacetylated peptide substrates were obtained from Biopeptide, Inc. (San Diego, CA).
- Mass spectrometry can be used to detect the change in mass observed in a peptide substrate following deacetylation as deacetylation results in a mass change of 44 atomic mass units (AMU) in the peptide substrate (i.e. the difference in expected mass units between the peptide corresponding to SEQ ID NO: 34 and SEQ ID NO: 35). A mass spectrometry analytical method for the detection of SIRT1 Acetylated Peptide Substrate and SIRT1 Deacetylated Peptide Substrate was developed using substrate and product peptide standards. Mass Spectrometry was done via high throughput as described in Ozbal et al. (Assay and Drug Development Technologies, 2 (4), 2004). To develop the SIRT1 enzyme assay, the dependence of product formation on SIRT1 enzyme concentration and incubation time was established. Hence, this method can be used to screen NCEs, in a HTS (High Throughput Screen) manner, against SIRT1 to identify inhibitors and/or activators.
- SIRT1 protein was expressed and purified as follows. The SirT1 gene was cloned into a T7-promoter containing vector and transformed into BL21 (DE3). The protein was expressed by induction with 1 mM IPTG as an N-terminal His-tag fusion protein at 18°C overnight and harvested at 30,000 x g. Cells were lysed with lysozyme in lysis buffer (50 mM Tris-HCl, 2 mM Tris[2-carboxyethyl] phosphine (TCEP), 10 µM ZnCl2, 200 mM NaCl) and further treated with sonication for 10 min for complete lysis. The protein was purified over a Ni-NTA column (Amersham) and fractions containing pure protein were pooled, concentrated and run over a sizing column (Sephadex S200 26/60 global). The peak containing soluble protein was collected and run on an Ion-exchange column (MonoQ). Gradient elution (200 mM - 500 mM NaCl) yielded pure protein. This protein was concentrated and dialyzed against dialysis buffer (20 mM Tris-HCl, 2 mM TCEP) overnight. The protein was aliquoted and frozen at -80°C until further use.
- To establish the dependence of the enzyme assay on SIRT1 enzyme concentration and incubation time, a rate based experiment was performed using multiple concentrations of SIRT1 enzyme. The assay employs mass spectrometry to monitor the conversion of Acetylated Peptide Substrate to Deacetylated Peptide Product by SIRT1. A schematic of the assay is shown in
Figure 1 . - Briefly, 1 µL of vehicle (DMSO) was added to each well of Costar 96-well clear round bottom assay plate. Formic acid (10 µL of 10%) was added to all of the wells in
column 1 of the 96-well assay plate. Eight stock concentrations of SIRT1 (80, 40, 20, 10, 5, 2.5, 1.25, and 0.63 nM) were prepared in an Enzyme Working Solution (50 mM Tris HCl pH 8.0, 137 mM, NaCl, 2.7 mM, KCI, 1 mM MgCl2, 5 mM DTT, and 0.05% BSA). 50 µL of each SIRT1 stock was added to a row of the 96-well assay plate. (e.g. the 80 nM dose was added to all wells in row A, the 40 nM dose was added to all wells in row B, etc.). - To initiate the reaction, 50 µL of Substrate Working Solution (1 µM SIRT I Acetylated Peptide Substrate, 240 µM NAD+, 50 mM Tris HCl pH 8.0, 137 mM NaCl, 2.7 mM KCI, 1 mM MgCl2, 5 mM DTT, and 0.05% BSA) was added to all wells of the 96-well assay plate.
- At 0, 5, 10, 15, 25, 35, 45, 60, 75, 90, 105, and 120 minutes, the reaction was stopped by addition of 10% formic acid and the conversion of substrate to product was determined by mass spectrometry. The removal of an acetyl group results in the loss of 44 AMU from the original peptide substrate. The activity of each concentration of SIRT1 was monitored by comparing the percent conversion of Acetylated Peptide Substrate to Deacetylated Peptide Product over time.
- The final conditions of the assay were SIRT1 (40, 20, 10, 5, 2.5, 1.25, 0.63 or 0.031 nM), 0.5 µM SIRT1 Acetylated Peptide Substrate, 120 µM NAD+, 50 mM Tris HCl pH 8.0, 137 mM NaCl, 2.7 mM KCI, 1 mM MgCl2, 5 mM DTT, 0.05% BSA and 25 °C.
- The ability of SIRT1 to convert Acetylated Peptide Substrate into Deacetylated Peptide Product was evaluated at 8 different concentrations of SIRT1, in the presence of vehicle (DMSO), at multiple time points. The rate of product formation versus time was plotted for each concentration of SIRT1 enzyme tested. The rate in the linear part of the curve was determined.
-
Figure 2 shows the initial velocity determined at each SIRT1 concentration tested. SIRT1 deacetylation activity is dependent on both enzyme concentration and incubation time. Concentrations of enzyme between 5-20 nM result in product formation well above background. Based on these results, 10 nM SIRT1 was selected as the standard condition for the assay. - To determine the Km of SIRT1 for Acetylated Peptide Substrate, the linear rate was determined at twelve concentrations of Acetylated Peptide Substrate (50, 25, 12.5, 6.25, 3.12, 1.56, 0.78, 0.39, 0.19, 0.098, 0.049, and 0.024 µM) in the presence of vehicle (1% DMSO). A schematic of the assay is shown in
Figure 3 . - Briefly, 1 µL of vehicle (DMSO) was added to each well of a Costar 96-well clear round bottom assay plate and 10 µL of 10% formic acid was added to all of the wells in row A. The Acetylated Peptide Substrate was serially diluted. Wells A2, A3, A4, A5, A6, A7, A8, A9, A10, A11 and A12 of a
Costar 2mL 96 well Assay Block were filled with 600 µL of Substrate Dilution Working Solution (SDWS; 4 mM NAD+, 50 mM Tris HCl pH 8.0, 137 mM NaCl, 2.7 mM KCI, I mM MgCl2, 5 mM DTT, and 0.05% BSA). 1200 µL Acetylated Peptide Substrate Top Dose Working Solution (APSTD-WS; 100 µM SIRT1 Acetylated Peptide Substrate, 4 mM NAD+, 50 mM Tris HCl pH 8.0, 137 mM NaCl, 2.7 mM KCI, 1 mM MgCl2, 5 mM DTT, and 0.05% BSA) was added to well A1 of theCostar 2mL 96 well Assay Block. The APSTD-WS was serially diluted into SDWS by transferring 600 µL of APSTD-WS from well A1 to Well B1 of theCostar 2mL 96 well Assay Block. The solution was mixed 5 times and the process was continued by moving across row A, until well A12 was reached. - The Enzyme Working Solution (20 nM SIRT1, 50 mM Tris HCl pH 8.0, 137 mM NaCl, 2.7 mM KCl, 1 mM MgCl2), 5 mM DTT, 0.05% BSA) was prepared. 50 µL of serial diluted APSTD-WS was transferred from the entire row A of the
Costar 2mL 96 well Assay Block to each row of the 96-well assay plate using a 12 channel pipette (e.g. from row A of the 2mL Assay block, to row A, B, C, D, E, F, G, H of the 96-well assay plate). To initiate the reaction, 50 µL of Enzyme Working Solution was added to each well of the 96-well assay plate using the Multidrop. - At 0, 3, 6, 9, 12, 15, 20, and 25 minutes, the reaction was stopped with 10% formic acid and the conversion of substrate to product was determined by mass spectrometry.
- The final conditions of the assay were 10 nM SIRT1, 50, 25, 12.5, 6.25, 3.12, 1.56, 0.78, 0.39, 0.19, 0.098, 0.049, or 0.024 µM SIRT I Acetylated Peptide Substrate, 2 mM NAD+, 50 mM Tris HCl pH 8.0, 137 mM NaCl, 2.7 mM KCI, 1 mM MgCl2, 5 mM DTT, 0.05% BSA and 25 °C.
- The Km of SIRT1 for the Acetylated Peptide Substrate was determined in the presence of vehicle (1% DMSO). SIRT1 enzyme activity at 12 concentrations of SIRT1 Acetylated Peptide Substrate was monitored by comparing the percent conversion of Acetylated Peptide Substrate to Deacetylated Peptide Product over time. The reaction rate at each substrate concentration was determined as the slope of the product formation versus time plot in the linear range. The rates obtained were then plotted against the substrate concentration to generate a plot for determination of the Km.
- As represented in
Figure 4 , the Km of SIRT1 for Acetylated Peptide Substrate was determined in 2 replicate plates to be 11.2 µM and 11.9 µM resulting in a mean Km of 11.6 µM. The standard assay conditions were established at sub-Km concentrations (0.5 µM Acetylated Peptide Substrate) of peptide substrate in order to maximize the effect of Km-type activators. - To determine the Km for NAD+, the linear rate was determined at 8 concentrations of NAD+ (2000, 1000, 500, 250, 125, 62.5, 31.25 and 15.6 µM) in vehicle (1% DMSO). A schematic of the assay design is shown in
Figure 5 . - Vehicle (1 µL DMSO) was added to each well of a Costar 96-well clear round bottom assay plate and 10 µL of 10% formic acid was added to all of the wells in row A of the 96 well assay plate.
- NAD+ was serially diluted in a
Costar 2mL 96 well Assay Block by first filling wells B1, C1, D1, E1, F1, G1, H1 with 600 µL of Substrate Dilution Working Solution (SDWS; 100 µM Acetylated Peptide Substrate, 50 mM Tris HCl pH 8.0, 137 mM NaCl, 2.7 mM KCI, 1 mM MgCl2, 5 mM DTT, and 0.05% BSA). A total of 1200 µL of the NAD+ Top Dose Working Solution (NADTD-WS; 100 µM SIRT1 Acetylated Peptide Substrate, 4 mM NAD+, 50 mM Tris HCl pH 8.0, 137 mM NaCl, 2.7 mM KCl, I mM MgCl2, 5 mM DTT, and 0.05% BSA) were added to well A 1 of theCostar 2mL 96 well Assay Block. The NADTD-WS was serially diluted into SDWS by transferring 600 µL of NADTD-WS from well A1 to well B1 of theCostar 2mL 96 well Assay Block. The solutions were mixed 5 times and the process was repeated until well H1 was reached. - The Enzyme Working Solution (20 nM SIRT1, 50 mM Tris HCl pH 8.0, 137 mM NaCl, 2.7 mM KCl, 1 mM MgCl2, 5 mM DTT, and 0.05% BSA) was prepared.
- The serial diluted NADTD-WS (50 µL) was transferred to every column of the 96-well assay plate from the
entire column 1 of theCostar 2mL 96 well Assay Block using an 8 Channel Pipette (e.g. fromcolumn 1 of the 2 mL Assay block, to columns 1-12 off the 96-well assay plate). To initiate the reaction, 50 µL of Enzyme Working Solution was added to each well of the 96-well assay plate using the Multidrop. - At 0, 10, 15, 20, 30 minutes, the reaction was stopped with 10% formic acid and the conversion of substrate to product was determined by mass spectrometry. The activity at each concentration of NAD+ was monitored by comparing the percent conversion of Acetylated Peptide Substrate to Deacetylated Peptide Product over time.
- The final conditions of the assay were 10 nM S1RT1, 2000, 1000, 500, 250, 125, 62.5, 31.25 or 15.6 µM NAD+, 50 µM SIRT1 Acetylated Peptide Substrate, 50 mM Tris HCl pH 8.0, 137 mM NaCl, 2.7 mM KCI, I mM MgCl2, 5 mM DTT, 0.05% BSA and 25 °C.
- The Km of SIRT1 for NAD+ was determined in the presence of vehicle (1 % DMSO). SIRT1 enzyme activity at 8 concentrations of NAD+ was monitored by comparing the percent conversion of Acetylated Peptide Substrate to Deacetylated Peptide Product over time. The reaction rate at each NAD+ concentration was determined as the slope of the product formation versus time plot in the linear range. The rates obtained were then plotted against the NAD+ concentration to generate a plot for determination of the Km.
- The Km of SIRT1 for NAD+ was determined to be 220 µM (
Figure 6 ). The standard assay conditions were established at sub-Km concentrations (120 µM NAD+) of peptide substrate in order to maximize the effect of Km-type activators. - To determine the tolerance of the SIRT1 mass spectrometry assay for DMSO, a rate based experiment was performed at multiple concentrations of DMSO. A schematic of the assay design is shown in
Figure 7 . - Formic acid (10 µL of 10%) was added to all of the wells in column I of the 96 well assay plate. Eight concentrations of DMSO (40%, 20%, 10%, 5.0%, 2.5%, 1.25%, 0.625%, and 0.313%) were prepared in buffer containing 50 mM Tris HCl pH 8.0, 137 mM, NaCl, 2.7 mM, KCl, 1 mM MgCl2, 5 mM DTT, and 0.05% BSA.
- This DMSO titration was prepared by making a 2000 µL solution of 40% DMSO in 50 mM Tris HCl pH 8.0, 137 mM, NaCl, 2.7 mM, KCl, 1 mM MgCl2, 5 mM DTT, and 0.05% BSA in well A1 of a
Costar 2mL 96 well Assay Block. Dilution Working Solution (1000 µL; 50 mM Tris HCl pH 8.0, 137 mM, NaCl, 2.7 mM, KCI, 1 mM MgCl2, 5 mM DTT, and 0.05% BSA) was added to wells B1, C I, D1, E1, F1, G1 and H1. 1000 µL of the 40% DMSO in buffer solution was transferred from A1 to A2 and the solution was mixed 5 times. This process was repeated with wells in column I until well H1 was reached. - Using an 8 channel multi-pipette, 50 µL was transferred from
column 1 of the 2mL 96 well assay block to all columns of a 96 well assay plate. - 25 µL of Enzyme Working Solution (40 nM SIRT1, 50 mM Tris HCl pH 8.0, 137 mM, NaCl, 2.7 mM, KCI, 1 mM MgCl2, 5 mM DTT, and 0.05% BSA) was prepared and added to each well of the 96-well round bottom assay plate.
- To initiate the reaction, 25 µL of Substrate Working Solution (2 µM SIRT1 Acetylated Peptide Substrate, 480 µM NAD, 50 mM Tris HCl pH 8.0, 137 mM NaCl, 2.7 mM KCl, 1 mM MgCl2, 5 mM DTT, and 0.05% BSA) was added to all wells of the 96-well assay plate.
- At 0, 2, 5, 10, 15, 20, 25, 25, 30, 35, 40, 45, and 60 minutes, the reaction was stopped with 10% formic acid and the conversion of substrate to product was determined by mass spectrometry. The activity of SIRT1 at each concentration of DMSO was monitored by comparing the percent conversion of Acetylated Peptide Substrate to Deacetylated Peptide Product over time.
- The final conditions of the assay were 10 nM SIRT1, 0.5 µM SIRT1 Acetylated Peptide Substrate, 120 µM NAD, 50 mM Tris HCl pH 8.0, 137 mM NaCl, 2.7 mM KCl, 1 mM MgCl2, 5 mM DTT, 0.05% BSA, and DMSO (20%, 10%, 5%, 2.5%, 1.25%, 0.63% or 0.031 %, 0.156%)
- Product formation versus time was plotted for each concentration of DMSO tested. The rate was determined by taking the slope from the linear part of the time course. The rate was plotted versus the DMSO concentration in a bar graph for comparison of the different treatments.
- Data are presented as the initial velocity obtained at each concentration of DMSO. The results demonstrate that SIRT1 enzyme activity is sensitive to DMSO at concentrations greater than 0.625% (
Figure 8 ). Enzyme activity was decreased by 36% at 2.5% DMSO, by 21% at 1.25% DMSO and by 9.1% at 0.625% DMSO. Based on these results, the concentration of DMSO in the reaction under the standard assay conditions should not exceed 1% final. - The purpose of this example was to address the mechanism by which the small molecule, resveratrol, activates SIRT1 enzyme activity. The effect of resveratrol on the Km of human SIRT1 enzyme for Acetylated Peptide Substrate was examined using the SIRT1 Mass Spectrometry Assay described in the previous examples. The experimental design is diagrammed in
Figure 9 . Using the cell-free MS assay, the Km of SIRT1 enzyme for peptide substrate was determined at five concentrations of resveratrol (100, 33, 11, 3.7, 1.2 µM) and also in the presence of DMSO vehicle alone. To determine the Km, the linear rate was determined at 12 concentrations of Acetylated Peptide Substrate (50, 25, 12.5, 6.25, 3.12, 1.56, 0.78, 0.39, 0.19, 0.098, 0.049, and 0.024 µM) for each of the resveratrol concentrations and for the vehicle control. SIRT1 enzyme, NAD+, and 0-50 µM Acetylated Peptide Substrate are incubated with 0-100 µM resveratrol at 25 °C. At 0, 3, 6, 9, 12, 15, 20, and 25 minutes, the reaction was stopped with 10% formic acid and the conversion of substrates to products determined by mass spectrometry. - Resveratrol was weighed and placed in a brown vial. The material was dissolved in 100% vehicle (DMSO) to yield a final concentration of 10 mM (stock solution). The stock solution was serially diluted with 100% DMSO in a deep well 96-well plate.
- Briefly, 337.5 µL of 10 mM resveratrol was pipetted into well A1 and serially diluted three-fold four times so that 112.5 µL of 10 mM stock was added to 225 µL of 100% DMSO and mixed 10 times with a pipette. This procedure resulted in 3.3 mM resveratrol stock in well A2, 1.1 mM resveratrol in well A3, 0.37 mM resveratrol in well A4, and 0.12 mM resveratrol in well A5. 25 µL of A1-A5 was transferred down the 96 well plate into rows B-H. Next, using an 8
channel pippetor 14 µL was withdrawn from column 1 (10 mM resveratrol) of the Mother Stock Plate and I µL was dispensed into waste and then 1 µL was distributed across a daughter plate into columns 1-12. This procedure yielded an entire 96 well plate containing 1 µL/well of 10 mM resveratrol. This procedure was repeated to create plates containing 1 µL/well of the 3.3, 1.1, 0.37, and 0.12 mM resveratrol. Two plates containing 1 µL/well of 100% DMSO were also generated in order to determine the Km in the presence of vehicle alone. - The Km of SIRT1 for the Acetylated Peptide Substrate was determined at 5 different concentrations of resveratrol and in the presence of vehicle alone. To determine the Km, the rate of conversion of substrate to product was determined at multiple time points in the linear range of the assay.
- Data are presented as the % of the Km in the presence of vehicle (% of DMSO Km) vs. resveratrol concentration (
Figure 10 ). Resveratrol decreased the Km of SIRT1 for peptide substrate in a dose dependent manner. The Km for peptide substrate decreased by 2%, 14%, 14%, 32%, and 46% at 1.2, 3.7, 11, 33, and 100 µM resveratrol, respectively. - The purpose of this example is to describe the effect of SIRT1 small molecule activators on the Km of SIRT1 for the Acetylated Peptide Substrate by mass spectrometry. The mechanism of activation appears to be due at least in part to a lowering of the Km for the peptide substrate. Assessing the magnitude of the Km effect provides a means for tracking the potency of compounds with a single value instead using both the EC50 and fold activation values. The Km50 which is determined as described in this example is defined as the concentration of compound required to lower the Km for the Acetylated Peptide Substrate by 50%. Based on the previous example, the Km50 for resveratrol is > 100 uM.
- Three test compounds were tested for their effect on the Km of SIRT1 for the acetylated peptide substrate and a Km50 was determined. These three compounds and the results are shown in the Table 4.
Table 4. Km50 for Indicated Compounds. COMPOUND NO STRUCTURE KM50 (UM) 115 
2.66 276 
0.327 142 
0.182 - The mass spectrometry assay is conducted as follows: 0.5 µM peptide substrate (SEQ ID NO: 34) and 120 µM βNAD+ is incubated with 10 nM SIRT1 for 25 minutes at 25°C in a reaction buffer (50 mM Tris-
acetate pH 8, 137 mM NaCl, 2.7 mM KCI, 1 mM MgCl2, 5 mM DTT, 0.05% BSA). Test compounds may be added to the reaction as described above. The SirT1 gene is cloned into a T7-promoter containing vector and transformed into BL21(DE3). After the 25 minute incubation with SIRT1, 10 µL of 10% formic acid is added to stop the reaction. Reactions are sealed and frozen for later mass spec analysis. Determination of the mass of the substrate peptide allows for precise determination of the degree of acetylation (i.e. starting material) as compared to deacetylated peptide (product). - For the mass spectrometry based assay, a control for inhibition of sirtuin activity is conducted by adding I µL of 500 mM nicotinamide as a negative control at the start of the reaction (e.g., permits determination of maximum sirtuin inhibition). A control for activation of sirtuin activity is conducted using 10 nM of sirtuin protein, with 1 µL of DMSO in place of compound, to determinine the amount of deacteylation of the substrate at a given timepoint within the linear range of the assay. This timepoint is the same as that used for test compounds and, within the linear range, the endpoint represents a change in velocity.
- Sirtuin modulating compounds that activated SIRT1 were identified using the assay described above and are shown below in Table 5. The ED50 values for the activating compounds in the mass spectromentry assay (MS) are represented by A (ED50 = <50 µM), B (ED50 = 51-100 µM), C (ED50 = 101-150 µM), and D (ED50 = >150 µM). NA means the compound was not active and NT means that the compound was not tested using the indicated assay. Fold activation, as determined by mass spectrometry (MS) is represented by A (Fold activation >250%), B (Fold Activation <250%), or C (no fold activation). The ED50 of resveratrol for activation of SIRT1 is 16 µM and the fold activation of resveratrol for SIRT1 in the MS assay is approximately 200%.
Table 5. ED50 and fold activation values for indicated compounds. COMPOUND NO STRUCTURE ED50 MS ASSAY FOLD ACTIVATION MS 19 
D C 20 
D C 21 
D C 22 
D C 24 
D C 27 
D C 29 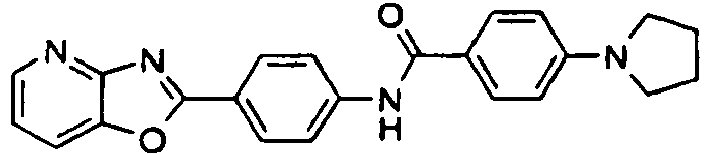
D C 31 
D C 32 
D C 33 
D C 34 
D C 35 
D C 36 
D C 37 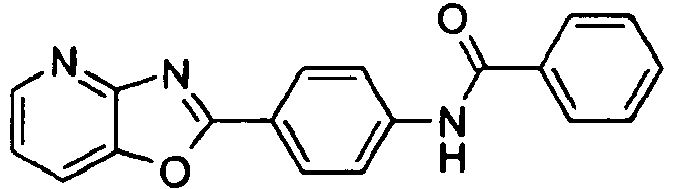
D C 38 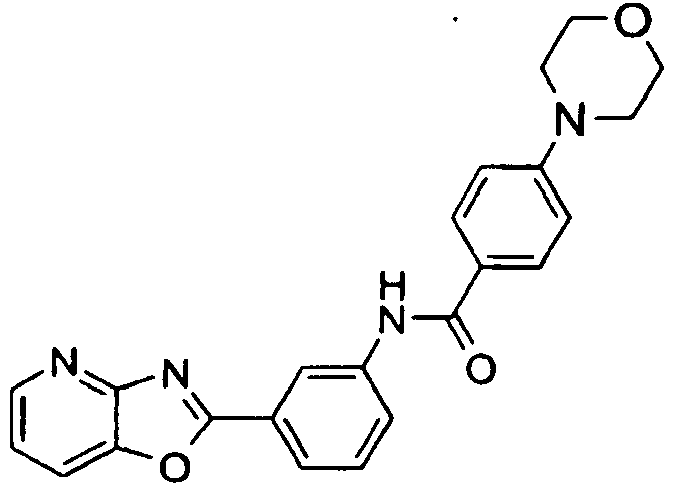
D C 39 
D C 40 
D C 41 
D C 42 
A B 43 
A B 45 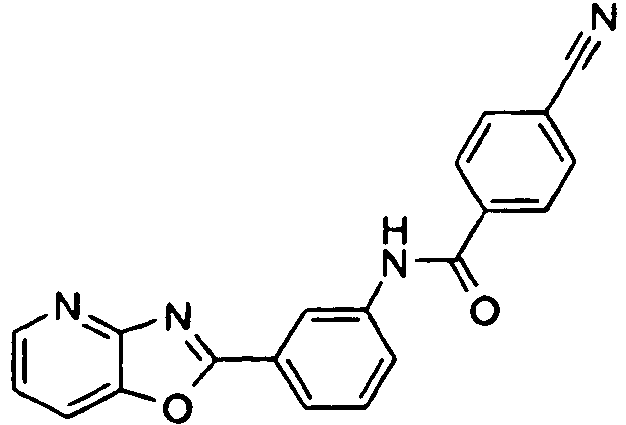
D C 46 
D C 48 
D C 49 
A B 50 
D 51 
A B 52 
A B 53 
D C 54 
D NT 55 
A B 56 
A B 57 
A NT 60 
A NT 63 
A NT 64 
A NT 66 
A NT 67 
A NT 68 
A NT 69 
A B 70 
A B 71 
A B 74 
D C 75 
A B 76 
A B 77 
A B 79 
D C 80 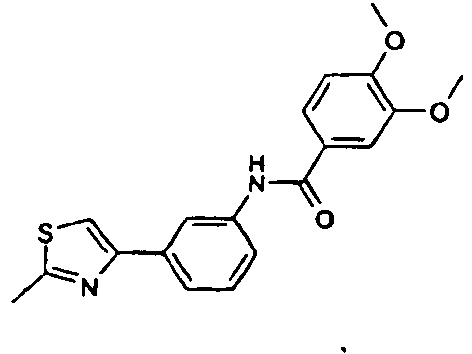
A B 81 
A B 82 
C NT 83 
A B 84 
A B 85 
D C 86 
D C 87 
D C 88 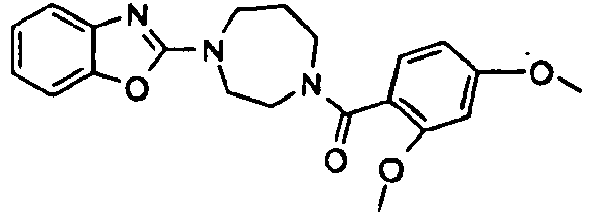
D C 89 
D C 91 
D C 92 
A B 93 
A B 94 
A B 95 
A B 96 
A B 97 
A B 98 
D C 99 
A A 100 
A B 101 
A A 102 
A A 103 
D C 104 
A B 105 
A B 106 
A B 107 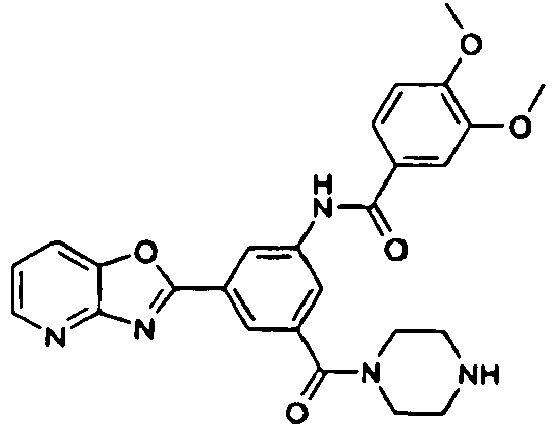
A B 108 
NA NT 109 
A B 110 
C NT 111 
A B 112 
A B 113 
A B 114 
A A 115 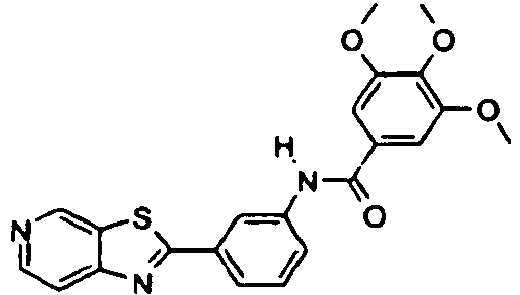
A A 116 
C NT 117 
A A 118 
A A 119 
A B 121 
D C 122 
C NT 124 
A B 125 
B B 126 
A B 127 
A A 128 
A B 129 
A A 130 
A B 131 
A A 132 
A A 133 
A B 134 
A B 135 
A B 136 
D C 137 
D NT 138 
A B 139 
A B 140 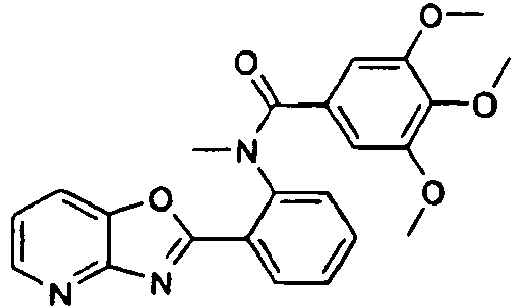
D NT 141 
A B 142 
A A 143 
D NT 144 
D C 145 
A B 146 
A B 147 
D NT 148 
D NT 149 
A B 150 
A B 151 
D C 152 
D C 153 
A B 154 
C A 155 
A B 156 
A B 157 
D B 158 
A B 159 
A B 160 
B A 161 
A A 162 
A B 163 
A B 164 
A B 165 
D A 166 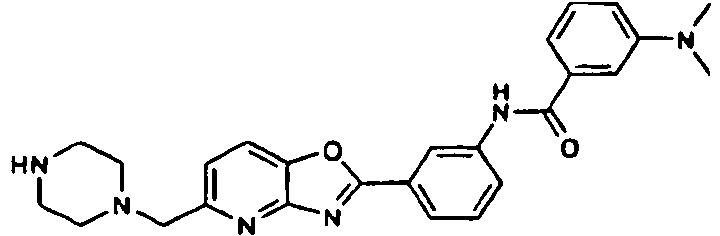
A B 167 
A B 168 
NA C 169 
A B 171 
NA C 172 
NA C 173 
NA C 174 
B A 175 
B B 176 
B B 177 
D B 178 
A A 179 
A A 180 
A B 181 
A A 182 
A A 183 
A A 184 
A B 185 
A A 186 
NA C 187 
A B 188 
NA C 189 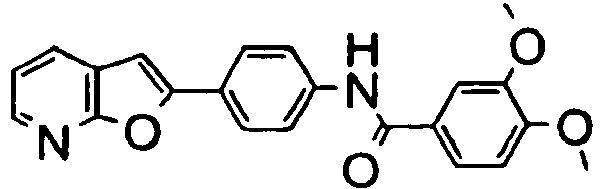
NA C 190 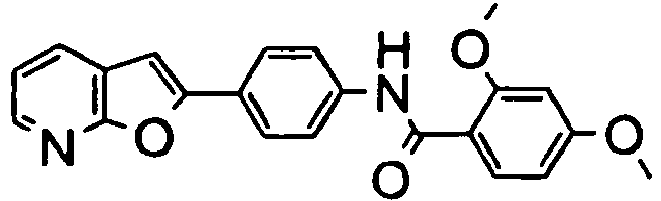
A B 191 
A B 192 
A B 193 
NA C 194 
NA C 195 
NA C 196 
A B 197 
A B 198 
A B 199 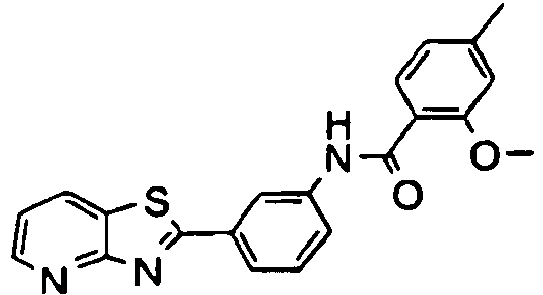
A B 200 
A B 201 
A B 202 
A B 203 
A B 204 
A A 205 
A A 206 
A A 207 
A A 208 
A A 209 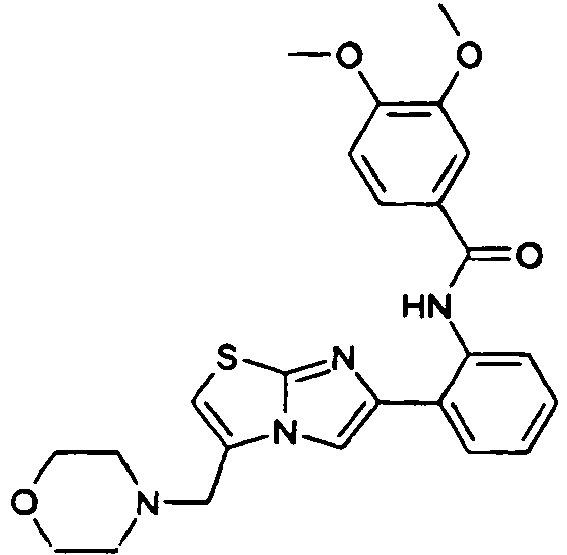
A A 210 
A B 211 
A B 212 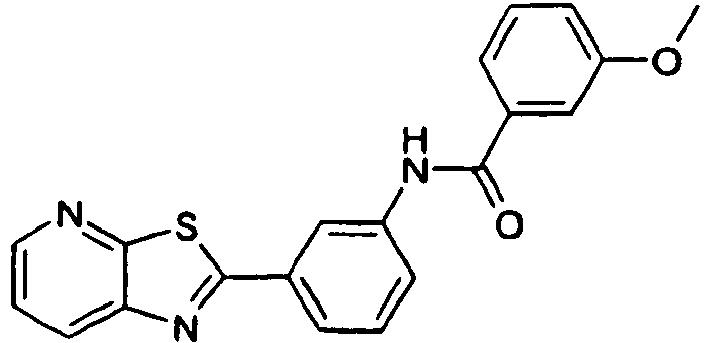
A B 213 
A B 214 
A B 215 
A B 216 
A B 217 
A A 218 
A A 219 
A A 220 
NA C 221 
A B 222 
A B 223 
A B 225 
NA C 227 
NA C 228 
A A 229 
NA C 230 
NA C 231 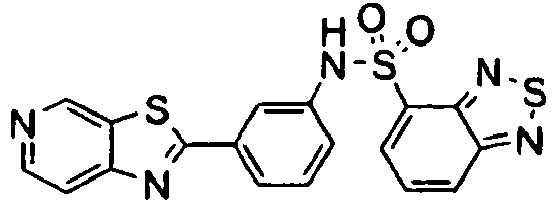
NA C 232 
NA C 234 
NA C 235 
NA C 236 
NA C 237 
NA C 238 
A B 239 
A B 240 
NA C 241 
A B 244 
NA C 245 
A B 246 
A B 247 
NA C 248 
A B 250 
NA C 251 
NA C 252 
NA C 253 
NA C 254 
A B 255 
A B 256 
NA C 257 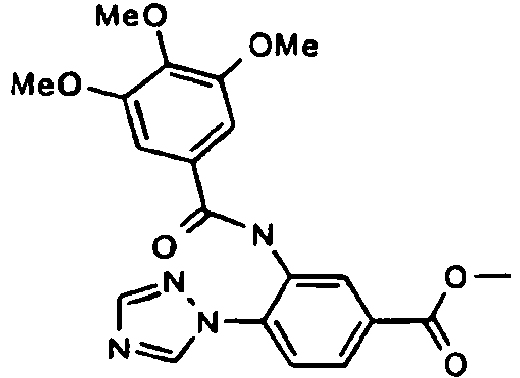
NA C 258 
A B 259 
A A 260 
A A 261 
A A 262 
A B 263 
A B 264 
A B 265 
A B 266 
A A 267 
A B 268 
A B 270 
A A 271 
A A 272 
A B 273 
A A 276 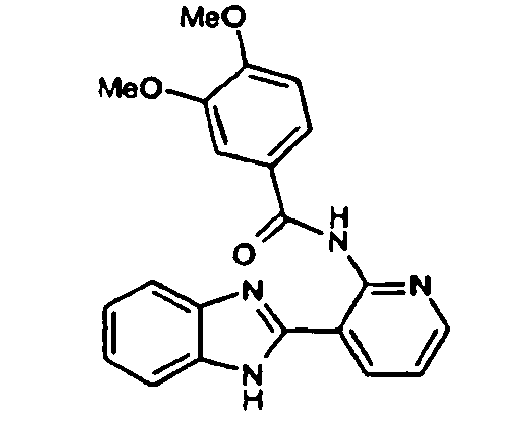
A B 282 
NA C 283 
NA C 284 
NA C 285 
NA C 286 
NA C 288 
A B 289 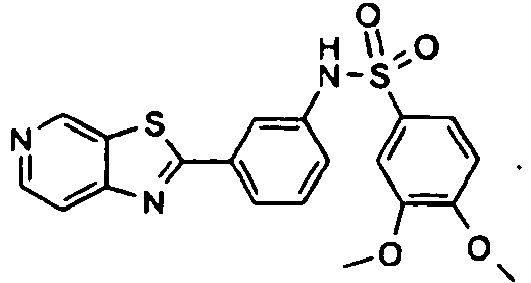
A B 290 
NA C - This example describes the effect of the SIRT1 activator, resveratrol on cellular ATP levels in NCI-H358 cells. Cellular ATP levels are an indirect measurement of cellular metabolic rates and, by extension, mitochondrial function. As SIRT1 activation has been linked to increased mitochondrial biogenesis in vivo, this study is designed to determine if resveratrol increases mitochondrial function, using cellular ATP levels as the readout. The ATP assay is combined with a cellular viability assay so that cellular ATP levels can be normalized to viable cells. Cellular ATP levels were measured using the
ATPLite 1 Step Kit (PerkinElmer) and cellular viability was measured using the cell permeable dye, AlamarBlue™. - The Cellular ATP Assay is a multiplexed assay that measures both ATP levels and viability of a given cell sample. This assay is run in a 96-well Assay Plate and data are reported as the [ATP]/viability for each well in the Assay Plate.
- The
ATPLite 1 Step ™ Kit is a single-step luminescent cell-based assay for detection of ATP. The kit contains lyophilized substrate mixture, comprised of D-luciferin and the firefly (Photinus pyralis) enzyme luciferase. Additionally, the kit contains a detergent-based reconstitution buffer that induces the lysis of cellular membranes. The luciferase in the assay mixture catalyzes a reaction between the free cellular ATP and D-luciferin to produce bioluminescence according to the schematic reaction outlined below. The amount of light produced is proportional to the cellular ATP concentration. - The AlamarBlue™ Assay is a single-step assay that utilizes a soluble, non-toxic, cell permeable dye that is added to cell growth media. This dye undergoes electron reduction in viable cells but not dead cells. The reduced dye product gives a fluorescent signal which can be monitored with a fluorescence plate reader (excitation 545 nm and emission 575 nm). The amount of fluorescence generated in a given well is proportional to the number of viable cells. The viability signal generated by this assay is used to normalize the ATP signal from the ATPLite I Step™ assay results.
- Preparation of Test Substance for Cellular ATP Assay: resveratrol was weighed and placed in a brown vial. The material was dissolved in 100% vehicle (DMSO) to yield a final concentration of 10 mM (stock solution). The stock solution was serially diluted with 100% DMSO as described in SOP 7.10. The final concentrations of Resveratrol in the compound plate were 0.008, 0.023, 0.069, 0.206, 0.617, 1.852, 5.556, 16.667, 50 and 150 µM.
- The effect of resveratrol on cellular ATP levels in NCI-H358 cells (100 µL) was examined using the Cellular ATP Assay as described. The experimental design is summarized in
Figure 11 . In this assay NCI-H358 cells (obtained from the American Tissue Culture Collection, ATCC) were seeded in 96 well microplates (104 cells/well). The NCI-H358 Growth Culture Media consists of RPM1 1640 Media supplemented with 10% FBS, 100 mg/mL streptomycin, and 100 units/mL penicillin. Three replicate cell microplates were treated with 15 µL of 10 concentrations of resveratrol (0.008, 0.023, 0.069, 0.206, 0.617, 1.852, 5.556, 16.667, 50 and 150 µM) or 15 µL vehicle (DMSO; final concentration of 0.5%; 12 replicates per plate). After 48 hours of compound treatment under cell growth conditions, plates were removed from the incubator, and 15 µl of AlamarBlue™ dye was added to each well. Cell microplates were incubated with dye for 2 hours under growth conditions, and fluorescence was subsequently measured using a plate reader. Media containing AlamarBlue™ was removed, and plates were washed in 100 µl of PBS per well. This wash was removed, and 200 µl ofI x ATPLite 1 Step reagent was added to each well. Luminescence was then measured using a plate reader. The ATP signal for each well, measured by the luminescence scan, was normalized to its coresponding cell viability value, measured by the fluorescence scan, to generate the average ATP level per viable cell unit (ATP/vCell). The ATP/vCell for each treatment was then normalized to the average vehicle ATP/vCell for its respective cell microplate, yielding the normalized ATP/vCell (norm. ATP/vCell). Finally, the norm. ATP/vCell for each unique treatment was averaged across plate replicates, generating the average norm. ATP/vCell. Doses of resveratrol that increase cellular ATP levels have normalized ATP/vCell values greater than 1.0. The concentration of resveratrol which gives the 50% of the maximum increase in normalized ATP/vCell (EC50 ATP) was determined by a best fit curve analysis using a sigmoidal dose-response curve model. - The ATP levels of cells treated with 10 concentrations of resveratrol or vehicle alone were measured. Each of these ATP levels was normalized to the cell viability in the corresponding treatment well, generating the ATP/vCell value. Each ATP/vCell value was subsequently normalized to its average Vehicle ATP/vCell values for its respective cell microplate.
- Data are represented as the normalized ATP/vCell (arbitrary units).
Figure 12 shows the best-fit, sigmoidal dose-response curve for the 10 concentrations of resveratrol plotted against their corresponding normalized ATP/vCell values. These values represent an average of three plate replicates, resveratrol increases cellular ATP levels in NCI-H358 cells in a dose-dependent manner. The maximum increase in cellular ATP levels was 3.0 fold and occurred with treatment of 50 µM resveratrol. The EC50 ATP for resveratrol was determined to be 29 µM. - A number of compounds were screened for their affect on ATP levels in the assay as described in Example 8. Results are shown in Table 6. The ED50 values for compounds that raised intracellular ATP levels are represented by A (ED50 = <50 µM), B (ED50 = 51-100 µM), C (ED50 = 101-150 µM), and D (ED50 = > 150 µM). NA means that the compound was not tested using the indicated assay. Similarly, the IC50 values for the compounds that lowered intracellular ATP levels are represented by A (IC50 = <50 µM), B (IC50 = 51-100 µM), C (IC50 = 101-150 µM), and D (IC50 = >150 µM).
Table 6. ED50 values for IC50 values for sirtuin activating and inhibiting compounds, respectively. COMPOUND NO STRUCTURE ED50 ATP ASSAY IC50 ATP ASSAY 11 
A 52 
A 118 
D 120 
A 42 
A 49 
A 115 
D 79 
A 117 
B 120 
A 121 
NA 123 
D 85 
NA 86 
A 87 
NA 88 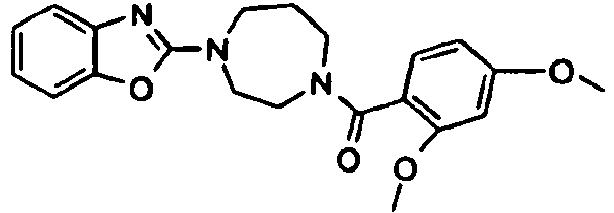
NA 89 
A 90 
D 91 
A 92 
B 93 
D 94 
D 95 
NA 97 
A 98 
NA 99 
A 100 
A 101 
C 102 
A 103 
NA 104 
A 105 
A 133 
NA 134 
NA 135 
A 106 
A - Western blot experiments were conducted to identify cell lines that had relatively low endogenous SIRT1 expression levels. The goal was to identify cell lines in which SIRT1 activity was not saturating so that an increase in SIRT1 activity upon exposure of the cell to a sirtuin activating compound would be observable in the cellular ATP assay described above. The opposite approach would be taken to identify sirtuin inhibiting compounds, i.e. cells with high endogenous SIRT1 expression levels would be preferred.
-
Figure 13 shows the results of a western blot experiment to determine the levels ofSIRT 1 expression levels in a variety of cell lines. Equal amounts of cell lysates were analyzed by western analysis for expression of endogenous SIRT1. Blots were probed with a primary rabbit polyclonal antibody to SIRT1 (Abcam, Cat. # AB 13749) and a secondary goat anti-rabbit IgG conjugated to HRP (Santa Cruz, Cat.# SC-2054). As can be seen, SIRT1 expression varies widely across different cell lines with maximum expression observed in HEK293 and minimal expression observed in IMR90 and H358 cells. -
Figure 14 shows the results of a western blot experiment to determine expression levels of SIRT1 protein normalized to the expression level of tubulin in a variety of cell lines. Western analysis of a panel of human cell lines looking at expression levels of SIRT1 protein. SIRT1 expression was normalized to alpha tubulin expression. All samples were assayed in duplicate. Protein quantification was preformed using infrared dye labeled secondary antibodies followed by blot scan using the Licor® Odyssey® scanner. The primary antibodies used are mouse monoclonal to alpha tubulin, (Santa Cruz Biotech, Cat # SC-8035) and rabbit polyclonal to SIRT I (Abcam, Cat. # AB 13749). Secondary antibody used for SIRT1 detection was IRDye 800 conjugated Anti-Rabbit IgG (Goat) (Rockland Immunochemicals, Cat.# 611-132-122) and for tubulin expression was AlexaFluor 680 goat anti-mouse IgG (InVitrogen Cat. # A21057). - The cell lines were also tested in the cellular ATP assays described above to identify cell lines that had relatively lower levels of mitochondria and/or oxidative phosphorylation such that an increase in ATP levels upon exposure to a sirtuin activating compound would be observable. Cell lines NCl-H358 and MCF7 were identified as suitable cell lines for conducting the cellular ATP assays described above. Both cell lines had relatively low endogenous levels of SIRT1 expression and permitted observation of an increase in ATP levels upon exposure to a sirtuin activating compound.
- Western blots were conducted to correlate an observed increase in cellular ATP levels upon exposure of cells to a sirtuin activating compound to an increase in mitochondrial mass. Levels of three different independent markers of mitochondrial mass were determined by western blot analysis following exposure of cells to the sirtuin activator resveratrol. Observed increases in cellular ATP levels upon treatment with resveratrol correlated with increases in the levels of mitochondrial mass biomarkers.
-
Figure 15 shows the results of a western blot experiment to determine the levels of several mitochondrial mass biomarkers after exposure of cells to various concentrations of resveratrol. NCI-H538 cells were treated for 48 hours with either 0, 1, 10 or 100 uM resveratrol. Cell lysates were then prepared and specific mitochondrial proteins were quantitated by western analysis using antibodies specific to the following proteins: Succinate-Ubiquinol Oxidoreductase (Mitochondrial Complex II Protein, mouse monoclonal, InVitrogen, Cat. #A11142); ATP synthase F1 F0 (Mitochondrial Complex V Protein, mouse monoclonal, InVitrogen, Cat.# A21350); NADH-Ubiquinol Oxidoreductase (Mitochondrial Complex I Protein, mouse monoclonal, InVitrogen, Cat. #A21344). Normalization was to alpha tubulin using a rabbit polyclonal (Santa Cruz Biotech, Cat # SC-9104). Secondary antibody used for specific protein detection was AlexaFluor 680 conjugated Anti-Rabbit IgG (Goat) (Rockland Immunochemicals, Cat.# 610-132-121) and for tubulin expression was IRDye 800 goat anti-mouse IgG (InVitrogen Cat. # A21076). Protein quantification was preformed using infrared dye labeled secondary antibodies followed by blot scan using the Licor® Odyssey® scanner. - The following example describes an alternative mass spec based assay for determination of Sirt1 deacetylase activity. Instead of relying on purified or recombinant enzyme, the reaction utilizes endogenous Sirt1 enzyme from cell or tissue extracts. This allows for the determination of endogenous sirtuin activity. The cells or tissues can be pretreated with Sirt1 modulators or other control compounds either following isolation or following pharmacological intervention in vivo. Alternatively, this measurement of endogenous sirtuin activity can be measured in various clinical samples following physiological manipulation (diet, exercise, age, disease progression, etc.) or following pharmacological intervention including studies designed to study dose responsiveness and escalation, vehicle or placebo control, dosing regimen, drug combination and synergy, etc.
- A procedure for isolating viable (living) white blood cells (WBC) (also called "Peripheral Blood Mononuclear Cells") from whole blood is provided. This procedure is based on approximately 6 ml of whole blood (Vacutainer format). This is the content of a standard tube (Becton Dickinson Vacutainer™ CPT™ Cell Preparation Tubes with Sodium Heparin, cat.# 362753). Mix the blood before centrifugation by 10 times gently inverting the tube up and down. Centrifuge the CPT-
tubes 20 minutes at 1700 RCF (3100 RPM) at room temperature (18-25°C) with the brake off. Open the CPT tube and remove the plasma (4 ml) without disturbing the cell phase. Store the plasma if necessary. Remove the cell phase (ca. 2 ml, containing WBC, platelets and some plasma) with a plastic Pasteur (transfer) pipette and transfer this phase to a 15 ml conical Falcon-tube. Add phosphate buffered saline (PBS) to the cells to bring the volume up to 13 ml. Mix carefully by inverting the tube. Centrifuge the 15 ml conical tube at 300 RCF (1200 RPM) for 15 minutes at room temperature (18-25°C, no brake). Aspirate the supernatant (PBS, platelets and some plasma) without disturbing the cell pellet, and resuspend the cell pellet (WBC) in the remaining PBS (approximately 200 µl). Add PBS to the remaining cell suspension to bring the volume up to 13 ml, mix carefully by inverting the tube. Centrifuge at room temperature at 300 RCF (1200 RPM) for 15 minutes at room temperature (18-25°C, no brake). Aspirate the supernatant without disturbing the cell pellet, and resuspend the cell pellet in the remaining PBS (approximately 200 µl). Add PBS to the remaining cell suspension to bring the volume up to 10 ml, mix carefully by inverting the tube. Centrifuge at room temperature at 300 RCF (1200 RPM) for 15 minutes at room temperature (18-25°C, no brake). Aspirate the supernatant without disturbing the cell pellet. From this point keep the cells on ice. - Add 1 ml Freeze Medium without FBS (RPMI Medium 1640 with L-Glutamine; DMSO (dimethyl sulfoxide), 10% (vol:vol) final) to the remaining cell pellet and resuspend the cells gently. For some uses where plasma proteins do not interfere with the assay, e.g. for mtDNA quantification (but NOT for CS activity measurement), the WBC pellet can be resuspended and frozen in Freeze Medium with FBS (RPMI Medium 1640 with L-Glutamine; DMSO (dimethyl sulfoxide), 10% (vol:vol) final; FBS (Fetal Bovine Serum), heat inactivated 30 minutes at 56°C, 20% (vol:vol) final. Plasma proteins help maintain cell integrity when frozen. Once the Freeze Medium is added the cells must remain on wet ice for the remainder of the process and should be frozen as soon as possible. Transfer the cell suspension into cryovials (2 aliquots of 0.5 ml per sample). Freeze the cryovials by placing them into a -80°C freezer. Keep the WBC samples at -80°C until use. Six mililiters of blood gives around 10 million WBC, containing around 4 µg total RNA, 40 µg total cell proteins and 0.15 ng SIRT1 protein.
- 600-800 million WBC corresponding to ∼0.26nM of SIRT1 in 20 µL of final lysate are used for a standard experiment to measure the activity of SIRT1 with five time points in triplicate for two given sets of experiments. The amount of SIRT1 in each preparation is determined initially by Western-Blot analysis using different amounts of WBC with a given SIRT1 standard (purified SIRT1, bacterially expressed).
- The WBC are thawed and collected in a single 15mL falcon tube at 4 degrees Celsius. The assay buffer consists of 10x reaction buffer, 5mM DTT and 0.05% BSA. The reaction buffer is prepared as a 10x stock and consists of 500 mM Tris HCl pH 8.0, 1370 mM NaCl, 27 mM KCI, and 10 mM MgCl2. The buffer is stored at room temperature. Prior to use the final assay buffer is chilled at 4 degrees Celsius. 700 µL of assay buffer is added to the collected WBC and gently mixed. Cells are sonicated on ice for 2 minutes with intervals (15 seconds sonication, 30 seconds pause) at a power output level of 1.5 with a small sonicator probe (Virsonic sonicator). The sonicated cells are centrifuged for 5 minutes at 3000 rpm and the supernatant (referred to as "lysate") is removed for further use in the activity assay.
- Alternatively, lysates can be prepared from tissue, such as liver, fat or muscle. Typically, two to six pieces of one liver (approx, 500mg) or two pieces of muscle (approx, 180mg) corresponding to ∼0.26nM of SIRT1 in 20µL of final lysate are used for a standard experiment to measure the activity of SIRT1 with five time points in triplicate for two given sets of experiment. The amount of SIRT1 in each preparation is again determined initially by Western-Blot analysis using different amounts of mouse liver lysates or muscle lysates with a given SIRT1 standard (purified SIRT1, bacterially expressed). 700 µL of assay buffer are added to the collected tissues and gently mixed. Then these tissues are homogenized on ice using a Polytron for 20 seconds at maximum speed. (Omni International GLH). The homogenized tissues are centrifuged for 5 minutes at 13,000 rpm and the supernatant (referred to as "lysate") is removed for further use in the activity assay.
- Finally, lysates can also be prepared from cell lines, such as those derived from liver, muscle, fat etc. The following describes preparation of lysates from myoblast C2C12 cell line. Myoblast cells are grown to 80% confluence and harvested with TrypLE (Invitrogen), then washed twice with PBS buffer (Invitrogen) and stored at -80 degree Celsius prior to use. A C2C12 myoblast cell pellet ~100 to 200mg corresponding to ~0.26nM of SIRT1 in 20µL of final lysate is used for a standard experiment to measure the activity of SIRT1 with five time points in triplicate for two given sets of experiment. The amount of SIRT1 in each preparation is determined initially by Western-Blot analysis using different amounts of cells with a given SIRT1 standard (purified SIRTI, bacterially expressed). 700 µL of assay buffer are added to the collected myoblast cells and gently mixed. Then these cells are sonicated on ice for 2 minutes with intervals (15 seconds sonication, 30 seconds pause) at a power output level of 1.5 with a small sonicator probe (Virsonic sonicator). The sonicated cells are centrifuged for 5 minutes at 3000 rpm and the supernatant (referred as "lysate") is removed for further use in the activity assay. 20uL of lysate are taken typically for one well of a 96 well plate with a final total reaction volume of 100uL.
- 20uL of lysate are taken typically for one well of a 96 well plate with a final total reaction volume of 100uL. 1µL of DMSO is added to each of the wells to give a final concentration of 1%. 29uL of assay buffer are added to an initial volume of 50uL. Stop buffer (10% trichloroacetic acid and 500mM Nicotinamide) is added to the wells designated to zero time points. The activity assay is started by adding 50uL of substrate buffer to each well. The substrate buffer consists of 20µM Tamra peptide Ac-Glu-Glu-Lys(Biotin)-Gly-Gln-Ser-Thr-Ser-Ser-His-Ser-Lys(Ac)-Nle-Ser-Thr-Glu-Gly-Lys(5TMR)-Glu-Glu-NH2 (SEQ ID NO: 34) wherein K(Ac) is an acetylated lysine residue and Nle is a norleucine. The peptide is labeled with the fluorophore 5TMR (excitation 540 nm/emission 580 nm) at the C-terminus for use in the FP assay described above. The peptide substrate is prepared as a 1 mM stock in distilled water and stored in aliquots at -20°C), 5mM DTT, 0.05% BSA, 4mM NAD+ and 10x reaction buffer. The reaction is performed at room termperature. For each time point the reaction will be stopped with stop buffer. After the final time point is collected the plates are sealed and analyzed by mass spectrometry.
- As controls, specific SIRT1 and HDAC inhibitors are also included in the assay. Lysate volumes are adjusted accordingly to the amount needed for this inhibition assay. The following inhibitors are used with their respective final concentrations: 6-chloro-2,3,4,9-tetrahydro-1-H-carbazole-1-carboxamide (5µM), TSA (1µM) and nicotinamide (5mM). 6-chloro-2,3,4,9-tetrahydro-1-H-carbazole-1-carboxamide and TSA are prepared in DMSO. Nicotinamide preparations are made in water. The final concentration of DMSO in each well is 1%. 1µL of DMSO is added to wells containing Nicotinamide as inhibitor. The reactions are run in duplicate over a time period of 90 to 120 minutes with at least 5 time points taken.
- Assay plates are transferred to BioTrove, Inc. (Woburn, MA) on dry ice for mass spectrometry analysis. Thawed reactions are analyzed using an Agilent 1100 HPLC with a microplate autosampler linked in series with a Sciex API-4000 mass spectrometer. Proprietary equipment (developed by BioTrove, Inc.) has been incorporated into this LC-MS system to allow for rapid sampling and rapid sample clean-up (4-5 sec per well). Both substrate and product are tracked in the MS and the area of the MS curve for both product and substrate are reported back in arbitrary units.
- Using Microsoft Excel, plot product on the x axis and reaction time on the y axis of a xy scatter plot. The reaction is run at saturating substrate conditions with deliver a maximal turnover of substrate to product over a fixed time period, necessary for the detection of the activity of SIRT1. The final readout will be a number/slope describing product accumulation/time/ng of enzyme. Inhibition of the enzymatic activity of SIRT1 results in low product yields that enable the differentiation between HDAC's and SIRT1.
-
Figures 16A and 16B show the results of sirtuin activity in cell lysates as determined using mass spectrometry.Figure 16A shows sirtuin activity in lysates of C2C12 cells that were pretreated as indicated andFigure 16B shows sirtuin activity in lysates of human peripheral white blood cells that were pretreated as indicated. - Any polynucleotide and polypeptide sequences which reference an accession number correlate to an entry in a public database, such as those maintained by The Institute for Genomic Research (TIGR) (www.tigr.org) and/or the National Center for Biotechnology Information (NCBI) (www.ncbi.nlm.nih.gov).
Claims (15)
- A method for identifying a compound that activates a sirtuin, comprising:contacting a peptide substrate pool with a sirtuin in the presence of a test compound, wherein the concentration of peptide substrate in the peptide substrate pool is below the Km of the sirtuin for the peptide substrate, and wherein members of said peptide substrate pool comprise at least one acetylated lysine residue, anddetermining the level of acetylation of the peptide substrate pool using mass spectrometry, wherein a decrease in the level of acetylation of the peptide substrate pool in the presence of the test compound as compared to a control reaction in which the test compound is not included is indicative of a compound that activates a sirtuin.
- The method of claim 1, wherein the compound is a small molecule.
- A method for determining the deacetylase activity of a sirtuin, comprising:(a) contacting a peptide substrate pool with a sirtuin, wherein the concentration of peptide substrate in the peptide substrate pool is below the Km of the sirtuin for the peptide substrate, and wherein the members of said substrate pool comprise at least one acetylated lysine residue; and(b) determining the level of acetylation of the peptide substrate pool using mass spectrometry, wherein a decrease in the level of acetylation of the peptide substrate pool is indicative of sirtuin deacetylase activity.
- The method of any of claims 1-3, wherein the concentration of peptide substrate in the peptide substrate pool is at least 2-fold below the Km of the deacetylase for the peptide substrate.
- The method of claim 4, wherein the concentration of peptide substrate in the peptide substrate pool is at least 10 fold below the Km of the deacetylase for the peptide substrate.
- The method of any of claims 1-3, further comprising determining the Km of the deacetylase for the peptide substrate pool.
- The method of any of claims 1-6, which is performed in high-throughput format.
- The method of claim 1 or 3, wherein the sequence of the peptide substrate is derived from p53.
- The method of any of claims 1-3, wherein the substrate peptide pool comprises a single peptide species.
- The method of any of claims 1-3, wherein the substrate peptide pool comprises a mixture of two or more peptides.
- The method of claim 1 or 3, wherein the sirtuin is a SIRT1 protein.
- The method of claim 1, wherein a compound that activates a sirtuin to a greater extent than resveratrol is identified.
- The method of claim 12, wherein a compound that has sirtuin activating activity at least 5-fold greater than the sirtuin activating activity of resveratrol is identified.
- The method of any of claims 1-3, wherein the mass spectrometry is electrospray ionization (ESI) mass spectrometry or matrix-assisted laser desorption/ionization (MALDI) mass spectrometry.
- The method of any of claims 1 or 2, wherein the control reaction includes a compound having a known effect on deacetylase activity.
Applications Claiming Priority (4)
| Application Number | Priority Date | Filing Date | Title |
|---|---|---|---|
| US74178305P | 2005-12-02 | 2005-12-02 | |
| US79212606P | 2006-04-14 | 2006-04-14 | |
| US85937106P | 2006-11-15 | 2006-11-15 | |
| PCT/US2006/046021 WO2007064902A2 (en) | 2005-12-02 | 2006-12-01 | Mass spectrometry assays for acetyltransferase/deacetylase activity |
Publications (2)
| Publication Number | Publication Date |
|---|---|
| EP1955077A2 EP1955077A2 (en) | 2008-08-13 |
| EP1955077B1 true EP1955077B1 (en) | 2012-06-13 |
Family
ID=37907283
Family Applications (1)
| Application Number | Title | Priority Date | Filing Date |
|---|---|---|---|
| EP06844714A Not-in-force EP1955077B1 (en) | 2005-12-02 | 2006-12-01 | Mass spectrometry assays for acetyltransferase/deacetylase activity |
Country Status (4)
| Country | Link |
|---|---|
| US (1) | US8304206B2 (en) |
| EP (1) | EP1955077B1 (en) |
| ES (1) | ES2389111T3 (en) |
| WO (1) | WO2007064902A2 (en) |
Families Citing this family (21)
| Publication number | Priority date | Publication date | Assignee | Title |
|---|---|---|---|---|
| WO2006094239A2 (en) * | 2005-03-03 | 2006-09-08 | Sirtris Pharmaceuticals, Inc. | Fluorescence polarization assays for acetyltransferase/deacetylase activity |
| RU2364597C1 (en) * | 2007-12-14 | 2009-08-20 | Андрей Александрович Иващенко | HETEROCYCLIC INHIBITORS OF Hh-SYGNAL CASCADE, BASED ON THEM MEDICINAL COMPOSITIONS AND METHOD OF TREATING DISEASES INDUCED BY ABBARANT ACTIVITY OF Hh-SIGNAL SYSTEM |
| EA021938B1 (en) | 2008-05-01 | 2015-10-30 | Сертрис Фармасьютикалз, Инк. | Quenolines and related analogs as sirtuin modulators |
| KR20110036602A (en) | 2008-07-03 | 2011-04-07 | 서트리스 파마슈티컬즈, 인코포레이티드 | Benzimidazole and related analogs as sirtuin modulators |
| AU2009295948B2 (en) | 2008-09-29 | 2013-12-05 | GlaxoSmithKline, LLC | Quinazolinone, quinolone and related analogs as sirtuin modulators |
| EA020609B1 (en) | 2009-05-05 | 2014-12-30 | ОБЩЕСТВО С ОГРАНИЧЕННОЙ ОТВЕТСТВЕННОСТЬЮ "ИННОВАЦИОННАЯ ФАРМАЦЕВТИКА" (ООО "иФАРМА") | IMIDAZO[1,2-a]PYRIDIN-2-YLPHENYL DERIVATIVES TO BE USED IN CANCER TREATMENT |
| US9556201B2 (en) | 2009-10-29 | 2017-01-31 | Glaxosmithkline Llc | Bicyclic pyridines and analogs as sirtuin modulators |
| EP2993236A1 (en) * | 2010-04-15 | 2016-03-09 | Glaxosmithkline LLC | Sirtuin activators and activation assays |
| WO2011139387A1 (en) | 2010-05-03 | 2011-11-10 | Opko Curna, Llc | Treatment of sirtuin (sirt) related diseases by inhibition of natural antisense transcript to a sirtuin (sirt) |
| US8916528B2 (en) | 2011-11-16 | 2014-12-23 | Resveratrol Partners, Llc | Compositions containing resveratrol and nucleotides |
| US10788492B2 (en) | 2014-01-15 | 2020-09-29 | The Trustees Of Princeton University | SIRT4 lipoamidase activity and uses thereof |
| US10393710B2 (en) * | 2015-10-31 | 2019-08-27 | Mls Acq, Inc. | Coupled analytical instruments for dual mode FTIR/GC-FTIR |
| US10859552B2 (en) * | 2017-06-20 | 2020-12-08 | The Hong Kong Polytechnic University | Edible oil analysis system and method |
| WO2019099564A1 (en) | 2017-11-14 | 2019-05-23 | Children's Medical Center Corporation | Novel imidazopyrimidine compounds and uses thereof |
| US11730810B2 (en) | 2017-11-14 | 2023-08-22 | Children's Medical Center Corporation | Composition comprising an antigen and a substituted imidazo[1,2-a]pyrimidine for enhancing human immune response |
| JP7536767B2 (en) | 2018-12-31 | 2024-08-20 | バイオメア フュージョン,インコーポレイテッド | Irreversible inhibitors of menin-mll interaction |
| US11174263B2 (en) | 2018-12-31 | 2021-11-16 | Biomea Fusion, Inc. | Inhibitors of menin-MLL interaction |
| CA3228627A1 (en) | 2021-08-11 | 2023-02-16 | Thomas Butler | Covalent inhibitors of menin-mll interaction for diabetes mellitus |
| KR20240087693A (en) | 2021-08-20 | 2024-06-19 | 바이오메아 퓨전, 인크. | N-[4-[4-(4-morpholinyl)-7H-pyrrolo[2,3-D]pyrimidin-6-yl]phenyl]-4-, an irreversible menin-MLL inhibitor for cancer treatment. Crystalline form of [[3(R)-[(1-oxo-2-propen-1-yl)amino]-1-piperidinyl]methyl]-2-pyridinecarboxamide |
| EP4265247A1 (en) * | 2022-04-22 | 2023-10-25 | Université Paris Cité | Compounds inducing production of proteins by immune cells |
| TW202430528A (en) | 2023-01-18 | 2024-08-01 | 美商拜歐米富士恩股份有限公司 | Crystalline forms of n-[4-[4-(4-morpholinyl)-7h-pyrrolo[2,3-d]pyrimidin-6-yl]phenyl]-4-[[3(r)-[(1-oxo-2-propen-1-yl)amino]-1-piperidinyl]methyl]-2-pyridinecarboxamide as a covalent inhibitor of menin-mll interaction |
Citations (1)
| Publication number | Priority date | Publication date | Assignee | Title |
|---|---|---|---|---|
| WO2006094235A1 (en) * | 2005-03-03 | 2006-09-08 | Sirtris Pharmaceuticals, Inc. | Fused heterocyclic compounds and their use as sirtuin modulators |
Family Cites Families (43)
| Publication number | Priority date | Publication date | Assignee | Title |
|---|---|---|---|---|
| US3933592A (en) | 1965-02-17 | 1976-01-20 | Hazleton Laboratories, Incorporated | Method of detecting living microorganisms |
| GB1604249A (en) | 1977-05-31 | 1981-12-02 | Kolehmainen S | Selective measurement of somatic and microbial cells |
| US4683195A (en) | 1986-01-30 | 1987-07-28 | Cetus Corporation | Process for amplifying, detecting, and/or-cloning nucleic acid sequences |
| US5223409A (en) | 1988-09-02 | 1993-06-29 | Protein Engineering Corp. | Directed evolution of novel binding proteins |
| GB9100551D0 (en) | 1991-01-10 | 1991-02-20 | Amersham Int Plc | Method and reagent for eliminating analytical interference in enzymatic analysis from substances used for extraction of intracellular metabolites |
| GB9224058D0 (en) | 1992-11-17 | 1993-01-06 | Celsis Ltd | Bioluminescence reagent formulation |
| AT401526B (en) | 1993-02-10 | 1996-09-25 | Scheirer Winfried | REAGENT SOLUTION TO STABILIZE LUMINESCENCE IN LUCIFERASE MEASUREMENT |
| GB9626932D0 (en) | 1996-12-24 | 1997-02-12 | Lumitech Limited | Assay methods and kits therefor |
| US6323482B1 (en) | 1997-06-02 | 2001-11-27 | Advanced Research And Technology Institute, Inc. | Ion mobility and mass spectrometer |
| WO1999001889A1 (en) | 1997-07-02 | 1999-01-14 | Merck & Co., Inc. | Novel mass spectrometer |
| US5976813A (en) | 1997-12-12 | 1999-11-02 | Abbott Laboratories | Continuous format high throughput screening |
| CA2227806C (en) | 1998-01-23 | 2006-07-18 | University Of Manitoba | Spectrometer provided with pulsed ion source and transmission device to damp ion motion and method of use |
| NL1010224C2 (en) | 1998-09-30 | 2000-03-31 | Packard Biosciene B V | Method for detecting ATP. |
| CA2255122C (en) | 1998-12-04 | 2007-10-09 | Mds Inc. | Improvements in ms/ms methods for a quadrupole/time of flight tandem mass spectrometer |
| US6504148B1 (en) | 1999-05-27 | 2003-01-07 | Mds Inc. | Quadrupole mass spectrometer with ION traps to enhance sensitivity |
| EP1196940A2 (en) | 1999-06-11 | 2002-04-17 | Perseptive Biosystems, Inc. | Tandem time-of-flight mass spectometer with damping in collision cell and method for use |
| JP2001149081A (en) | 1999-11-29 | 2001-06-05 | Cyclex Co Ltd | Method for assaying activities of deacetylases, and method for screening inhibitor or activator of these enzymes |
| US20010046687A1 (en) | 2000-03-31 | 2001-11-29 | Dicesare Joseph L. | Method for the enhancement of luminescence intensity from a reaction between adenosine triphosphate (ATP) and a luciferase/luciferin reactant system |
| EP1156114A1 (en) | 2000-05-10 | 2001-11-21 | Europäisches Laboratorium für Molekularbiologie | Vectors for use in transponson-based DNA sequencing methods |
| AU2001272238A1 (en) | 2000-06-22 | 2002-01-02 | Mcgill University | CLK-2, CEX-7 and COQ-4 genes, and uses thereof |
| DE60125783T2 (en) * | 2000-08-11 | 2007-10-18 | Evotec Ag | METHOD FOR DETECTING ACETYLASE OR DEACETYLASE ACTIVITY IN AN IMMUNOASSAY |
| US20040005574A1 (en) | 2002-07-08 | 2004-01-08 | Leonard Guarente | SIR2 activity |
| US7083911B2 (en) | 2001-02-16 | 2006-08-01 | Promega Corporation | Method for detection of ATP |
| AU2002356992A1 (en) | 2001-11-21 | 2003-06-10 | Albert Einstein College Of Medicine Of Yeshiva University | Sir2 products and activities |
| US20030107325A1 (en) | 2001-12-10 | 2003-06-12 | Birkhead James J. | Removable photocell cover |
| WO2003066889A2 (en) | 2002-02-07 | 2003-08-14 | Axys Pharmaceuticals, Inc. | Assay for acytyltransferase or deacetylase activity |
| US7351542B2 (en) | 2002-05-20 | 2008-04-01 | The Regents Of The University Of California | Methods of modulating tubulin deacetylase activity |
| US20030224473A1 (en) * | 2002-05-23 | 2003-12-04 | Mccafferty Dewey G. | Methods for screening for histone deacetylase activity and for identifying histone deacetylase inhibitors |
| US20030224469A1 (en) | 2002-06-03 | 2003-12-04 | Buchholz Tonia J. | Methods and kits for assays utilizing fluorescence polarization |
| MXPA05009245A (en) | 2003-03-11 | 2005-10-19 | Pfizer Prod Inc | Pyrazine compounds as transforming growth factor (tgf) inhibitors. |
| US20050096256A1 (en) * | 2003-07-01 | 2005-05-05 | President And Fellows Of Harvard College | Compositions for manipulating the lifespan and stress response of cells and organisms |
| KR20050034372A (en) | 2003-10-09 | 2005-04-14 | 삼성전자주식회사 | Method of measuring atp by radiating infrared ray and apparatus using the same |
| WO2005062952A2 (en) | 2003-12-23 | 2005-07-14 | The Regents Of The University Of California | Compositions and methods for modulating sirtuin activity |
| US20060014705A1 (en) | 2004-06-30 | 2006-01-19 | Howitz Konrad T | Compositions and methods for selectively activating human sirtuins |
| EP1763584B1 (en) | 2004-07-02 | 2009-04-22 | Promega Corporation | Compositions and processes for the extraction and detection of microbial atp |
| US7556933B2 (en) | 2004-10-01 | 2009-07-07 | Luminultra Technologies Ltd. | Reagent system and process for adenosine triphosphate monitoring |
| WO2006094239A2 (en) | 2005-03-03 | 2006-09-08 | Sirtris Pharmaceuticals, Inc. | Fluorescence polarization assays for acetyltransferase/deacetylase activity |
| WO2006094246A2 (en) * | 2005-03-03 | 2006-09-08 | Sirtris Pharmaceuticals, Inc. | N-arylmethyl benzamide sirtuin modulators |
| JP2008535790A (en) * | 2005-03-03 | 2008-09-04 | サートリス ファーマシューティカルズ, インコーポレイテッド | N-phenylbenzamide derivatives which are sirtuin modulators |
| WO2006094233A1 (en) | 2005-03-03 | 2006-09-08 | Sirtris Pharmaceuticals, Inc. | N,n'-dicyclic isothiourea sirtuin modulators |
| US20070099830A1 (en) | 2005-04-21 | 2007-05-03 | Massachusetts Institute Of Technology | Sirt4 activities |
| JP2010524432A (en) * | 2007-03-19 | 2010-07-22 | サートリス ファーマシューティカルズ, インコーポレイテッド | Sirtuin activity biomarkers and methods of use thereof |
| US20100168084A1 (en) | 2008-05-08 | 2010-07-01 | Huber L Julie | Therapeutic compounds and related methods of use |
-
2006
- 2006-12-01 ES ES06844714T patent/ES2389111T3/en active Active
- 2006-12-01 WO PCT/US2006/046021 patent/WO2007064902A2/en not_active Ceased
- 2006-12-01 US US12/085,839 patent/US8304206B2/en not_active Expired - Fee Related
- 2006-12-01 EP EP06844714A patent/EP1955077B1/en not_active Not-in-force
Patent Citations (1)
| Publication number | Priority date | Publication date | Assignee | Title |
|---|---|---|---|---|
| WO2006094235A1 (en) * | 2005-03-03 | 2006-09-08 | Sirtris Pharmaceuticals, Inc. | Fused heterocyclic compounds and their use as sirtuin modulators |
Non-Patent Citations (1)
| Title |
|---|
| ALAN FERSHT: "Enzyme Structure and Metabolism", December 1977, W.H.FREEMAN & CO LTD * |
Also Published As
| Publication number | Publication date |
|---|---|
| US8304206B2 (en) | 2012-11-06 |
| WO2007064902A2 (en) | 2007-06-07 |
| ES2389111T3 (en) | 2012-10-23 |
| EP1955077A2 (en) | 2008-08-13 |
| US20090221020A1 (en) | 2009-09-03 |
| WO2007064902A3 (en) | 2007-11-29 |
Similar Documents
| Publication | Publication Date | Title |
|---|---|---|
| US8304206B2 (en) | Mass spectrometry assays for identifying compounds that activate deacetylases | |
| Zhang et al. | Lysine acetylation is a highly abundant and evolutionarily conserved modification in Escherichia coli | |
| Wang et al. | Site-specific GlcNAcylation of human erythrocyte proteins: potential biomarker (s) for diabetes | |
| Backus | Applications of reactive cysteine profiling | |
| Gurcel et al. | Identification of new O-GlcNAc modified proteins using a click-chemistry-based tagging | |
| Haedke et al. | Tuning probe selectivity for chemical proteomics applications | |
| US20150104806A1 (en) | Parkinson's Disease Biomarker | |
| EP1853920B1 (en) | Fluorescence polarization assays for acetyltransferase/deacetylase activity | |
| Knoop et al. | Development of a mass spectrometry based detection method for the mitochondrion‐derived peptide MOTS‐c in plasma samples for doping control purposes | |
| Wiśniewski et al. | A novel mass spectrometry‐based method for simultaneous determination of asymmetric and symmetric dimethylarginine, l‐arginine and l‐citrulline optimized for LC‐MS‐TOF and LC‐MS/MS | |
| Machálková et al. | A label-free MALDI TOF MS-based method for studying the kinetics and inhibitor screening of the Alzheimer’s disease drug target β-secretase | |
| Brown et al. | Chemical probes and methods for the study of protein arginine methylation | |
| ES2884830T3 (en) | Methods relating to testing for lysosomal storage disorders | |
| Geib et al. | Identification of 4-hydroxynonenal-modified proteins in human osteoarthritic chondrocytes | |
| Kogaki et al. | Development of a highly sensitive method for the quantitative analysis of modified nucleosides using UHPLC-UniSpray-MS/MS | |
| CN108424436A (en) | A kind of MALDI-TOF MS probes and its application method for gamma glutamyl transpeptidase detection | |
| WO2008027379A2 (en) | Indicators of sirtuin activity and methods of use thereof | |
| US20080070257A1 (en) | High throughput screening assay for histone modifying enzyme modulators | |
| US20070105152A1 (en) | Methods for determining protein binding specificity using peptide libraries | |
| JP2022529265A (en) | Methods for Quantifying Functional C1 Esterase Inhibitors (fC1-INH) | |
| Li et al. | Posttranslational modifications remodel proteome-wide ligandability | |
| Ali et al. | Optimization and validation of a label-free MRM method for the quantification of cytochrome P450 isoforms in biological samples. | |
| Reyes et al. | Integrating site-specific peptide reporters and targeted mass spectrometry enables rapid substrate-specific kinase assay at the nanogram cell level | |
| US20120244549A1 (en) | Detection Method for Methyltransferase Enzymatic Activity | |
| US20150133342A1 (en) | Mrm-ms signature assay |
Legal Events
| Date | Code | Title | Description |
|---|---|---|---|
| PUAI | Public reference made under article 153(3) epc to a published international application that has entered the european phase |
Free format text: ORIGINAL CODE: 0009012 |
|
| 17P | Request for examination filed |
Effective date: 20080613 |
|
| AK | Designated contracting states |
Kind code of ref document: A2 Designated state(s): AT BE BG CH CY CZ DE DK EE ES FI FR GB GR HU IE IS IT LI LT LU LV MC NL PL PT RO SE SI SK TR |
|
| RIN1 | Information on inventor provided before grant (corrected) |
Inventor name: IFFLAND, ANDRE Inventor name: CARNEY, DAVID Inventor name: LYNCH, AMY Inventor name: MILNE, JILL Inventor name: SMITH, JESSE Inventor name: BOSS, OLIVIER |
|
| 17Q | First examination report despatched |
Effective date: 20090603 |
|
| RAP1 | Party data changed (applicant data changed or rights of an application transferred) |
Owner name: SIRTRIS PHARMACEUTICALS, INC. |
|
| GRAP | Despatch of communication of intention to grant a patent |
Free format text: ORIGINAL CODE: EPIDOSNIGR1 |
|
| DAX | Request for extension of the european patent (deleted) | ||
| GRAS | Grant fee paid |
Free format text: ORIGINAL CODE: EPIDOSNIGR3 |
|
| GRAA | (expected) grant |
Free format text: ORIGINAL CODE: 0009210 |
|
| AK | Designated contracting states |
Kind code of ref document: B1 Designated state(s): AT BE BG CH CY CZ DE DK EE ES FI FR GB GR HU IE IS IT LI LT LU LV MC NL PL PT RO SE SI SK TR |
|
| REG | Reference to a national code |
Ref country code: GB Ref legal event code: FG4D |
|
| REG | Reference to a national code |
Ref country code: CH Ref legal event code: EP Ref country code: AT Ref legal event code: REF Ref document number: 562214 Country of ref document: AT Kind code of ref document: T Effective date: 20120615 |
|
| REG | Reference to a national code |
Ref country code: IE Ref legal event code: FG4D |
|
| REG | Reference to a national code |
Ref country code: DE Ref legal event code: R096 Ref document number: 602006030245 Country of ref document: DE Effective date: 20120809 |
|
| REG | Reference to a national code |
Ref country code: NL Ref legal event code: VDEP Effective date: 20120613 |
|
| REG | Reference to a national code |
Ref country code: ES Ref legal event code: FG2A Ref document number: 2389111 Country of ref document: ES Kind code of ref document: T3 Effective date: 20121023 |
|
| PG25 | Lapsed in a contracting state [announced via postgrant information from national office to epo] |
Ref country code: LT Free format text: LAPSE BECAUSE OF FAILURE TO SUBMIT A TRANSLATION OF THE DESCRIPTION OR TO PAY THE FEE WITHIN THE PRESCRIBED TIME-LIMIT Effective date: 20120613 Ref country code: SE Free format text: LAPSE BECAUSE OF FAILURE TO SUBMIT A TRANSLATION OF THE DESCRIPTION OR TO PAY THE FEE WITHIN THE PRESCRIBED TIME-LIMIT Effective date: 20120613 Ref country code: CY Free format text: LAPSE BECAUSE OF FAILURE TO SUBMIT A TRANSLATION OF THE DESCRIPTION OR TO PAY THE FEE WITHIN THE PRESCRIBED TIME-LIMIT Effective date: 20120613 Ref country code: FI Free format text: LAPSE BECAUSE OF FAILURE TO SUBMIT A TRANSLATION OF THE DESCRIPTION OR TO PAY THE FEE WITHIN THE PRESCRIBED TIME-LIMIT Effective date: 20120613 |
|
| REG | Reference to a national code |
Ref country code: AT Ref legal event code: MK05 Ref document number: 562214 Country of ref document: AT Kind code of ref document: T Effective date: 20120613 |
|
| REG | Reference to a national code |
Ref country code: LT Ref legal event code: MG4D Effective date: 20120613 |
|
| PG25 | Lapsed in a contracting state [announced via postgrant information from national office to epo] |
Ref country code: SI Free format text: LAPSE BECAUSE OF FAILURE TO SUBMIT A TRANSLATION OF THE DESCRIPTION OR TO PAY THE FEE WITHIN THE PRESCRIBED TIME-LIMIT Effective date: 20120613 Ref country code: LV Free format text: LAPSE BECAUSE OF FAILURE TO SUBMIT A TRANSLATION OF THE DESCRIPTION OR TO PAY THE FEE WITHIN THE PRESCRIBED TIME-LIMIT Effective date: 20120613 Ref country code: GR Free format text: LAPSE BECAUSE OF FAILURE TO SUBMIT A TRANSLATION OF THE DESCRIPTION OR TO PAY THE FEE WITHIN THE PRESCRIBED TIME-LIMIT Effective date: 20120914 |
|
| PG25 | Lapsed in a contracting state [announced via postgrant information from national office to epo] |
Ref country code: AT Free format text: LAPSE BECAUSE OF FAILURE TO SUBMIT A TRANSLATION OF THE DESCRIPTION OR TO PAY THE FEE WITHIN THE PRESCRIBED TIME-LIMIT Effective date: 20120613 Ref country code: SK Free format text: LAPSE BECAUSE OF FAILURE TO SUBMIT A TRANSLATION OF THE DESCRIPTION OR TO PAY THE FEE WITHIN THE PRESCRIBED TIME-LIMIT Effective date: 20120613 Ref country code: IS Free format text: LAPSE BECAUSE OF FAILURE TO SUBMIT A TRANSLATION OF THE DESCRIPTION OR TO PAY THE FEE WITHIN THE PRESCRIBED TIME-LIMIT Effective date: 20121013 Ref country code: CZ Free format text: LAPSE BECAUSE OF FAILURE TO SUBMIT A TRANSLATION OF THE DESCRIPTION OR TO PAY THE FEE WITHIN THE PRESCRIBED TIME-LIMIT Effective date: 20120613 Ref country code: RO Free format text: LAPSE BECAUSE OF FAILURE TO SUBMIT A TRANSLATION OF THE DESCRIPTION OR TO PAY THE FEE WITHIN THE PRESCRIBED TIME-LIMIT Effective date: 20120613 Ref country code: EE Free format text: LAPSE BECAUSE OF FAILURE TO SUBMIT A TRANSLATION OF THE DESCRIPTION OR TO PAY THE FEE WITHIN THE PRESCRIBED TIME-LIMIT Effective date: 20120613 |
|
| PG25 | Lapsed in a contracting state [announced via postgrant information from national office to epo] |
Ref country code: PT Free format text: LAPSE BECAUSE OF FAILURE TO SUBMIT A TRANSLATION OF THE DESCRIPTION OR TO PAY THE FEE WITHIN THE PRESCRIBED TIME-LIMIT Effective date: 20121015 Ref country code: PL Free format text: LAPSE BECAUSE OF FAILURE TO SUBMIT A TRANSLATION OF THE DESCRIPTION OR TO PAY THE FEE WITHIN THE PRESCRIBED TIME-LIMIT Effective date: 20120613 |
|
| PG25 | Lapsed in a contracting state [announced via postgrant information from national office to epo] |
Ref country code: NL Free format text: LAPSE BECAUSE OF FAILURE TO SUBMIT A TRANSLATION OF THE DESCRIPTION OR TO PAY THE FEE WITHIN THE PRESCRIBED TIME-LIMIT Effective date: 20120613 |
|
| PLBE | No opposition filed within time limit |
Free format text: ORIGINAL CODE: 0009261 |
|
| STAA | Information on the status of an ep patent application or granted ep patent |
Free format text: STATUS: NO OPPOSITION FILED WITHIN TIME LIMIT |
|
| PG25 | Lapsed in a contracting state [announced via postgrant information from national office to epo] |
Ref country code: DK Free format text: LAPSE BECAUSE OF FAILURE TO SUBMIT A TRANSLATION OF THE DESCRIPTION OR TO PAY THE FEE WITHIN THE PRESCRIBED TIME-LIMIT Effective date: 20120613 |
|
| 26N | No opposition filed |
Effective date: 20130314 |
|
| REG | Reference to a national code |
Ref country code: DE Ref legal event code: R097 Ref document number: 602006030245 Country of ref document: DE Effective date: 20130314 |
|
| PG25 | Lapsed in a contracting state [announced via postgrant information from national office to epo] |
Ref country code: BG Free format text: LAPSE BECAUSE OF FAILURE TO SUBMIT A TRANSLATION OF THE DESCRIPTION OR TO PAY THE FEE WITHIN THE PRESCRIBED TIME-LIMIT Effective date: 20120913 Ref country code: MC Free format text: LAPSE BECAUSE OF NON-PAYMENT OF DUE FEES Effective date: 20121231 |
|
| REG | Reference to a national code |
Ref country code: CH Ref legal event code: PL |
|
| REG | Reference to a national code |
Ref country code: IE Ref legal event code: MM4A |
|
| PG25 | Lapsed in a contracting state [announced via postgrant information from national office to epo] |
Ref country code: LI Free format text: LAPSE BECAUSE OF NON-PAYMENT OF DUE FEES Effective date: 20121231 Ref country code: IE Free format text: LAPSE BECAUSE OF NON-PAYMENT OF DUE FEES Effective date: 20121201 Ref country code: CH Free format text: LAPSE BECAUSE OF NON-PAYMENT OF DUE FEES Effective date: 20121231 |
|
| PG25 | Lapsed in a contracting state [announced via postgrant information from national office to epo] |
Ref country code: TR Free format text: LAPSE BECAUSE OF FAILURE TO SUBMIT A TRANSLATION OF THE DESCRIPTION OR TO PAY THE FEE WITHIN THE PRESCRIBED TIME-LIMIT Effective date: 20120613 |
|
| PG25 | Lapsed in a contracting state [announced via postgrant information from national office to epo] |
Ref country code: LU Free format text: LAPSE BECAUSE OF NON-PAYMENT OF DUE FEES Effective date: 20121201 |
|
| PG25 | Lapsed in a contracting state [announced via postgrant information from national office to epo] |
Ref country code: HU Free format text: LAPSE BECAUSE OF FAILURE TO SUBMIT A TRANSLATION OF THE DESCRIPTION OR TO PAY THE FEE WITHIN THE PRESCRIBED TIME-LIMIT Effective date: 20061201 |
|
| REG | Reference to a national code |
Ref country code: FR Ref legal event code: PLFP Year of fee payment: 10 |
|
| REG | Reference to a national code |
Ref country code: FR Ref legal event code: PLFP Year of fee payment: 11 |
|
| PGFP | Annual fee paid to national office [announced via postgrant information from national office to epo] |
Ref country code: GB Payment date: 20161125 Year of fee payment: 11 Ref country code: FR Payment date: 20161117 Year of fee payment: 11 |
|
| PGFP | Annual fee paid to national office [announced via postgrant information from national office to epo] |
Ref country code: ES Payment date: 20161215 Year of fee payment: 11 Ref country code: IT Payment date: 20161221 Year of fee payment: 11 Ref country code: BE Payment date: 20161215 Year of fee payment: 11 |
|
| PGFP | Annual fee paid to national office [announced via postgrant information from national office to epo] |
Ref country code: DE Payment date: 20161220 Year of fee payment: 11 |
|
| REG | Reference to a national code |
Ref country code: DE Ref legal event code: R119 Ref document number: 602006030245 Country of ref document: DE |
|
| GBPC | Gb: european patent ceased through non-payment of renewal fee |
Effective date: 20171201 |
|
| REG | Reference to a national code |
Ref country code: FR Ref legal event code: ST Effective date: 20180831 |
|
| REG | Reference to a national code |
Ref country code: BE Ref legal event code: MM Effective date: 20171231 |
|
| PG25 | Lapsed in a contracting state [announced via postgrant information from national office to epo] |
Ref country code: DE Free format text: LAPSE BECAUSE OF NON-PAYMENT OF DUE FEES Effective date: 20180703 Ref country code: FR Free format text: LAPSE BECAUSE OF NON-PAYMENT OF DUE FEES Effective date: 20180102 Ref country code: IT Free format text: LAPSE BECAUSE OF NON-PAYMENT OF DUE FEES Effective date: 20171201 |
|
| PG25 | Lapsed in a contracting state [announced via postgrant information from national office to epo] |
Ref country code: GB Free format text: LAPSE BECAUSE OF NON-PAYMENT OF DUE FEES Effective date: 20171201 Ref country code: BE Free format text: LAPSE BECAUSE OF NON-PAYMENT OF DUE FEES Effective date: 20171231 |
|
| REG | Reference to a national code |
Ref country code: ES Ref legal event code: FD2A Effective date: 20190103 |
|
| PG25 | Lapsed in a contracting state [announced via postgrant information from national office to epo] |
Ref country code: ES Free format text: LAPSE BECAUSE OF NON-PAYMENT OF DUE FEES Effective date: 20171202 |