EP1947609A1 - Method to map the differences between two images - Google Patents
Method to map the differences between two images Download PDFInfo
- Publication number
- EP1947609A1 EP1947609A1 EP07300735A EP07300735A EP1947609A1 EP 1947609 A1 EP1947609 A1 EP 1947609A1 EP 07300735 A EP07300735 A EP 07300735A EP 07300735 A EP07300735 A EP 07300735A EP 1947609 A1 EP1947609 A1 EP 1947609A1
- Authority
- EP
- European Patent Office
- Prior art keywords
- image
- images
- color space
- component
- pixel
- Prior art date
- Legal status (The legal status is an assumption and is not a legal conclusion. Google has not performed a legal analysis and makes no representation as to the accuracy of the status listed.)
- Withdrawn
Links
Images

Classifications
-
- G—PHYSICS
- G06—COMPUTING OR CALCULATING; COUNTING
- G06T—IMAGE DATA PROCESSING OR GENERATION, IN GENERAL
- G06T9/00—Image coding
-
- G—PHYSICS
- G06—COMPUTING OR CALCULATING; COUNTING
- G06T—IMAGE DATA PROCESSING OR GENERATION, IN GENERAL
- G06T7/00—Image analysis
- G06T7/0002—Inspection of images, e.g. flaw detection
-
- G—PHYSICS
- G06—COMPUTING OR CALCULATING; COUNTING
- G06T—IMAGE DATA PROCESSING OR GENERATION, IN GENERAL
- G06T7/00—Image analysis
- G06T7/97—Determining parameters from multiple pictures
-
- G—PHYSICS
- G06—COMPUTING OR CALCULATING; COUNTING
- G06T—IMAGE DATA PROCESSING OR GENERATION, IN GENERAL
- G06T2207/00—Indexing scheme for image analysis or image enhancement
- G06T2207/10—Image acquisition modality
- G06T2207/10024—Color image
-
- G—PHYSICS
- G06—COMPUTING OR CALCULATING; COUNTING
- G06T—IMAGE DATA PROCESSING OR GENERATION, IN GENERAL
- G06T2207/00—Indexing scheme for image analysis or image enhancement
- G06T2207/30—Subject of image; Context of image processing
- G06T2207/30168—Image quality inspection
Definitions
- the present invention relates to the field of computer vision and digital image processing. It provides an approach for measuring the visual difference for high bit depth images, which can be used in the visual quality assessment in high bit depth image/video coding.
- the Peak Signal-to-Noise Ratio is commonly used to measure the difference between an original image and a reproduced image and hence is the metric for reproduction quality.
- PSNR Peak Signal-to-Noise Ratio
- HVS human visual system
- VDP Visual Difference Predictor
- This invention as disclosed hereafter presents a visual difference model that is based on human visual perception and is advantageously tuned to the dynamic range characteristics of high bit depth images. If we assume there are two images to differentiate, one is the original image and the other one is a reproduced versions of this original image, the problem is how to measure the visual difference between the two images. Then, the ultimate goal would be to generate a visual difference map that is to some degree compliant to human visual perception.
- the invention as disclosed hereafter presents an approach for modeling the visual differences between two images in a way that is close to the human visual perception. In particular, the visual difference model is advantageously designed to catch the dynamic range characteristics of high bit depth images.
- an object of the invention is a method to map the differences between a first image and a second image comprising the following steps :
- FIG. 1 A flowchart of a visual difference model according to a preferred embodiment of the invention is shown in figure 1 .
- an original image goes through the processes of luminance and chrominance separation, luminance non-linear transform, visual masking and spatial filtering.
- the reproduction to be compared to the orginal image goes through the processes of luminance and chrominance separation, luminance non-linear transform, and spatial filtering.
- a certain distance metric is done pixel-by-pixel on the processed original image and its reproduction to generate the visual difference map between them.
- the visual difference map is of the same resolution of the original image but the value of each pixel represents the "degree of visual difference" between the original image and its reproduction.
- the first step of the method is to convert the original and reproduced input images from its color space (e.g., RGB or YCbCr) to a device independent color space, having separated luminance and chrominance dimensions.
- its color space e.g., RGB or YCbCr
- the parameters of the display primaries need to be considered in this step.
- the data of the input images are conventional linear RGB data, and, as exemplified below, the data that are outputted after a first conversion are for instance conventional LMS or XYZ data.
- a second conversion is performed to express both images in a device independent opponent color space, still having separated luminance and chrominance dimensions.
- Example 1 of luminance and chrominance separation in an opponent color space
- the RGB data representing the images (original and reproduced) are first converted in the XYZ color space : X Y Z + 0.480318 0.336554 0.240959 0.262587 0.616154 0.121259 0.028459 0.103520 1.204599 [ R G B ] , where the X, Y, and Z values were calculated for each phosphor of the considered CRT monitor and were combined as the conversion matrix in equation (3).
- the value of O 1 is preferably normalized to be within the range [0, 1] before the sigmoid transformation and the resulted O 1 ' is preferably mapped back to the original O 1 range.
- the transformed luminance component O' 1 that is obtained is then regarded as the representation of "perceived brightness".
- the spatial filtering process is widely employed in "simulating human visual perception", because contrast sensitivity function (CSF) for the luminance component in opponent color space serves as a band pass filter while the CSF for the chrominance component in opponent color space works as a low pass filter.
- CSF contrast sensitivity function
- the spatial filtering shall be contained here in the visual difference model. Note that a spatial filtering is also used to build the famous s-CIELAB color space.
- the spatial filtering step is performed in frequency domain by multiplying the discrete Fourier transformation of the "perceived brightness"/chrominance component by the frequency domain representation of the CSF of the "perceived brightness”/chrominance component.
- the spatial filtering step can also be performed in the spatial domain by carefully selecting the filters according to the CSFs.
- the visual masking step can be realized by localizing edges through any state-of-the-art edge detection algorithms, such as Prewitt or Canny methods.
- edge detection is only one of the desirable steps in visual masking module. Other steps that were designed to match the characteristics of human visual perception can also be included in the visual masking step.
- One or several visual masks are generated in the visual masking step to indicate where the masking effects are located.
- the visual masks can be as simple as binary images to indicate whether each pixel shall be masked or not, or they can be represented as grey-level images with the value of each pixel indicating the weight of the masking effect.
- the pixel-by-pixel distance is calculated on the two processed images to generate the final visual difference map.
- the visual masks can serve as weights in calculating the distance.
- the distance metric can be based on norm-1 or norm-2 measurement. Two specific examples are shown below.
- the processed image of the original image is denoted by ⁇ org ⁇ 1 ( x,y ) , org ⁇ 2 ( x,y ) , org ⁇ 3 ( x,y ) ⁇
- the processed image of the reproduced image is denoted by ⁇ rep ⁇ 1 ( x,y ) , rep ⁇ 2 ( x,y ) , rep ⁇ 3 ( x,y ) ⁇
- x ⁇ [0,..., W -1] representing the horizontal coordinate of each pixel
- y ⁇ [0, ⁇ ,H- 1] representing the vertical coordinate of the same pixel.
- vdM ( x , y ) Mask x ⁇ y * ( a 1 * org ⁇ O ⁇ 1 x ⁇ y ⁇ - rep ⁇ O ⁇ 1 x ⁇ y + a 2 * org ⁇ O ⁇ 2 x ⁇ y ⁇ - rep ⁇ O ⁇ 2 x ⁇ y + a 3 * org ⁇ O ⁇ 3 x ⁇ y ⁇ - rep ⁇ O ⁇ 3 x ⁇ y , where a 1 , a 2 and a 3 are coefficients to scale the distance off each channel and can be determined empirically.
- the previous example requires to determine the coefficients a 1 , a 2 and a 3 for scaling between the distance of each channel.
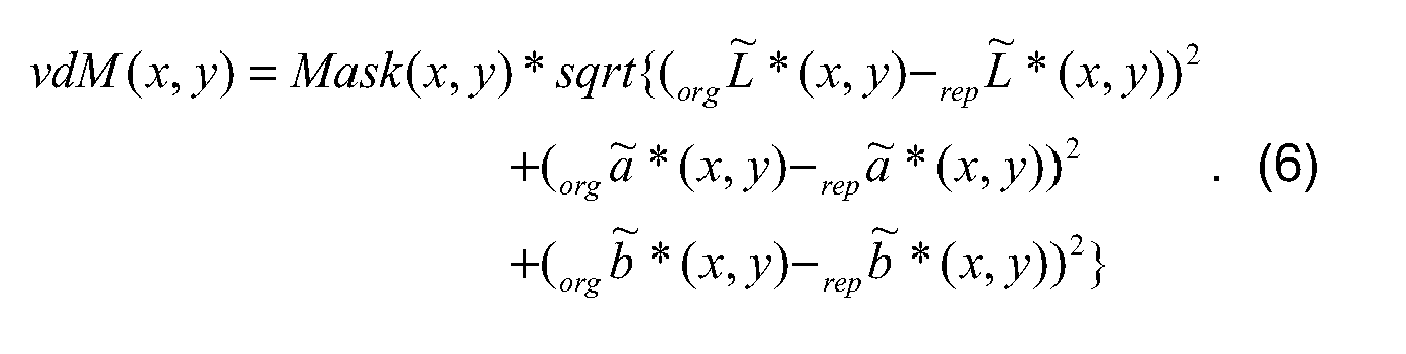
- This problem can be bypassed by converting from the opponent color space to the CIELab color space for both processed images, denoted by ⁇ org L ⁇ *( x , y ), org ⁇ *( x , y ), org b ⁇ * ( x,y ) ⁇ and ⁇ rep L ⁇ *( x,y ), rep ⁇ * ( x,y ), rep b ⁇ * ( x,y ) ⁇ , respectively.
- vdM ( x , y ) Mask x ⁇ y * sqrt ( org ⁇ L ⁇ * ( x , y ) - rep L ⁇ * x ⁇ y ) 2 + ( org ⁇ a ⁇ * ( x , y ) - rep a ⁇ * x ⁇ y ) 2 + ( org ⁇ b ⁇ * ( x , y ) - rep b ⁇ * x ⁇ y ) 2
Landscapes
- Engineering & Computer Science (AREA)
- Physics & Mathematics (AREA)
- General Physics & Mathematics (AREA)
- Theoretical Computer Science (AREA)
- Computer Vision & Pattern Recognition (AREA)
- Multimedia (AREA)
- Quality & Reliability (AREA)
- Image Processing (AREA)
Abstract
Method comprising the following steps :
- expressing both images in a device independent opponent color space, having separated luminance and chrominance components,
- using a non-linear function to transform luminance component of both images into a so-called "perceived brightness" component,
- spatial filtering both images,
- visual masking at least the spatial filtered first image,
- calculating the pixel-to-pixel distances between the obtained two images, then mapping these distances.
- expressing both images in a device independent opponent color space, having separated luminance and chrominance components,
- using a non-linear function to transform luminance component of both images into a so-called "perceived brightness" component,
- spatial filtering both images,
- visual masking at least the spatial filtered first image,
- calculating the pixel-to-pixel distances between the obtained two images, then mapping these distances.
Such a method is particularly well suited to differentiate high bit depth images.
Description
- The present invention relates to the field of computer vision and digital image processing. It provides an approach for measuring the visual difference for high bit depth images, which can be used in the visual quality assessment in high bit depth image/video coding.
- In image/video coding, the Peak Signal-to-Noise Ratio (PSNR) is commonly used to measure the difference between an original image and a reproduced image and hence is the metric for reproduction quality. However, the PSNR value is not consistent with the differences that are actually perceived by the human eyes. However, how to model the human visual differences between the original image and its reproduction in a way that is close to the perception of the so-called "human visual system" (HVS) has been a hot but challenging task in the field of computer vision. The well-known and widely used approaches for visual difference metric include using CIE94, s-CIELab color space, and the so-called "Visual Difference Predictor" (VDP). The PhD thesis entitled "Measuring Images : Difference, Quality and Appearance", from Garett M. Johnson, 2003, Rochester Institute of Technology, discloses methods to map differences between images (see diagram p.40). See also the article entitled "Vision-based Strategy to reduce the perceived Color Misregistration to Image-Capturing devices", from Xia-Fan FENG and Scott DALY, in Proceedings of the IEEE, Vol. 90, No. 1, January 2002. See also the article entitled "Color Image Fidelity Metrics Evaluated Using Image Distortion Maps", from Xuemei ZHANG and Brian A. WANDELL (Preprint submitted to Elsevier Preprint - 23 July 1998). Untill now, there is still no actual standard visual difference metric that takes place of the conventional PSNR; see on Internet paragraph 4.4 of the article entitled "Enhanced Error Diffusion with Thresholds Modulated by Spatio-Chromatically Correlated Noise", from Jon M. SPEIGLE and Xiao-Fan FENG (date of publication not found).
- The task to model and evaluate the visual differences between images becomes more challenging when the color bit depth is beyond 8-bit. One major reason is that the enhanced dynamic range in the high bit depth (which means higher bit depth than 8-bit depth in the remaining part of this document) images/videos may have different statistic characteristics from 8-bit depth.
- This invention as disclosed hereafter presents a visual difference model that is based on human visual perception and is advantageously tuned to the dynamic range characteristics of high bit depth images. If we assume there are two images to differentiate, one is the original image and the other one is a reproduced versions of this original image, the problem is how to measure the visual difference between the two images. Then, the ultimate goal would be to generate a visual difference map that is to some degree compliant to human visual perception. The invention as disclosed hereafter presents an approach for modeling the visual differences between two images in a way that is close to the human visual perception. In particular, the visual difference model is advantageously designed to catch the dynamic range characteristics of high bit depth images.
- Consequently, an object of the invention is a method to map the differences between a first image and a second image comprising the following steps :
- expressing both images in a device independent opponent color space, having separated luminance and chrominance components,
- using a non-linear function, again for both images, to transform at least the luminance component of both images expressed in said opponent color space, into a so-called "perceived brightness" component,
- spatial filtering both images that are expressed in said opponent color space using said "perceived brightness" component and chrominance component,
- visual masking at least the spatial filtered first image, in a manner adapted to compensate for the suppression of the high frequency components that result from previous spatial filtering,
- calculating the pixel-to-pixel distances between the obtained first image and the obtained second image, then mapping these distances.
- The invention will be more clearly understood on reading the description which follows, given by way of non-limiting example and with reference to the
figure 1 which shows a diagram of the method according to one embodiment of the invention. - A flowchart of a visual difference model according to a preferred embodiment of the invention is shown in
figure 1 . In brief, an original image goes through the processes of luminance and chrominance separation, luminance non-linear transform, visual masking and spatial filtering. The reproduction to be compared to the orginal image, which is a reproduced version of the original image, goes through the processes of luminance and chrominance separation, luminance non-linear transform, and spatial filtering.
Then a certain distance metric is done pixel-by-pixel on the processed original image and its reproduction to generate the visual difference map between them. The visual difference map is of the same resolution of the original image but the value of each pixel represents the "degree of visual difference" between the original image and its reproduction. The following paragraphs 1 to 5 below describe in detail the five steps or modules shown infigure 1 ; within some paragraphs, specific examples are given. - Because human visual system responds, spatially and temporally, differently to luminance and chrominance information, the first step of the method is to convert the original and reproduced input images from its color space (e.g., RGB or YCbCr) to a device independent color space, having separated luminance and chrominance dimensions. Based the fact that the perceived image depends on not only the image data but also the display device that is used, the parameters of the display primaries need to be considered in this step. Generally, the data of the input images are conventional linear RGB data, and, as exemplified below, the data that are outputted after a first conversion are for instance conventional LMS or XYZ data. Then, a second conversion is performed to express both images in a device independent opponent color space, still having separated luminance and chrominance dimensions.
- Two different examples of luminance and chrominance separation are shown below :
- The RGB data representing the images (original and reproduced) are first converted in the LMS color space in terms of the chromaticity coordinates of the R, G, B phosphors of a certain CRT monitor and Smith-Pokorny cone sensitivity functions:

- Secondly, the LMS color space is converted to an opponent color space:

- In practice, there are versatile matrices to convert from the LSM color space to an opponent color space, in which O 1 represents the luminance component, O 2 the red-green channel and O 3 the blue-yellow channel. The entrances of the conversion matrix M lms-opp in equation (2) are not specified in this exemplary embodiment. Use of an opponent space is generally motivated by retinal processing ; CIELAB is generally considered as an example of opponent space ; other known opponent spaces are the Krauskopf system, the Faugeras system, and the Ballard system.
- The RGB data representing the images (original and reproduced) are first converted in the XYZ color space :

where the X, Y, and Z values were calculated for each phosphor of the considered CRT monitor and were combined as the conversion matrix in equation (3). - Secondly, the XYZ color space is converted to an opponent color space:

- Similar to the first example above, the entrances of the conversion matrix M xyz-opp in (4) are not specified here.
- It is well-known that there exists non-linear relationship between the physical luminance and the human perceived brightness. The proposed mathematical expression of this relationship includes logarithmic (known as Weber-Fechner law), exponential, square root, cube root, polynomial, etc.
- A practically useful preferred embodiment is to utilize a sigmoid function, which is widely used in tone mapping techniques, to transform the luminance component O1 that is obtained from step 1 above into a so-called "perceived brightness" component O'1 as follows :

where the parameter a is empirically chosen as equal to 10. The value of O 1 is preferably normalized to be within the range [0, 1] before the sigmoid transformation and the resulted O 1' is preferably mapped back to the original O 1 range. The transformed luminance component O'1 that is obtained is then regarded as the representation of "perceived brightness". - We depict the spatial filtering step before the visual masking step since the visual masking process is designed here to compensate some undesirable consequences of the spatial filtering. In general, the spatial filtering process is widely employed in "simulating human visual perception", because contrast sensitivity function (CSF) for the luminance component in opponent color space serves as a band pass filter while the CSF for the chrominance component in opponent color space works as a low pass filter. Hence, the spatial filtering shall be contained here in the visual difference model. Note that a spatial filtering is also used to build the famous s-CIELAB color space.
- Here, the spatial filtering step is performed in frequency domain by multiplying the discrete Fourier transformation of the "perceived brightness"/chrominance component by the frequency domain representation of the CSF of the "perceived brightness"/chrominance component.
- Without departing from the invention, the spatial filtering step can also be performed in the spatial domain by carefully selecting the filters according to the CSFs.
- An undesirable consequence of the spatial filtering is that the high frequency components are suppressed in filtering both the luminance and chrominance channels. However, human eyes are sensitive to special high frequency components, e.g., edges in an image. Hence, to compensate the undesirable high frequency suppression through the spatial filtering, a visual masking step is applied only to the original image, before the spatial filtering step.
- As an example, the visual masking step can be realized by localizing edges through any state-of-the-art edge detection algorithms, such as Prewitt or Canny methods.
- It should be remarked that the edge detection is only one of the desirable steps in visual masking module. Other steps that were designed to match the characteristics of human visual perception can also be included in the visual masking step.
- One or several visual masks are generated in the visual masking step to indicate where the masking effects are located. The visual masks can be as simple as binary images to indicate whether each pixel shall be masked or not, or they can be represented as grey-level images with the value of each pixel indicating the weight of the masking effect.
- Once both the original image and its reproduction have gone through the previous four steps as represented on
figure 1 , the pixel-by-pixel distance is calculated on the two processed images to generate the final visual difference map. The visual masks can serve as weights in calculating the distance. The distance metric can be based on norm-1 or norm-2 measurement. Two specific examples are shown below. - We assume that the processed image of the original image is denoted by { org Õ 1(x,y), orgÕ2 (x,y), orgÕ3 (x,y)}, and the processed image of the reproduced image is denoted by { repÕ 1(x,y), repÕ 2(x,y), repÕ3 (x,y)}, where x ∈ [0,...,W-1] representing the horizontal coordinate of each pixel and y ∈ [0,···,H-1] representing the vertical coordinate of the same pixel. We assume that the visual mask of the processed original image is denoted as Mask(x, y) to indicate the weight of the masking effect. The visual masks should be normalized so that all the weights are summed up to one. The visual difference map between input images is then calculated as:

where a 1 , a 2 and a 3 are coefficients to scale the distance off each channel and can be determined empirically. - The previous example requires to determine the coefficients a 1 , a 2 and a 3 for scaling between the distance of each channel. This problem can be bypassed by converting from the opponent color space to the CIELab color space for both processed images, denoted by { orgL̃*(x,y), orgã*(x,y), orgb̃*(x,y)} and { repL̃*(x,y), repã*(x,y), repb̃*(x,y)}, respectively. Then, the formula that is used to calculate the visual difference is shown below
- The matrices that convert from the opponent color space to CIE Lab color space are not specified.
- While the present invention is described with respect to particular examples and preferred embodiments, it is understood that the present invention is not limited to these examples and embodiments. The present invention as claimed therefore includes variations from the particular examples and preferred embodiments described herein, as will be apparent to one of skill in the art. While some of the specific embodiments may be described and claimed separately, it is understood that the various features of embodiments described and claimed herein may be used in combination.
Use of opponent color space is known to be motivated by retinal processing : see the article entitled : "opponent color space motivated by retinal processing", by Silvio BORER and Sabine Süsstrunk, in Proceedings of IS&T Conference on Color in Graphics, Imaging and Vision (CGIV), vol. 1 (2002), p. 187-189 ; in this article, a non-linear transformation is performed on all the components of the device independent color space (as LMS) before conversion to a opponent color space.
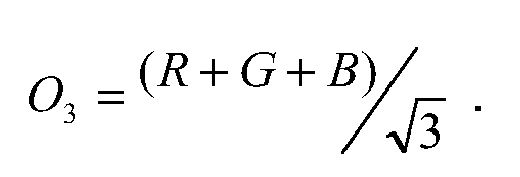
An example of a very well known transformation from a RGB color space into an opponent color space is as follows :


Preferably, said spatial filtering is performed in frequency domain by multiplying the discrete Fourier transformation of the "perceived brightness"/chrominance component by the frequency domain representation of the contrast sensitivity function of the "perceived brightness"/chrominance component.
Preferably, before said pixel-to-pixel distance calculation, but after filtering step, both images are converted in a perceptually uniform color space, as, for instance, the conventional Lab color space ; as pixel-to-pixel distances are then calculated in this perceptually uniform color space, scaling between the distance of each channel (i.e. component) of the color space may be advantageously avoided.
Preferably, said first image is an original image, and said second image is a reproduction of said original image.
Preferably, the bit depth for digitally coding said first image and said second image is superior to 8. As a matter of fact, observations have shown that the method according to the invention is especially well adapted for images with such high bit depth.
Claims (6)
- Method to map the differences between a first image and a second image comprising the following steps :- expressing both images in a device independent opponent color space, having separated luminance and chrominance components,- using a non-linear function, again for both images, to transform at least the luminance component of both images expressed in said opponent color space, into a so-called "perceived brightness" component,- spatial filtering both images that are expressed in said opponent color space using said "perceived brightness" component and chrominance component,- visual masking at least the spatial filtered first image, in a manner adapted to compensate for the suppression of the high frequency components that result from previous spatial filtering,- calculating the pixel-to-pixel distances between the obtained first image and the obtained second image, then mapping these distances.
- Method according to claim 1 characterized in that said device independent opponent color space is O1O2O3 color space, in which O 1 represents the luminance component, O 2 the red-green channel and O 3 the blue-yellow channel.
- Method according to any one of the preceding claims characterized in that said spatial filtering is performed in frequency domain by multiplying the discrete Fourier transformation of the "perceived brightness"/chrominance component by the frequency domain representation of the contrast sensitivity function of the "perceived brightness"/chrominance component.
- Method according to any one of the preceding claims characterized in that, before said pixel-to-pixel distance calculation, but after filtering step, both images are converted in a perceptually uniform color space.
- Method according to any one of the preceding claims characterized in that said first image is an original image, and said second image is a reproduction of said original image.
- Method according to any one of the preceding claims characterized in that the bit depth for digitally coding said first image and said second image is superior to 8.
Priority Applications (1)
| Application Number | Priority Date | Filing Date | Title |
|---|---|---|---|
| EP07300735A EP1947609A1 (en) | 2007-01-18 | 2007-01-18 | Method to map the differences between two images |
Applications Claiming Priority (1)
| Application Number | Priority Date | Filing Date | Title |
|---|---|---|---|
| EP07300735A EP1947609A1 (en) | 2007-01-18 | 2007-01-18 | Method to map the differences between two images |
Publications (1)
| Publication Number | Publication Date |
|---|---|
| EP1947609A1 true EP1947609A1 (en) | 2008-07-23 |
Family
ID=38182923
Family Applications (1)
| Application Number | Title | Priority Date | Filing Date |
|---|---|---|---|
| EP07300735A Withdrawn EP1947609A1 (en) | 2007-01-18 | 2007-01-18 | Method to map the differences between two images |
Country Status (1)
| Country | Link |
|---|---|
| EP (1) | EP1947609A1 (en) |
Cited By (6)
| Publication number | Priority date | Publication date | Assignee | Title |
|---|---|---|---|---|
| US20120038828A1 (en) * | 2010-08-10 | 2012-02-16 | Samsung Electronics Co., Ltd. | Apparatus and method for generating video signal reducing crosstalk between lightness signal and chrominance signal |
| WO2014005301A1 (en) * | 2012-07-04 | 2014-01-09 | Intel Corporation | A region of interest based framework for 3d video coding |
| US8743291B2 (en) | 2011-04-12 | 2014-06-03 | Dolby Laboratories Licensing Corporation | Quality assessment for images that have extended dynamic ranges or wide color gamuts |
| US8760578B2 (en) | 2010-04-19 | 2014-06-24 | Dolby Laboratories Licensing Corporation | Quality assessment of high dynamic range, visual dynamic range and wide color gamut image and video |
| WO2014146219A1 (en) * | 2013-03-22 | 2014-09-25 | Qualcomm Incorporated | Depth modeling modes for depth map intra coding |
| CN110070500A (en) * | 2019-03-21 | 2019-07-30 | 浙江大学 | A kind of post-processing approach of depth image |
-
2007
- 2007-01-18 EP EP07300735A patent/EP1947609A1/en not_active Withdrawn
Non-Patent Citations (3)
| Title |
|---|
| GARRETT M. JOHNSON: "Measuring Images: Differences, Quality and Appearance", March 2003, ROCHESTER INSTUTE OF TECHNOLOGY, XP002444668 * |
| LONGHURST P ET AL: "User validation of image quality assessment algorithms", THEORY AND PRACTICE OF COMPUTER GRAPHICS, 2004. PROCEEDINGS BOURNEMOUTH, UK JUNE 8-10, 2004, PISCATAWAY, NJ, USA,IEEE, 8 June 2004 (2004-06-08), pages 196 - 202, XP010709038, ISBN: 0-7695-2137-1 * |
| MANTIUK, RAFAL; DALY, SCOTT J.; MYSZKOWSKI, KAROL ; SEIDEL, HANS-PETER: "Predicting Visible Differences in High Dynamic Range Images - Model and its Calibration", HUMAN VISION AND ELECTRONIC IMAGING X, IS&T/SPIE'S 17TH ANNUAL SYMPOSIUM ON ELECTRONIC IMAGING (2005), 16 January 2005 (2005-01-16), pages 204 - 214, XP002444666 * |
Cited By (9)
| Publication number | Priority date | Publication date | Assignee | Title |
|---|---|---|---|---|
| US8760578B2 (en) | 2010-04-19 | 2014-06-24 | Dolby Laboratories Licensing Corporation | Quality assessment of high dynamic range, visual dynamic range and wide color gamut image and video |
| US20120038828A1 (en) * | 2010-08-10 | 2012-02-16 | Samsung Electronics Co., Ltd. | Apparatus and method for generating video signal reducing crosstalk between lightness signal and chrominance signal |
| US8885104B2 (en) * | 2010-08-10 | 2014-11-11 | Samsung Electronics Co., Ltd. | Apparatus and method for generating video signal reducing crosstalk between lightness signal and chrominance signal |
| US8743291B2 (en) | 2011-04-12 | 2014-06-03 | Dolby Laboratories Licensing Corporation | Quality assessment for images that have extended dynamic ranges or wide color gamuts |
| WO2014005301A1 (en) * | 2012-07-04 | 2014-01-09 | Intel Corporation | A region of interest based framework for 3d video coding |
| US10075689B2 (en) | 2012-07-04 | 2018-09-11 | Intel Corporation | Region-of-interest based 3D video coding |
| WO2014146219A1 (en) * | 2013-03-22 | 2014-09-25 | Qualcomm Incorporated | Depth modeling modes for depth map intra coding |
| CN110070500A (en) * | 2019-03-21 | 2019-07-30 | 浙江大学 | A kind of post-processing approach of depth image |
| CN110070500B (en) * | 2019-03-21 | 2020-12-08 | 浙江大学 | A post-processing method for depth images |
Similar Documents
| Publication | Publication Date | Title |
|---|---|---|
| US10282801B2 (en) | Full-color visibility model using CSF which varies spatially with local luminance | |
| EP1857976B1 (en) | Histogram adjustment for high dynamic range image mapping | |
| EP1857975B1 (en) | Histogram adjustment for high dynamic range image mapping | |
| JP4376912B2 (en) | Color enhancement method and color gamut mapping method | |
| CN105009580B (en) | The display management of high dynamic range video | |
| US9230304B2 (en) | Apparatus and method for enhancing image using color channel | |
| US8391598B2 (en) | Methods for performing local tone mapping | |
| JP5635677B2 (en) | High dynamic range, visual dynamic range and wide color range image and video quality assessment | |
| EP2360906A2 (en) | Method of and apparatus for image denoising | |
| US20160379347A1 (en) | Wide dynamic range imaging method | |
| JPWO2006064913A1 (en) | Image processing method | |
| JP2020145553A (en) | Image processing equipment, image processing methods, and programs | |
| US20210158487A1 (en) | Image processing apparatus, image processing method, and non-transitory computer-readable medium | |
| Fairchild et al. | Image appearance modeling | |
| Ortiz-Jaramillo et al. | Evaluating color difference measures in images | |
| KR101279576B1 (en) | Method for generating panorama image within digital image processing apparatus | |
| JP5103580B2 (en) | Image processing apparatus and digital camera | |
| JP5494249B2 (en) | Image processing apparatus, imaging apparatus, and image processing program | |
| US9123126B2 (en) | Method for enhancing local contrast of an image | |
| JP5135134B2 (en) | Image processing apparatus and method | |
| JP2008107893A (en) | Noise reduction apparatus and method | |
| JP4107014B2 (en) | Image processing apparatus, image processing method, program thereof, and recording medium storing the program | |
| JP2003051000A5 (en) | ||
| Jin et al. | A groundtruth database for testing objective metrics for image difference | |
| CN121190372A (en) | Adaptive image contrast enhancement methods, apparatuses, devices, media, and products |
Legal Events
| Date | Code | Title | Description |
|---|---|---|---|
| PUAI | Public reference made under article 153(3) epc to a published international application that has entered the european phase |
Free format text: ORIGINAL CODE: 0009012 |
|
| AK | Designated contracting states |
Kind code of ref document: A1 Designated state(s): AT BE BG CH CY CZ DE DK EE ES FI FR GB GR HU IE IS IT LI LT LU LV MC NL PL PT RO SE SI SK TR |
|
| AX | Request for extension of the european patent |
Extension state: AL BA HR MK RS |
|
| AKX | Designation fees paid | ||
| REG | Reference to a national code |
Ref country code: DE Ref legal event code: 8566 |
|
| STAA | Information on the status of an ep patent application or granted ep patent |
Free format text: STATUS: THE APPLICATION IS DEEMED TO BE WITHDRAWN |
|
| 18D | Application deemed to be withdrawn |
Effective date: 20090124 |