EP1939616A1 - Multi-frequency image processing for inspecting parts having complex geometric shapes - Google Patents
Multi-frequency image processing for inspecting parts having complex geometric shapes Download PDFInfo
- Publication number
- EP1939616A1 EP1939616A1 EP07123232A EP07123232A EP1939616A1 EP 1939616 A1 EP1939616 A1 EP 1939616A1 EP 07123232 A EP07123232 A EP 07123232A EP 07123232 A EP07123232 A EP 07123232A EP 1939616 A1 EP1939616 A1 EP 1939616A1
- Authority
- EP
- European Patent Office
- Prior art keywords
- image
- eddy current
- phase
- data
- frequency
- Prior art date
- Legal status (The legal status is an assumption and is not a legal conclusion. Google has not performed a legal analysis and makes no representation as to the accuracy of the status listed.)
- Withdrawn
Links
Images


Classifications
-
- G—PHYSICS
- G01—MEASURING; TESTING
- G01N—INVESTIGATING OR ANALYSING MATERIALS BY DETERMINING THEIR CHEMICAL OR PHYSICAL PROPERTIES
- G01N27/00—Investigating or analysing materials by the use of electric, electrochemical, or magnetic means
- G01N27/72—Investigating or analysing materials by the use of electric, electrochemical, or magnetic means by investigating magnetic variables
- G01N27/82—Investigating or analysing materials by the use of electric, electrochemical, or magnetic means by investigating magnetic variables for investigating the presence of flaws
- G01N27/90—Investigating or analysing materials by the use of electric, electrochemical, or magnetic means by investigating magnetic variables for investigating the presence of flaws using eddy currents
- G01N27/9046—Investigating or analysing materials by the use of electric, electrochemical, or magnetic means by investigating magnetic variables for investigating the presence of flaws using eddy currents by analysing electrical signals
-
- G—PHYSICS
- G01—MEASURING; TESTING
- G01N—INVESTIGATING OR ANALYSING MATERIALS BY DETERMINING THEIR CHEMICAL OR PHYSICAL PROPERTIES
- G01N27/00—Investigating or analysing materials by the use of electric, electrochemical, or magnetic means
- G01N27/72—Investigating or analysing materials by the use of electric, electrochemical, or magnetic means by investigating magnetic variables
- G01N27/82—Investigating or analysing materials by the use of electric, electrochemical, or magnetic means by investigating magnetic variables for investigating the presence of flaws
- G01N27/90—Investigating or analysing materials by the use of electric, electrochemical, or magnetic means by investigating magnetic variables for investigating the presence of flaws using eddy currents
- G01N27/9013—Arrangements for scanning
- G01N27/902—Arrangements for scanning by moving the sensors
-
- G—PHYSICS
- G06—COMPUTING OR CALCULATING; COUNTING
- G06V—IMAGE OR VIDEO RECOGNITION OR UNDERSTANDING
- G06V10/00—Arrangements for image or video recognition or understanding
- G06V10/40—Extraction of image or video features
- G06V10/44—Local feature extraction by analysis of parts of the pattern, e.g. by detecting edges, contours, loops, corners, strokes or intersections; Connectivity analysis, e.g. of connected components
Definitions
- the present invention is generally directed to methods of inspecting components using eddy currents and more particularly to methods of inspecting components using eddy currents through the use of image processing.
- Eddy current inspection is a commonly used technique for detecting discontinuities or flaws in the surface of a gas turbine engine component.
- Eddy current techniques are based on the principle of electromagnetic induction in which eddy currents are induced within the material under inspection. Eddy currents are induced in a test specimen by alternating magnetic fields created in the coil of an eddy current probe when the probe is moved into proximity with the component under test. Changes in the flow of eddy currents are caused by the presence of a discontinuity or a crack at or near the surface of the specimen under test.
- the altered eddy currents produce a secondary field which is received by the eddy current probe coil or by a sensor coil in the eddy current probe which converts the altered secondary magnetic field to an electrical signal which may be recorded on a strip chart.
- An eddy current machine operator may then detect and size flaws by monitoring and reading the signals recorded on the strip chart. Flaws or defects are detected if the electrical signal exceeds a predetermined voltage threshold.
- Such complex geometric features can produce larger eddy current signals than the signals from a specific crack or flaw of interest. This makes it difficult to distinguish geometric edge signals, for example, from a crack or seam, especially when using a signal amplitude basis for accepting or rejecting parts.
- What is needed is a method of eddy current inspection that can recognize meaningful signals related to geometry and delete or distinguish them from spurious signals that represent cracks and other important information about the integrity of the part under test.
- a method for inspecting a part comprises providing a part having a non-planar surface, providing an eddy current apparatus, acquiring multi-frequency data for the surface of the part at two different phases, forming a raw inspection image of the surface using the multi-frequency data, enhancing the raw inspection image by phase analysis, and reprocessing the enhanced image using a spatio-temporal filter.
- a method for inspecting a part comprises providing a part having an edge, providing an eddy current apparatus, acquiring phase data for at least two phases in at least two different frequencies for the part under inspection using an eddy current probe, combining the first phase data into a first single multi-frequency phase image having a plurality of pixels, combining the second phase data into a second single multi-frequency phase image having a plurality of pixels, preprocessing each of the first and second multi-frequency phase images, performing a spatio-temporal correlation on each preprocessed phase image to produce a correlation feature, performing a thresholding operation on the correlation feature of each preprocessed phase image to produce a binary first phase image and a binary second phase image, and combining the produced binary images to generate a single image.
- One exemplary embodiment of the invention permits inspection of parts having a complex geometry, including edges, without compromising eddy current signals from relevant indications. It may also minimize the amount of time needed to acquire, process the data, and properly evaluate indications resulting in significant improvement in the sensitivity of the inspection compared to other inspection methods.
- Another exemplary embodiment of the invention provides improved inspection sensitivities by reducing or eliminating undesirable aspects of the eddy current signal that can mask or conceal defect detection.
- improved capability to inspect critical component features up to and including its edges, which are notorious as stress concentration locations where cracks are likely to occur, but which also represent the most likely regions for signal aspects that mask defects.
- Methods according to exemplary embodiments of the invention method eliminate the need for any reference images to suppress the undesired signals arising due to geometric features of the part, edge signals and any other inspection related noise. This improves the speed and reliability of the inspection and makes the inspection process also applicable for cases where a reference sample for the inspection is unavailable. It further eliminates the error associated with the inherent variation between the inspected feature and the nearby reference feature.
- Exemplary embodiments of the invention can be implemented on a PC-based workstation or similar micro-processor based platform, and the associated eddy current inspection can be run and processed on a real-time basis.
- Enhanced defect characterization enables the 90/50 probability of detection to extend to smaller indication size ranges than other methods.
- Exemplary embodiments of the invention relate to eddy current imaging-based inspection for use in a variety of different applications, including medical systems, the automotive industry, the aviation industry, or any other application in which nondestructive evaluations are conducted.
- Exemplary embodiments of the invention identify characteristics in the eddy current signal that are associated with edges or other undesired geometric or contamination effects.
- a mathematically modeled signature characterizes eddy current signals arising from flaws on parts. The model simulates the eddy current signal by inputting parameters such as probe geometry, inspection speed, and flaw configuration. By knowing the shape and frequency component of the eddy current flaw signal, non-relevant eddy current signals can be identified and discriminated.
- a spatio-temporal filter is applied to correlate with the frequency components that are closer to the eddy current flaw signal frequency than any other non-relevant signal frequencies arising from geometry, contamination, material or surface-related noise.
- An automated thresholding algorithm is used to suppress most of the non-relevant signal frequencies, while the remaining signal frequencies that correlate well with filter parameters mimic the eddy current flaw signal. However, a relevant flaw signal may still be missed, i.e. a "True Negative," or a non-relevant indication may be identified as a true indication, a "False Positive.”
- exemplary embodiments of the invention introduce a multi-frequency and phase analysis approach to combine data acquired from multiple frequencies for enhancing the SNR of the raw inspection image data, which is later processed using a spatio-temporal filter for indication identification.
- False Positives usually occur either when there are strong indications arising due to inspection noise or when the noise patterns randomly match with the filter parameters that are used to characterize flaw patterns.
- a false call reduction algorithm eliminates such left over signals based on the signature pattern analysis of the identified region.
- the signal processing techniques eliminate these signals associated with unwanted features, leaving only the indications that are relevant.
- a transfer function may be used to characterize and/or size the relevant indications identified.
- the transfer function takes different features derived from the identified indication as its input and returns an equivalent flaw size measure as output.
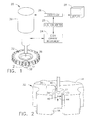
- Figure 1 depicts an exemplary inspection system 20 for performing the inspection of non-planar parts.
- a "part” includes any object being inspected by the present approach, including but not limited to articles, components, structures, test specimens, and the like.
- a "non-planar part” is such an object wherein the surface of the region of the part being inspected is not planar. That is, it has an edge, a contour, or other non-planar surface feature.
- the non-planar "part” of Figure 1 depicts a dovetail arrangement in a disk.
- the inspection system 20 includes an eddy current probe 22, an eddy current instrument 24, an analog to digital (A/D) converter 25, a processor 26, and a display 28, all in communication with one another, such as by cabling.
- the physical configuration of such inspection systems 20 is known in the art, except for the improvements discussed herein.
- the eddy current probe 22 is configured to induce eddy currents in a non-planar part 32, here a disk, and to measure the resulting eddy current response signals, in order to inspect the non-planar part 32.
- Such eddy current probes are known in the art.
- the eddy current probe 22 may be stationary or, preferably, may be moved relative to the non-planar part 32. The movement of the eddy current probe 22 relative to the non-planar part 32 may be accomplished manually or in an automated fashion.
- the eddy current probe 22 is optionally but preferably mounted on a scanner 30 that positions and moves the eddy current probe relative to a stationary non-planar part 32. (Alternatively, the non-planar part 32 may be moved and the eddy current probe 22 held stationary.)
- the optional scanner 30 may be of any type, but is typically a multi-axis numerically controlled device controlled by the processor 26. In the embodiment shown in Figure 1 , the scanner 30 provides translation and rotation of the eddy current probe 22 as may be required for the specific type of non-planar part 32.
- the scanner 30 precisely positions the eddy current probe 22 relative to the non-planar part 32 and moves the eddy current probe 22 in a stepped, rastered fashion.
- the non-planar part 32 has a non-planar edge 34 thereon as an example of a non-planar surface 35, and the inspection is conducted at or near the edge 34.
- "at or near” means that an eddy current response signal (i.e., the signal of interest) of any anomaly in the non-planar part 32 has its signal-to-noise ratio reduced by an eddy current response signal (i.e., noise) of the non-planar surface 35 of the non-planar part 32, in this case the non-planar edge 34.
- An "anomaly” is a feature of interest that is detectable above the background noise by the eddy current technique and whose signal-to-noise ratio may be improved by the present approach.
- anomalies include cracks, incipient cracks, inclusions at or near the surface, particles at or near the surface, porosity, voids and the like.
- the presence of the non-planar edge 34 produces noise in the eddy current response signals, and the present approach improves the signal-to-noise ratio of the eddy current response signals.
- non-planar parts 32 there are a large number of types of non-planar parts 32 that may have contours or edges 34 thereon.
- the non-planar part 32 is a turbine disk 36
- the inspected non-planar surface 35 is a portion of a disk slot 38 formed along the outer periphery of the turbine disk 36, the slot 38 having an edge 34.
- non-planar surfaces include, for example, machined or cast edges between a front and a side of the non-planar part, a leading edge of an airfoil (such as a turbine blade or vane), a trailing edge of the airfoil, a blade root of the airfoil, intentionally produced holes such as fastener holes or large bores, and openings such as cooling holes.
- the eddy current probe 22 may have any configuration operable for the type of non-planar part 32 being inspected.
- the physical configuration and electrical characteristics of the eddy current probe 22 are typically optimized for each type of non-planar part 32.
- the edge 34 has an associated stress concentration when loaded in service. Consequently, anomalies such as a crack 40 illustrated in Figure 2 may preferentially initiate at or near the edge 34.
- the crack 40 is illustrated as a surface edge crack, but it may be a surface near-edge crack, or a subsurface edge or near-edge crack as well.
- the eddy current inspection system 20 is used to detect such a crack 40 at an early stage. Once detected after reaching a resolvable size, the crack 40 may be repaired using known techniques, or, if the crack 40 cannot be repaired, the non-planar part 32 is removed from service. The noise that is otherwise present in the eddy current response signal associated with the edge 34 tends to mask the presence of the crack 40.
- FIG. 3 depicts the steps in an embodiment of the present approach.
- the non-planar part 32 having the edge 34 is provided, step 100.
- the eddy current apparatus including the eddy current probe 22, the eddy current instrument 24, the processor 26, and preferably the display 28, is provided, step 110.
- the eddy current probe 22 is positioned adjacent the non-planar part 32, as illustrated in Figures 1 and 2 .
- the probe 22 has a single coil.
- the probe 22 has two coils. Eddy currents are responsively produced in the non-planar part 32.
- eddy currents are regular in form, except when they are disturbed by the presence of the crack 40 (an example of an anomaly).
- the eddy current produces a secondary electrical field, which is measured by the eddy current probe coil or by other types of sensors in the eddy current probe as an eddy current response signal.
- the measured eddy current response signal is converted to an electrical output, which in turn is provided to the eddy current instrument 24 and thence to the processor 26 for analysis.
- the eddy current probe 22 is driven at two or more frequencies, step 120.
- a single pair of two frequencies, f 1 and f 2 are used, but additional other pairs of frequencies f 3 ... f n may be selected.
- the eddy current probe 22 is preferably driven simultaneously with all of the frequencies, but it may be driven sequentially with these frequencies.
- the selected frequencies may be any two or more frequencies that are operable in an eddy current inspection system. It will be appreciated that selection of specific frequencies to be used depends upon considerations such as the size and type of the anomaly being sought, the geometry of the non-planar part, the material from which the non-planar part is made, eddy current signal characteristics, and other considerations.
- the processor 26 is configured to analyze the output of the eddy current instrument 24, and thence the eddy current probe 22, as will be described next.
- the eddy current probe 22 is scanned in a series of steps over the non-planar surface 35 of the non-planar part 32, step 130, to acquire channel data at two different phases for each of the frequencies driving or exciting the eddy current coil.
- the eddy current probe 22 is incrementally scanned in a vertical (or V) direction 42 in a series of discrete steps and thereafter indexed in a horizontal (or H) direction 44 (although it will be appreciated that scanning could be horizontal with vertical indexing as long as substantially complete coverage of the surface is provided in either case) to acquire channel data at two different phases (e.g. H and V) for each of the frequencies driving or exciting the eddy current coil.
- the discrete steps in the vertical direction 42 are then repeated at the new index location. This process is repeated until desired coverage of the non-planar surface 35 of the non-planar part 32 is achieved.
- This scanning process is managed by the scanner 30 under programmed control of the processor 26.
- the analog eddy current signals from the eddy current probe 22 are converted by the A/D converter 25 to digital signals that are stored by the processor 26 and combined after the scanning operation of each non-planar surface 35 to provide a two-dimensional digital image.
- Each of the two-dimensional images includes a multiplicity of picture elements or pixels 54 as illustrated in Figure 7 .
- the pixels 54 are usually arranged in uniform columns and rows to form an X-Y matrix type structure.
- Each of the pixels has a gray scale intensity (I ij ) which corresponds to the eddy current signal at the location on the surface 35 represented by the particular pixel 54 or group of pixels; thus, changes in the gray scale intensity of the pixels 54 making up the image results from local changes caused by the induced eddy currents.
- H channel data from multiple frequencies is combined to one multi-frequency H image, step 140, that may be displayed to the display 28.
- V channel data from multiple frequencies is combined to one multi-frequency V image.
- the mixing of the multiple frequency data is achieved by the phase rotation and scaling of the H and V components in the impedance plane.
- the goal of this image mixing step is to improve the signal to noise ratio (SNR) of the smallest detectable feature from the crack 40.
- SNR signal to noise ratio
- Figure 5 illustrates images for each of a single pair of frequencies in two phases (H1, H2 and V1 and V2) and the combined multi-frequency images for each phase (H_MF and V_MF). While the characteristic anomaly signature (here the checkerboard pattern from an actual inspection image is shown) appears in each of the single frequency H and V images, the images are accompanied by significant noise (e.g., changes in grayscale that extend horizontally across each image as lines). While the multi-frequency images still have some residual noise (e.g., pixilated regions near the checkerboards) that must be eliminated by further processing for satisfactory identification and characterization of relevant indications, they reduce much of the original noise present in each of the single frequency images.
- residual noise e.g., pixilated regions near the checkerboards
- each of the multi-frequency H and V images are preprocessed by applying one or more filters to enhance each image for noise and artifact removal, step 150.
- This may include engaging a suitable low pass filter to estimate edges that show up as low frequency components and remove them.
- a de-blurring filter or other noise removal filter may be applied to remove speckle noise.
- a high pass filter may be used to remove high frequency noise that may arise from the instrumentation.
- Appropriate smoothing filters may be used to help remove any remaining artifacts after one or more of the above-referenced filter operations are completed and may also restore any significant defect characteristics that are present in the image.
- the output of the pre-processing results in a multi-frequency H and a multi-frequency V image, each of which have been enhanced to remove noise and artifacts and thereby enhancing relevant, remaining indications better suited for further analysis.
- each multi-frequency H and V image is subjected to image processing using a spatio-temporal correlation analysis with a designed filter whose parameters are tuned to the frequency characteristics of the anomalous signature that is of interest, step 160.
- Spatio-temporal filter parameters can be calculated from inspection parameters. From the deconstructed images obtained by the prior steps, this analysis removes non-relevant signals from sources such as material noise, contamination or geometry changes so that only eddy current signals from relevant indications are presented. That is, each preprocessed multi-frequency image is analyzed with respect to space and time in light of specific parameters that relate to the type of inspection being conducted to produce a correlation feature.
- the spatio-temporal analysis may be accomplished in two steps.
- An original raw image is processed with two-level processing that produces five frequency components.
- the first component is low pass convolution, the next two are the result of high and medium band pass in a horizontal direction and the remaining two are the result of high and medium band pass in a vertical direction.
- Second, the image is reconstructed with the frequency components that are relevant to eddy current flaw signals. Of the five processed components, generally only a few are actually used for reconstructing the image for flaw detection.
- the reconstructed image has edge signals removed and flaw signals remaining which further improves the SNR.
- An automated thresholding operation is performed on the correlation feature that results from the spatio-temporal analysis for each of the H and V multi-frequency images. This operation segments out the potential defect regions.
- the threshold value selected adapts itself to the kind of signal provided based on statistics of the image under analysis.
- the threshold selection process is achieved in the following sub-steps, illustrated in Figure 4 .
- the decimal position value is an indication of percentage of pixel variation.
- D i-(i+1) 0 it may be replaced with D (i-1)-i which aids in the segmentation process.
- a particular decimal value d ⁇ ⁇ D ⁇ is defined that specifies a significant change in the signal level, step 178.
- the threshold value that is reported is the signal value S i that corresponds to the signal level at which the decimal place value 'd' is encountered first.
- the decision criteria 'd' to select the threshold can be customized based on the application.
- the thresholding operation thus includes removal of background regions from identified regions.
- Identified regions are the regions that were identified in the pre-processing steps.
- the background region is represented by a gray scale value of zero and the identified regions are represented by a gray scale value of one.
- Gap filling is a technique by which the gray scale value of a background region in the image between two identified regions of interest is changed.
- the output of step 170 is a binary thresholded image for each of H and V.
- step 180 the binary images from H and V are combined to a single binary image through a selective region overlapping process by computing the union and intersection of each of the two binary images.
- some of the identified regions can be dropped from further processing if they do not meet the necessary criteria to be identified as a potential defect region.
- the output of this step is a single binary image that consists of various highlighted regions.
- FIG. 1 illustrates a product image of the invention that shows a single binary image that illustrates two anomalies 40, one of which was not apparent from the noise in any of the horizontal or vertical images.
- a transfer function e.g., an A-hat function
- the features can be either one-dimensional or two-dimensional, based on the signal characteristics and the dimensions of the closed shape. In one embodiment, the dimensions of the closed shape are used to suppress false flaw regions.
- the A-hat value which uses the above features can be used to characterize the flaw.
- the defect characterizing parameter is represented by the features like energy and entropy. Thus, the A-hat value may be calculated as a function of the maximum and minimum amplitudes, the energy, entropy, pixels, and phase of the identified region.
- the anomalies identified, along with any features and size estimates, may be reported, step 220, although it will be appreciated that the existence of anomalies may be reported at any time.
- Features and size estimates may be of interest for the part under inspection, which is typically unknown until after the additional processing steps.
- Methods in accordance with exemplary embodiments of the invention do not require reference parts or reference images to detect and characterize the flaws.
- the method significantly reduces the inspection time and is more suitable for real time applications.
- the method can be used to detect smaller flaw sizes and increases the 90/50 probability of detection (POD) to extend to smaller anomaly size ranges than other methods. That is, 90% of anomalies of a certain size can be detected with 50% confidence.
- the method can reliably detect and characterizes flaws at edges that historically have been difficult to identify and analyze.
Landscapes
- Chemical & Material Sciences (AREA)
- Engineering & Computer Science (AREA)
- Physics & Mathematics (AREA)
- General Physics & Mathematics (AREA)
- Biochemistry (AREA)
- Analytical Chemistry (AREA)
- Pathology (AREA)
- Chemical Kinetics & Catalysis (AREA)
- Electrochemistry (AREA)
- Health & Medical Sciences (AREA)
- Life Sciences & Earth Sciences (AREA)
- Immunology (AREA)
- General Health & Medical Sciences (AREA)
- Computer Vision & Pattern Recognition (AREA)
- Theoretical Computer Science (AREA)
- Multimedia (AREA)
- Investigating Or Analyzing Materials By The Use Of Magnetic Means (AREA)
- Measurement Of Length, Angles, Or The Like Using Electric Or Magnetic Means (AREA)
Abstract
Description
- The present invention is generally directed to methods of inspecting components using eddy currents and more particularly to methods of inspecting components using eddy currents through the use of image processing.
- Eddy current inspection is a commonly used technique for detecting discontinuities or flaws in the surface of a gas turbine engine component. Eddy current techniques are based on the principle of electromagnetic induction in which eddy currents are induced within the material under inspection. Eddy currents are induced in a test specimen by alternating magnetic fields created in the coil of an eddy current probe when the probe is moved into proximity with the component under test. Changes in the flow of eddy currents are caused by the presence of a discontinuity or a crack at or near the surface of the specimen under test. The altered eddy currents produce a secondary field which is received by the eddy current probe coil or by a sensor coil in the eddy current probe which converts the altered secondary magnetic field to an electrical signal which may be recorded on a strip chart. An eddy current machine operator may then detect and size flaws by monitoring and reading the signals recorded on the strip chart. Flaws or defects are detected if the electrical signal exceeds a predetermined voltage threshold.
- Present eddy current inspection methods work satisfactorily when the components under inspection have simple geometrical shapes, such as holes, flat plates or the like. However, when the component under test has a complex geometrical shape, such as the dovetail slots of a high pressure or low pressure turbine disk, fan disk, high pressure compressor disk, teeth of a gear or the like, the complex geometry of these components such as edges and transitions between convex, concave and flat regions, produces contributions to the eddy current signals which make it difficult to distinguish between defects and geometric effects.
- Such complex geometric features can produce larger eddy current signals than the signals from a specific crack or flaw of interest. This makes it difficult to distinguish geometric edge signals, for example, from a crack or seam, especially when using a signal amplitude basis for accepting or rejecting parts.
- One attempt at solving this problem is described in
U.S. Patent 5,345,514 , which builds real time images from identical, repeated geometries in a part. After the collection of several of these images, a subtraction process is initiated that subtracts the images from adjacent features. While this reduces the dominant edge signals that are common to adjacent features, it does not eliminate them due to geometric variation from feature to feature within a single part. If only one feature is to be inspected, the method does not work because there are no repeated images to subtract. - Conventional, single probe eddy current inspections have utilized numerous filtering techniques that distinguish between relevant and non-relevant signals, or filter out signals from different portions of the frequency spectrum. Yet none of these techniques have been satisfactory in reducing or eliminating edge and other geometry signals.
- What is needed is a method of eddy current inspection that can recognize meaningful signals related to geometry and delete or distinguish them from spurious signals that represent cracks and other important information about the integrity of the part under test.
- According to an exemplary embodiment of the invention, a method for inspecting a part is disclosed. The method comprises providing a part having a non-planar surface, providing an eddy current apparatus, acquiring multi-frequency data for the surface of the part at two different phases, forming a raw inspection image of the surface using the multi-frequency data, enhancing the raw inspection image by phase analysis, and reprocessing the enhanced image using a spatio-temporal filter.
- According to another exemplary embodiment of the invention, a method for inspecting a part comprises providing a part having an edge, providing an eddy current apparatus, acquiring phase data for at least two phases in at least two different frequencies for the part under inspection using an eddy current probe, combining the first phase data into a first single multi-frequency phase image having a plurality of pixels, combining the second phase data into a second single multi-frequency phase image having a plurality of pixels, preprocessing each of the first and second multi-frequency phase images, performing a spatio-temporal correlation on each preprocessed phase image to produce a correlation feature, performing a thresholding operation on the correlation feature of each preprocessed phase image to produce a binary first phase image and a binary second phase image, and combining the produced binary images to generate a single image.
- One exemplary embodiment of the invention permits inspection of parts having a complex geometry, including edges, without compromising eddy current signals from relevant indications. It may also minimize the amount of time needed to acquire, process the data, and properly evaluate indications resulting in significant improvement in the sensitivity of the inspection compared to other inspection methods.
- Another exemplary embodiment of the invention provides improved inspection sensitivities by reducing or eliminating undesirable aspects of the eddy current signal that can mask or conceal defect detection. Of particular benefit is the improved capability to inspect critical component features up to and including its edges, which are notorious as stress concentration locations where cracks are likely to occur, but which also represent the most likely regions for signal aspects that mask defects.
- Methods according to exemplary embodiments of the invention method eliminate the need for any reference images to suppress the undesired signals arising due to geometric features of the part, edge signals and any other inspection related noise. This improves the speed and reliability of the inspection and makes the inspection process also applicable for cases where a reference sample for the inspection is unavailable. It further eliminates the error associated with the inherent variation between the inspected feature and the nearby reference feature.
- Exemplary embodiments of the invention can be implemented on a PC-based workstation or similar micro-processor based platform, and the associated eddy current inspection can be run and processed on a real-time basis.
- Enhanced defect characterization enables the 90/50 probability of detection to extend to smaller indication size ranges than other methods.
- Various features and advantages of the present invention will be apparent from the following more detailed description of exemplary embodiments, taken in conjunction with the accompanying drawings which illustrate, by way of example, the principles of the invention, and in which:
-
Figure 1 schematically depicts an eddy current inspection system for a non-planar part with an edge; -
Figure 2 is a schematic detail, taken inregion 2 ofFigure 1 , showing the dovetail feature being inspected; -
Figure 3 is a block flow diagram of an embodiment of a method for practicing various aspects of the present invention; -
Figure 4 is a block flow diagram of an embodiment of a sub-routine of a method for practicing various aspects of the present invention; -
Figure 5 illustrates single frequency and multi-frequency horizontal and vertical images generated in accordance with a method for practicing various aspects of the invention; -
Figure 6 illustrates a combined image generated in accordance with a method for practicing various aspects of the invention; and -
Figure 7 illustrates a portion of a two-dimensional digital image showing individual pixels. - Where like parts appear in more than one drawing, it has been attempted to use like reference numerals for clarity.
- Exemplary embodiments of the invention relate to eddy current imaging-based inspection for use in a variety of different applications, including medical systems, the automotive industry, the aviation industry, or any other application in which nondestructive evaluations are conducted.
- Exemplary embodiments of the invention identify characteristics in the eddy current signal that are associated with edges or other undesired geometric or contamination effects. A mathematically modeled signature characterizes eddy current signals arising from flaws on parts. The model simulates the eddy current signal by inputting parameters such as probe geometry, inspection speed, and flaw configuration. By knowing the shape and frequency component of the eddy current flaw signal, non-relevant eddy current signals can be identified and discriminated.
- A spatio-temporal filter is applied to correlate with the frequency components that are closer to the eddy current flaw signal frequency than any other non-relevant signal frequencies arising from geometry, contamination, material or surface-related noise. An automated thresholding algorithm is used to suppress most of the non-relevant signal frequencies, while the remaining signal frequencies that correlate well with filter parameters mimic the eddy current flaw signal. However, a relevant flaw signal may still be missed, i.e. a "True Negative," or a non-relevant indication may be identified as a true indication, a "False Positive."
- "True Negatives" usually occur when the signal strength relative to the other background information is not enough to correlate with the filter parameters, that is, there is a low signal to noise ratio (SNR). To minimize the "True Negatives," exemplary embodiments of the invention introduce a multi-frequency and phase analysis approach to combine data acquired from multiple frequencies for enhancing the SNR of the raw inspection image data, which is later processed using a spatio-temporal filter for indication identification.
- "False Positives" usually occur either when there are strong indications arising due to inspection noise or when the noise patterns randomly match with the filter parameters that are used to characterize flaw patterns. A false call reduction algorithm eliminates such left over signals based on the signature pattern analysis of the identified region.
- The signal processing techniques eliminate these signals associated with unwanted features, leaving only the indications that are relevant.
- A transfer function may be used to characterize and/or size the relevant indications identified. The transfer function takes different features derived from the identified indication as its input and returns an equivalent flaw size measure as output.
-
Figure 1 depicts anexemplary inspection system 20 for performing the inspection of non-planar parts. As used herein, a "part" includes any object being inspected by the present approach, including but not limited to articles, components, structures, test specimens, and the like. A "non-planar part" is such an object wherein the surface of the region of the part being inspected is not planar. That is, it has an edge, a contour, or other non-planar surface feature. The non-planar "part" ofFigure 1 depicts a dovetail arrangement in a disk. - The
inspection system 20 includes an eddycurrent probe 22, an eddycurrent instrument 24, an analog to digital (A/D)converter 25, aprocessor 26, and adisplay 28, all in communication with one another, such as by cabling. The physical configuration ofsuch inspection systems 20 is known in the art, except for the improvements discussed herein. The eddycurrent probe 22 is configured to induce eddy currents in anon-planar part 32, here a disk, and to measure the resulting eddy current response signals, in order to inspect thenon-planar part 32. Such eddy current probes are known in the art. - The eddy
current probe 22 may be stationary or, preferably, may be moved relative to thenon-planar part 32. The movement of theeddy current probe 22 relative to thenon-planar part 32 may be accomplished manually or in an automated fashion. Theeddy current probe 22 is optionally but preferably mounted on ascanner 30 that positions and moves the eddy current probe relative to a stationarynon-planar part 32. (Alternatively, thenon-planar part 32 may be moved and theeddy current probe 22 held stationary.) Theoptional scanner 30 may be of any type, but is typically a multi-axis numerically controlled device controlled by theprocessor 26. In the embodiment shown inFigure 1 , thescanner 30 provides translation and rotation of theeddy current probe 22 as may be required for the specific type ofnon-planar part 32. Thescanner 30 precisely positions theeddy current probe 22 relative to thenon-planar part 32 and moves theeddy current probe 22 in a stepped, rastered fashion. - As shown in
Figure 2 , thenon-planar part 32 has anon-planar edge 34 thereon as an example of anon-planar surface 35, and the inspection is conducted at or near theedge 34. As used herein, "at or near" means that an eddy current response signal (i.e., the signal of interest) of any anomaly in thenon-planar part 32 has its signal-to-noise ratio reduced by an eddy current response signal (i.e., noise) of thenon-planar surface 35 of thenon-planar part 32, in this case thenon-planar edge 34. An "anomaly" is a feature of interest that is detectable above the background noise by the eddy current technique and whose signal-to-noise ratio may be improved by the present approach. Examples of anomalies include cracks, incipient cracks, inclusions at or near the surface, particles at or near the surface, porosity, voids and the like. The presence of thenon-planar edge 34 produces noise in the eddy current response signals, and the present approach improves the signal-to-noise ratio of the eddy current response signals. - There are a large number of types of
non-planar parts 32 that may have contours or edges 34 thereon. In the illustrations ofFigures 1 and 2 , thenon-planar part 32 is aturbine disk 36, and the inspectednon-planar surface 35 is a portion of adisk slot 38 formed along the outer periphery of theturbine disk 36, theslot 38 having anedge 34. Other types of non-planar surfaces include, for example, machined or cast edges between a front and a side of the non-planar part, a leading edge of an airfoil (such as a turbine blade or vane), a trailing edge of the airfoil, a blade root of the airfoil, intentionally produced holes such as fastener holes or large bores, and openings such as cooling holes. In the present approach, theeddy current probe 22 may have any configuration operable for the type ofnon-planar part 32 being inspected. The physical configuration and electrical characteristics of theeddy current probe 22 are typically optimized for each type ofnon-planar part 32. - The
edge 34 has an associated stress concentration when loaded in service. Consequently, anomalies such as acrack 40 illustrated inFigure 2 may preferentially initiate at or near theedge 34. Thecrack 40 is illustrated as a surface edge crack, but it may be a surface near-edge crack, or a subsurface edge or near-edge crack as well. The eddycurrent inspection system 20 is used to detect such acrack 40 at an early stage. Once detected after reaching a resolvable size, thecrack 40 may be repaired using known techniques, or, if thecrack 40 cannot be repaired, thenon-planar part 32 is removed from service. The noise that is otherwise present in the eddy current response signal associated with theedge 34 tends to mask the presence of thecrack 40. -
Figure 3 depicts the steps in an embodiment of the present approach. Thenon-planar part 32 having theedge 34 is provided,step 100. The eddy current apparatus, including theeddy current probe 22, theeddy current instrument 24, theprocessor 26, and preferably thedisplay 28, is provided,step 110. Theeddy current probe 22 is positioned adjacent thenon-planar part 32, as illustrated inFigures 1 and 2 . In general, when theeddy current probe 22 is driven with an alternating-frequency current, alternating magnetic fields are produced in the coil(s) of theeddy current probe 22. In one embodiment, theprobe 22 has a single coil. In another embodiment theprobe 22 has two coils. Eddy currents are responsively produced in thenon-planar part 32. These eddy currents are regular in form, except when they are disturbed by the presence of the crack 40 (an example of an anomaly). The eddy current produces a secondary electrical field, which is measured by the eddy current probe coil or by other types of sensors in the eddy current probe as an eddy current response signal. The measured eddy current response signal is converted to an electrical output, which in turn is provided to theeddy current instrument 24 and thence to theprocessor 26 for analysis. - In the present approach, the
eddy current probe 22 is driven at two or more frequencies,step 120. For the illustration, a single pair of two frequencies, f1 and f2 , are used, but additional other pairs of frequencies f 3...fn may be selected. Theeddy current probe 22 is preferably driven simultaneously with all of the frequencies, but it may be driven sequentially with these frequencies. The selected frequencies may be any two or more frequencies that are operable in an eddy current inspection system. It will be appreciated that selection of specific frequencies to be used depends upon considerations such as the size and type of the anomaly being sought, the geometry of the non-planar part, the material from which the non-planar part is made, eddy current signal characteristics, and other considerations. - The
processor 26 is configured to analyze the output of theeddy current instrument 24, and thence theeddy current probe 22, as will be described next. - The
eddy current probe 22 is scanned in a series of steps over thenon-planar surface 35 of thenon-planar part 32,step 130, to acquire channel data at two different phases for each of the frequencies driving or exciting the eddy current coil. In one embodiment, theeddy current probe 22 is incrementally scanned in a vertical (or V)direction 42 in a series of discrete steps and thereafter indexed in a horizontal (or H) direction 44 (although it will be appreciated that scanning could be horizontal with vertical indexing as long as substantially complete coverage of the surface is provided in either case) to acquire channel data at two different phases (e.g. H and V) for each of the frequencies driving or exciting the eddy current coil. The discrete steps in thevertical direction 42 are then repeated at the new index location. This process is repeated until desired coverage of thenon-planar surface 35 of thenon-planar part 32 is achieved. This scanning process is managed by thescanner 30 under programmed control of theprocessor 26. - As previously discussed, the analog eddy current signals from the
eddy current probe 22 are converted by the A/D converter 25 to digital signals that are stored by theprocessor 26 and combined after the scanning operation of eachnon-planar surface 35 to provide a two-dimensional digital image. Each of the two-dimensional images includes a multiplicity of picture elements orpixels 54 as illustrated inFigure 7 . Thepixels 54 are usually arranged in uniform columns and rows to form an X-Y matrix type structure. Each of the pixels has a gray scale intensity (Iij) which corresponds to the eddy current signal at the location on thesurface 35 represented by theparticular pixel 54 or group of pixels; thus, changes in the gray scale intensity of thepixels 54 making up the image results from local changes caused by the induced eddy currents. Changes in the component geometry such as edges, transitions between convex, concave and flat surfaces, other surface anomalies and flaws or defects will cause local changes in the eddy current signal which results in differences in the gray scale intensities (Iij) of the pixels composing the two-dimensional digital images at those locations in the image corresponding to where the part geometry changes or where a defect or flaw is located. - H channel data from multiple frequencies is combined to one multi-frequency H image,
step 140, that may be displayed to thedisplay 28. Likewise, V channel data from multiple frequencies is combined to one multi-frequency V image. The mixing of the multiple frequency data is achieved by the phase rotation and scaling of the H and V components in the impedance plane. The goal of this image mixing step is to improve the signal to noise ratio (SNR) of the smallest detectable feature from thecrack 40. Thus, the output of this mixing is two separate images that represent the effective H and V components from different frequencies, respectively, in which the SNR is improved as compared with the individual frequencies. As used herein, "SNR" is defined as follows:
where - ROI is the region of interest
- BCK is the region that represents background or noise
-
Figure 5 illustrates images for each of a single pair of frequencies in two phases (H1, H2 and V1 and V2) and the combined multi-frequency images for each phase (H_MF and V_MF). While the characteristic anomaly signature (here the checkerboard pattern from an actual inspection image is shown) appears in each of the single frequency H and V images, the images are accompanied by significant noise (e.g., changes in grayscale that extend horizontally across each image as lines). While the multi-frequency images still have some residual noise (e.g., pixilated regions near the checkerboards) that must be eliminated by further processing for satisfactory identification and characterization of relevant indications, they reduce much of the original noise present in each of the single frequency images. - Typically, but not necessarily, each of the multi-frequency H and V images are preprocessed by applying one or more filters to enhance each image for noise and artifact removal,
step 150. This may include engaging a suitable low pass filter to estimate edges that show up as low frequency components and remove them. A de-blurring filter or other noise removal filter may be applied to remove speckle noise. A high pass filter may be used to remove high frequency noise that may arise from the instrumentation. Appropriate smoothing filters may be used to help remove any remaining artifacts after one or more of the above-referenced filter operations are completed and may also restore any significant defect characteristics that are present in the image. The output of the pre-processing results in a multi-frequency H and a multi-frequency V image, each of which have been enhanced to remove noise and artifacts and thereby enhancing relevant, remaining indications better suited for further analysis. - Following any pre-processing steps, each multi-frequency H and V image is subjected to image processing using a spatio-temporal correlation analysis with a designed filter whose parameters are tuned to the frequency characteristics of the anomalous signature that is of interest,
step 160. Spatio-temporal filter parameters can be calculated from inspection parameters. From the deconstructed images obtained by the prior steps, this analysis removes non-relevant signals from sources such as material noise, contamination or geometry changes so that only eddy current signals from relevant indications are presented. That is, each preprocessed multi-frequency image is analyzed with respect to space and time in light of specific parameters that relate to the type of inspection being conducted to produce a correlation feature. - The spatio-temporal analysis may be accomplished in two steps. First, the raw image is deconstructed into several images with different frequency components. An original raw image is processed with two-level processing that produces five frequency components. The first component is low pass convolution, the next two are the result of high and medium band pass in a horizontal direction and the remaining two are the result of high and medium band pass in a vertical direction. From the five deconstructed images, frequency components relating to part geometry features are filtered out and only relevant information is left for further processing. Second, the image is reconstructed with the frequency components that are relevant to eddy current flaw signals. Of the five processed components, generally only a few are actually used for reconstructing the image for flaw detection. The reconstructed image has edge signals removed and flaw signals remaining which further improves the SNR.
- An automated thresholding operation,
step 170, is performed on the correlation feature that results from the spatio-temporal analysis for each of the H and V multi-frequency images. This operation segments out the potential defect regions. The threshold value selected adapts itself to the kind of signal provided based on statistics of the image under analysis. In one embodiment, the threshold selection process is achieved in the following sub-steps, illustrated inFigure 4 . - The ratio (R) of the number of pixels thresholded of the image under consideration is calculated with respect to the total number of pixels in that image by varying signal threshold by a small incremental amount,
step 172. For example, let R = {R1, R2,...... Rn} for a set of ratio values calculated at signal values {S1, S2,...... Sn}. Thus, the ratio R for any given signal value can be defined according to the following equation:
- Next, the difference between two consecutive ratio values is calculated: Ri-j = {R1- R2, R2- R3,...... Rn-1-Rn},
step 174. This ratio difference is zero if the signal increment does not add any extra pixels. A high decimal change in ratio indicates that a small difference in signal led to a large number of pixels to be added to the thresholded values. - Decimal position values of the ratio differences are recorded,
step 176, for a set of decimal points, D = {D1-2, D2-3,....... D(n-1)-n}, in which D is an integer that represents the first significant digit in the difference calculated instep 174. For example, if R1-R2 = 0.00067, then D1-2 = 4, the first significant decimal position value; similarly if R2- R3 = 0.00325, then D1-2 = 3. The decimal position value is an indication of percentage of pixel variation. - In the event that Di-(i+1) = 0, it may be replaced with D(i-1)-i which aids in the segmentation process.
- From the application domain knowledge, a particular decimal value d ∈ {D} is defined that specifies a significant change in the signal level,
step 178. The threshold value that is reported is the signal value Si that corresponds to the signal level at which the decimal place value 'd' is encountered first. The decision criteria 'd' to select the threshold can be customized based on the application. - The thresholding operation thus includes removal of background regions from identified regions. Identified regions are the regions that were identified in the pre-processing steps. Generally, the background region is represented by a gray scale value of zero and the identified regions are represented by a gray scale value of one. Thus, if a distance between two or more identified regions is less than the selected threshold value determined in steps 172-178, gap filling is performed. Gap filling is a technique by which the gray scale value of a background region in the image between two identified regions of interest is changed. Thus, the output of
step 170 is a binary thresholded image for each of H and V. - Returning to
Figure 3 , atstep 180, the binary images from H and V are combined to a single binary image through a selective region overlapping process by computing the union and intersection of each of the two binary images. At this step, some of the identified regions can be dropped from further processing if they do not meet the necessary criteria to be identified as a potential defect region. The output of this step is a single binary image that consists of various highlighted regions. - Once the single binary image has been produced, the highlighted regions of interested in the binary image may be trimmed or pruned and approximated to a rectangular shape,
step 190. Each of the identified regions is then tested for a checkerboard pattern, which is a characteristic anomaly signature,step 200, to reduce any false calls, i.e. "False Positives."Figure 6 illustrates a product image of the invention that shows a single binary image that illustrates twoanomalies 40, one of which was not apparent from the noise in any of the horizontal or vertical images. - Features such as the maximum signal amplitude, number of pixels, energy contained, entropy and other attributes that represent the signature of the signal may be computed from each of the identified checkerboard regions still under consideration,
step 210. In one embodiment, a transfer function (e.g., an A-hat function) that incorporates one or more of these features may be used to provide an estimate of the anomaly size for each of the identified regions. The features can be either one-dimensional or two-dimensional, based on the signal characteristics and the dimensions of the closed shape. In one embodiment, the dimensions of the closed shape are used to suppress false flaw regions. The A-hat value which uses the above features can be used to characterize the flaw. In one embodiment, the defect characterizing parameter is represented by the features like energy and entropy. Thus, the A-hat value may be calculated as a function of the maximum and minimum amplitudes, the energy, entropy, pixels, and phase of the identified region. - The anomalies identified, along with any features and size estimates, may be reported,
step 220, although it will be appreciated that the existence of anomalies may be reported at any time. Features and size estimates may be of interest for the part under inspection, which is typically unknown until after the additional processing steps. - Methods in accordance with exemplary embodiments of the invention do not require reference parts or reference images to detect and characterize the flaws. Hence, the method significantly reduces the inspection time and is more suitable for real time applications. The method can be used to detect smaller flaw sizes and increases the 90/50 probability of detection (POD) to extend to smaller anomaly size ranges than other methods. That is, 90% of anomalies of a certain size can be detected with 50% confidence. Importantly, the method can reliably detect and characterizes flaws at edges that historically have been difficult to identify and analyze.
- While the foregoing specification illustrates and describes exemplary embodiments, it will be understood by those skilled in the art that various changes may be made and equivalents may be substituted for elements thereof without departing from the scope of the invention. In addition, many modifications may be made to adapt a particular situation or material to the teachings of the invention without departing from the essential scope thereof. Therefore, it is intended that the invention not be limited to the particular embodiment disclosed as the preferred mode contemplated for carrying out this invention, but that the invention will include all embodiments falling within the scope of the appended claims.
Claims (10)
- A method for inspecting a part comprising:providing a part (32) having an edge (34);providing an eddy current apparatus (20);acquiring phase data for at least two phases in at least two different frequencies for the part (32) under inspection using an eddy current probe (22);combining the first phase data into a first single multi-frequency phase image having a plurality of pixels;combining the second phase data into a second single multi-frequency phase image having a plurality of pixels;preprocessing (150) each of the first and second multi-frequency phase images;performing a spatio-temporal correlation (160) on each preprocessed phase image to produce a correlation feature;performing a thresholding operation (170) on the correlation feature of each preprocessed phase image to produce a binary first phase image and a binary second phase image; andcombining the produced binary images to generate a single image (180).
- The method of claim 1, further comprising pruning (190) a portion of the generated single image.
- The method of any preceding claim, further comprising identifying (190) an anomaly signature on the generated single image.
- The method of any preceding claim, further comprising estimating anomaly size.
- The method of any preceding claim, further comprising generating a report (220) identifying anomaly features.
- The method of any preceding claim, wherein acquiring phase data for at least two phases comprises acquiring horizontal and vertical channel data (130).
- The method of any preceding claim, wherein acquiring data for two frequencies in a single phase occurs simultaneously.
- The method of any preceding claim, wherein the thresholding (170) operation comprises:calculating a ratio of pixels (172) thresholded with respect to the total number of pixels in the image at different signal values;calculating a difference (174) between consecutive signal value ratios;recording decimal position values (176) for each difference; anddefining (178) a decimal value threshold.
- The method of any preceding claim, wherein the preprocessing (150) comprises:applying a low pass filter, a de-blurring filter, a high pass filter, a smoothing filter or a combination thereof.
- The method of any preceding claim, wherein the phase data is acquired for two different phases and wherein the data acquired for the first phase is acquired using the same frequencies as the data acquired for the second phase.
Applications Claiming Priority (1)
| Application Number | Priority Date | Filing Date | Title |
|---|---|---|---|
| US11/617,859 US7817845B2 (en) | 2006-12-29 | 2006-12-29 | Multi-frequency image processing for inspecting parts having complex geometric shapes |
Publications (1)
| Publication Number | Publication Date |
|---|---|
| EP1939616A1 true EP1939616A1 (en) | 2008-07-02 |
Family
ID=39295883
Family Applications (1)
| Application Number | Title | Priority Date | Filing Date |
|---|---|---|---|
| EP07123232A Withdrawn EP1939616A1 (en) | 2006-12-29 | 2007-12-14 | Multi-frequency image processing for inspecting parts having complex geometric shapes |
Country Status (4)
| Country | Link |
|---|---|
| US (1) | US7817845B2 (en) |
| EP (1) | EP1939616A1 (en) |
| JP (1) | JP2008164613A (en) |
| CN (1) | CN101221150B (en) |
Cited By (2)
| Publication number | Priority date | Publication date | Assignee | Title |
|---|---|---|---|---|
| GB2492210A (en) * | 2011-06-23 | 2012-12-26 | Sarclad Ltd | Apparatus and method for detecting defects in a metallic surface |
| WO2023201193A1 (en) * | 2022-04-13 | 2023-10-19 | Metso Outotec USA Inc. | Autonomous non-destructive testing system and use thereof for inspecting gear teeth in an open gear set |
Families Citing this family (22)
| Publication number | Priority date | Publication date | Assignee | Title |
|---|---|---|---|---|
| US20090016571A1 (en) * | 2007-03-30 | 2009-01-15 | Louis Tijerina | Blur display for automotive night vision systems with enhanced form perception from low-resolution camera images |
| US8079265B2 (en) * | 2007-07-27 | 2011-12-20 | Alstom Technology Ltd | Portable scanner device for metallurgical, nondestructive testing |
| EP2073002A1 (en) * | 2007-12-20 | 2009-06-24 | Montanuniversität Leoben | Object processing system |
| JP2009216559A (en) * | 2008-03-11 | 2009-09-24 | Hitachi-Ge Nuclear Energy Ltd | Eddy current inspecting device |
| KR101364404B1 (en) * | 2009-01-19 | 2014-02-17 | 제텍 인크 | Method for automated eddy current non-destructive testing analysis |
| JP5562629B2 (en) | 2009-12-22 | 2014-07-30 | 三菱重工業株式会社 | Flaw detection apparatus and flaw detection method |
| GB201200253D0 (en) * | 2012-01-09 | 2012-02-22 | Isis Innovation | Monitoring engine components |
| JP5829930B2 (en) * | 2012-01-27 | 2015-12-09 | 日立Geニュークリア・エナジー株式会社 | Eddy current flaw detection system and eddy current flaw detection method |
| US9835594B2 (en) | 2012-10-22 | 2017-12-05 | Augury Systems Ltd. | Automatic mechanical system diagnosis |
| US10018458B2 (en) * | 2016-09-12 | 2018-07-10 | The Boeing Company | Validating parts using a number of contiguous coupons produced from part excess |
| US10393702B2 (en) * | 2016-11-02 | 2019-08-27 | Weatherford Technology Holdings, Llc | Defect penetration estimate using magnetic flux image enhancement |
| CN108020594A (en) * | 2016-11-04 | 2018-05-11 | 韩虎产业株式会社 | The surface defect inspection apparatus of geared parts |
| EP3615899B1 (en) | 2017-04-26 | 2024-10-09 | Augury Systems Ltd. | Systems and methods for monitoring of mechanical and electrical machines |
| CN107117511B (en) * | 2017-05-22 | 2022-12-20 | 长沙海川自动化设备有限公司 | Gear detection device, construction hoist and detection method |
| CN108680642B (en) * | 2018-05-17 | 2022-04-05 | 天津工业大学 | A Defect Recognition and Classification Method Based on Multi-frequency Eddy Current Testing Technology |
| CN112629472B (en) * | 2019-04-12 | 2022-03-29 | 中国航发常州兰翔机械有限责任公司 | A method for measuring the inclination angle of a turbine disk tenon tooth |
| DE102019206558B4 (en) * | 2019-05-07 | 2021-07-01 | Fertigungsgerätebau A. Steinbach GmbH & Co. KG | Test device and test method for non-destructive component testing as well as manufacturing processes |
| CA3068179A1 (en) * | 2020-01-13 | 2021-07-13 | Thomas SHUMKA | Predictive modeling of wear and health of a driven gear in an open gear set |
| US11125723B2 (en) * | 2020-01-28 | 2021-09-21 | Southwest Research Institute | Eddy current testing for measuring residual stress around cold-worked holes |
| CN111308140A (en) * | 2020-02-28 | 2020-06-19 | 宁波三星医疗电气股份有限公司 | Difference type active reporting meter reading method |
| CN112488942B (en) * | 2020-12-02 | 2024-09-27 | 北京字跳网络技术有限公司 | Method, apparatus, device and computer readable medium for repairing image |
| CN120870315B (en) * | 2025-09-25 | 2026-01-30 | 中国航发湖南动力机械研究所 | Titanium-aluminum alloy defect detection device and method |
Citations (6)
| Publication number | Priority date | Publication date | Assignee | Title |
|---|---|---|---|---|
| EP0445983A2 (en) * | 1990-03-05 | 1991-09-11 | General Electric Company | Flaw detection |
| EP0533440A1 (en) * | 1991-09-16 | 1993-03-24 | General Electric Company | Method for inspecting components having complex geometric shapes |
| EP0577244A2 (en) * | 1992-04-03 | 1994-01-05 | General Electric Company | A device for inspecting a component |
| US6220099B1 (en) * | 1998-02-17 | 2001-04-24 | Ce Nuclear Power Llc | Apparatus and method for performing non-destructive inspections of large area aircraft structures |
| US20020028025A1 (en) * | 2000-07-18 | 2002-03-07 | Hong Sung Hoon | Spatio-temporal joint filter for noise reduction |
| EP1701157A1 (en) | 2005-03-09 | 2006-09-13 | General Electric Company | Eddy current inspection method and system using multifrequency excitation and multifrequency phase analysis |
Family Cites Families (14)
| Publication number | Priority date | Publication date | Assignee | Title |
|---|---|---|---|---|
| US3337796A (en) | 1965-04-19 | 1967-08-22 | Automation Forster Inc | Eddy current testing device with means for sampling the output signal to provide a signal proportional to the instantaneous value of said output signal at a particular phase |
| US3576489A (en) | 1969-03-13 | 1971-04-27 | J K Law Engineers Inc | Phase detection and comparison apparatus for determining the phase derivative with respect to frequency of an eddy current test signal |
| US4476434A (en) * | 1982-01-25 | 1984-10-09 | The United States Of America As Represented By The United States Department Of Energy | Non-destructive testing method and apparatus utilizing phase multiplication holography |
| JP2741996B2 (en) * | 1992-10-30 | 1998-04-22 | 大日本スクリーン製造株式会社 | How to create a normalized curve |
| US5770943A (en) * | 1996-12-30 | 1998-06-23 | General Electric Company | Method for measuring and compensating for spatially and temporally varying magnetic fields induced by eddy currents |
| US6907358B2 (en) | 2003-01-30 | 2005-06-14 | General Electric Company | Eddy current inspection method |
| US6914215B2 (en) | 2003-06-27 | 2005-07-05 | General Electric Company | Real time laser shock peening quality assurance by natural frequency analysis |
| US7436992B2 (en) | 2004-07-30 | 2008-10-14 | General Electric Company | Methods and apparatus for testing a component |
| US7154265B2 (en) | 2004-12-21 | 2006-12-26 | General Electric Company | Eddy current probe and inspection method |
| US7518359B2 (en) | 2005-03-09 | 2009-04-14 | General Electric Company | Inspection of non-planar parts using multifrequency eddy current with phase analysis |
| US7337651B2 (en) | 2005-04-05 | 2008-03-04 | General Electric Company | Method for performing model based scanplan generation of a component under inspection |
| US7233867B2 (en) | 2005-04-06 | 2007-06-19 | General Electric Company | Eddy current inspection method and system |
| US7689030B2 (en) * | 2005-12-21 | 2010-03-30 | General Electric Company | Methods and apparatus for testing a component |
| US7657389B2 (en) | 2006-04-12 | 2010-02-02 | General Electric Company | Method of aligning probe for eddy current inspection |
-
2006
- 2006-12-29 US US11/617,859 patent/US7817845B2/en not_active Expired - Fee Related
-
2007
- 2007-12-14 EP EP07123232A patent/EP1939616A1/en not_active Withdrawn
- 2007-12-28 CN CN2007101801007A patent/CN101221150B/en not_active Expired - Fee Related
- 2007-12-28 JP JP2007338449A patent/JP2008164613A/en not_active Ceased
Patent Citations (7)
| Publication number | Priority date | Publication date | Assignee | Title |
|---|---|---|---|---|
| EP0445983A2 (en) * | 1990-03-05 | 1991-09-11 | General Electric Company | Flaw detection |
| EP0533440A1 (en) * | 1991-09-16 | 1993-03-24 | General Electric Company | Method for inspecting components having complex geometric shapes |
| US5345514A (en) | 1991-09-16 | 1994-09-06 | General Electric Company | Method for inspecting components having complex geometric shapes |
| EP0577244A2 (en) * | 1992-04-03 | 1994-01-05 | General Electric Company | A device for inspecting a component |
| US6220099B1 (en) * | 1998-02-17 | 2001-04-24 | Ce Nuclear Power Llc | Apparatus and method for performing non-destructive inspections of large area aircraft structures |
| US20020028025A1 (en) * | 2000-07-18 | 2002-03-07 | Hong Sung Hoon | Spatio-temporal joint filter for noise reduction |
| EP1701157A1 (en) | 2005-03-09 | 2006-09-13 | General Electric Company | Eddy current inspection method and system using multifrequency excitation and multifrequency phase analysis |
Non-Patent Citations (1)
| Title |
|---|
| A DOCEKAL, ET AL: "System for 3D visualization of flaws for eddy current inspection", ACTA POLYTECHNICA, vol. 46, no. 2/2006, 1 April 2006 (2006-04-01), pages 36 - 40 * |
Cited By (6)
| Publication number | Priority date | Publication date | Assignee | Title |
|---|---|---|---|---|
| GB2492210A (en) * | 2011-06-23 | 2012-12-26 | Sarclad Ltd | Apparatus and method for detecting defects in a metallic surface |
| WO2012175909A1 (en) * | 2011-06-23 | 2012-12-27 | Sarclad Limited | Eddy current apparatus and method for detecting defects in a metallic surface |
| CN103782164A (en) * | 2011-06-23 | 2014-05-07 | 沙克拉德有限责任公司 | Apparatus and method for detecting defects in metallic surface |
| GB2492210B (en) * | 2011-06-23 | 2017-11-22 | Sarclad Ltd | Apparatus and method for detecting defects in a metallic surface |
| US10073059B2 (en) | 2011-06-23 | 2018-09-11 | Sarclad Limited | Apparatus and method for detecting defects in a metallic surface by moving an eddy coil along a scan path relative to the surface |
| WO2023201193A1 (en) * | 2022-04-13 | 2023-10-19 | Metso Outotec USA Inc. | Autonomous non-destructive testing system and use thereof for inspecting gear teeth in an open gear set |
Also Published As
| Publication number | Publication date |
|---|---|
| JP2008164613A (en) | 2008-07-17 |
| CN101221150A (en) | 2008-07-16 |
| US20080159619A1 (en) | 2008-07-03 |
| CN101221150B (en) | 2012-11-28 |
| US7817845B2 (en) | 2010-10-19 |
Similar Documents
| Publication | Publication Date | Title |
|---|---|---|
| EP1939616A1 (en) | Multi-frequency image processing for inspecting parts having complex geometric shapes | |
| US5345514A (en) | Method for inspecting components having complex geometric shapes | |
| US7233867B2 (en) | Eddy current inspection method and system | |
| Abdel-Qader et al. | Analysis of edge-detection techniques for crack identification in bridges | |
| US5371462A (en) | Eddy current inspection method employing a probe array with test and reference data acquisition and signal processing | |
| US11010890B2 (en) | Method for the non-destructive testing of the volume of a test object and testing device configured for carrying out such a method | |
| JP5155566B2 (en) | Inspection of non-planar parts using multifrequency eddy currents by phase analysis | |
| EP3957984B1 (en) | Method for defect indication detection | |
| EP1701157A1 (en) | Eddy current inspection method and system using multifrequency excitation and multifrequency phase analysis | |
| Ren et al. | Shaking noise elimination for detecting local flaw in steel wire ropes based on magnetic flux leakage detection | |
| CN102621219A (en) | A non-destructive test method for automatic fastener inspection | |
| Zheng et al. | Design of an advanced automatic inspection system for aircraft parts based on fluorescent penetrant inspection analysis | |
| CN116912525A (en) | Method and apparatus for identifying anomalies in two-dimensional digital images of products | |
| Xiang et al. | Automated analysis of rotating probe multi-frequency eddy current data from steam generator tubes | |
| CN120974135A (en) | Interference signal identification method for weld defects under different lift-off conditions | |
| CN119672017A (en) | A weld defect detection system and method based on target recognition | |
| Cherry et al. | Eddy current analysis of cracks grown from surface defects and non-metallic particles | |
| CN114820559B (en) | A method for ultrasonic image defect detection based on image entropy and recursive analysis | |
| Rajab et al. | Application of frequency domain processing to X-ray radiographic images of welding defects | |
| EP4722707A1 (en) | Automated method and system for ultrasonically inspecting components | |
| EP4722708A1 (en) | Automated method and system for ultrasonically inspecting components | |
| JP3297945B2 (en) | Steel sheet surface defect detection method | |
| CN117907430A (en) | Nondestructive inspection detection method and system applied to metal welding | |
| Transform | Enhancement of Signal Noise Ratio of Eddy-Current Signals by | |
| Bakhtiari et al. | Computer-aided analysis of eddy current rotating probe data. |
Legal Events
| Date | Code | Title | Description |
|---|---|---|---|
| PUAI | Public reference made under article 153(3) epc to a published international application that has entered the european phase |
Free format text: ORIGINAL CODE: 0009012 |
|
| AK | Designated contracting states |
Kind code of ref document: A1 Designated state(s): AT BE BG CH CY CZ DE DK EE ES FI FR GB GR HU IE IS IT LI LT LU LV MC MT NL PL PT RO SE SI SK TR |
|
| AX | Request for extension of the european patent |
Extension state: AL BA HR MK RS |
|
| 17P | Request for examination filed |
Effective date: 20090105 |
|
| AKX | Designation fees paid |
Designated state(s): BE DE GB |
|
| 17Q | First examination report despatched |
Effective date: 20090213 |
|
| STAA | Information on the status of an ep patent application or granted ep patent |
Free format text: STATUS: THE APPLICATION IS DEEMED TO BE WITHDRAWN |
|
| 18D | Application deemed to be withdrawn |
Effective date: 20140701 |