EP1939607A1 - Optical signal analyzing apparatus and optical signal analyzing method - Google Patents
Optical signal analyzing apparatus and optical signal analyzing method Download PDFInfo
- Publication number
- EP1939607A1 EP1939607A1 EP06810624A EP06810624A EP1939607A1 EP 1939607 A1 EP1939607 A1 EP 1939607A1 EP 06810624 A EP06810624 A EP 06810624A EP 06810624 A EP06810624 A EP 06810624A EP 1939607 A1 EP1939607 A1 EP 1939607A1
- Authority
- EP
- European Patent Office
- Prior art keywords
- data
- optical signal
- measurement points
- light
- signal analysis
- Prior art date
- Legal status (The legal status is an assumption and is not a legal conclusion. Google has not performed a legal analysis and makes no representation as to the accuracy of the status listed.)
- Withdrawn
Links
- 230000003287 optical effect Effects 0.000 title claims abstract description 50
- 238000000034 method Methods 0.000 title description 18
- 238000005259 measurement Methods 0.000 claims abstract description 319
- 238000004458 analytical method Methods 0.000 claims abstract description 77
- 238000005314 correlation function Methods 0.000 claims abstract description 27
- 230000005284 excitation Effects 0.000 claims abstract description 23
- 238000001514 detection method Methods 0.000 claims description 9
- 230000004001 molecular interaction Effects 0.000 claims description 6
- 230000029918 bioluminescence Effects 0.000 claims description 3
- 238000005415 bioluminescence Methods 0.000 claims description 3
- 230000002265 prevention Effects 0.000 claims 4
- 238000007405 data analysis Methods 0.000 abstract description 27
- 238000004364 calculation method Methods 0.000 description 65
- 238000005311 autocorrelation function Methods 0.000 description 10
- 230000014509 gene expression Effects 0.000 description 7
- 238000003384 imaging method Methods 0.000 description 7
- 238000003491 array Methods 0.000 description 6
- 239000013598 vector Substances 0.000 description 5
- 238000009792 diffusion process Methods 0.000 description 4
- 238000005375 photometry Methods 0.000 description 4
- 238000004422 calculation algorithm Methods 0.000 description 3
- 210000004027 cell Anatomy 0.000 description 2
- 239000000284 extract Substances 0.000 description 2
- 230000008054 signal transmission Effects 0.000 description 2
- 230000008614 cellular interaction Effects 0.000 description 1
- 238000006243 chemical reaction Methods 0.000 description 1
- 238000013075 data extraction Methods 0.000 description 1
- 238000002296 dynamic light scattering Methods 0.000 description 1
- 210000000633 nuclear envelope Anatomy 0.000 description 1
- 230000036647 reaction Effects 0.000 description 1
Images






Classifications
-
- G—PHYSICS
- G01—MEASURING; TESTING
- G01N—INVESTIGATING OR ANALYSING MATERIALS BY DETERMINING THEIR CHEMICAL OR PHYSICAL PROPERTIES
- G01N21/00—Investigating or analysing materials by the use of optical means, i.e. using sub-millimetre waves, infrared, visible or ultraviolet light
- G01N21/62—Systems in which the material investigated is excited whereby it emits light or causes a change in wavelength of the incident light
- G01N21/63—Systems in which the material investigated is excited whereby it emits light or causes a change in wavelength of the incident light optically excited
- G01N21/64—Fluorescence; Phosphorescence
-
- G—PHYSICS
- G01—MEASURING; TESTING
- G01N—INVESTIGATING OR ANALYSING MATERIALS BY DETERMINING THEIR CHEMICAL OR PHYSICAL PROPERTIES
- G01N21/00—Investigating or analysing materials by the use of optical means, i.e. using sub-millimetre waves, infrared, visible or ultraviolet light
- G01N21/75—Systems in which material is subjected to a chemical reaction, the progress or the result of the reaction being investigated
- G01N21/76—Chemiluminescence; Bioluminescence
Definitions
- the present invention relates to an optical signal analysis apparatus and an optical signal analysis method.
- an auto-correlation function or a cross-correlation function is estimated by using either the continuous measurement data (continuous measurement signal) of the intensity of fluorescence obtained from only one measurement point in one measurement or the plural-point time-series mixed data (multiple-point time-series mixed signal) measured while measurement points are repeatedly switched with time.
- a calculation technique based on a multiple ⁇ scheme or a table retrieval scheme is available. When there is only one measurement point, an algorithm called a general scheme or a single measurement point multiple ⁇ scheme is used.
- the calculation technique based on the single measurement point multiple ⁇ scheme estimates an auto-correlation function or a cross-correlation function at a measurement point through data processing such as channel calculation or data reconstruction.
- data processing such as channel calculation or data reconstruction.
- an algorithm called a general scheme or a table retrieval scheme is used. That is, the table retrieval scheme simultaneously estimates auto-correlation functions or cross-correlation functions for measurement points through high-speed data processing based on the time division of data at the respective measurement points and pieces of position information at the measurement points that are formed into a table.
- the purpose of estimating an auto-correlation function and a cross-correlation function at one measurement point is to observe molecular diffusion with a relatively low diffusion rate in a microscopic area.
- the molecular diffusion rate is low, and the diffusion time is long. It is impossible to observe the transmission of a signal, the influence of molecular movement in a given direction, and the like by auto-correlation and cross-correlation based on observation at only one point.
- an observation area is limited to one measurement point (confocal volume).
- the movement of a molecule between two or more points cannot be observed.
- slow molecular diffusion cannot be observed.
- the present invention has been proposed in consideration of such a situation, and has as its object to provide an optical signal analysis apparatus and an optical signal analysis method that allow observation of the movement of a molecule between two points.
- An optical signal analysis apparatus includes photodetection means for detecting light emitted from measurement points in a sample, and analysis means for analyzing a molecular interaction between two of the measurement points by using fluctuation signals corresponding to fluctuations of light from the measurement points that are detected by the photodetection means.
- An optical signal analysis method includes a photodetection step of detecting light emitted from measurement points in a sample, and an analysis step of analyzing a molecular interaction between two of the measurement points by using fluctuation signals corresponding to fluctuations of light from the measurement points.
- FIG. 1 schematically shows an optical signal analysis apparatus according to the first embodiment of the present invention.
- An optical signal analysis apparatus 100 includes light applying units L1, L2,..., Ln, photodetection units D1, D2,..., Dn, and a data analysis unit 32.
- Each of the light applying units L1, L2,..., Ln includes a light source 12, a collimating lens 14, a condenser lens 16, and the like.
- the light applying units L1, L2,..., Ln continuously apply excitation light to different measurement points P1, P2,..., Pn in a sample S.
- Each of the photodetection units D1, D2,..., Dn includes a condenser lens 22, a pinhole 24, an imaging lens 26, a photodetector 28, and the like.
- the photodetection units D1, D2,..., Dn respectively receive light emitted from the measurement points P1, P2,..., Pn. More specifically, the pinholes 24 are placed at positions conjugate to the measurement points P1, P2,..., Pn.
- the imaging lenses 26 respectively project the images of the pinholes 24 onto the photodetectors 28. Thus, only the light emitted from the measurement points P1, P2,..., Pn selectively strike the photodetectors 28.
- the photodetectors 28 respectively output continuous measurement data reflecting the intensities of incident light, i.e., fluctuation signals corresponding to the fluctuations of the light from the measurement points P1, P2,..., Pn.
- the photodetection units D1, D2,..., Dn constitute photodetection means for detecting light emitted from the measurement points P1, P2,..., Pn.
- the light applying units L1, L2,..., Ln constitute excitation light application means for continuously applying excitation light to the measurement points P1, P2,..., Pn, respectively.
- the data analysis unit 32 which is constituted by, for example, a personal computer, estimates auto-correlation functions and cross-correlation functions for fluctuation signals output from the photodetectors 28. That is, the data analysis unit 32 estimates an auto-correlation function at each of the measurement points P1, P2,..., Pn, and also estimates a cross-correlation function between two of the measurement points P1, P2,..., Pn.
- the data analysis unit 32 constitutes analysis means for analyzing a molecular interaction such as the movement vector of a molecule between two of the measurement points P1, P2,..., Pn by using fluctuation signals corresponding to the fluctuations of light from the measurement points P1, P2,..., Pn that are detected by the photodetection units D1, D2,..., Dn.
- the data analysis unit 32 also displays and stores the analysis results.
- continuous data (continuous signals) at the measurement points P1, P2,..., Pn continuous data (continuous signals) at two independent measurement points are used for inter-point correlation computation.
- continuous data signals
- a correlation relationship in the vector direction between the two points is directly observed from changes in molecular movement.
- FIG. 2 shows a fluctuation signal corresponding to the fluctuations of light from a measurement point.
- FIG. 3 shows a fluctuation signal corresponding to the fluctuations of light from a measurement point.
- digital data at the two measurement points P1 and P2 i.e., fluctuation signals of light at the two measurement points P1 and P2 are acquired.
- the acquired digital data at the two measurement points P1 and P2 are directly used for calculation, the data can be displayed as the continuous signals shown in FIGS. 2 and 3 by an interpolation method.
- step S2 Whether there is any acquired data is determined. If YES, the process advances to step S2. If NO, the process enters the imaging determination in step S14.
- the number of data read is counted.
- the total number of data counted is used for channel calculation, comprehensive calculation, and the like.
- plotted ⁇ values (channel values) and the number of channels in the multiple ⁇ scheme are calculated.
- the multiple ⁇ scheme determines the number of channels from the total number of data read.
- FIG. 5 shows a specific calculation method.
- the first 16 channel values are based on a bin time ⁇ 0 as a reference value, and every subsequent eighth channel value is based on the value obtained by doubling the bin time To as a reference value.
- FIG. 5 shows general channel values based on the bin time To as a reference value.
- FIG. 6 shows channel values when the bin time ⁇ 0 is 2 ⁇ s.
- the first 16 channels are set in the zeroth stage, and subsequent sets of eight channels each are set in the first stage, second stage,....
- An increment (reference value) in channel value in each stage is represented by 2 n ⁇ 0 where n is the number of stages.
- an increment in channel value in the zeroth stage is To
- an increment in channel value in the second stage is 4 ⁇ 0 .
- the number of channels for correlation value calculation is calculated on the basis of bin times and the total number of data read. For example, when data is measured for 32 sec with a bin time of 2 ⁇ s, the total number of channels for calculation is approximately 176.
- step S4 data reconstruction at the measurement point P1 is performed.
- step S5 data reconstruction at the measurement point P2 is performed. That is, the first channel data of the respective channels with different reference values (increments) is calculated. Summation processing for measurement data I P1 and I P2 at the measurement point P1 and the measurement point P2 is performed. With regard to a delay time ⁇ after channel 16, since the reference (increment) is doubled for every eighth channel (see step S3), the data of each channel comprises the sum of two data before the reference value (increment) is doubled. Changes in data in detail are shown in FIG. 7 .
- Performing summation processing at each of the two measurement points P1 and P2 will sequentially generate channel data having new reference values (increments) from acquired data, thereby generating a new data form.
- the data of a channel other than the first channel is formed by moving the data of the first channel.
- the array of all the read data is set as the data array of the zeroth row, and the array of the sums of pairs of adjacent data is set as the data array of the first row.
- the same operation is repeated to generate the data arrays of the second row, third row,.... This operation is repeated until data arrays equal in number to channel stages are obtained.
- the data of each row correspond to the channels in a corresponding stage.
- the second-row zeroth-column data corresponds to the second-stage zeroth-column channel.
- the sum total of data is calculated. That is, the sum totals of data with variables at the respective channel value positions in the multiple ⁇ scheme is calculated with respect to the measurement data I P1 and I P2 at the measurement point P1 and the measurement P2.
- Sum-of-product calculation between data at the same measurement point is performed. That is, for the measurement data I P1 and I P2 at the measurement point P1 and the measurement point P2, in the case of the measurement point P1, data at channel positions with the same reference value (increment) is multiplied by the zeroth-column data, and the sum of the products is calculated. In other words, in the data array at the measurement point P1 that corresponds to the channels of each stage shown in FIG. 5 , the sum of the products between the first data and the respective remaining data is obtained. Similar calculation processing is performed for the measurement point P2.
- Sum-of-product calculation of data between different measurement points is performed. That is, sum-of-product calculation between the zeroth-column data at the measurement point P1 and the data at the measurement point P2 is performed. As shown in FIG. 9 , the data at channel positions with the same reference value (increment) as that at the measurement point P2 is multiplied by the zeroth-column data at the measurement point P1, and the sum of products is calculated. In other words, for the data array at the measurement point P1 and the data array at the measurement point P2 that correspond to the channels of the respective stages, the sum of the products between the first data of the data array at the measurement point P1 and the respective data of the data array at the measurement point P2 is obtained.
- the number of times of data sum-of-product calculation between different measurement points is counted. That is, count of the number of times of data sum-of-product calculation is performed at the same time as calculation in step S12.
- step S14 If the data read is complete (YES in step S14), auto-correlation functions for each of the two measurement points P1 and P2 and an inter-point cross-correlation function between the two measurement points P1 and P2 are estimated on the basis of the above respective calculation results. That is, correlation functions are estimated by using different analytical expressions for the respective correlation directions of P1 ⁇ P2, P1 ⁇ P1, and P2 ⁇ P2.
- the formula (S8 * S10) /(S60 * S6) is used for P1 ⁇ P1
- the formula (S9 * S11)/(S60 * S7) is used for P2 ⁇ P2
- the formula (S12 * S13) /(S60 * S6) is used for P1 ⁇ P2.
- S60 and S70 represent data sum totals at channel positions with the respective reference values (increments).
- mlF P 0Sum( ⁇ ⁇ ) represents the sum total of zeroth-column data of the respective stages
- mlF P Sum( ⁇ ⁇ ) represents the sum total of channel data in each multiple ⁇ scheme
- mlF P R P Sum( ⁇ ⁇ ) represents sum-of-product calculation between zeroth-column data and the respective channel data
- mlN PP Sum( ⁇ ⁇ ) represents the total number of times of sum-of-product calculation.
- the subscript P is P1 or P2, and corresponds to calculation target data, i.e., data at the measurement point P1 or data at the measurement point P2.
- Processing such as displaying an inter-point cross-correlation function in the form of a curve is performed on the basis of each final calculation result.
- the photometric analysis apparatus of this embodiment estimates cross-correlation functions for the two different measurement points P1 and P2. If the correlation of the analysis result on P1 ⁇ P2 is high, it can be estimated that the probability of movement of the same molecule from the measurement point P1 to the measurement point P2 is high. In contrast, if the correlation is low, it can be estimated that the probability of passage of a molecule through the measurement point P2 after passage through the measurement point P1 is low, and the probability of movement of the molecule in another direction is high. That is, the photometric analysis apparatus of the embodiment allows observation of the movement of a molecule between the two measurement points P1 and P2. In addition, by examining the correlativity between sets of two measurement points, molecular movement vectors are estimated.
- FIG. 10 schematically shows an optical signal analysis apparatus according to the second embodiment of the present invention.
- An optical signal analysis apparatus 200 includes a single light applying unit L, a single photodetection unit D, and a data analysis unit 32.
- the light applying unit L includes a light source 12, a collimating lens 14, a condenser lens 16, a scanner 18, and the like.
- the light applying unit L which is excitation light application means for time-divisionally applying excitation light to measurement points P1, P2,..., Pn, intermittently scans a light beam by the scanner 18, and applies excitation light to the different measurement points P1, P2,..., Pn in a sample S.
- the photodetection unit D includes a condenser lens 22, a pinhole 24, an imaging lens 26, a photodetector 28, and the like.
- the photodetection unit D which is photodetection means for time-divisionally detecting light emitted from the measurement points P1, P2,..., Pn in the sample, time-serially receives light emitted from the measurement points P1, P2,..., Pn.
- the arrangement of the photodetection unit D is the same as that of one of the photodetection units D1, D2,..., Dn in the first embodiment.
- the data analysis unit 32 comprises, for example, a personal computer.
- the data analysis unit 32 estimates an auto-correlation function at each of the measurement points P1, P2,..., Pn and a cross-correlation function between two of the measurement points P1, P2,..., Pn on the basis of the fluctuation signals output from the photodetector 28. That is, the data analysis unit 32 constitutes analysis means for analyzing a molecular interaction such as the movement vector of a molecule between two of the measurement points P1, P2,..., Pn by using fluctuation signals corresponding to the fluctuations of light from the measurement points P1, P2,..., Pn that are time-divisionally detected by the photodetection unit D.
- the light applying unit L alternately applies excitation light to the two measurement points P1 and P2 at short time intervals.
- data from the photodetection unit D becomes time-series mixed data in which data at the two measurement points P1 and P2 are alternately mixed.
- Reference symbols P1 and P2 in FIG. 11 respectively denote data measurement ranges for the measurement points P1 and P2. That is, this data alternately contains the data at the measurement point P1 and the measurement point P2, and can be divided by time.
- the time-series mixed data actually includes measurement ranges in switching periods between the measurement points P1 and P2 in addition to the data measurement ranges for the measurement points P1 and P2, FIG. 11 does not illustrate them.
- This time-series mixed data is sent to the data analysis unit 32 to be divided into data at each measurement point and processed. That is, the data analysis unit 32 extracts the time-division data at the measurement point P1 shown in FIG. 12 and the time-division data at the measurement point P2 shown in FIG. 13 from the time-series mixed data shown in FIG. 11 .
- the data at the measurement point P1 are obtained by extracting only fluorescence intensity in each period during which the scanner 18 stops an excitation light beam at the measurement point P1, and data in other periods are set as 0.
- the data at the measurement point P2 are obtained by extracting only fluorescence intensity in each period during which the scanner 18 stops an excitation light beam at the measurement point P2, and data in other periods are set as 0.
- the data analysis unit 32 generates two pseudo signals or pseudo data corresponding to light from the measurement point P1 and the measurement point P2 on the basis of the fluctuation signals output from the photodetector 28.
- each signal omission period that occurs due to time-divisional detection is interpolated by a signal with a predetermined value.
- the data analysis unit 32 performs inter-point correlation computation for the extracted data at the two different measurement points by using the conventional general-purpose scheme, the information table scheme, or the multiple ⁇ scheme.
- the data analysis unit when performing data analysis on inter-point cross-correlation functions in the multiple ⁇ scheme using weighting coefficients, the data analysis unit repeatedly performs measurement at two measurement points.
- the data analysis unit extracts only data and weighting coefficients corresponding to each measurement point by time-serially dividing the measurement data obtained by measurement into a data table and a weighting coefficient table at each measurement point, thereby calculating an auto-correlation function.
- the data analysis unit calculates auto-correlation functions and inter-point cross-correlation functions by using the extracted data at the respective measurement points, the data at the two measurement points in the weighting coefficients, and the weighting coefficients. Based on the calculation result, an operator simultaneously observes not only cell reactions at two points but also a cell interaction between different regions (two points).
- octave channels are used as channels for the calculation of data and weighting coefficients, and the calculation of data and weighting coefficients is limited to the result obtained by a small finite number of channels, thereby implementing the plotting of calculation results at equal intervals.
- the data analysis unit calculates the average of data and the average of weighting coefficients that correspond to different delay times in different ⁇ areas in advance. Assume that in each process using the extracted data and weighting coefficients at measurement points, one data or weighting coefficient is set as a minimum calculation unit.
- the time-series measurement data at the two measurement points P1 and P2 are acquired.
- a continuous signal obtained by an interpolation method for the acquired time-series mixed data is shown FIG. 11 .
- step S2 the process advances to step S2. If NO, the process enters the imaging determination in step S18.
- the number of data read is counted.
- the total number of data counted is used for channel calculation, comprehensive calculation, and the like.
- plotted ⁇ values (channel values) and the number of channels in the multiple ⁇ scheme are calculated.
- the multiple ⁇ scheme determines the number of channels from the total number of data read.
- the first 16 channel values are based on a bin time ⁇ 0 as a reference value, and every subsequent eighth channel value is based on the value obtained by doubling the bin time ⁇ 0 as a reference value.
- the first 16 channels are set in the zeroth stage, and subsequent sets of eight channels each are set in the first stage, second stage,....
- An increment (reference value) in channel value in each stage is represented by 2 n ⁇ 0 where n is the number of stages.
- an increment in channel value in the zeroth stage is ⁇ 0
- an increment in channel value in the second stage is 4 ⁇ 0 .
- the number of channels for calculation is determined by bin time values and the total number of data read.
- Measurement points are identified. That is, the number of measurement points at which measurement has been simultaneously performed and the corresponding measurement point numbers are determined. If it is determined in step S4 that the measurement point is the measurement point P1, the input data is processed as the effective data at the measurement point P1 in step S6 and the subsequent steps, and data at the measurement point P2 is processed as zero in step S5. If it is determined in step S4 that the measurement point is the measurement point P2, the input data is processed as the effective data at the measurement point P2 in step S6 and the subsequent steps, and data at the measurement point P1 is processed as zero in step S5. If the measurement point is neither the measurement point P1 nor the measurement point P2, the data at the measurement point P1 is interpolated as zero in step S5 as in the above case.
- Data extraction is performed. That is, the data analysis unit divides data at each measurement point.
- time-series mixed data in which data at the measurement points are mixed is obtained.
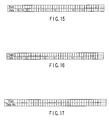
- the time-series mixed data is divided into data at each measurement point. If, for example, data measurement is performed at the measurement points P1 and P2 in the order of P1 ⁇ P2 ⁇ P1 as in the case shown in FIG. 11 , two measurement data at the measurement points P1 and P2 are time-serially arrayed in the measured data. This data is expressed by a specific data table like that shown in FIG. 15 , and a data division method for each measurement point will be described.
- the measurement point P1 First of all, at the measurement point P1, only the data at the measurement point P1 is extracted from the mixed data. Data 0 is then embedded at a position corresponding to the other measurement point (the measurement point P2). As a result, the division data table for the measurement point P1 shown in FIG. 16 is generated. Likewise, the data analysis unit generates a different data table for the measurement point P2. That is, two pseudo data corresponding to the respective light are generated from the two measurement points P1 and P2 on the basis of the fluctuation signals output from the photodetector 28. In this pseudo data, each signal omission period that occurs due to time-divisional detection is interpolated by data with a predetermined value. As a result, two division data tables are generated at the two measurement points P1 and P2.
- weighting coefficient table for this purpose is generated. That is, weighting coefficient division is performed for each measurement point.
- the measurement data contains information representing the size of data and information representing the measurement point position of data. Such information is also divided at each measurement point.
- the multiple ⁇ scheme based on measurement at plural measurement points uses such information as weighting coefficients for calculation.
- weighting coefficients corresponding to the measurement point P1 are extracted as in the case of data signal division.
- a weighting coefficient of 0 is embedded at each position corresponding to the other measurement point.
- the division weighting coefficient table for the measurement point P1 shown in FIG. 17 is generated.
- a different division weighting coefficient table for the measurement point P2 is generated. That is, two division weighting coefficient tables at the two measurement points P1 and P2 are generated.
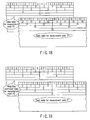
- Data reconstruction is performed. That is, the first channel data of the respective channels with different reference values (increments) is calculated. Summation processing at each measurement point is performed by using the data tables for the measurement point P1 and the measurement point P2. With regard to a delay time ⁇ after channel 16, since the reference (increment) is doubled for every eighth channel (see steps S4 and S5 in the first embodiment), the data of each channel comprises the sum of two data before the reference value (increment) is doubled. Changes in data in detail are shown in FIG. 18 . Performing summation processing at the two measurement points P1 and P2 will sequentially generate channel data having new reference values (increments) from data division tables, thereby generating a new data form.
- the array of all the read data is set as the data array of zeroth row, and the array of the sums of pairs of adjacent data is set as the data array of the first row.
- the same operation is repeated to generate the data arrays of the second row, third row,.... This operation is repeated until data arrays equal in number to channel stages are obtained.
- the data of each row correspond to the channels in a corresponding stage.
- the second-row zeroth-column data corresponds to the second-stage zeroth-column channel.
- Weighting coefficient reconstruction is performed. That is, the first channel weighting coefficients of respective channels with different reference values (increments) is calculated. Summation processing is performed for each measurement point by using the division weighting coefficient tables for the measurement point P1 and the measurement point P2. The weighting coefficient tables change in the same manner as in step S8. That is, in the process of summation processing, weighting coefficients for channels with new reference values (increments) are sequentially formed ( FIG. 19 ), thereby generating a new weighting coefficient form.
- the array of all weighting coefficients is set as the weighting coefficient array of the zeroth row, and the array of the sums of pairs of adjacent weighting coefficients is set as the weighting coefficient array of the first row. Subsequently, this operation is repeated to generate the weighting coefficient arrays of the second row, third row,.... This operation is repeated until weighting coefficient arrays equal in number to channel stages are obtained. In each weighting coefficient table obtained in this manner, the weighting coefficients of each row correspond to the channels in a corresponding stage.
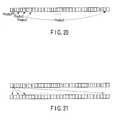
- Sum-of-product calculation between data is performed for extracted data I P1 at the measurement point P1. That is, as shown in FIG. 20 , data at channel positions of the measurement point P1 at which the same reference value (increment) is set is multiplied by the zeroth-column data, and the sum of the products is calculated. In other words, in the data array at the measurement point P1 that corresponds to the channels of each stage, the sum of the products between the first data and the respective remaining data is obtained. Sum-of-product calculation between data is then performed for extracted data I P2 at the measurement point P2.
- the same processing is performed at the measurement point P2, so that data at channel positions of the measurement point P2 at which the same reference value (increment) is set is multiplied by the zeroth-column data, and the sum of the products is calculated.
- the sum of the products between the first data and the respective remaining data is obtained.
- Sum-of-product calculation between weighting coefficients is performed for extracted weighting coefficients W P1 at the measurement point P1. That is, weighting coefficients at channel positions of the measurement point P1 at which the same reference value (increment) is set are multiplied by the zeroth-column weighting coefficient, and the sum of the products is calculated. In other words, in the weighting coefficient array at the measurement point P1 that corresponds to the channels of each stage, the sum of the products between the first weighting coefficient and the respective remaining weighting coefficients is obtained. Sum-of-product calculation between weighting coefficients is then performed for extracted weighting coefficients W P2 at the measurement point P2.
- the same processing is performed at the measurement point P2, so that weighting coefficients at channel positions of the measurement point P2 at which the same reference value (increment) is set are multiplied by the zeroth-column weighting coefficient, and the sum of the products are calculated.
- the weighting coefficient array at the measurement point P2 that corresponds to the channels of each stage the sum of the products between the first weighting coefficient and the respective remaining weighting coefficients is obtained.
- Sum-of-product calculation between the zeroth-column data and weighting coefficients is performed for the extracted data I P1 and weighting coefficients W P1 at the measurement point P1. That is, weighting coefficients at channel positions of the measurement point P1 at which the same reference value (increment) is set are multiplied by the zeroth-column data, and the sum of the products is calculated. In other words, in the data array and the weighting coefficients array at the measurement point P1 that corresponds to the channels of each stage, the sum of the products between the first data and the respective weighting coefficients is obtained. Sum-of-product calculation between the zeroth-column data and weighting coefficients is performed for the extracted data I P2 and weighting coefficients W P2 at the measurement point P2.
- the same processing is performed at the measurement point P2, so that weighting coefficients at channel positions of the measurement point P2 at which the same reference value (increment) is set are multiplied by the zeroth-column data, and the sum of the products is calculated.
- the sum of the products between the first data and the respective weighting coefficients is obtained.
- Sum-of-product calculation between the zeroth-column weighting coefficient and data is performed for the extracted weighting coefficients W P1 and data I P1 at the measurement point P1. That is, data at channel positions of the measurement point P1 at which the same reference value (increment) is set is multiplied by the zeroth-column weighting coefficient, and the sum of the products is calculated. In other words, in the data array and the weighting coefficient array at the measurement point P1 that corresponds to the channels of each stage, the sum of the products between the first weighting coefficient and the respective data is obtained. Sum-of-product calculation between a weighting coefficient and data is then performed for the extracted weighting coefficient W P2 and data I P2 at the measurement point P2.
- the same processing is performed at the measurement point P2, so that data at channel positions of the measurement point P2 at which the same reference value (increment) is set is multiplied by the zeroth-column weighting coefficient, and the sum of the products is calculated.
- the sum of the products between the first weighting coefficient and the respective data is obtained.
- Sum-of-product calculation between the data at the two measurement point P1 and P2 is performed for the extracted data I P1 and I P2 at the measurement point P1 and the measurement point P2. That is, as shown in FIG. 21 , data at channel positions of the measurement point P2 at which the same reference value (increment) is set is multiplied by the zeroth-column data at the measurement point P1, and the sum of the products is calculated. In other words, in the data array at the measurement point P1 and the data array at the measurement point P2 that corresponds to the channels of each stage, the sum of the products between the first data of the data array at the measurement point P1 and the respective data of the data array at the measurement point P2 is obtained.
- Sum-of-product calculation between the weighting coefficients at the two measurement points P1 and P2 is performed for the extracted weighting coefficients W P1 and W P2 at the measurement point P1 and the measurement point P2. That is, weighting coefficients at channel positions of the measurement point P2 at which the same reference value (increment) is set are multiplied by the zeroth-column weighting coefficient at the measurement point P1, and the sum of the products is calculated.
- the sum of the products between the first weighting coefficient of the weighting coefficient array at the measurement point P1 and the respective weighting coefficients of the weighting coefficient array at the measurement point P2 is obtained.
- Sum-of-product calculation between the zeroth-column data at the measurement point P1 and the weighting coefficients at the measurement point P2 is performed for the extracted data I P1 at the measurement point P1 and the weighting coefficients W P2 at the measurement point P2. That is, weighting coefficients at channel positions of the measurement point P2 at which the same reference value (increment) is set are multiplied by the zeroth-column data at the measurement point P1, and the sum of the products is calculated.
- the sum of the products between the first data of the data array at the measurement point P1 and the respective weighting coefficients of the weighting coefficient array at the measurement point P2 is obtained.
- Sum-of-product calculation between the zeroth-column weighting coefficient at the measurement point P1 and data at the measurement point P2 is performed for the extracted weighting coefficients W P1 at the measurement point P1 and the extracted data I P2 at the measurement point P2. That is, data at channel positions of the measurement point P2 at which the same reference value (increment) is set is multiplied by the zeroth-column weighting coefficient at the measurement point P1, and the sum of the products is calculated.
- the sum of the products between the first data of the data array at the measurement point P2 and the respective weighting coefficients of the weighting coefficient array at the measurement point P1 is obtained.
- step S21 If the data read is complete (YES in step S21), auto-correlation functions for each of the two measurement points P1 and P2 and an inter-point cross-correlation function between the two measurement points P1 and P2 are estimated on the basis of the above respective calculation results. That is, correlation functions are estimated by using different analytical expressions for the respective correlation directions of P1 ⁇ P2, P1 ⁇ P1, and P2 ⁇ P2.
- the data analysis unit uses the formula (S10 * S11)/(S12 * S13) for P1 ⁇ P1 and P2 ⁇ P2, and the formula (S14 * S15)/(S16 * S17) for P1 ⁇ P2.
- mlF P R P Sum( ⁇ ⁇ ) represents sum-of-product calculation between data
- mlW P V P Sum( ⁇ ⁇ ) represents sum-of-product calculation between weighting coefficients
- mlF P V P Sum( ⁇ ⁇ ) represents sum-of-product calculation between the zeroth-column data and weighting coefficients
- mlW P R P Sum( ⁇ ⁇ ) represents sum-of-product calculation between the zeroth-column weighting coefficient and data.
- the subscript P is P1 or P2, and corresponds to calculation target data, i.e., data at the measurement point P1 or data at the measurement point P2.
- ⁇ 0 is based on a delay time ⁇ 0 P due to the inter-point distance and a delay time ⁇ 0 M due to the inter-point difference in measurement start time, and ⁇ is a delay time at the time of normal correlation computation.
- Equations (6) is based on cross-correlation analytical expression (7) given below.
- Cross-correlation analytical expression (7) is derived by weighting the general-purpose cross-correlation function represented by equation (8).
- Processing such as displaying an inter-point cross-correlation function in the form of a curve is performed on the basis of each final calculation result.
- the photometric analysis apparatus of this embodiment estimates cross-correlation functions for the two different measurement points P1 and P2. If the correlation of the analysis result on P1 ⁇ P2 is high, it can be estimated that the probability of movement of the same molecule from the measurement point P1 to the measurement point P2 is high. In contrast, if the correlation is low, it can be estimated that the probability of passage of a molecule through the measurement point P2 after passage through the measurement point P1 is low, and the molecular movement frequently occurs in other directions. That is, the photometric analysis apparatus of the embodiment allows observation of the movement of a molecule between the two measurement points P1 and P2. In addition, by examining the correlativity between sets of two measurement points, molecular movement vectors are estimated.
- the single light applying unit intermittently scans a light beam to apply excitation light to measurement points, and the single photodetection unit detects fluorescence generated from the measurement points. That is, a single optical system is used for the measurement points. This prevents errors due to incoincidence between measurement areas, application intensities, signal transmission systems, and the like. In addition, since data at two different measurement points originate from the same measurement signal, the measurement start time error is 0. Furthermore, since only one set of hardware is required, a high-performance, low-cost optical signal analysis apparatus can be provided.
- the optical signal analysis apparatus detects fluorescence.
- the light to be detected is not limited to fluorescence and may be other types of light, e.g., phosphorescence, reflected light, scattered light, chemiluminescence, and bioluminescence.
- the above embodiments use the correlation function analysis method. However, it suffices to use the photo counting histogram method or the coincidence analysis method instead of the above method.
- the photodetection unit D time-divisionally detects light emitted from the measurement points P1, P2,..., Pn in the sample with the single photodetector 28.
- this unit may have photodetectors that respectively receive light emitted from the measurement points P1 and P2 in the sample.
- an optical signal analysis apparatus and an optical signal analysis method that allow observation of the movement of a molecule between two points.
Landscapes
- Health & Medical Sciences (AREA)
- Nuclear Medicine, Radiotherapy & Molecular Imaging (AREA)
- Physics & Mathematics (AREA)
- Life Sciences & Earth Sciences (AREA)
- Chemical & Material Sciences (AREA)
- Analytical Chemistry (AREA)
- Biochemistry (AREA)
- General Health & Medical Sciences (AREA)
- General Physics & Mathematics (AREA)
- Immunology (AREA)
- Pathology (AREA)
- Investigating, Analyzing Materials By Fluorescence Or Luminescence (AREA)
- Investigating Or Analysing Materials By The Use Of Chemical Reactions (AREA)
- Investigating Or Analysing Materials By Optical Means (AREA)
Abstract
An optical signal analysis apparatus (100) includes light applying units (L1, L2,..., Ln), photodetection units (D1, D2,..., Dn), and a data analysis unit (32). The light applying units (L1, L2,..., Ln) respectively apply excitation light to different measurement points (P1, P2,..., Pn) in a sample (S). The photodetection units (D1, D2,..., Dn) respectively receive light emitted from the measurement points (P1, P2,..., Pn), and output fluctuation signals corresponding to the fluctuations of the light from the measurement points (P1, P2,..., Pn). The data analysis unit (32) estimates an inter-point cross-correlation function between the measurement points (P1, P2,..., Pn) on the basis of the fluctuation signals respectively output from the photodetection units (D1, D2,..., Dn).
Description
- The present invention relates to an optical signal analysis apparatus and an optical signal analysis method.
- Optical signal analysis methods are disclosed in, for example, Klaus Sch-tzel, "New Concept in Correlator Design", Inst. Phys. Conf. Ser. No. 77, P175, 1985, Klaus Sch-tzel, "Noise on Multiple-Tau Photon Correlation Data", SPIE Vol. 1430, P109, Photon Correlation Spectroscopy: Multicomponent Systems, 1991, and Klaus Sch-tzel et al., "Photon Correlation Measurements at Large Lag Times", Journal of Modern Optics, Vol. 35, No. 4, P711, 1988. In these optical signal analysis methods, an auto-correlation function or a cross-correlation function is estimated by using either the continuous measurement data (continuous measurement signal) of the intensity of fluorescence obtained from only one measurement point in one measurement or the plural-point time-series mixed data (multiple-point time-series mixed signal) measured while measurement points are repeatedly switched with time. As an analysis algorithm, a calculation technique based on a multiple τ scheme or a table retrieval scheme is available. When there is only one measurement point, an algorithm called a general scheme or a single measurement point multiple τ scheme is used. That is, the calculation technique based on the single measurement point multiple τ scheme estimates an auto-correlation function or a cross-correlation function at a measurement point through data processing such as channel calculation or data reconstruction. When measurement points are to be measured in one measurement, an algorithm called a general scheme or a table retrieval scheme is used. That is, the table retrieval scheme simultaneously estimates auto-correlation functions or cross-correlation functions for measurement points through high-speed data processing based on the time division of data at the respective measurement points and pieces of position information at the measurement points that are formed into a table.
- Yoshiaki Horikawa, "For Single Molecular Fluorescence Analysis/Analysis on Single Biomolecular Interaction Using Statistical Analysis", Bunko Kenkyu, Vol. 53, No. 3, 158 - 164, 2004 discloses a photo counting histogram method.
- Kazuhiko Mase, Mitsuru Nagasono, Shinichiro Tanaka, and Shinichi Nagaoka, "Study of ion desorption induced by core-electron excitations of molecules on surface by using electron-ion coincidence spectroscopy", Hoshasen, 10, 375 - 391, 1997 discloses a coincidence analysis method.
- However, the purpose of estimating an auto-correlation function and a cross-correlation function at one measurement point is to observe molecular diffusion with a relatively low diffusion rate in a microscopic area. In actual application, when, for example, a molecule passes through the nuclear membrane of a cell, the molecular diffusion rate is low, and the diffusion time is long. It is impossible to observe the transmission of a signal, the influence of molecular movement in a given direction, and the like by auto-correlation and cross-correlation based on observation at only one point.
- That is, according to the prior art, an observation area is limited to one measurement point (confocal volume). In addition, the movement of a molecule between two or more points cannot be observed. Furthermore, slow molecular diffusion cannot be observed.
- The present invention has been proposed in consideration of such a situation, and has as its object to provide an optical signal analysis apparatus and an optical signal analysis method that allow observation of the movement of a molecule between two points.
- An optical signal analysis apparatus according to the present invention includes photodetection means for detecting light emitted from measurement points in a sample, and analysis means for analyzing a molecular interaction between two of the measurement points by using fluctuation signals corresponding to fluctuations of light from the measurement points that are detected by the photodetection means.
- An optical signal analysis method according to the present invention includes a photodetection step of detecting light emitted from measurement points in a sample, and an analysis step of analyzing a molecular interaction between two of the measurement points by using fluctuation signals corresponding to fluctuations of light from the measurement points.
-
-
FIG. 1 is a view schematically showing an optical signal analysis apparatus according to the first embodiment of the present invention; -
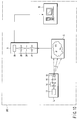
FIG. 2 is a view showing a fluctuation signal corresponding to the fluctuations of light from a measurement point P1 that is obtained in the apparatus inFIG. 1 ; -
FIG. 3 is a view showing a fluctuation signal corresponding to the fluctuations of light from a measurement point P2 that is obtained in the apparatus inFIG. 1 ; -
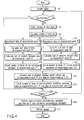
FIG. 4 is a flowchart showing analysis processing by a data analysis unit inFIG. 1 ; -
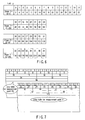
FIG. 5 is a view showing the structure and values of channels; -
FIG. 6 is a view showing the structure and values of channels with a bin time of 2 µs; -
FIG. 7 is a view showing data reconstruction at the measurement point P1 and the measurement point P2 in the continuous signals inFIGS. 2 and 3 ; -
FIG. 8 is a view showing sum-of-product calculation between data at the measurement point P1 in the continuous signals inFIGS. 2 and 3 ; -
FIG. 9 is a view showing sum-of-product calculation between data at the measurement point P1 and the measurement point P2 in the continuous signals inFIGS. 2 and 3 ; -
FIG. 10 is a view schematically showing an optical signal analysis apparatus according to the second embodiment of the present invention; -
FIG. 11 is a view showing a time-series mixed signal containing fluctuation signals corresponding to the fluctuations of light from the measurement point P1 and the measurement point P2 obtained in the apparatus inFIG. 10 ; -
FIG. 12 is a view showing a time-division signal at the measurement point P1 that is extracted from the time-series mixed signal inFIG. 11 ; -
FIG. 13 is a view showing a time-division signal at the measurement point P2 that is extracted from the time-series mixed signal inFIG. 11 ; -
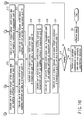
FIG. 14A is a view showing part of a flowchart for analysis processing by the data analysis unit inFIG. 10 ; -
FIG. 14B is a view showing part of the flowchart for analysis processing by the data analysis unit inFIG. 10 ; -
FIG. 15 is a view showing mixed data at the measurement point P1 and the measurement point P2 that corresponds to the time-series mixed signal inFIG. 11 ; -
FIG. 16 is a view showing division data at the measurement point P1 that corresponds to the time-division signal inFIG. 12 ; -
FIG. 17 is a view showing division weighting coefficients at the measurement point P1 that correspond to the division data inFIG. 16 ; -
FIG. 18 is a view showing data tables obtained by reconstructing division data at the measurement point P1 and the measurement point P2; -
FIG. 19 is a view showing weighting coefficient tables obtained by reconstructing division weighting coefficients at the measurement point P1 and the measurement point P2; -
FIG. 20 is a view showing sum-of-product calculation between data at the measurement point P1; and -
FIG. 21 is a view showing sum-of-product calculation between data at the measurement point P1 the measurement point P2. - The embodiments of the present invention will be described below with reference to the views of the accompanying drawing.
-
FIG. 1 schematically shows an optical signal analysis apparatus according to the first embodiment of the present invention. An opticalsignal analysis apparatus 100 includes light applying units L1, L2,..., Ln, photodetection units D1, D2,..., Dn, and adata analysis unit 32. - Each of the light applying units L1, L2,..., Ln includes a
light source 12, acollimating lens 14, acondenser lens 16, and the like. The light applying units L1, L2,..., Ln continuously apply excitation light to different measurement points P1, P2,..., Pn in a sample S. - Each of the photodetection units D1, D2,..., Dn includes a
condenser lens 22, apinhole 24, animaging lens 26, aphotodetector 28, and the like. The photodetection units D1, D2,..., Dn respectively receive light emitted from the measurement points P1, P2,..., Pn. More specifically, thepinholes 24 are placed at positions conjugate to the measurement points P1, P2,..., Pn. Theimaging lenses 26 respectively project the images of thepinholes 24 onto thephotodetectors 28. Thus, only the light emitted from the measurement points P1, P2,..., Pn selectively strike thephotodetectors 28. Thephotodetectors 28 respectively output continuous measurement data reflecting the intensities of incident light, i.e., fluctuation signals corresponding to the fluctuations of the light from the measurement points P1, P2,..., Pn. - As is obvious from the above description, the photodetection units D1, D2,..., Dn constitute photodetection means for detecting light emitted from the measurement points P1, P2,..., Pn. The light applying units L1, L2,..., Ln constitute excitation light application means for continuously applying excitation light to the measurement points P1, P2,..., Pn, respectively.
- The
data analysis unit 32, which is constituted by, for example, a personal computer, estimates auto-correlation functions and cross-correlation functions for fluctuation signals output from thephotodetectors 28. That is, thedata analysis unit 32 estimates an auto-correlation function at each of the measurement points P1, P2,..., Pn, and also estimates a cross-correlation function between two of the measurement points P1, P2,..., Pn. That is, thedata analysis unit 32 constitutes analysis means for analyzing a molecular interaction such as the movement vector of a molecule between two of the measurement points P1, P2,..., Pn by using fluctuation signals corresponding to the fluctuations of light from the measurement points P1, P2,..., Pn that are detected by the photodetection units D1, D2,..., Dn. Thedata analysis unit 32 also displays and stores the analysis results. Among the continuous data (continuous signals) at the measurement points P1, P2,..., Pn, continuous data (continuous signals) at two independent measurement points are used for inter-point correlation computation. At different measurement points, continuous data (signals) are measured, and a correlation relationship in the vector direction between the two points is directly observed from changes in molecular movement. - Analysis at the two measurement points P1 and P2 will be exemplified below.
FIG. 2 shows a fluctuation signal corresponding to the fluctuations of light from a measurement point.FIG. 3 shows a fluctuation signal corresponding to the fluctuations of light from a measurement point. - Analysis processing by the
data analysis unit 32 will be described below with reference to the flowchart ofFIG. 4 . - As measurement data about a sample, digital data at the two measurement points P1 and P2, i.e., fluctuation signals of light at the two measurement points P1 and P2, are acquired. Although the acquired digital data at the two measurement points P1 and P2 are directly used for calculation, the data can be displayed as the continuous signals shown in
FIGS. 2 and 3 by an interpolation method. - Whether there is any acquired data is determined. If YES, the process advances to step S2. If NO, the process enters the imaging determination in step S14.
- The number of data read is counted. The total number of data counted is used for channel calculation, comprehensive calculation, and the like.
- For example, plotted τ values (channel values) and the number of channels in the multiple τ scheme are calculated. The multiple τ scheme determines the number of channels from the total number of data read.
FIG. 5 shows a specific calculation method. The first 16 channel values are based on a bin time τ0 as a reference value, and every subsequent eighth channel value is based on the value obtained by doubling the bin time To as a reference value.FIG. 5 shows general channel values based on the bin time To as a reference value.FIG. 6 shows channel values when the bin time τ0 is 2 µs. - In other words, the first 16 channels are set in the zeroth stage, and subsequent sets of eight channels each are set in the first stage, second stage,.... An increment (reference value) in channel value in each stage is represented by 2nτ0 where n is the number of stages. For example, an increment in channel value in the zeroth stage is To, and an increment in channel value in the second stage is 4τ0.
- As is obvious from the above description, the number of channels for correlation value calculation is calculated on the basis of bin times and the total number of data read. For example, when data is measured for 32 sec with a bin time of 2 µs, the total number of channels for calculation is approximately 176.
- In step S4, data reconstruction at the measurement point P1 is performed. In step S5, data reconstruction at the measurement point P2 is performed. That is, the first channel data of the respective channels with different reference values (increments) is calculated. Summation processing for measurement data IP1 and IP2 at the measurement point P1 and the measurement point P2 is performed. With regard to a delay time τ after
channel 16, since the reference (increment) is doubled for every eighth channel (see step S3), the data of each channel comprises the sum of two data before the reference value (increment) is doubled. Changes in data in detail are shown inFIG. 7 . Performing summation processing at each of the two measurement points P1 and P2 will sequentially generate channel data having new reference values (increments) from acquired data, thereby generating a new data form. In actual data reconstruction processing, the data of a channel other than the first channel is formed by moving the data of the first channel. - In other words, the array of all the read data is set as the data array of the zeroth row, and the array of the sums of pairs of adjacent data is set as the data array of the first row. Subsequently, the same operation is repeated to generate the data arrays of the second row, third row,.... This operation is repeated until data arrays equal in number to channel stages are obtained. In each data table obtained in this manner, the data of each row correspond to the channels in a corresponding stage. For example, the second-row zeroth-column data corresponds to the second-stage zeroth-column channel.
- The sum total of data is calculated. That is, the sum totals of data with variables at the respective channel value positions in the multiple τ scheme is calculated with respect to the measurement data IP1 and IP2 at the measurement point P1 and the measurement P2.
- Sum-of-product calculation between data at the same measurement point is performed. That is, for the measurement data IP1 and IP2 at the measurement point P1 and the measurement point P2, in the case of the measurement point P1, data at channel positions with the same reference value (increment) is multiplied by the zeroth-column data, and the sum of the products is calculated. In other words, in the data array at the measurement point P1 that corresponds to the channels of each stage shown in
FIG. 5 , the sum of the products between the first data and the respective remaining data is obtained. Similar calculation processing is performed for the measurement point P2. - The number of times of data sum-of-product calculation at the same measurement point is counted. That is, count of the number of times of data sum-of-product calculation is performed at the same time as calculation in steps S8 and S9.
- Sum-of-product calculation of data between different measurement points is performed. That is, sum-of-product calculation between the zeroth-column data at the measurement point P1 and the data at the measurement point P2 is performed. As shown in
FIG. 9 , the data at channel positions with the same reference value (increment) as that at the measurement point P2 is multiplied by the zeroth-column data at the measurement point P1, and the sum of products is calculated. In other words, for the data array at the measurement point P1 and the data array at the measurement point P2 that correspond to the channels of the respective stages, the sum of the products between the first data of the data array at the measurement point P1 and the respective data of the data array at the measurement point P2 is obtained. - The number of times of data sum-of-product calculation between different measurement points is counted. That is, count of the number of times of data sum-of-product calculation is performed at the same time as calculation in step S12.
- Termination of the computation and imaging are determined. If YES, the process enters comprehensive correlation calculation in step S15. If NO, the process returns to the data acquisition determination in step S1.
- If the data read is complete (YES in step S14), auto-correlation functions for each of the two measurement points P1 and P2 and an inter-point cross-correlation function between the two measurement points P1 and P2 are estimated on the basis of the above respective calculation results. That is, correlation functions are estimated by using different analytical expressions for the respective correlation directions of P1 → P2, P1 → P1, and P2 → P2.
- For example, the formula (S8 * S10) /(S60 * S6) is used for P1 → P1, the formula (S9 * S11)/(S60 * S7) is used for P2 → P2, and the formula (S12 * S13) /(S60 * S6) is used for P1 → P2. Here, S60 and S70 represent data sum totals at channel positions with the respective reference values (increments).
- These analytical expressions can be expressed by


- In equations (1) to (3), mlFP0Sum(τν) represents the sum total of zeroth-column data of the respective stages, mlFPSum(τν) represents the sum total of channel data in each multiple τ scheme, mlFPRPSum(τν) represents sum-of-product calculation between zeroth-column data and the respective channel data, and mlNPPSum(τν) represents the total number of times of sum-of-product calculation. Here the subscript P is P1 or P2, and corresponds to calculation target data, i.e., data at the measurement point P1 or data at the measurement point P2.
- Processing such as displaying an inter-point cross-correlation function in the form of a curve is performed on the basis of each final calculation result.
- As is obvious from the above description, the photometric analysis apparatus of this embodiment estimates cross-correlation functions for the two different measurement points P1 and P2. If the correlation of the analysis result on P1 → P2 is high, it can be estimated that the probability of movement of the same molecule from the measurement point P1 to the measurement point P2 is high. In contrast, if the correlation is low, it can be estimated that the probability of passage of a molecule through the measurement point P2 after passage through the measurement point P1 is low, and the probability of movement of the molecule in another direction is high. That is, the photometric analysis apparatus of the embodiment allows observation of the movement of a molecule between the two measurement points P1 and P2. In addition, by examining the correlativity between sets of two measurement points, molecular movement vectors are estimated.
-
FIG. 10 schematically shows an optical signal analysis apparatus according to the second embodiment of the present invention. An opticalsignal analysis apparatus 200 includes a single light applying unit L, a single photodetection unit D, and adata analysis unit 32. - The light applying unit L includes a
light source 12, a collimatinglens 14, acondenser lens 16, ascanner 18, and the like. The light applying unit L, which is excitation light application means for time-divisionally applying excitation light to measurement points P1, P2,..., Pn, intermittently scans a light beam by thescanner 18, and applies excitation light to the different measurement points P1, P2,..., Pn in a sample S. - The photodetection unit D includes a
condenser lens 22, apinhole 24, animaging lens 26, aphotodetector 28, and the like. The photodetection unit D, which is photodetection means for time-divisionally detecting light emitted from the measurement points P1, P2,..., Pn in the sample, time-serially receives light emitted from the measurement points P1, P2,..., Pn. The arrangement of the photodetection unit D is the same as that of one of the photodetection units D1, D2,..., Dn in the first embodiment. - The
data analysis unit 32 comprises, for example, a personal computer. Thedata analysis unit 32 estimates an auto-correlation function at each of the measurement points P1, P2,..., Pn and a cross-correlation function between two of the measurement points P1, P2,..., Pn on the basis of the fluctuation signals output from thephotodetector 28. That is, thedata analysis unit 32 constitutes analysis means for analyzing a molecular interaction such as the movement vector of a molecule between two of the measurement points P1, P2,..., Pn by using fluctuation signals corresponding to the fluctuations of light from the measurement points P1, P2,..., Pn that are time-divisionally detected by the photodetection unit D. - The following exemplifies analysis at the two measurement points P1 and P2. The light applying unit L alternately applies excitation light to the two measurement points P1 and P2 at short time intervals. As shown in
FIG. 11 , thus, data from the photodetection unit D becomes time-series mixed data in which data at the two measurement points P1 and P2 are alternately mixed. Reference symbols P1 and P2 inFIG. 11 respectively denote data measurement ranges for the measurement points P1 and P2. That is, this data alternately contains the data at the measurement point P1 and the measurement point P2, and can be divided by time. Although the time-series mixed data actually includes measurement ranges in switching periods between the measurement points P1 and P2 in addition to the data measurement ranges for the measurement points P1 and P2,FIG. 11 does not illustrate them. - This time-series mixed data is sent to the
data analysis unit 32 to be divided into data at each measurement point and processed. That is, thedata analysis unit 32 extracts the time-division data at the measurement point P1 shown inFIG. 12 and the time-division data at the measurement point P2 shown inFIG. 13 from the time-series mixed data shown inFIG. 11 . Consider the time-division data at the measurement point P1. The data at the measurement point P1 are obtained by extracting only fluorescence intensity in each period during which thescanner 18 stops an excitation light beam at the measurement point P1, and data in other periods are set as 0. Likewise, with regard to the signal at the measurement point P2, the data at the measurement point P2 are obtained by extracting only fluorescence intensity in each period during which thescanner 18 stops an excitation light beam at the measurement point P2, and data in other periods are set as 0. In this manner, thedata analysis unit 32 generates two pseudo signals or pseudo data corresponding to light from the measurement point P1 and the measurement point P2 on the basis of the fluctuation signals output from thephotodetector 28. In this pseudo signal or pseudo data, each signal omission period that occurs due to time-divisional detection is interpolated by a signal with a predetermined value. - That is, data at two different measurement points are extracted from time-series mixed data at the two measurement points. The
data analysis unit 32 performs inter-point correlation computation for the extracted data at the two different measurement points by using the conventional general-purpose scheme, the information table scheme, or the multiple τ scheme. - In this embodiment, when performing data analysis on inter-point cross-correlation functions in the multiple τ scheme using weighting coefficients, the data analysis unit repeatedly performs measurement at two measurement points. The data analysis unit extracts only data and weighting coefficients corresponding to each measurement point by time-serially dividing the measurement data obtained by measurement into a data table and a weighting coefficient table at each measurement point, thereby calculating an auto-correlation function. The data analysis unit calculates auto-correlation functions and inter-point cross-correlation functions by using the extracted data at the respective measurement points, the data at the two measurement points in the weighting coefficients, and the weighting coefficients. Based on the calculation result, an operator simultaneously observes not only cell reactions at two points but also a cell interaction between different regions (two points).
- When correlation function computation is performed, octave channels are used as channels for the calculation of data and weighting coefficients, and the calculation of data and weighting coefficients is limited to the result obtained by a small finite number of channels, thereby implementing the plotting of calculation results at equal intervals. In addition, the data analysis unit calculates the average of data and the average of weighting coefficients that correspond to different delay times in different τ areas in advance. Assume that in each process using the extracted data and weighting coefficients at measurement points, one data or weighting coefficient is set as a minimum calculation unit.
- The multiple τ scheme will be described in detail below with reference to the flowcharts of
FIGS. 14A and14B . - As measurement data about a sample, the time-series measurement data at the two measurement points P1 and P2 are acquired. A continuous signal obtained by an interpolation method for the acquired time-series mixed data is shown
FIG. 11 . - Whether there is any acquired data is determined. IF YES, the process advances to step S2. If NO, the process enters the imaging determination in step S18.
- The number of data read is counted. The total number of data counted is used for channel calculation, comprehensive calculation, and the like.
- For example, plotted τ values (channel values) and the number of channels in the multiple τ scheme are calculated. The multiple τ scheme determines the number of channels from the total number of data read. According to a specific calculation method, as shown in
FIG. 5 in the first embodiment, the first 16 channel values are based on a bin time τ0 as a reference value, and every subsequent eighth channel value is based on the value obtained by doubling the bin time τ0 as a reference value. - In other words, the first 16 channels are set in the zeroth stage, and subsequent sets of eight channels each are set in the first stage, second stage,.... An increment (reference value) in channel value in each stage is represented by 2nτ0 where n is the number of stages. For example, an increment in channel value in the zeroth stage is τ0, and an increment in channel value in the second stage is 4τ0.
- As is obvious from the above description, the number of channels for calculation is determined by bin time values and the total number of data read.
- Measurement points are identified. That is, the number of measurement points at which measurement has been simultaneously performed and the corresponding measurement point numbers are determined. If it is determined in step S4 that the measurement point is the measurement point P1, the input data is processed as the effective data at the measurement point P1 in step S6 and the subsequent steps, and data at the measurement point P2 is processed as zero in step S5. If it is determined in step S4 that the measurement point is the measurement point P2, the input data is processed as the effective data at the measurement point P2 in step S6 and the subsequent steps, and data at the measurement point P1 is processed as zero in step S5. If the measurement point is neither the measurement point P1 nor the measurement point P2, the data at the measurement point P1 is interpolated as zero in step S5 as in the above case.
- Data extraction is performed. That is, the data analysis unit divides data at each measurement point. When measurement is performed at measurement points while the measurement points are time-serially switched, time-series mixed data in which data at the measurement points are mixed is obtained. Here, the time-series mixed data is divided into data at each measurement point. If, for example, data measurement is performed at the measurement points P1 and P2 in the order of P1 → P2 → P1 as in the case shown in
FIG. 11 , two measurement data at the measurement points P1 and P2 are time-serially arrayed in the measured data. This data is expressed by a specific data table like that shown inFIG. 15 , and a data division method for each measurement point will be described. First of all, at the measurement point P1, only the data at the measurement point P1 is extracted from the mixed data.Data 0 is then embedded at a position corresponding to the other measurement point (the measurement point P2). As a result, the division data table for the measurement point P1 shown inFIG. 16 is generated. Likewise, the data analysis unit generates a different data table for the measurement point P2. That is, two pseudo data corresponding to the respective light are generated from the two measurement points P1 and P2 on the basis of the fluctuation signals output from thephotodetector 28. In this pseudo data, each signal omission period that occurs due to time-divisional detection is interpolated by data with a predetermined value. As a result, two division data tables are generated at the two measurement points P1 and P2. - In order to prevent the influence of each signal or data omission period that occurs due to time-divisional detection, different weights are assigned between each period during which a signal or data is omitted and each of other periods. A weighting coefficient table for this purpose is generated. That is, weighting coefficient division is performed for each measurement point. When measurement is performed at measurement points while the measurement points are time-serially switched, the measurement data contains information representing the size of data and information representing the measurement point position of data. Such information is also divided at each measurement point. The multiple τ scheme based on measurement at plural measurement points uses such information as weighting coefficients for calculation. When data measurement is performed at the two measurement points P1 and P2, the resultant data is represented by one data (weighting coefficient = 1). First of all, only weighting coefficients corresponding to the measurement point P1 are extracted as in the case of data signal division. A weighting coefficient of 0 is embedded at each position corresponding to the other measurement point. As a consequence, the division weighting coefficient table for the measurement point P1 shown in
FIG. 17 is generated. Likewise, a different division weighting coefficient table for the measurement point P2 is generated. That is, two division weighting coefficient tables at the two measurement points P1 and P2 are generated. - Data reconstruction is performed. That is, the first channel data of the respective channels with different reference values (increments) is calculated. Summation processing at each measurement point is performed by using the data tables for the measurement point P1 and the measurement point P2. With regard to a delay time τ after
channel 16, since the reference (increment) is doubled for every eighth channel (see steps S4 and S5 in the first embodiment), the data of each channel comprises the sum of two data before the reference value (increment) is doubled. Changes in data in detail are shown inFIG. 18 . Performing summation processing at the two measurement points P1 and P2 will sequentially generate channel data having new reference values (increments) from data division tables, thereby generating a new data form. - In other words, the array of all the read data is set as the data array of zeroth row, and the array of the sums of pairs of adjacent data is set as the data array of the first row. Subsequently, the same operation is repeated to generate the data arrays of the second row, third row,.... This operation is repeated until data arrays equal in number to channel stages are obtained. In each data table obtained in this manner, the data of each row correspond to the channels in a corresponding stage. For example, the second-row zeroth-column data corresponds to the second-stage zeroth-column channel.
- Weighting coefficient reconstruction is performed. That is, the first channel weighting coefficients of respective channels with different reference values (increments) is calculated. Summation processing is performed for each measurement point by using the division weighting coefficient tables for the measurement point P1 and the measurement point P2. The weighting coefficient tables change in the same manner as in step S8. That is, in the process of summation processing, weighting coefficients for channels with new reference values (increments) are sequentially formed (
FIG. 19 ), thereby generating a new weighting coefficient form. - In other words, the array of all weighting coefficients is set as the weighting coefficient array of the zeroth row, and the array of the sums of pairs of adjacent weighting coefficients is set as the weighting coefficient array of the first row. Subsequently, this operation is repeated to generate the weighting coefficient arrays of the second row, third row,.... This operation is repeated until weighting coefficient arrays equal in number to channel stages are obtained. In each weighting coefficient table obtained in this manner, the weighting coefficients of each row correspond to the channels in a corresponding stage.
- Sum-of-product calculation between data is performed for extracted data IP1 at the measurement point P1. That is, as shown in
FIG. 20 , data at channel positions of the measurement point P1 at which the same reference value (increment) is set is multiplied by the zeroth-column data, and the sum of the products is calculated. In other words, in the data array at the measurement point P1 that corresponds to the channels of each stage, the sum of the products between the first data and the respective remaining data is obtained. Sum-of-product calculation between data is then performed for extracted data IP2 at the measurement point P2. That is, the same processing is performed at the measurement point P2, so that data at channel positions of the measurement point P2 at which the same reference value (increment) is set is multiplied by the zeroth-column data, and the sum of the products is calculated. In other words, in the data array at the measurement point P2 that corresponds to the channels of each stage, the sum of the products between the first data and the respective remaining data is obtained. - Sum-of-product calculation between weighting coefficients is performed for extracted weighting coefficients WP1 at the measurement point P1. That is, weighting coefficients at channel positions of the measurement point P1 at which the same reference value (increment) is set are multiplied by the zeroth-column weighting coefficient, and the sum of the products is calculated. In other words, in the weighting coefficient array at the measurement point P1 that corresponds to the channels of each stage, the sum of the products between the first weighting coefficient and the respective remaining weighting coefficients is obtained. Sum-of-product calculation between weighting coefficients is then performed for extracted weighting coefficients WP2 at the measurement point P2. That is, the same processing is performed at the measurement point P2, so that weighting coefficients at channel positions of the measurement point P2 at which the same reference value (increment) is set are multiplied by the zeroth-column weighting coefficient, and the sum of the products are calculated. In other words, in the weighting coefficient array at the measurement point P2 that corresponds to the channels of each stage, the sum of the products between the first weighting coefficient and the respective remaining weighting coefficients is obtained.
- Sum-of-product calculation between the zeroth-column data and weighting coefficients is performed for the extracted data IP1 and weighting coefficients WP1 at the measurement point P1. That is, weighting coefficients at channel positions of the measurement point P1 at which the same reference value (increment) is set are multiplied by the zeroth-column data, and the sum of the products is calculated. In other words, in the data array and the weighting coefficients array at the measurement point P1 that corresponds to the channels of each stage, the sum of the products between the first data and the respective weighting coefficients is obtained. Sum-of-product calculation between the zeroth-column data and weighting coefficients is performed for the extracted data IP2 and weighting coefficients WP2 at the measurement point P2. That is, the same processing is performed at the measurement point P2, so that weighting coefficients at channel positions of the measurement point P2 at which the same reference value (increment) is set are multiplied by the zeroth-column data, and the sum of the products is calculated. In other words, in the data array and the weighting coefficient array at the measurement point P1 that corresponds to the channels of each stage, the sum of the products between the first data and the respective weighting coefficients is obtained.
- Sum-of-product calculation between the zeroth-column weighting coefficient and data is performed for the extracted weighting coefficients WP1 and data IP1 at the measurement point P1. That is, data at channel positions of the measurement point P1 at which the same reference value (increment) is set is multiplied by the zeroth-column weighting coefficient, and the sum of the products is calculated. In other words, in the data array and the weighting coefficient array at the measurement point P1 that corresponds to the channels of each stage, the sum of the products between the first weighting coefficient and the respective data is obtained. Sum-of-product calculation between a weighting coefficient and data is then performed for the extracted weighting coefficient WP2 and data IP2 at the measurement point P2. That is, the same processing is performed at the measurement point P2, so that data at channel positions of the measurement point P2 at which the same reference value (increment) is set is multiplied by the zeroth-column weighting coefficient, and the sum of the products is calculated. In other words, in the data array and the weighting coefficient array at the measurement point P2 that corresponds to the channels of each stage, the sum of the products between the first weighting coefficient and the respective data is obtained.
- Sum-of-product calculation between the data at the two measurement point P1 and P2 is performed for the extracted data IP1 and IP2 at the measurement point P1 and the measurement point P2. That is, as shown in
FIG. 21 , data at channel positions of the measurement point P2 at which the same reference value (increment) is set is multiplied by the zeroth-column data at the measurement point P1, and the sum of the products is calculated. In other words, in the data array at the measurement point P1 and the data array at the measurement point P2 that corresponds to the channels of each stage, the sum of the products between the first data of the data array at the measurement point P1 and the respective data of the data array at the measurement point P2 is obtained. - Sum-of-product calculation between the weighting coefficients at the two measurement points P1 and P2 is performed for the extracted weighting coefficients WP1 and WP2 at the measurement point P1 and the measurement point P2. That is, weighting coefficients at channel positions of the measurement point P2 at which the same reference value (increment) is set are multiplied by the zeroth-column weighting coefficient at the measurement point P1, and the sum of the products is calculated. In other words, in the weighting coefficient array at the measurement point P1 and the weighting coefficients of the weighting coefficient array at the measurement point P2 that corresponds to the channels of each stage, the sum of the products between the first weighting coefficient of the weighting coefficient array at the measurement point P1 and the respective weighting coefficients of the weighting coefficient array at the measurement point P2 is obtained.
- Sum-of-product calculation between the zeroth-column data at the measurement point P1 and the weighting coefficients at the measurement point P2 is performed for the extracted data IP1 at the measurement point P1 and the weighting coefficients WP2 at the measurement point P2. That is, weighting coefficients at channel positions of the measurement point P2 at which the same reference value (increment) is set are multiplied by the zeroth-column data at the measurement point P1, and the sum of the products is calculated. In other words, in the data array at the measurement point P1 and the weighting coefficient array at the measurement point P2 that corresponds to the channels of each stage, the sum of the products between the first data of the data array at the measurement point P1 and the respective weighting coefficients of the weighting coefficient array at the measurement point P2 is obtained.
- Sum-of-product calculation between the zeroth-column weighting coefficient at the measurement point P1 and data at the measurement point P2 is performed for the extracted weighting coefficients WP1 at the measurement point P1 and the extracted data IP2 at the measurement point P2. That is, data at channel positions of the measurement point P2 at which the same reference value (increment) is set is multiplied by the zeroth-column weighting coefficient at the measurement point P1, and the sum of the products is calculated. In other words, in the data array at the measurement point P2 and the weighting coefficient array at the measurement point P1 that corresponds to the channels of each stage, the sum of the products between the first data of the data array at the measurement point P2 and the respective weighting coefficients of the weighting coefficient array at the measurement point P1 is obtained.
- Termination of the computation and imaging are determined. If YES, the process enters comprehensive correlation calculation. If NO, the process returns to the data acquisition in step S1.
- If the data read is complete (YES in step S21), auto-correlation functions for each of the two measurement points P1 and P2 and an inter-point cross-correlation function between the two measurement points P1 and P2 are estimated on the basis of the above respective calculation results. That is, correlation functions are estimated by using different analytical expressions for the respective correlation directions of P1 → P2, P1 → P1, and P2 → P2.
- For example, the data analysis unit uses the formula (S10 * S11)/(S12 * S13) for P1 → P1 and P2 → P2, and the formula (S14 * S15)/(S16 * S17) for P1 → P2.
- These analytical expressions can be expressed by


- In equations (4) to (6), mlFPRPSum(τν) represents sum-of-product calculation between data, mlWPVPSum(τν) represents sum-of-product calculation between weighting coefficients, mlFPVPSum(τν) represents sum-of-product calculation between the zeroth-column data and weighting coefficients, and mlWPRPSum(τν) represents sum-of-product calculation between the zeroth-column weighting coefficient and data. Here, the subscript P is P1 or P2, and corresponds to calculation target data, i.e., data at the measurement point P1 or data at the measurement point P2. In addition, in τν = τ0 + τ, τ0 is based on a delay time τ0P due to the inter-point distance and a delay time τ0M due to the inter-point difference in measurement start time, and τ is a delay time at the time of normal correlation computation.
- Equations (6) is based on cross-correlation analytical expression (7) given below. Cross-correlation analytical expression (7) is derived by weighting the general-purpose cross-correlation function represented by equation (8). Equation (8) can be expressed as expression (9) if N1 = N2 = N12.



- Processing such as displaying an inter-point cross-correlation function in the form of a curve is performed on the basis of each final calculation result.
- As is obvious from the above description, the photometric analysis apparatus of this embodiment estimates cross-correlation functions for the two different measurement points P1 and P2. If the correlation of the analysis result on P1 → P2 is high, it can be estimated that the probability of movement of the same molecule from the measurement point P1 to the measurement point P2 is high. In contrast, if the correlation is low, it can be estimated that the probability of passage of a molecule through the measurement point P2 after passage through the measurement point P1 is low, and the molecular movement frequently occurs in other directions. That is, the photometric analysis apparatus of the embodiment allows observation of the movement of a molecule between the two measurement points P1 and P2. In addition, by examining the correlativity between sets of two measurement points, molecular movement vectors are estimated.
- In addition, since a calculation result is plotted for each read data, it is not necessary to wait for the completion of calculation of a large amount of data as in the conventional general-purpose scheme. It is possible to stop data read and calculation as needed and perform real-time drawing. Furthermore, it is possible to obtain the values of parameters such as the translational diffusion time of molecules and the number of molecules by logically fitting the calculation result based on the respective measurement data.
- The single light applying unit intermittently scans a light beam to apply excitation light to measurement points, and the single photodetection unit detects fluorescence generated from the measurement points. That is, a single optical system is used for the measurement points. This prevents errors due to incoincidence between measurement areas, application intensities, signal transmission systems, and the like. In addition, since data at two different measurement points originate from the same measurement signal, the measurement start time error is 0. Furthermore, since only one set of hardware is required, a high-performance, low-cost optical signal analysis apparatus can be provided.
- Furthermore, since only a small number of averaged data and weighting coefficients are used for the calculation of correlation functions, the time required for the calculation is short.
- Although the embodiments of the present invention have been described with reference to the views of the accompanying drawing, the present invention is not limited to these embodiments. The embodiments may be variously modified and changed within the spirit and scope of the invention.
- For example, the optical signal analysis apparatus according to the above embodiment detects fluorescence. However, the light to be detected is not limited to fluorescence and may be other types of light, e.g., phosphorescence, reflected light, scattered light, chemiluminescence, and bioluminescence.
- The above embodiments use the correlation function analysis method. However, it suffices to use the photo counting histogram method or the coincidence analysis method instead of the above method.
- In the second embodiment, the photodetection unit D time-divisionally detects light emitted from the measurement points P1, P2,..., Pn in the sample with the
single photodetector 28. However, this unit may have photodetectors that respectively receive light emitted from the measurement points P1 and P2 in the sample. - According to the present invention, there are provided an optical signal analysis apparatus and an optical signal analysis method that allow observation of the movement of a molecule between two points.
Claims (28)
- An optical signal analysis apparatus characterized by comprising:photodetection means for detecting light emitted from measurement points in a sample; andanalysis means for analyzing a molecular interaction between two of the measurement points by using fluctuation signals corresponding to fluctuations of the light from the measurement points that are detected by the photodetection means.
- An optical signal analysis apparatus according to claim 1, characterized in that light detected by the photodetection means is one of fluorescence, phosphorescence, reflected light, scattered light, chemiluminescence, and bioluminescence.
- An optical signal analysis apparatus according to claim 1, characterized by further comprising excitation light applying means for applying excitation light to the measurement points.
- An optical signal analysis apparatus according to claim 3, characterized in that the excitation light applying means includes light applying units that continuously apply excitation light to the measurement points.
- An optical signal analysis apparatus according to any one of claims 1 to 3, characterized in that the photodetection means includes photodetection units that respectively receive light emitted from the measurement points.
- An optical signal analysis apparatus according to claim 5, characterized in that the analysis means estimates a cross-correlation function on the basis of the two fluctuation signals at the two measurement points.
- An optical signal analysis apparatus according to any one of claims 1 to 3, characterized in that the excitation light applying means comprises a single light applying unit.
- An optical signal analysis apparatus according to claim 7, characterized in that the light applying unit time-divisionally applies excitation light to the measurement points.
- An optical signal analysis apparatus according to any one of claims 1 to 3, characterized in that the photodetection means comprises a single photodetection unit.
- An optical signal analysis apparatus according to claim 9, characterized in that the photodetection unit time-divisionally detects the light from the measurement points.
- An optical signal analysis apparatus according to any one of claims 7 to 10, characterized in that the analysis means generates pseudo signals or pseudo data respectively corresponding to the light from the measurement points on the basis of the fluctuation signals detected by the photodetection means.
- An optical signal analysis apparatus according to claim 11, characterized in that the analysis means interpolates the pseudo signal or pseudo data by using a signal or data having a predetermined value in a period during which a signal or data is omitted due to the time-divisional detection.
- An optical signal analysis apparatus according to claim 11, characterized in that the analysis means estimates a cross-correlation function between two of the pseudo signals or pseudo data.
- An optical signal analysis apparatus according to claim 13, characterized in that the analysis means further includes influence prevention means for preventing an influence of a period during which a signal or data is omitted due to the time-divisional detection on an analysis result when estimating the cross-correlation function.
- An optical signal analysis apparatus according to claim 14, characterized in that the influence prevention means assigns different weights between a period during which a signal or data is omitted due to the time-divisional detection and another period.
- An optical signal analysis method
characterized by comprising:a photodetection step of detecting light emitted from measurement points in a sample; andan analysis step of analyzing a molecular interaction between two of the measurement points by using fluctuation signals corresponding to fluctuations of the light from the measurement points. - An optical signal analysis method according to claim 16, characterized in that the light detected in the photodetection step is one of fluorescence, phosphorescence, reflected light, scattered light, chemiluminescence, and bioluminescence.
- An optical signal analysis method according to claim 16, characterized by further comprising an excitation light applying step of applying excitation light to the measurement points.
- An optical signal analysis method according to claim 18, characterized in that in the excitation light applying step, excitation light is continuously applied to the measurement points.
- An optical signal analysis method according to any one of claims 16 to 18, characterized in that in the photodetection step, light emitted from the measurement points is respectively detected by photodetection units.
- An optical signal analysis method according to claim 20, characterized in that the analysis step estimates a cross-correlation function on the basis of two fluctuation signals corresponding to the two measurement points.
- An optical signal analysis method according to claim 18, characterized in that in the excitation light applying step, excitation light is time-divisionally applied to the measurement points.
- An optical signal analysis method according to claim 18, characterized in that in the photodetection step, the light from the measurement points is time-divisionally detected.
- An optical signal analysis method according to any one of claims 22 and 23, characterized in that in the analysis step, pseudo signals or pseudo data respectively corresponding to the light from the measurement points are generated on the basis of the fluctuation signals.
- An optical signal analysis method according to claim 24, characterized in that in the analysis step, the pseudo signal or pseudo data is interpolated by using a signal or data having a predetermined value in a period during which a signal or data is omitted due to the time-divisional detection.
- An optical signal analysis method according to claim 24, characterized in that in the analysis step, a cross-correlation function between two of the pseudo signals or pseudo data is estimated.
- An optical signal analysis method according to claim 26, characterized in that the analysis step further includes an influence prevention step of preventing an influence of a period during which a signal or data is omitted due to the time-divisional detection on an analysis result when estimating the cross-correlation function.
- An optical signal analysis method according to claim 27, characterized in that the influence prevention step assigns different weights between a period during which a signal or data is omitted due to the time-divisional detection and another period.
Applications Claiming Priority (2)
| Application Number | Priority Date | Filing Date | Title |
|---|---|---|---|
| JP2005279987 | 2005-09-27 | ||
| PCT/JP2006/319133 WO2007037253A1 (en) | 2005-09-27 | 2006-09-27 | Optical signal analyzing apparatus and optical signal analyzing method |
Publications (1)
| Publication Number | Publication Date |
|---|---|
| EP1939607A1 true EP1939607A1 (en) | 2008-07-02 |
Family
ID=37899677
Family Applications (1)
| Application Number | Title | Priority Date | Filing Date |
|---|---|---|---|
| EP06810624A Withdrawn EP1939607A1 (en) | 2005-09-27 | 2006-09-27 | Optical signal analyzing apparatus and optical signal analyzing method |
Country Status (4)
| Country | Link |
|---|---|
| US (1) | US8130383B2 (en) |
| EP (1) | EP1939607A1 (en) |
| JP (1) | JP4740952B2 (en) |
| WO (1) | WO2007037253A1 (en) |
Cited By (2)
| Publication number | Priority date | Publication date | Assignee | Title |
|---|---|---|---|---|
| EP2587250A4 (en) * | 2010-06-22 | 2016-06-01 | Hitachi High Tech Corp | Automatic analysis device |
| EP2587251A4 (en) * | 2010-06-23 | 2017-04-05 | Hitachi High-Technologies Corporation | Automated analysis device and automated analysis method |
Families Citing this family (8)
| Publication number | Priority date | Publication date | Assignee | Title |
|---|---|---|---|---|
| JP5265408B2 (en) * | 2009-02-18 | 2013-08-14 | オリンパス株式会社 | Correlation spectroscopy analysis method and correlation spectroscopy analyzer |
| JP5566055B2 (en) * | 2009-07-10 | 2014-08-06 | オリンパス株式会社 | Image analysis method and image analysis apparatus |
| JP5508808B2 (en) * | 2009-10-15 | 2014-06-04 | オリンパス株式会社 | Image analysis method and image analysis apparatus |
| JP2012008055A (en) * | 2010-06-25 | 2012-01-12 | Olympus Corp | Method and device for analyzing image |
| WO2012056580A1 (en) | 2010-10-29 | 2012-05-03 | オリンパス株式会社 | Image analysis method and image analysis device |
| WO2012056578A1 (en) | 2010-10-29 | 2012-05-03 | オリンパス株式会社 | Image analysis method and image analysis device |
| JP6010898B2 (en) * | 2011-11-16 | 2016-10-19 | ソニー株式会社 | Biological measuring device, biological measuring method, program, and recording medium |
| JP6134210B2 (en) * | 2013-06-19 | 2017-05-24 | 株式会社日立ハイテクノロジーズ | Automatic analyzer and automatic analysis method |
Family Cites Families (12)
| Publication number | Priority date | Publication date | Assignee | Title |
|---|---|---|---|---|
| AUPQ270599A0 (en) * | 1999-09-08 | 1999-09-30 | Varian Australia Pty Ltd | Spectrophotometer apparatus and phosphorescence measurement |
| AU2003244122A1 (en) * | 2002-06-21 | 2004-01-06 | Olympus Corporation | Biomolecule analyzer |
| JP3984132B2 (en) * | 2002-09-17 | 2007-10-03 | オリンパス株式会社 | Fluorescence spectrometer |
| JP2004187581A (en) * | 2002-12-11 | 2004-07-08 | Olympus Corp | Method for determining polymorphism of target nucleic acid |
| JP2004361087A (en) * | 2003-05-30 | 2004-12-24 | Olympus Corp | Biomolecule analyzer |
| JP3999701B2 (en) * | 2003-05-30 | 2007-10-31 | オリンパス株式会社 | Spectroscopic analyzer |
| JP2005017282A (en) * | 2003-05-30 | 2005-01-20 | Olympus Corp | Light-receiving unit and measuring apparatus including the same |
| EP1582858A1 (en) * | 2004-03-29 | 2005-10-05 | Max-Planck-Gesellschaft zur Förderung der Wissenschaften e.V. | Method to excite molecules from a first state to a second state with an optical signal |
| JP4615941B2 (en) * | 2004-09-10 | 2011-01-19 | オリンパス株式会社 | Optical signal analysis method |
| US7602479B2 (en) * | 2004-11-01 | 2009-10-13 | Olympus Corporation | Light emission measuring apparatus and light emission measuring method |
| DE102005027896B4 (en) * | 2005-06-16 | 2012-03-15 | MAX-PLANCK-Gesellschaft zur Förderung der Wissenschaften e.V. | Method for optically measuring a sample |
| JP4830087B2 (en) * | 2005-09-27 | 2011-12-07 | 国立大学法人北海道大学 | Optical signal analyzer |
-
2006
- 2006-09-27 JP JP2007537634A patent/JP4740952B2/en not_active Expired - Fee Related
- 2006-09-27 WO PCT/JP2006/319133 patent/WO2007037253A1/en not_active Ceased
- 2006-09-27 EP EP06810624A patent/EP1939607A1/en not_active Withdrawn
-
2008
- 2008-03-26 US US12/055,763 patent/US8130383B2/en not_active Expired - Fee Related
Non-Patent Citations (1)
| Title |
|---|
| See references of WO2007037253A1 * |
Cited By (2)
| Publication number | Priority date | Publication date | Assignee | Title |
|---|---|---|---|---|
| EP2587250A4 (en) * | 2010-06-22 | 2016-06-01 | Hitachi High Tech Corp | Automatic analysis device |
| EP2587251A4 (en) * | 2010-06-23 | 2017-04-05 | Hitachi High-Technologies Corporation | Automated analysis device and automated analysis method |
Also Published As
| Publication number | Publication date |
|---|---|
| US8130383B2 (en) | 2012-03-06 |
| JPWO2007037253A1 (en) | 2009-04-09 |
| WO2007037253A1 (en) | 2007-04-05 |
| US20080306713A1 (en) | 2008-12-11 |
| JP4740952B2 (en) | 2011-08-03 |
Similar Documents
| Publication | Publication Date | Title |
|---|---|---|
| US8130383B2 (en) | Optical signal analysis apparatus and optical signal analysis method | |
| JP5139885B2 (en) | Fluorescence analyzer and analysis method | |
| EP2721441B1 (en) | Cumulant microscopy | |
| US6703621B2 (en) | Method for the optical acquisition of characteristic sizes of an illuminated sample | |
| JP5265408B2 (en) | Correlation spectroscopy analysis method and correlation spectroscopy analyzer | |
| US20080225272A1 (en) | Fluorescence spectroscopy apparatus | |
| Wiseman | Image correlation spectroscopy: mapping correlations in space, time, and reciprocal space | |
| US20030016882A1 (en) | Method and apparatus for correcting crosstalk and spatial resolution for multichannel imaging | |
| Wiseman | Image correlation spectroscopy: principles and applications | |
| US11074727B2 (en) | Microparticle analyzing apparatus and data displaying method | |
| US20200132976A1 (en) | Luminescence imaging apparatus and methods | |
| JP3984132B2 (en) | Fluorescence spectrometer | |
| CN103189737B (en) | Image analysis method and image analysis apparatus | |
| EP1300660B1 (en) | Photon correlator | |
| Colyer et al. | Ultra high-throughput single molecule spectroscopy with a 1024 pixel SPAD | |
| JP4615941B2 (en) | Optical signal analysis method | |
| JP4830087B2 (en) | Optical signal analyzer | |
| CN102621111B (en) | For method and the device of scanning microscopy imaging sample | |
| Xu et al. | Single-photon single-particle tracking | |
| Aik et al. | Fluorescence Correlation Spectroscopy in Space and Time | |
| US6813569B2 (en) | Assembly and method for a correlator structure | |
| EP4707895A1 (en) | Image scanning microscope and method | |
| EP4528250A1 (en) | Biological sample analysis system, information processing device, information processing method, and biological sample analysis method | |
| Skakun et al. | Initial guesses generation for fluorescence intensity distribution analysis | |
| JPH07120391A (en) | Spectrofluorometer and quantitative measurement method |
Legal Events
| Date | Code | Title | Description |
|---|---|---|---|
| PUAI | Public reference made under article 153(3) epc to a published international application that has entered the european phase |
Free format text: ORIGINAL CODE: 0009012 |
|
| 17P | Request for examination filed |
Effective date: 20080327 |
|
| AK | Designated contracting states |
Kind code of ref document: A1 Designated state(s): AT DE DK FR GB SE |
|
| RBV | Designated contracting states (corrected) |
Designated state(s): AT DE DK FR GB SE |
|
| STAA | Information on the status of an ep patent application or granted ep patent |
Free format text: STATUS: THE APPLICATION HAS BEEN WITHDRAWN |
|
| 18W | Application withdrawn |
Effective date: 20090714 |