EP1927081B1 - Data handling and analysis in computed tomography with multiple energy windows - Google Patents
Data handling and analysis in computed tomography with multiple energy windows Download PDFInfo
- Publication number
- EP1927081B1 EP1927081B1 EP06795703.5A EP06795703A EP1927081B1 EP 1927081 B1 EP1927081 B1 EP 1927081B1 EP 06795703 A EP06795703 A EP 06795703A EP 1927081 B1 EP1927081 B1 EP 1927081B1
- Authority
- EP
- European Patent Office
- Prior art keywords
- attenuation
- locations
- volume space
- radiation
- data
- Prior art date
- Legal status (The legal status is an assumption and is not a legal conclusion. Google has not performed a legal analysis and makes no representation as to the accuracy of the status listed.)
- Not-in-force
Links
Images


Classifications
-
- A—HUMAN NECESSITIES
- A61—MEDICAL OR VETERINARY SCIENCE; HYGIENE
- A61B—DIAGNOSIS; SURGERY; IDENTIFICATION
- A61B6/00—Apparatus or devices for radiation diagnosis; Apparatus or devices for radiation diagnosis combined with radiation therapy equipment
- A61B6/48—Diagnostic techniques
- A61B6/482—Diagnostic techniques involving multiple energy imaging
-
- A—HUMAN NECESSITIES
- A61—MEDICAL OR VETERINARY SCIENCE; HYGIENE
- A61B—DIAGNOSIS; SURGERY; IDENTIFICATION
- A61B6/00—Apparatus or devices for radiation diagnosis; Apparatus or devices for radiation diagnosis combined with radiation therapy equipment
- A61B6/02—Arrangements for diagnosis sequentially in different planes; Stereoscopic radiation diagnosis
- A61B6/03—Computed tomography [CT]
- A61B6/032—Transmission computed tomography [CT]
-
- A—HUMAN NECESSITIES
- A61—MEDICAL OR VETERINARY SCIENCE; HYGIENE
- A61B—DIAGNOSIS; SURGERY; IDENTIFICATION
- A61B6/00—Apparatus or devices for radiation diagnosis; Apparatus or devices for radiation diagnosis combined with radiation therapy equipment
- A61B6/52—Devices using data or image processing specially adapted for radiation diagnosis
- A61B6/5211—Devices using data or image processing specially adapted for radiation diagnosis involving processing of medical diagnostic data
- A61B6/5217—Devices using data or image processing specially adapted for radiation diagnosis involving processing of medical diagnostic data extracting a diagnostic or physiological parameter from medical diagnostic data
-
- A—HUMAN NECESSITIES
- A61—MEDICAL OR VETERINARY SCIENCE; HYGIENE
- A61B—DIAGNOSIS; SURGERY; IDENTIFICATION
- A61B6/00—Apparatus or devices for radiation diagnosis; Apparatus or devices for radiation diagnosis combined with radiation therapy equipment
- A61B6/58—Testing, adjusting or calibrating thereof
- A61B6/582—Calibration
- A61B6/583—Calibration using calibration phantoms
-
- G—PHYSICS
- G06—COMPUTING OR CALCULATING; COUNTING
- G06T—IMAGE DATA PROCESSING OR GENERATION, IN GENERAL
- G06T12/00—Tomographic reconstruction from projections
- G06T12/30—Image post-processing, e.g. metal artefact correction
-
- A—HUMAN NECESSITIES
- A61—MEDICAL OR VETERINARY SCIENCE; HYGIENE
- A61B—DIAGNOSIS; SURGERY; IDENTIFICATION
- A61B6/00—Apparatus or devices for radiation diagnosis; Apparatus or devices for radiation diagnosis combined with radiation therapy equipment
- A61B6/42—Arrangements for detecting radiation specially adapted for radiation diagnosis
- A61B6/4208—Arrangements for detecting radiation specially adapted for radiation diagnosis characterised by using a particular type of detector
- A61B6/4241—Arrangements for detecting radiation specially adapted for radiation diagnosis characterised by using a particular type of detector using energy resolving detectors, e.g. photon counting
-
- A—HUMAN NECESSITIES
- A61—MEDICAL OR VETERINARY SCIENCE; HYGIENE
- A61B—DIAGNOSIS; SURGERY; IDENTIFICATION
- A61B6/00—Apparatus or devices for radiation diagnosis; Apparatus or devices for radiation diagnosis combined with radiation therapy equipment
- A61B6/48—Diagnostic techniques
- A61B6/481—Diagnostic techniques involving the use of contrast agents
-
- A—HUMAN NECESSITIES
- A61—MEDICAL OR VETERINARY SCIENCE; HYGIENE
- A61B—DIAGNOSIS; SURGERY; IDENTIFICATION
- A61B6/00—Apparatus or devices for radiation diagnosis; Apparatus or devices for radiation diagnosis combined with radiation therapy equipment
- A61B6/52—Devices using data or image processing specially adapted for radiation diagnosis
- A61B6/5205—Devices using data or image processing specially adapted for radiation diagnosis involving processing of raw data to produce diagnostic data
-
- G—PHYSICS
- G06—COMPUTING OR CALCULATING; COUNTING
- G06T—IMAGE DATA PROCESSING OR GENERATION, IN GENERAL
- G06T2211/00—Image generation
- G06T2211/40—Computed tomography
- G06T2211/408—Dual energy
Definitions
- the present invention relates to the analysis of data generated by x-ray computed tomography (CT) and other systems which provide spectral information, and more particularly to determining the material composition of an object examined using such a system. It finds particular application in medical imaging, and also has application in nondestructive testing and analysis, security applications, and other applications where material decomposition abilities are useful.
- CT computed tomography
- US 2005/084069 A1 discloses a method for analyzing materials in an object, wherein x-ray projection data of the object are acquired at high energy and at low energy for a plurality of views.
- the acquired x-ray projection data are utilized in a material decomposition process to determine material densities at each pixel for two selected basis materials.
- a composition of the object at each pixel is determined by utilizing a mapping of material densities for the two selected basis materials, wherein finally an image indicative of the composition of the object is displayed by utilizing the determined composition.
- WO 2005/076222 A1 discloses a method of artifact correction in a data set, wherein the data set is acquired by means of a polychromatic source of electromagnetic radiation generating a polychromatic beam and by means of a radiation detector detecting the polychromatic beam.
- the method comprises the steps of identifying a first material in the data set, wherein the first material is a material which causes artifacts in the data set, generating correction image data, wherein the correction image data is data which results from the first material, and one of subtracting and adding the correction image data from an original image, resulting in a corrected image.
- Computed tomography (CT) scanners generate images indicative of the x-ray attenuation of an object under examination.
- the x-ray tubes employed in CT scanners typically produce x-rays having a single, relatively wide energy spectrum.
- the detectors employed in such systems typically provide limited, if any, information about the energy spectrum of the detected radiation. While these scanners provide valuable information about the internal structure of an object under examination, they have limited ability to provide information about the material composition of the object, especially where different compounds have similar radiation attenuations.
- the ability to determine the material composition of an object under examination can have various applications.
- these include the analysis and classification of coronary artery calcification and soft plaque, the analysis and segmentation of neck and head arteries (differentiating between bone and vessel), analyzing and segmenting peripheral artery disease, general enhancement of the contrast between an iodine filled lumen and the vessel wall, quantification in perfusion studies, multi-tissue differentiation and analysis in virtually all body parts, and imaging of small amounts of heavy materials as molecular functional imaging tracers.
- One technique for obtaining data having multiple energy channels or windows is to switch the x-ray tube voltage between multiple values (e.g. 140kv and 80kv) in successive frames. Another technique is to provide a radiation filter after the x-ray tube, where the filter is alternated between successive frames. Another technique uses multi-energy detectors; still another uses photon counting detectors. See US Published Patent Application No. 20040022359 entitled Method, System and Computer Product for Plaque Characterization, Acharya, et al.; US Published Patent Application No. 20040136491 entitled Methods and Systems for Detecting Components of Plaque, Iatrou, et al.
- the first strategy has usually been based on decomposition into two base materials (e.g. soft tissue and bone).
- base materials e.g. soft tissue and bone.
- scanning with two energy windows is sufficient to express all materials as linear combinations of two known selected materials.
- the analysis of data at the pre-reconstruction stage is more complicated and is not necessarily robust if many different materials appear in the scanned object.
- the theoretical model usually used in this analysis is not accurate if material in the scanned object has an absorption edge in or near the relevant energy windows (such as Iodine, with a K-edge at about 33 kev).
- the post-processing strategy usually involves a third image created by subtracting the images generated from the two energy windows. This difference image has been used to create some enhancement or material decomposition equivalent, for example by using additional special calibrations. See US Published Patent Application No. 20040022359 entitled Method, System and Computer Product for Plaque Characterization, Acharya, et al.; US Published Patent Application No. 20040136491 entitled Methods and Systems for Detecting Components of Plaque, Iatrou, et al.
- a method includes receiving first and second computed tomography scan data and generating first and second data being volumetric computed tomography data indicative of radiation attenuations for each of a plurality of locations in a volume space at respective first and second energy spectra by a reconstructor.
- the method further includes receiving, for each of the plurality of locations in the volume space, the first and second data and a) performing a first polychromatic correction based on the radiation attenuations of the plurality of locations in the volume space at the first energy spectrum by a polychromatic corrector, wherein the polychromatic correction generates first corrected radiation attenuations of the plurality of locations in the volume space at the first energy spectrum, wherein the step of performing a first polychromatic correction includes generating and using a first attenuation map, and b) performing a second polychromatic correction based on the radiation attenuations of the plurality of locations in the volume space at the second energy spectrum by the polychromatic corrector, wherein the polychromatic correction generates second corrected radiation attenuations of the plurality of locations in the volume space at the second energy spectrum, wherein the step of performing a second polychromatic correction includes generating und using a second attenuation map.
- the method also includes determining a material composition of each of the plurality of locations in the volume space as a function of its location in an attenuation space defined by the corrected radiation attenuation at the first energy spectrum and the corrected radiation attenuation at the second energy spectrum by a material classifier, and generating an image of the volume space indicative of the material composition at the plurality of locations in the volume space by an image processor.
- the step of determining includes classifying the location as containing one of at least first and second materials.
- one of the materials is a mixture of materials, or an indeterminate material.
- the method may also include classifying the location as containing one of at least bone and contrast material.
- the radiation attenuation ⁇ is a composite of the radiation attenuation at the first energy spectrum and the radiation attenuation at the second energy spectrum.
- the step of generating includes generating an image which includes the radiation attenuation of a plurality of locations in the volume space with the material composition superimposed thereon.
- the method includes receiving computed tomography scan data indicative of the radiation attenuation along a plurality of projections through an object at the first energy spectrum, receiving computed tomography scan data indicative of the radiation attenuation along a plurality of projections through the object at the second energy spectrum, reconstructing the scan data from the first energy to generate data indicative of the radiation attenuation of the object at a plurality of locations in the volume space at the first energy spectrum, and reconstructing the scan data from the second energy to generate data indicative of the radiation attenuation of the object at a plurality of locations in the volume space at the second energy spectrum.
- the first and second energy spectra overlap.
- the step of classifying a plurality of locations in the computed tomography image space includes classifying each location in the image space as a function of its location in an n-dimensional attenuation space.
- the method includes generating an image which includes the radiation attenuation with the results of the classification superimposed thereon.
- ⁇ 1 is an attenuation based on a count of detected photons and ⁇ 2 is an attenuation based on an integral of the energies of detected photons.
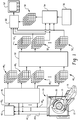
- a computed tomography (CT) scanner 10 provides CT data 40 1 , 40 2 ... 40 n for each of a plurality of energy spectra E1, E2 ... En.
- An exemplary scanner 10 includes a rotating gantry 18 which rotates about an examination region 14.
- the gantry 18 supports an x-ray source 12 such as an x-ray tube.
- the gantry 18 also supports an x-ray sensitive detector 20 which subtends an angular arc on the opposite side of the examination region 14.
- X-rays produced by the x-ray source 12 traverse the examination region 14 and are detected by the detector 20. Accordingly, the scanner 10 generates scan data indicative of the radiation attenuation along a plurality of projections through an object disposed in the examination region.
- a support 16 such as a couch supports a patient or other object in the examination region 14.
- the patient support 16 is preferably movable in the z-direction.
- movement of the support 16 and the gantry 18 are coordinated along with such that the x-ray source 12 and the detectors 20 traverse a generally helical path with respect to the patient.
- the detector 20 includes two or more rows of detectors extending in the z-direction.
- the x-ray source 12 generates a generally fan, wedge, or cone shaped radiation beam.
- a so-called fourth generation scanner configuration in which the detector 20 spans an arc of 360 degrees and remains stationary while the x-ray source 12 rotates, may also be implemented.
- the detector 20 includes a multiple layer detector such as the detector disclosed in Improved Detector Array for Spectral CT, Levene et al., U.S. Application Serial No. 60/674,905 filed April 26, 2005 , the contents of which are expressly incorporated by reference herein.
- the detector 20 provides scan data for each of two energy spectra E 1 , E 2 . Assuming an x-ray tube voltage of 140 kv, the two energy spectra would be roughly centered at 70 kev and 90 kev.
- the configuration of the CT scanner 10 of a particular situation may be influenced by and ultimately selected as a result of, a number of factors.
- an energy combiner 42 receives the CT scan data 40 1 , 40 2 ... 40 n and generates composite CT data 40 c analogous to the data acquired in conventional CT scan.
- the energy combiner 42 preferably combines the detector output signals prior to the log operation to generate a combined output signal.
- S 1 and S 2 are the signals at each energy
- S 01 and S 02 are the signals as they are measured in air
- k is a constant for each detector pixel. Operation of the energy combiner, and particularly the determination of the constant k, is further described below.
- the energy combiner 42 may also be omitted, for example where the spectral information is obtained by varying the voltage of the x-ray source or where, a composite CT data 40c is not needed.
- a reconstructor 46 receives the CT scan data 40 1 , 40 2 ... 40 n and the composite CT scan data 40 c and generates volumetric data 48 1 , 48 2 ... 48 n indicative of the attenuation or radiodensity of the object under examination at each energy spectrum E 1 , E 2 ... E n as well as composite volumetric data 48 c based on the composite data 40 c . While the reconstructor 46 is depicted as a single reconstructor 46, the reconstructor 46 may include multiple reconstruction units such that the data 40 1 , 40 2 ... 40 n are each reconstructed in parallel.
- Exemplary reconstruction techniques include filtered backprojection and iterative techniques. Depending on the geometry of the detectors, the reconstruction may be based on two dimensional or volume based techniques. Suitable calibrations and corrections, such as a pre-processing polychromatic correction to correct the attenuation of water, are also applied. Similarly, iterative bone correction may also be employed to correct for beam-hardening in the presence of bones. In any case, various reconstruction techniques and systems are known in the art and the choice of technique for a particular system and application is influenced by a number of factors known to those skilled in the art.
- the volumetric data 48 1 , 48 2 ... 48 n and 48 c provides information in an image or volume space. More particularly, the volumetric data 48 1 , 48 2 ... 48 n and the composite volumetric data 48 c can each be modeled as containing a plurality of voxels or pixels, each having a coordinate x, y, z in the volume space. The volumetric data may also provide information on only a single image slice, in which case the volume space may be modeled as a two dimensional space.
- the radiation attenuation at a given energy spectrum and location in volume space can be expressed as: ⁇ n x , y , z where ⁇ is the attenuation, n is the energy spectrum E, and x,y,z is the location. In CT, radiation attenuation is typically expressed in Hounsfield units (HU).
- a polychromatic corrector 50 applies a polychromatic correction to the volumetric data 48 1 , 48 2 ... 48 n to generate corrected volumetric data 52 1 , 52 2 ... 52 n .
- the polychromatic correction is further described below.
- a material classifier 54 receives the corrected volumetric data 52 1 , 52 2 ... 52 n and generates classified volume data 58.
- the material classification function is further described below.
- An image processor 60 processes the composite volume data 48 c and the classified volume data 58 for presentation in human readable form on an output device 62 such as a monitor, display, or hardcopy output device. More particularly, the image processor 60 generates one or more images indicative of the material composition.
- the radiation attenuation is the composite attenuation ⁇ c.
- the radiation attenuation is the radiation attenuation at one of the other energies, or a combination thereof.
- the spectral information is obtained by varying the x-ray source voltage
- the radiation attenuation at the higher of the tube voltages may be used.
- the attenuation measured at the higher voltage provides a good indication of the radiation attenuation across a spectrum of energies.
- the color, opacity, or hue may be presented as a function of the confidence or probability that a particular location is a particular material.
- the color, opacity, or hue may be presented as a function of the material concentration. It may also be desirable to display only a single material or a subset of materials.
- the operator interface includes a slider or scroll bar which allows the user to adjust the opacity of the enhancement colors. Additional sliders allow the user to adjust the center and width of the HU window, respectively.
- each of the data 58, 48 1 , 48 2 ... 48 n and 48 c may be presented separately, or they may be displayed in various combinations. If a composite image is not available, the classified volume data 58 can be used to enhance the attenuation data from one of the other energy ranges 48 1 , 48 2 ... 48 n . As described below in connection with polychromatic correction, it is generally preferable to display the uncorrected data 48. However, the corrected data 52 may also be displayed.
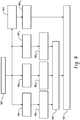
- an object to be imaged is scanned at 902 to generate CT scan data for each of a plurality n of energy spectra.
- the CT scan data from the various energies is combined to generate composite CT data.
- the CT scan data for each energy and the composite data are reconstructed to generate volume space attenuation data for each energy.
- polychromatic correction is applied to the volume space attenuation data to create corrected volume space attenuation data for each energy.
- the material composition of each of the locations in the volume space is determined.
- an image including the material composition and the composite volume space data is generated and displayed.
- the generation of the material classification function 56 will now be described in greater detail in connection with a scanner 10 which generates CT data 40 1 , 40 2 for each of two energy spectra.
- the material classification function 56 may be determined once as an initial characterization of a particular configuration or family of scanners. In fact, information obtained while evaluating the material classification function may be used during the design process to optimize the design of the scanner 10, for example as an aid to selecting suitable detector materials or configurations, x-ray source energies, filters, or other techniques for obtaining both spectral or non-spectral data. If desired, the classification function 56 may also be determined or adjusted as a step during the production of a particular scanner or group of scanners.
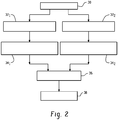
- a known phantom 400 is scanned at 30.
- a phantom 400 particularly well suited to classifying bone and contrast material is a 20cm water cylinder containing ten 8mm sample cylinders 402, 404, 406, 408, 410, 412, 414, 416, 418, 420.
- the sample cylinders 402, 404, 406, 408, 410 each contain a different iodine concentration, ranging from the highest at 402 to the lowest at 410.
- the sample cylinders 412, 414, 416, 418, 420 each contain a different calcium concentration, ranging from the highest at 412 to the lowest at 420.
- concentrations in cylinders 404, 406, 414, and 416 are advantageously selected to be representative of concentrations typically encountered during scanning of the coronary arteries.
- concentrations, numbers of sample cylinders, and relative physical locations of the cylinders may be implemented.
- each location x,y,z in the corrected volumetric data 52 1 and 52 2 is, at step 36, mapped into an attenuation space 500 as a function of the respective attenuation values ⁇ 1 x,y,z and ⁇ 2 x,y,z .
- each material is located generally along a line 502, 504 in attenuation space 500.
- the different concentrations of the material appear on different locations along the corresponding material line 502, 504, resulting in what looks like "hands-of-a-watch" centered at the attenuation space coordinates of water 506.
- Figure 4 presents schematic results of a simulation (including noise) based on the multiple layer detector and phantom described above.
- iodine is located generally along the first line 502, whereas calcium is located generally along the second line 504.
- the material from cylinder 402 appears generally at location 508, the material from cylinder 404 appears generally at location 510, the material from cylinder 406 appears generally at location 512, and so on.
- the various cylinders containing calcium appear analogously at locations 520, 522, 524, 526, 528 along the calcium line 504. Pixels or voxels having partial volumes appear along the respective material lines 502, 504.
- the material classification function 56 is established at 38.
- an empirical examination of attenuation space 500 yields a material separation line 528 which defines a first material region on one side of the line 530 and a second material region on the other side of the line 532.
- a location x,y,z in image space 52 having attenuation space coordinates in the first region 530 is classified as iodine; a location having attenuation space 500 coordinates in the second region 532 is classified as calcium.
- the classification function 56 may return a value M x,y,z indicative not only of the material, but also its concentration and the confidence or probability that the classification is accurate. In the simulation of Figure 4 , for example, the distance from the separation line 528 provides a probability or confidence that the classification is accurate.
- volume space locations which map in the vicinity of the separation line 528 may be classified as indeterminate.
- Volume space locations which map to a region of relatively low concentrations or to a region relatively distant from a material line502, 504 may similarly be classified as indeterminate.
- the material classification function 56 may also be linear function which does not pass through the origin, or a curve or other non- linear function.
- the material classification may be implemented as a look up table where the attenuation values provide the coordinates into the table.
- the classification function may also be used to classify more than two materials.
- the attenuation space 500 may be modeled as an n-dimensional space, with the classification function 56 established as a function of the location in the n-dimensional space.
- the polychromatic corrector 50 corrects for beam hardening, which refers to a phenomenon in which relatively lower energies are preferentially attenuated as a polychromatic x-ray beam passes through an object. As the lower energy x-rays are attenuated, the beam becomes progressively harder or more penetrating.
- the degree of beam hardening is a function of the initial x-ray spectrum, the composition of the material or tissue traversed by the x-ray beam, and the thickness of the material traversed by the x-ray beam.
- a deleterious effect of beam hardening is that the location of a particular material in the attenuation space 500 is object dependent. Thus, the accuracy of the material classification function 56 can be improved if this object dependency can be reduced.
- the polychromatic correction 50 is applied following reconstruction of the CT data 40 into image space 48 but before the material classification.
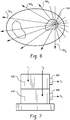
- an attenuation map is created, at steps 602 1 , 602 2 , for each energy spectrum E.
- the attenuation sum along each of plurality p of projections 702 1 , 702 2 , 702 2 ... 702 p which pass through the location is calculated.
- the projections are in turn summed to create an attenuation value An x,y,z for the location in volume space. The process is repeated for each location in volume space and for each energy.
- ⁇ nc x,y,z is the corrected attenuation value
- F is an empirically derived constant that gives the average optimal correction for the relevant set of materials (e.g., iodine and calcium)
- ⁇ 0 is the attenuation of water.
- the empirical factor F can be derived from the resultant images of several different phantoms having different amounts of beam hardening effect. Of course, other correction functions can be used.
- the above equation does not change the attenuation of water.
- the corrected attenuation values do not represent the actual or true attenuation in volume space, but rather provide a correction for more accurately mapping the location into attenuation space 500, such that the classification regions will be preserved.
- Eq. 9 assumes that the field of view of the reconstructed data set encompasses the entire object. Where the reconstructed field of view is smaller than the object, another data set which encompasses the entire object is reconstructed.
- This image set can be reconstructed with a relatively lower resolution and matrix size, as the required attenuation map does not include high spatial frequencies.
- the attenuation map can be rescaled to fit the field of view of the original images.
- the correction of Eq. 9 is applied separately to each of the two volume spaces 48 1 and 48 2 .
- the factor F can be different for each volume space.
- I 1 and I 2 represent the x-ray photon numbers absorbed in the first 802 and second 804 layers, respectively.
- S 1 and S 2 represent the raw signals following optics and electronics.
- I E I 1 E + I 2 E
- I 0 E I 01 E + I 02 E
- I 01 and I 02 are the photon numbers for an air scan
- I 1 and I 2 are the photon numbers for the scan of an object
- I and I 0 are the total photon numbers as in standard CT.
- this measurement can be done only once and can be used for all double-layer systems with the same configuration.
- the present technique can also be used with semiconductor or other photon counting detectors.
- detectors can be used to count the number of detected photons and the energy of each photon up to some finite energy resolution.
- One option for using such detectors in CT is to use a dedicated hardware or channel which counts the number of detected photons without regard to energy.
- the energies of the detected photons are integrated or summed over a known time period.
- the resultant data streams can be separately reconstructed to provide first and second volumetric data sets.
- the first data set provides attenuation information based on the number of detected photons, while the second provides attenuation information based on the integral of the energies of the detected photons.
Landscapes
- Health & Medical Sciences (AREA)
- Life Sciences & Earth Sciences (AREA)
- Engineering & Computer Science (AREA)
- Medical Informatics (AREA)
- Physics & Mathematics (AREA)
- Surgery (AREA)
- Heart & Thoracic Surgery (AREA)
- Veterinary Medicine (AREA)
- Biophysics (AREA)
- High Energy & Nuclear Physics (AREA)
- Public Health (AREA)
- Nuclear Medicine, Radiotherapy & Molecular Imaging (AREA)
- Optics & Photonics (AREA)
- Pathology (AREA)
- Radiology & Medical Imaging (AREA)
- Biomedical Technology (AREA)
- General Health & Medical Sciences (AREA)
- Molecular Biology (AREA)
- Animal Behavior & Ethology (AREA)
- Theoretical Computer Science (AREA)
- General Physics & Mathematics (AREA)
- Pulmonology (AREA)
- Computer Vision & Pattern Recognition (AREA)
- Physiology (AREA)
- Apparatus For Radiation Diagnosis (AREA)
- Analysing Materials By The Use Of Radiation (AREA)
Description
- The present invention relates to the analysis of data generated by x-ray computed tomography (CT) and other systems which provide spectral information, and more particularly to determining the material composition of an object examined using such a system. It finds particular application in medical imaging, and also has application in nondestructive testing and analysis, security applications, and other applications where material decomposition abilities are useful.
- The article "Processing of interlaced images in 4 - 10 MeV dual energy customs system for material recognition" by S. Ogorodnikov et al., Physical Review Special Topics - Accelerators and Beams, The American Physical Society, volume 5, pages 104701-1 to 104701-11 (2002) discloses a method for radioscopically differentiating materials in the 1-10 MeV energy range, which singles out and identifies four basic groups of materials according to an atomic number. Atomic numbers are identified using high- and low-energy profiles obtained through the irradiation of materials on an alternate pulse-by-pulse basis. This is done by using a bremsstrahlung beam with 8 MeV / 4 MeV dual boundary energies and by using scintillating crystals coupled with silicon photodiodes as detecting elements. An image segmentation technique is then used to discern the distribution of an atomic number on any given image. A color visualization of integral absorption and a material's atomic composition is carried out according to an intensity hue saturation colorization scheme.
-
US 2005/084069 A1 discloses a method for analyzing materials in an object, wherein x-ray projection data of the object are acquired at high energy and at low energy for a plurality of views. The acquired x-ray projection data are utilized in a material decomposition process to determine material densities at each pixel for two selected basis materials. A composition of the object at each pixel is determined by utilizing a mapping of material densities for the two selected basis materials, wherein finally an image indicative of the composition of the object is displayed by utilizing the determined composition. -
WO 2005/076222 A1 discloses a method of artifact correction in a data set, wherein the data set is acquired by means of a polychromatic source of electromagnetic radiation generating a polychromatic beam and by means of a radiation detector detecting the polychromatic beam. The method comprises the steps of identifying a first material in the data set, wherein the first material is a material which causes artifacts in the data set, generating correction image data, wherein the correction image data is data which results from the first material, and one of subtracting and adding the correction image data from an original image, resulting in a corrected image. - Computed tomography (CT) scanners generate images indicative of the x-ray attenuation of an object under examination. The x-ray tubes employed in CT scanners typically produce x-rays having a single, relatively wide energy spectrum. Similarly, the detectors employed in such systems typically provide limited, if any, information about the energy spectrum of the detected radiation. While these scanners provide valuable information about the internal structure of an object under examination, they have limited ability to provide information about the material composition of the object, especially where different compounds have similar radiation attenuations.
- The ability to determine the material composition of an object under examination can have various applications. In the medical field, these include the analysis and classification of coronary artery calcification and soft plaque, the analysis and segmentation of neck and head arteries (differentiating between bone and vessel), analyzing and segmenting peripheral artery disease, general enhancement of the contrast between an iodine filled lumen and the vessel wall, quantification in perfusion studies, multi-tissue differentiation and analysis in virtually all body parts, and imaging of small amounts of heavy materials as molecular functional imaging tracers.
- Because different compounds can change the attenuated radiation spectrum in different ways, dual-energy scanning has been suggested as a technique for improving material separation capabilities. The idea is to scan with two or more different x-ray spectra or to acquire data using detectors which provide spectral information. See Evaluation of a Prototype Dual-Energy Computed Tomographic Apparatus, I. Phantom Studies, by W.A. Kalender, et al., Phys. 13 (3), pp. 334-339 (1986); Evaluation of a Prototype Dual-Energy Computed Tomographic Apparatus, II. Determination of vertebral bone mineral content, by J.R. Vetter, et al., Phys. 13 (3), pp 340-343 (1986); Technology and image results of a spectral CT system, B.J. Heismann, et al., SPIE proceedings Vol. 5368 (May, 2004), pp. 52-59; and Dual Kvp Material Decomposition Using Flat-Panel Detectors, D. Walter, et al., SPIE proceedings Vol. 5368 (May, 2004), pp. 29-39.
- One technique for obtaining data having multiple energy channels or windows is to switch the x-ray tube voltage between multiple values (e.g. 140kv and 80kv) in successive frames. Another technique is to provide a radiation filter after the x-ray tube, where the filter is alternated between successive frames. Another technique uses multi-energy detectors; still another uses photon counting detectors. See
US Published Patent Application No. 20040022359 entitled Method, System and Computer Product for Plaque Characterization,Acharya, et al.; US Published Patent Application No. 20040136491 entitled Methods and Systems for Detecting Components of Plaque, Iatrou, et al. - One strategy for processing dual energy CT data has been to perform material decomposition on the projection measurements before the reconstruction step. A second has been to perform post-processing manipulations on the images reconstructed from each of the energy windows. See Energy-selective Reconstruction in X-ray Computerized Tomography by R.E. Alvarez and A. Macovski, Phys. Med. Biol. 21, 733 (1976).
- The first strategy has usually been based on decomposition into two base materials (e.g. soft tissue and bone). In theory, it can be shown that scanning with two energy windows is sufficient to express all materials as linear combinations of two known selected materials. However, the analysis of data at the pre-reconstruction stage is more complicated and is not necessarily robust if many different materials appear in the scanned object. Moreover, the theoretical model usually used in this analysis is not accurate if material in the scanned object has an absorption edge in or near the relevant energy windows (such as Iodine, with a K-edge at about 33 kev).
- The post-processing strategy usually involves a third image created by subtracting the images generated from the two energy windows. This difference image has been used to create some enhancement or material decomposition equivalent, for example by using additional special calibrations. See
US Published Patent Application No. 20040022359 entitled Method, System and Computer Product for Plaque Characterization, Acharya, et al.;US Published Patent Application No. 20040136491 entitled Methods and Systems for Detecting Components of Plaque, Iatrou, et al. - While the post-processing technique is usually simpler and more robust then the pre-processing analysis, it may be more sensitive to beam-hardening effect. In addition, the subtraction of the images of the two energy windows does not necessary give the optimal solution.
- Aspects of the present invention address these matters, and others.
- According to one aspect of the invention, a method includes receiving first and second computed tomography scan data and generating first and second data being volumetric computed tomography data indicative of radiation attenuations for each of a plurality of locations in a volume space at respective first and second energy spectra by a reconstructor. The method further includes receiving, for each of the plurality of locations in the volume space, the first and second data and a) performing a first polychromatic correction based on the radiation attenuations of the plurality of locations in the volume space at the first energy spectrum by a polychromatic corrector, wherein the polychromatic correction generates first corrected radiation attenuations of the plurality of locations in the volume space at the first energy spectrum, wherein the step of performing a first polychromatic correction includes generating and using a first attenuation map, and b) performing a second polychromatic correction based on the radiation attenuations of the plurality of locations in the volume space at the second energy spectrum by the polychromatic corrector, wherein the polychromatic correction generates second corrected radiation attenuations of the plurality of locations in the volume space at the second energy spectrum, wherein the step of performing a second polychromatic correction includes generating und using a second attenuation map. The method also includes determining a material composition of each of the plurality of locations in the volume space as a function of its location in an attenuation space defined by the corrected radiation attenuation at the first energy spectrum and the corrected radiation attenuation at the second energy spectrum by a material classifier, and generating an image of the volume space indicative of the material composition at the plurality of locations in the volume space by an image processor.
- According to a limited aspect of the invention, the step of determining includes classifying the location as containing one of at least first and second materials.
- According to a more limited aspect of the invention, one of the materials is a mixture of materials, or an indeterminate material. The method may also include classifying the location as containing one of at least bone and contrast material.
- According to a limited aspect of the invention, the step of generating an image includes generating image data for a plurality of locations in the volume space according to the function Pl = f(µl ,Ml ) where the P is the image data, µ is a radiation attenuation, M is the material composition, and 1 is the location in the volume space.
- According to a more limited aspect of the invention, the radiation attenuation µ is a composite of the radiation attenuation at the first energy spectrum and the radiation attenuation at the second energy spectrum.
- According to a limited aspect of the invention, the step of generating includes generating an image which includes the radiation attenuation of a plurality of locations in the volume space with the material composition superimposed thereon.
- According to an exemplary technique to reconstruct data indicative of radiation attenuation, the method includes receiving computed tomography scan data indicative of the radiation attenuation along a plurality of projections through an object at the first energy spectrum, receiving computed tomography scan data indicative of the radiation attenuation along a plurality of projections through the object at the second energy spectrum, reconstructing the scan data from the first energy to generate data indicative of the radiation attenuation of the object at a plurality of locations in the volume space at the first energy spectrum, and reconstructing the scan data from the second energy to generate data indicative of the radiation attenuation of the object at a plurality of locations in the volume space at the second energy spectrum.
- According to another limited aspect of the invention, the step of determining includes determining the material composition according to the function Ml = f(µ1 l , µ2 l ), where M is the material composition, µ1 is the radiation attenuation at the first energy spectrum, µ2 is the radiation attenuation at the second energy spectrum, and l is the location in the volume space.
- According to still another limited aspect of the invention, the first and second energy spectra overlap.
- According to another aspect of the invention, the step of determining a material composition includes classifying a plurality of locations in a computed tomography image space being the volume space, according to a material classification function Ml = f(µ1 l ,µ2 l...µnl ), where M is a material, n is the number of energy spectra, µn is a radiation attenuation at energy spectrum n, and l is a location in the image space; wherein the method further comprises the step of presenting the generated image for presenting a result of the classification in human readable form. N is greater than or equal to 2.
- According to a limited aspect of the invention, the step of classifying a plurality of locations in the computed tomography image space includes classifying each location in the image space as a function of its location in an n-dimensional attenuation space.
- According to another limited aspect of the invention, presenting a result of the classification includes generating image data for the plurality of locations according to the function Pl = f(µl,Ml ), where the P is the image data, µ is a radiation attenuation and M is the material.
- According to a more limited aspect of the invention, the method includes generating an image which includes the radiation attenuation with the results of the classification superimposed thereon.
- According to yet another limited aspect of the invention, µ1 is an attenuation based on a count of detected photons and µ2 is an attenuation based on an integral of the energies of detected photons.
- Still other aspects of the present invention will be appreciated by those skilled in the art upon reading the appended description.
-
Figure 1 depicts a computed tomography scanner and data processing. -
Figure 2 describes steps in establishing a material classification function. -
Figure 3 is an end view of a generally cylindrical phantom. -
Figure 4 depicts a two dimensional attenuation space. -
Figure 5 depicts steps in performing a post-processing polychromatic correction. -
Figure 6 depicts projections in a volume space. -
Figure 7 depicts a dual layer CT detector. -
Figure 8 depicts steps in determining a material classification. - With reference to
Figure 1 , a computed tomography (CT)scanner 10 providesCT data - An
exemplary scanner 10 includes arotating gantry 18 which rotates about anexamination region 14. Thegantry 18 supports anx-ray source 12 such as an x-ray tube. Thegantry 18 also supports an x-raysensitive detector 20 which subtends an angular arc on the opposite side of theexamination region 14. X-rays produced by thex-ray source 12 traverse theexamination region 14 and are detected by thedetector 20. Accordingly, thescanner 10 generates scan data indicative of the radiation attenuation along a plurality of projections through an object disposed in the examination region. - A
support 16 such as a couch supports a patient or other object in theexamination region 14. Thepatient support 16 is preferably movable in the z-direction. In a helical scan, movement of thesupport 16 and thegantry 18 are coordinated along with such that thex-ray source 12 and thedetectors 20 traverse a generally helical path with respect to the patient. - In the case of a multi-slice scanner, the
detector 20 includes two or more rows of detectors extending in the z-direction. Depending on the configuration of thescanner 10 and thedetectors 20, thex-ray source 12 generates a generally fan, wedge, or cone shaped radiation beam. Moreover, a so-called fourth generation scanner configuration, in which thedetector 20 spans an arc of 360 degrees and remains stationary while thex-ray source 12 rotates, may also be implemented. - In one embodiment, the
detector 20 includes a multiple layer detector such as the detector disclosed in Improved Detector Array for Spectral CT,Levene et al., U.S. Application Serial No. 60/674,905 filed April 26, 2005 detector 20 provides scan data for each of two energy spectra E1, E2. Assuming an x-ray tube voltage of 140 kv, the two energy spectra would be roughly centered at 70 kev and 90 kev. - While improved material separation is generally achieved by increasing the spacing between the energy spectra E1, E2 ... En, reducing the width of the spectra, and reducing the overlap therebetween, those skilled in the art will recognize that these are not the only factors affecting overall system performance. Accordingly, the configuration of the
CT scanner 10 of a particular situation, as well as the choice of technique(s) used to obtain the spectral information, (e.g. varying the source voltage, filtering, multi-energy detectors, photon counting detectors, or the like) may be influenced by and ultimately selected as a result of, a number of factors. - With continuing reference to
Figure 1 , anenergy combiner 42 receives theCT scan data composite CT data 40c analogous to the data acquired in conventional CT scan. Theenergy combiner 42 preferably combines the detector output signals prior to the log operation to generate a combined output signal. In a two energy system, the combined normalized output signal is generated according to the relation:
- Alternatively, the signals may be summed:

- The
energy combiner 42 may also be omitted, for example where the spectral information is obtained by varying the voltage of the x-ray source or where, acomposite CT data 40c is not needed. - A
reconstructor 46 receives theCT scan data CT scan data 40c and generatesvolumetric data volumetric data 48c based on thecomposite data 40c. While thereconstructor 46 is depicted as asingle reconstructor 46, thereconstructor 46 may include multiple reconstruction units such that thedata - Exemplary reconstruction techniques include filtered backprojection and iterative techniques. Depending on the geometry of the detectors, the reconstruction may be based on two dimensional or volume based techniques. Suitable calibrations and corrections, such as a pre-processing polychromatic correction to correct the attenuation of water, are also applied. Similarly, iterative bone correction may also be employed to correct for beam-hardening in the presence of bones. In any case, various reconstruction techniques and systems are known in the art and the choice of technique for a particular system and application is influenced by a number of factors known to those skilled in the art.
- The
volumetric data volumetric data volumetric data 48c can each be modeled as containing a plurality of voxels or pixels, each having a coordinate x, y, z in the volume space. The volumetric data may also provide information on only a single image slice, in which case the volume space may be modeled as a two dimensional space. The radiation attenuation at a given energy spectrum and location in volume space can be expressed as:
- To correct for beam hardening, a
polychromatic corrector 50 applies a polychromatic correction to thevolumetric data volumetric data - A
material classifier 54 receives the correctedvolumetric data volume data 58. The classifier applies amaterial classification function 56 of the form:
material classification function 56 can be expressed as:
- An
image processor 60 processes thecomposite volume data 48c and theclassified volume data 58 for presentation in human readable form on anoutput device 62 such as a monitor, display, or hardcopy output device. More particularly, theimage processor 60 generates one or more images indicative of the material composition. Theimage processor 60 generates image data for a plurality of locations in the volume space according to the function:
- With one technique for presenting the data is to assign a different color to each of the materials and to present a combined image with the respective colors overlaid on a gray scale image of the
composite volume data 48c. Moreover, the color, opacity, or hue may be presented as a function of the confidence or probability that a particular location is a particular material. The color, opacity, or hue may be presented as a function of the material concentration. It may also be desirable to display only a single material or a subset of materials. - It may also be desirable to allow the user to vary the opacity of the enhancement colors on the grey-scale image, for example from completely transparent (0% opacity) to completely colored (100% opacity). The operator interface includes a slider or scroll bar which allows the user to adjust the opacity of the enhancement colors. Additional sliders allow the user to adjust the center and width of the HU window, respectively.
- In addition, each of the
data classified volume data 58 can be used to enhance the attenuation data from one of the other energy ranges 481, 482 ... 48n. As described below in connection with polychromatic correction, it is generally preferable to display theuncorrected data 48. However, the correcteddata 52 may also be displayed. - In operation according to one embodiment of the invention, and with reference to
Figure 8 , an object to be imaged is scanned at 902 to generate CT scan data for each of a plurality n of energy spectra. At 903, the CT scan data from the various energies is combined to generate composite CT data. At 904, the CT scan data for each energy and the composite data are reconstructed to generate volume space attenuation data for each energy. At 906, polychromatic correction is applied to the volume space attenuation data to create corrected volume space attenuation data for each energy. At 908, the material composition of each of the locations in the volume space is determined. At 910, an image including the material composition and the composite volume space data is generated and displayed. - The generation of the
material classification function 56 will now be described in greater detail in connection with ascanner 10 which generatesCT data material classification function 56 may be determined once as an initial characterization of a particular configuration or family of scanners. In fact, information obtained while evaluating the material classification function may be used during the design process to optimize the design of thescanner 10, for example as an aid to selecting suitable detector materials or configurations, x-ray source energies, filters, or other techniques for obtaining both spectral or non-spectral data. If desired, theclassification function 56 may also be determined or adjusted as a step during the production of a particular scanner or group of scanners. It may also be checked and updated from time to time over the life of thescanner 10, or even immediately preceding a particular imaging scan. As will be appreciated, and depending on the purposes for which theclassification function 56 is being determined, some or all of the process may be carried out on different computers or processors, or even on a different scanner. - With reference to
Figures 2 and3 , a knownphantom 400 is scanned at 30. Aphantom 400 particularly well suited to classifying bone and contrast material is a 20cm water cylinder containing ten8mm sample cylinders sample cylinders sample cylinders cylinders - Returning to
Figure 2 , at 321 and 322, thescan data 40 is reconstructed to generatevolumetric data volumetric data Figures 2 and4 , each location x,y,z in the correctedvolumetric data step 36, mapped into anattenuation space 500 as a function of the respective attenuation values µ1x,y,z and µ2x,y,z. If a location inimage space 52 has a first attenuation value µ1x,y,z = V1 and a second attenuation value µ2x,y,z = V2, then the count or value C of the corresponding location in the attenuation space is incremented:
attenuation space 500. - By scanning with a known phantom, the relationship between the selected materials and their location in
attenuation space 500 can be determined a priori for a particular scanner configuration. In the exemplary case of a dual energy system, each material is located generally along aline attenuation space 500. Where a material is in a water solution having different concentrations, the different concentrations of the material appear on different locations along the correspondingmaterial line water 506. -
Figure 4 presents schematic results of a simulation (including noise) based on the multiple layer detector and phantom described above. - As can be seen, iodine is located generally along the
first line 502, whereas calcium is located generally along thesecond line 504. The material fromcylinder 402 appears generally atlocation 508, the material fromcylinder 404 appears generally atlocation 510, the material fromcylinder 406 appears generally atlocation 512, and so on. The various cylinders containing calcium appear analogously atlocations calcium line 504. Pixels or voxels having partial volumes appear along therespective material lines - Returning now to
Figure 2 , thematerial classification function 56 is established at 38. With reference toFigure 4 , an empirical examination ofattenuation space 500 yields amaterial separation line 528 which defines a first material region on one side of theline 530 and a second material region on the other side of theline 532. A location x,y,z inimage space 52 having attenuation space coordinates in thefirst region 530 is classified as iodine; a location havingattenuation space 500 coordinates in thesecond region 532 is classified as calcium. - In a rectangular coordinate system, a simple classification function can be expressed as:

- Of course, other classification functions and schemes can be implemented. The
classification function 56 may return a value Mx,y,z indicative not only of the material, but also its concentration and the confidence or probability that the classification is accurate. In the simulation ofFigure 4 , for example, the distance from theseparation line 528 provides a probability or confidence that the classification is accurate. - It is not necessary for the classification to be binary. Thus, for example, it may be desirable to classify volume space locations which map in the vicinity of the
separation line 528 as containing a partial volume or being of an indeterminate material. Volume space locations which map to a region of relatively low concentrations or to a region relatively distant from a material line502, 504 may similarly be classified as indeterminate. - The
material classification function 56 may also be linear function which does not pass through the origin, or a curve or other non- linear function. In another example, the material classification may be implemented as a look up table where the attenuation values provide the coordinates into the table. - When characterized using a suitable phantom, the classification function may also be used to classify more than two materials. When used with a
scanner 10 which provides n energy windows or channels, theattenuation space 500 may be modeled as an n-dimensional space, with theclassification function 56 established as a function of the location in the n-dimensional space. - The operation of the
polychromatic corrector 50 will now be described in greater detail. Thepolychromatic corrector 50 corrects for beam hardening, which refers to a phenomenon in which relatively lower energies are preferentially attenuated as a polychromatic x-ray beam passes through an object. As the lower energy x-rays are attenuated, the beam becomes progressively harder or more penetrating. The degree of beam hardening is a function of the initial x-ray spectrum, the composition of the material or tissue traversed by the x-ray beam, and the thickness of the material traversed by the x-ray beam. - A deleterious effect of beam hardening is that the location of a particular material in the
attenuation space 500 is object dependent. Thus, the accuracy of thematerial classification function 56 can be improved if this object dependency can be reduced. - The
polychromatic correction 50 is applied following reconstruction of theCT data 40 intoimage space 48 but before the material classification. - With reference to
Figures 5 and6 , an attenuation map is created, atsteps Figure 6 for an arbitrary energy and location 704 in volume space, the attenuation sum along each of plurality p of projections 7021, 7022, 7022 ... 702p which pass through the location is calculated. The projections are in turn summed to create an attenuation value Anx,y,z for the location in volume space. The process is repeated for each location in volume space and for each energy. - At 6041, 6042, the respective attenuation maps are used to generate the corrected
volumetric data 
- Note that the above equation does not change the attenuation of water. Moreover, the corrected attenuation values do not represent the actual or true attenuation in volume space, but rather provide a correction for more accurately mapping the location into
attenuation space 500, such that the classification regions will be preserved. - In addition, Eq. 9 assumes that the field of view of the reconstructed data set encompasses the entire object. Where the reconstructed field of view is smaller than the object, another data set which encompasses the entire object is reconstructed. This image set can be reconstructed with a relatively lower resolution and matrix size, as the required attenuation map does not include high spatial frequencies. Once the attenuation map has been created from the low resolution images, the attenuation map can be rescaled to fit the field of view of the original images.
- The correction of Eq. 9 is applied separately to each of the two
volume spaces - The operation of the
energy combiner 42 will now be described in greater detail in connection with a CT detector element having twoscintillator layers corresponding photodetectors Figure 7 . I1 and I2 represent the x-ray photon numbers absorbed in the first 802 and second 804 layers, respectively. S1 and S2 represent the raw signals following optics and electronics. - In standard CT the energy dependent equation for the x-ray attenuation is:

- Practically, in a standard CT the energy-independent attenuation line integral is calculated by the approximation:

- For the double layer-configuration:


- The signals are related to the photon numbers by:


- The attenuation line integral can be calculated by:

- Suppose we can directly measure the relation:

The relation between the conversion factors becomes:

- To measure the calibration parameter in air, the relation:


- In principle, this measurement can be done only once and can be used for all double-layer systems with the same configuration.
- As noted above, the present technique can also be used with semiconductor or other photon counting detectors. Such detectors can be used to count the number of detected photons and the energy of each photon up to some finite energy resolution. One option for using such detectors in CT is to use a dedicated hardware or channel which counts the number of detected photons without regard to energy. In parallel, the energies of the detected photons are integrated or summed over a known time period. The resultant data streams can be separately reconstructed to provide first and second volumetric data sets. The first data set provides attenuation information based on the number of detected photons, while the second provides attenuation information based on the integral of the energies of the detected photons. These data sets can be used to perform material classification as described above.
- The various functions and operations described herein are preferably implemented by way of one or more suitable computers or processors and instructions stored in computer readable memory. When executed, these instructions cause the computer or processor(s) to carry out the described functions.
Claims (19)
- A method comprising:receiving (9041, 9042) first and second computed tomography scan data (401, 402) and generating first and second data (481, 482) being volumetric computed tomography data indicative of radiation attenuations (µ1, µ2) for each of a plurality of locations in a volume space at respective first and second energy spectra by a reconstructor (46);receiving, for each of the plurality of locations in the volume space, the first and second data and a) performing (9061) a first polychromatic correction based on the radiation attenuations (µ1) of the plurality of locations in the volume space at the first energy spectrum by a polychromatic corrector (50), wherein the polychromatic correction generates first corrected radiation attenuations of the plurality of locations in the volume space at the first energy spectrum (521), wherein the step of performing a first polychromatic correction includes generating and using a first attenuation map, and b) performing (9062) a second polychromatic correction based on the radiation attenuations (µ2) of the plurality of locations in the volume space at the second energy spectrum by the polychromatic corrector (50), wherein the polychromatic correction generates second corrected radiation attenuations of the plurality of locations in the volume space at the second energy spectrum (522), wherein the step of performing a second polychromatic correction includes generating und using a second attenuation map;determining (908) a material composition of each of the plurality of locations in the volume space as a function of its location in an attenuation space (500) defined by the corrected radiation attenuation at the first energy spectrum and the corrected radiation attenuation at the second energy spectrum by a material classifier (54);generating (910) an image (58) of the volume space indicative of the material composition at the plurality of locations in the volume space by an image processor (60).
- The method of claim 1 wherein the step of determining includes classifying the location as containing one of at least first and second materials.
- The method of claim 2 wherein the second material is a mixture of materials.
- The method of claim 2 wherein the second material is an indeterminate material.
- The method of claim 4 wherein the method includes classifying the location as containing one of at least bone and contrast material.
- The method of claim 1 wherein the step of generating an image includes generating image data for a plurality of locations in the volume space according to the function Pl = f(µl,Ml ) where the P is the image data, µ is a radiation attenuation, M is the material composition, and l is the location in the volume space.
- The method of claim 6 wherein the radiation attenuation µ is a composite of the radiation attenuation at the first energy spectrum and the radiation attenuation at the second energy spectrum.
- The method of claim 1 wherein the step of generating includes generating an image which includes the radiation attenuation of a plurality of locations in the volume space with the material composition superimposed thereon.
- The method of claim 1 wherein the step of determining includes determining the material composition according to the function Ml = f(µ1 l , µ2 l ), where M is the material composition, µ1 is the radiation attenuation at the first energy spectrum , µ2 is the radiation attenuation at the second energy spectrum, and l is the location in the volume space.
- The method of claim 1 wherein the first and second energy spectra overlap.
- The method of claim 1, wherein the step of determining a material composition includes classifying a plurality of locations in a computed tomography image space (481, 482, 483 ... 48n) being the volume space, according to a material classification function Ml = f(µ1 l,µ2 l...,µnl ), where M is a material, n is the number of energy spectra, µn is a radiation attenuation at energy spectrum n, and l is a location in the image space, and wherein n is greater than or equal to 2; wherein the method further comprises the step of
presenting the generated image for presenting a result of the classification in human readable form. - The method of claim 11 wherein the step of classifying a plurality of locations in the computed tomography image space includes classifying each location in the image space as a function of its location in an n-dimensional attenuation space (500).
- The method of claim 11 wherein n equals 2.
- The method of claim 11 wherein presenting a result of the classification includes generating image data for the plurality of locations according to the function Pl = f(µl ,Ml ), where the P is the image data and µ is a radiation attenuation.
- The method of claim 14 wherein the radiation attenuation is a composite of the radiation attenuation at a plurality of energy spectra.
- The method of claim 15 including generating an image which includes the radiation attenuation with the results of the classification superimposed thereon.
- The method of claim 11 wherein the classification function is a linear function.
- The method of claim 11 where µ1 is an attenuation based on a count of detected photons and µ2 is an attenuation based on an integral of the energies of detected photons.
- An apparatus comprising:a reconstructor (46) for receiving first and second CT scan data (401, 402) and for generating first and second data (481, 482) being volumetric computed tomography data indicative of radiation attenuations (µ1, µ2) for each of a plurality of locations in a volume space at respective first and second energy spectra;a polychromatic corrector (50) for receiving, for each of the plurality of locations in the volume space, the first and second data (481, 482) and for performing a) a first polychromatic correction based on the radiation attenuations (µ1) of the plurality of locations in the volume space at the first energy spectrum, wherein the polychromatic correction generates first corrected radiation attenuations of the locations in the volume space at the first energy spectrum (521), wherein the first polychromatic correction includes generating and using a first attenuation map, and b) a second polychromatic correction based on the radiation attenuations (µ2) of the plurality of locations in the volume space at the second energy spectrum, wherein the polychromatic correction generates second corrected radiation attenuations of the locations in the volume space at the second energy spectrum (522);a material classifier (54) for receiving, for each of the plurality of locations in the volume space, the first and second data (521, 522) being volumetric computed tomography data indicative of the corrected radiation attenuation (µ1, µ2) of the location at respective first and second energy spectra, and for determining a material composition of the plurality of locations in the volume space as a function of their respective locations in an attenuation space defined by the corrected radiation attenuation at the first energy spectrum and the corrected radiation attenuation at the second energy spectrum;an image processor (60) for generating an image (58) of the volume space indicative of the material composition at a plurality of locations in the volume space.
Applications Claiming Priority (2)
| Application Number | Priority Date | Filing Date | Title |
|---|---|---|---|
| US59616905P | 2005-09-06 | 2005-09-06 | |
| PCT/IB2006/052867 WO2007029129A2 (en) | 2005-09-06 | 2006-08-18 | Data handling and analysis in computed tomography with multiple energy windows |
Publications (2)
| Publication Number | Publication Date |
|---|---|
| EP1927081A2 EP1927081A2 (en) | 2008-06-04 |
| EP1927081B1 true EP1927081B1 (en) | 2017-04-26 |
Family
ID=37654757
Family Applications (1)
| Application Number | Title | Priority Date | Filing Date |
|---|---|---|---|
| EP06795703.5A Not-in-force EP1927081B1 (en) | 2005-09-06 | 2006-08-18 | Data handling and analysis in computed tomography with multiple energy windows |
Country Status (5)
| Country | Link |
|---|---|
| US (1) | US7778380B2 (en) |
| EP (1) | EP1927081B1 (en) |
| JP (1) | JP5237812B2 (en) |
| CN (1) | CN101313332B (en) |
| WO (1) | WO2007029129A2 (en) |
Families Citing this family (61)
| Publication number | Priority date | Publication date | Assignee | Title |
|---|---|---|---|---|
| US7869860B2 (en) * | 2005-11-14 | 2011-01-11 | University Of Washington | Method for enhancing the accuracy of PET/CT images |
| US8057098B2 (en) * | 2006-01-12 | 2011-11-15 | Kabushiki Kaisha Toshiba | X-ray CT apparatus and method of creating correction data for X-ray CT |
| DE102006002895B3 (en) * | 2006-01-20 | 2007-07-19 | Siemens Ag | Method for generating cardio-CT images with application of a contrast agent and multi-tube CT system for carrying out this method |
| JP5274812B2 (en) * | 2007-11-12 | 2013-08-28 | ジーイー・メディカル・システムズ・グローバル・テクノロジー・カンパニー・エルエルシー | X-ray CT apparatus and image processing apparatus |
| US8194961B2 (en) * | 2008-04-21 | 2012-06-05 | Kabushiki Kaisha Toshiba | Method, apparatus, and computer-readable medium for pre-reconstruction decomposition and calibration in dual energy computed tomography |
| JP5191787B2 (en) * | 2008-04-23 | 2013-05-08 | 株式会社日立メディコ | X-ray CT system |
| RU2529804C2 (en) | 2008-10-23 | 2014-09-27 | Конинклейке Филипс Электроникс, Н.В. | Molecular imaging |
| US8260023B2 (en) * | 2008-11-26 | 2012-09-04 | General Electric Company | Forward projection for the generation of computed tomography images at arbitrary spectra |
| US20100310036A1 (en) * | 2009-06-04 | 2010-12-09 | General Electric Company | Computed tomography method and apparatus |
| RU2544388C2 (en) * | 2009-06-18 | 2015-03-20 | Конинклейке Филипс Электроникс Н.В. | Optimal energy windowing of scattered events in radionuclide imaging |
| US20140072108A1 (en) * | 2010-07-16 | 2014-03-13 | David P. Rohler | Methods and apparatus for extended low contrast detectability for radiographic imaging systems |
| US8363917B2 (en) * | 2009-10-14 | 2013-01-29 | General Electric Company | System and method of image artifact reduction in fast kVp switching CT |
| US9208585B2 (en) * | 2010-07-16 | 2015-12-08 | Mayo Foundation For Medical Education And Research | System and method for improved energy series of images using multi-energy CT |
| US8309910B2 (en) * | 2010-12-15 | 2012-11-13 | General Electric Company | Phantom for spectral CT image system calibration |
| US20140037045A1 (en) * | 2011-04-08 | 2014-02-06 | Arineta Ltd. | Dual energy ct scanner |
| JP5942099B2 (en) * | 2011-12-08 | 2016-06-29 | タカラテレシステムズ株式会社 | Substance identification apparatus and imaging system operating method |
| CN103308535B (en) * | 2012-03-09 | 2016-04-13 | 同方威视技术股份有限公司 | For equipment and the method for ray scanning imaging |
| US8835858B2 (en) * | 2012-03-23 | 2014-09-16 | General Electric Company | Systems and methods for attenuation compensation in nuclear medicine imaging based on emission data |
| CN104508710B (en) * | 2012-03-29 | 2018-04-27 | 皇家飞利浦有限公司 | The vision of selectivity tissue in view data is suppressed |
| CN104271044B (en) * | 2012-05-02 | 2017-12-05 | 皇家飞利浦有限公司 | The spectral CT visualization of medicament elution pearl can be imaged |
| US20130301799A1 (en) * | 2012-05-14 | 2013-11-14 | Samsung Electronics Co., Ltd. | X-ray imaging apparatus and control method therefor |
| US10088580B2 (en) | 2012-05-31 | 2018-10-02 | Minnesota Imaging And Engineering Llc | Detector systems for radiation imaging |
| US10371834B2 (en) | 2012-05-31 | 2019-08-06 | Minnesota Imaging And Engineering Llc | Detector systems for integrated radiation imaging |
| US10067239B2 (en) | 2012-05-31 | 2018-09-04 | Minnesota Imaging And Engineering Llc | Detector systems for radiation imaging |
| JP6238584B2 (en) * | 2012-07-17 | 2017-11-29 | 東芝メディカルシステムズ株式会社 | X-ray CT apparatus and control method of X-ray CT apparatus |
| WO2014080311A1 (en) * | 2012-11-26 | 2014-05-30 | Koninklijke Philips N.V. | Projection data de-noising |
| CN103892859A (en) * | 2012-12-28 | 2014-07-02 | Ge医疗系统环球技术有限公司 | CT (computed tomography) imaging method and CT imaging system based on multi-mode Scout scanning |
| US9364191B2 (en) * | 2013-02-11 | 2016-06-14 | University Of Rochester | Method and apparatus of spectral differential phase-contrast cone-beam CT and hybrid cone-beam CT |
| JP6305692B2 (en) * | 2013-05-28 | 2018-04-04 | キヤノンメディカルシステムズ株式会社 | X-ray diagnostic equipment |
| CN103472074B (en) * | 2013-06-19 | 2016-01-20 | 清华大学 | Ct imaging system and method |
| US9538971B2 (en) | 2013-06-24 | 2017-01-10 | University Of Washington | Systems for characterizing atherosclerotic plaque and methods of using same |
| CN106233335B (en) | 2014-04-07 | 2019-09-20 | 棱镜传感器公司 | X-ray spectrum imaging method and system |
| CN107251094B (en) | 2014-08-16 | 2021-01-08 | Fei公司 | Tomographic reconstruction for material characterization |
| WO2016063170A1 (en) * | 2014-10-20 | 2016-04-28 | Koninklijke Philips N.V. | Start image for spectral image iterative reconstruction |
| CN107111883B (en) | 2014-10-30 | 2020-12-08 | 皇家飞利浦有限公司 | Texture Analysis Map for Image Data |
| US10657679B2 (en) | 2015-03-09 | 2020-05-19 | Koninklijke Philips N.V. | Multi-energy (spectral) image data processing |
| DE102015206127B4 (en) * | 2015-04-07 | 2023-11-02 | Siemens Healthcare Gmbh | Method and image data determination device for reconstructing image data in CT imaging |
| EP3282949B1 (en) | 2015-04-13 | 2019-06-05 | Case Western Reserve University | Dual energy x-ray coronary calcium grading |
| JP7015781B2 (en) * | 2015-07-24 | 2022-02-03 | フォト・ダイアグノスティック・システムズ,インコーポレイテッド | Methods and Instruments for Performing Multiple Energy (Including Dual Energy) Computed Tomography (CT) Imaging |
| JP2018532468A (en) * | 2015-09-23 | 2018-11-08 | コーニンクレッカ フィリップス エヌ ヴェKoninklijke Philips N.V. | Spectral imaging phantom and method |
| CN107345923B (en) | 2016-05-05 | 2020-05-19 | 清华大学 | X-ray detection method, and X-ray detector |
| US10509135B2 (en) | 2016-09-09 | 2019-12-17 | Minnesota Imaging And Engineering Llc | Structured detectors and detector systems for radiation imaging |
| US10365383B2 (en) | 2016-09-09 | 2019-07-30 | Minnesota Imaging And Engineering Llc | Structured detectors and detector systems for radiation imaging |
| US10573030B2 (en) | 2017-04-07 | 2020-02-25 | Photo Diagnostic Systems, Inc. | Method for artifact reduction using monoenergetic data in computed tomography |
| WO2019072554A1 (en) * | 2017-10-09 | 2019-04-18 | Koninklijke Philips N.V. | Material-selective adaptive blending of volumetric image data |
| US10813612B2 (en) * | 2019-01-25 | 2020-10-27 | Cleerly, Inc. | Systems and method of characterizing high risk plaques |
| JP7313194B2 (en) * | 2019-05-30 | 2023-07-24 | キヤノン株式会社 | Image processing device, image processing method and program |
| DE102019210473A1 (en) * | 2019-07-16 | 2021-01-21 | Siemens Healthcare Gmbh | Method and device for imaging in computed tomography |
| CA3162872A1 (en) | 2020-01-07 | 2021-07-15 | James K. MIN | Systems, methods, and devices for medical image analysis, diagnosis, risk stratification, decision making and/or disease tracking |
| US11969280B2 (en) | 2020-01-07 | 2024-04-30 | Cleerly, Inc. | Systems, methods, and devices for medical image analysis, diagnosis, risk stratification, decision making and/or disease tracking |
| US20220392065A1 (en) | 2020-01-07 | 2022-12-08 | Cleerly, Inc. | Systems, methods, and devices for medical image analysis, diagnosis, risk stratification, decision making and/or disease tracking |
| US11615508B2 (en) * | 2020-02-07 | 2023-03-28 | GE Precision Healthcare LLC | Systems and methods for consistent presentation of medical images using deep neural networks |
| US11900593B2 (en) | 2021-04-23 | 2024-02-13 | Fujifilm Sonosite, Inc. | Identifying blood vessels in ultrasound images |
| US12357266B2 (en) | 2021-04-23 | 2025-07-15 | Fujifilm Sonosite, Inc. | Displaying blood vessels in ultrasound images |
| US11896425B2 (en) * | 2021-04-23 | 2024-02-13 | Fujifilm Sonosite, Inc. | Guiding instrument insertion |
| US12440180B2 (en) | 2022-03-10 | 2025-10-14 | Cleerly, Inc. | Systems, devices, and methods for non-invasive image-based plaque analysis and risk determination |
| US20250143657A1 (en) | 2022-03-10 | 2025-05-08 | Cleerly, Inc. | Systems, devices, and methods for non-invasive image-based plaque analysis and risk determination |
| US20250217981A1 (en) | 2022-03-10 | 2025-07-03 | Cleerly, Inc. | Systems, methods, and devices for image-based plaque analysis and risk determination |
| US12406365B2 (en) | 2022-03-10 | 2025-09-02 | Cleerly, Inc. | Systems, devices, and methods for non-invasive image-based plaque analysis and risk determination |
| CN118512193A (en) * | 2023-02-20 | 2024-08-20 | 武汉联影生命科学仪器有限公司 | Energy spectrum CT imaging method, device and CT scanning imaging system |
| JP2024161991A (en) * | 2023-05-09 | 2024-11-21 | 富士フイルム株式会社 | Photon counting CT apparatus and material decomposition method |
Citations (1)
| Publication number | Priority date | Publication date | Assignee | Title |
|---|---|---|---|---|
| WO2005076222A1 (en) * | 2004-02-09 | 2005-08-18 | Philips Intellectual Property & Standards Gmbh | Correction of artifacts caused by high attenuating objects |
Family Cites Families (23)
| Publication number | Priority date | Publication date | Assignee | Title |
|---|---|---|---|---|
| FR2547149A1 (en) * | 1983-06-02 | 1984-12-07 | Elscint Ltd | SYSTEM AND METHOD FOR REPROJECTION IN TOMODENSITOMETRY |
| US4616318A (en) * | 1983-06-07 | 1986-10-07 | Elscint, Inc. | System for reprojecting images using transform techniques |
| US5128864A (en) * | 1989-08-09 | 1992-07-07 | W. L. Systems, Inc. | Method for computing tomographic scans |
| US5287546A (en) * | 1992-09-14 | 1994-02-15 | Lunar Corporation | Patient positioning apparatus for bone scanning |
| US6275559B1 (en) * | 1999-10-08 | 2001-08-14 | General Electric Company | Method and system for diagnosing faults in imaging scanners |
| JP2002197440A (en) * | 2000-12-27 | 2002-07-12 | Fuji Photo Film Co Ltd | Method and processor for processing radiographic image |
| EP1415276B1 (en) * | 2001-07-19 | 2012-05-23 | Koninklijke Philips Electronics N.V. | Method of reducing noise in volume imaging |
| DE10143131B4 (en) | 2001-09-03 | 2006-03-09 | Siemens Ag | Method for determining density and atomic number distributions in radiographic examination methods |
| DE10160613A1 (en) | 2001-12-11 | 2003-06-26 | Siemens Ag | X-ray apparatus for determining the distribution of density and atomic number in an examination object is based on a conventional CT device with an additional two-part filter placed between the source and object |
| US6904118B2 (en) * | 2002-07-23 | 2005-06-07 | General Electric Company | Method and apparatus for generating a density map using dual-energy CT |
| CN100536774C (en) | 2002-07-23 | 2009-09-09 | Ge医药系统环球科技公司 | Method and system for detecting plaque components |
| US6922462B2 (en) | 2002-07-31 | 2005-07-26 | Ge Medical Systems Global Technology Company, Llc | Method, system and computer product for plaque characterization |
| US7272429B2 (en) * | 2002-11-27 | 2007-09-18 | Ge Medical Systems Global Technology Company, Llc | Methods and apparatus for facilitating a reduction in artifacts |
| US6999549B2 (en) * | 2002-11-27 | 2006-02-14 | Ge Medical Systems Global Technology, Llc | Method and apparatus for quantifying tissue fat content |
| US6898263B2 (en) * | 2002-11-27 | 2005-05-24 | Ge Medical Systems Global Technology Company, Llc | Method and apparatus for soft-tissue volume visualization |
| US6950493B2 (en) * | 2003-06-25 | 2005-09-27 | Besson Guy M | Dynamic multi-spectral CT imaging |
| US6904120B2 (en) * | 2003-07-01 | 2005-06-07 | General Electric Company | Method and apparatus for correcting bone induced spectral artifacts |
| US6987833B2 (en) * | 2003-10-16 | 2006-01-17 | General Electric Company | Methods and apparatus for identification and imaging of specific materials |
| US7653229B2 (en) * | 2003-12-23 | 2010-01-26 | General Electric Company | Methods and apparatus for reconstruction of volume data from projection data |
| DE602005004653T2 (en) * | 2004-03-17 | 2009-01-29 | Philips Intellectual Property & Standards Gmbh | Correction of radiation hardening and attenuation in coherent scatter computed tomography (CSCT) |
| US7583779B2 (en) * | 2004-11-24 | 2009-09-01 | General Electric Company | System and method for acquisition and reconstruction of contrast-enhanced, artifact-reduced CT images |
| EP1877832B1 (en) | 2005-04-26 | 2018-02-21 | Koninklijke Philips N.V. | Detector array for spectral ct |
| US20060251209A1 (en) * | 2005-05-06 | 2006-11-09 | General Electric Company | Energy sensitive x-ray system and method for material discrimination and object classification |
-
2006
- 2006-08-18 WO PCT/IB2006/052867 patent/WO2007029129A2/en not_active Ceased
- 2006-08-18 CN CN2006800327106A patent/CN101313332B/en not_active Expired - Fee Related
- 2006-08-18 EP EP06795703.5A patent/EP1927081B1/en not_active Not-in-force
- 2006-08-18 US US12/065,611 patent/US7778380B2/en active Active
- 2006-08-18 JP JP2008529718A patent/JP5237812B2/en not_active Expired - Fee Related
Patent Citations (1)
| Publication number | Priority date | Publication date | Assignee | Title |
|---|---|---|---|---|
| WO2005076222A1 (en) * | 2004-02-09 | 2005-08-18 | Philips Intellectual Property & Standards Gmbh | Correction of artifacts caused by high attenuating objects |
Also Published As
| Publication number | Publication date |
|---|---|
| CN101313332A (en) | 2008-11-26 |
| US20080226017A1 (en) | 2008-09-18 |
| JP5237812B2 (en) | 2013-07-17 |
| CN101313332B (en) | 2011-05-25 |
| JP2009506854A (en) | 2009-02-19 |
| EP1927081A2 (en) | 2008-06-04 |
| US7778380B2 (en) | 2010-08-17 |
| WO2007029129A3 (en) | 2007-08-02 |
| WO2007029129A2 (en) | 2007-03-15 |
Similar Documents
| Publication | Publication Date | Title |
|---|---|---|
| US7778380B2 (en) | Data handling and analysis in computed tomography with multiple energy windows | |
| US7583779B2 (en) | System and method for acquisition and reconstruction of contrast-enhanced, artifact-reduced CT images | |
| US9208585B2 (en) | System and method for improved energy series of images using multi-energy CT | |
| Carmi et al. | Material separation with dual-layer CT | |
| US9498179B1 (en) | Methods and systems for metal artifact reduction in spectral CT imaging | |
| Bateman et al. | MARS-MD: rejection based image domain material decomposition | |
| Rinkel et al. | A new method for x-ray scatter correction: first assessment on a cone-beam CT experimental setup | |
| US6898263B2 (en) | Method and apparatus for soft-tissue volume visualization | |
| JP4347672B2 (en) | Method and apparatus for detecting abnormalities related to structure, perfusion and function | |
| CN105011960B (en) | It is decomposed using more materials of dual energy computed tomography | |
| US8290232B2 (en) | System and method for quantitative imaging of chemical composition to decompose more than two materials | |
| EP2313865B1 (en) | System and method for spectral x-ray imaging | |
| US7734076B2 (en) | Material decomposition image noise reduction | |
| US20050084069A1 (en) | Methods and apparatus for identification and imaging of specific materials | |
| CN104939848B (en) | Monochrome image generation | |
| US10217247B2 (en) | Method for generating contrast agent concentration map | |
| EP2243021A2 (en) | System and method for quantitative imaging of chemical composition to decompose multiple materials | |
| Walter et al. | Dual kVp material decomposition using flat-panel detectors | |
| Jin | Implementation and optimization of dual energy computed tomography | |
| Zhang et al. | Voxel-based correction of CT attenuations for accurate quantification of coronary artery calcification in low tube voltage scans with deep learning reconstruction | |
| Mazzini et al. | Spectral micro-CT for quantitative analysis of calcification in fibrocartilage |
Legal Events
| Date | Code | Title | Description |
|---|---|---|---|
| PUAI | Public reference made under article 153(3) epc to a published international application that has entered the european phase |
Free format text: ORIGINAL CODE: 0009012 |
|
| 17P | Request for examination filed |
Effective date: 20080407 |
|
| AK | Designated contracting states |
Kind code of ref document: A2 Designated state(s): AT BE BG CH CY CZ DE DK EE ES FI FR GB GR HU IE IS IT LI LT LU LV MC NL PL PT RO SE SI SK TR |
|
| 17Q | First examination report despatched |
Effective date: 20090430 |
|
| DAX | Request for extension of the european patent (deleted) | ||
| RAP1 | Party data changed (applicant data changed or rights of an application transferred) |
Owner name: KONINKLIJKE PHILIPS N.V. |
|
| GRAP | Despatch of communication of intention to grant a patent |
Free format text: ORIGINAL CODE: EPIDOSNIGR1 |
|
| INTG | Intention to grant announced |
Effective date: 20161118 |
|
| RIC1 | Information provided on ipc code assigned before grant |
Ipc: G06T 7/00 20060101AFI20161107BHEP Ipc: A61B 6/03 20060101ALI20161107BHEP |
|
| GRAS | Grant fee paid |
Free format text: ORIGINAL CODE: EPIDOSNIGR3 |
|
| GRAA | (expected) grant |
Free format text: ORIGINAL CODE: 0009210 |
|
| AK | Designated contracting states |
Kind code of ref document: B1 Designated state(s): AT BE BG CH CY CZ DE DK EE ES FI FR GB GR HU IE IS IT LI LT LU LV MC NL PL PT RO SE SI SK TR |
|
| REG | Reference to a national code |
Ref country code: GB Ref legal event code: FG4D |
|
| REG | Reference to a national code |
Ref country code: CH Ref legal event code: EP |
|
| REG | Reference to a national code |
Ref country code: AT Ref legal event code: REF Ref document number: 888470 Country of ref document: AT Kind code of ref document: T Effective date: 20170515 |
|
| REG | Reference to a national code |
Ref country code: IE Ref legal event code: FG4D |
|
| REG | Reference to a national code |
Ref country code: DE Ref legal event code: R096 Ref document number: 602006052379 Country of ref document: DE |
|
| REG | Reference to a national code |
Ref country code: FR Ref legal event code: PLFP Year of fee payment: 12 |
|
| REG | Reference to a national code |
Ref country code: NL Ref legal event code: MP Effective date: 20170426 |
|
| REG | Reference to a national code |
Ref country code: LT Ref legal event code: MG4D |
|
| REG | Reference to a national code |
Ref country code: AT Ref legal event code: MK05 Ref document number: 888470 Country of ref document: AT Kind code of ref document: T Effective date: 20170426 |
|
| PG25 | Lapsed in a contracting state [announced via postgrant information from national office to epo] |
Ref country code: NL Free format text: LAPSE BECAUSE OF FAILURE TO SUBMIT A TRANSLATION OF THE DESCRIPTION OR TO PAY THE FEE WITHIN THE PRESCRIBED TIME-LIMIT Effective date: 20170426 |
|
| PG25 | Lapsed in a contracting state [announced via postgrant information from national office to epo] |
Ref country code: ES Free format text: LAPSE BECAUSE OF FAILURE TO SUBMIT A TRANSLATION OF THE DESCRIPTION OR TO PAY THE FEE WITHIN THE PRESCRIBED TIME-LIMIT Effective date: 20170426 Ref country code: AT Free format text: LAPSE BECAUSE OF FAILURE TO SUBMIT A TRANSLATION OF THE DESCRIPTION OR TO PAY THE FEE WITHIN THE PRESCRIBED TIME-LIMIT Effective date: 20170426 Ref country code: LT Free format text: LAPSE BECAUSE OF FAILURE TO SUBMIT A TRANSLATION OF THE DESCRIPTION OR TO PAY THE FEE WITHIN THE PRESCRIBED TIME-LIMIT Effective date: 20170426 Ref country code: GR Free format text: LAPSE BECAUSE OF FAILURE TO SUBMIT A TRANSLATION OF THE DESCRIPTION OR TO PAY THE FEE WITHIN THE PRESCRIBED TIME-LIMIT Effective date: 20170727 Ref country code: FI Free format text: LAPSE BECAUSE OF FAILURE TO SUBMIT A TRANSLATION OF THE DESCRIPTION OR TO PAY THE FEE WITHIN THE PRESCRIBED TIME-LIMIT Effective date: 20170426 |
|
| PG25 | Lapsed in a contracting state [announced via postgrant information from national office to epo] |
Ref country code: PL Free format text: LAPSE BECAUSE OF FAILURE TO SUBMIT A TRANSLATION OF THE DESCRIPTION OR TO PAY THE FEE WITHIN THE PRESCRIBED TIME-LIMIT Effective date: 20170426 Ref country code: SE Free format text: LAPSE BECAUSE OF FAILURE TO SUBMIT A TRANSLATION OF THE DESCRIPTION OR TO PAY THE FEE WITHIN THE PRESCRIBED TIME-LIMIT Effective date: 20170426 Ref country code: BG Free format text: LAPSE BECAUSE OF FAILURE TO SUBMIT A TRANSLATION OF THE DESCRIPTION OR TO PAY THE FEE WITHIN THE PRESCRIBED TIME-LIMIT Effective date: 20170726 Ref country code: LV Free format text: LAPSE BECAUSE OF FAILURE TO SUBMIT A TRANSLATION OF THE DESCRIPTION OR TO PAY THE FEE WITHIN THE PRESCRIBED TIME-LIMIT Effective date: 20170426 Ref country code: IS Free format text: LAPSE BECAUSE OF FAILURE TO SUBMIT A TRANSLATION OF THE DESCRIPTION OR TO PAY THE FEE WITHIN THE PRESCRIBED TIME-LIMIT Effective date: 20170826 |
|
| REG | Reference to a national code |
Ref country code: DE Ref legal event code: R097 Ref document number: 602006052379 Country of ref document: DE |
|
| PG25 | Lapsed in a contracting state [announced via postgrant information from national office to epo] |
Ref country code: SK Free format text: LAPSE BECAUSE OF FAILURE TO SUBMIT A TRANSLATION OF THE DESCRIPTION OR TO PAY THE FEE WITHIN THE PRESCRIBED TIME-LIMIT Effective date: 20170426 Ref country code: DK Free format text: LAPSE BECAUSE OF FAILURE TO SUBMIT A TRANSLATION OF THE DESCRIPTION OR TO PAY THE FEE WITHIN THE PRESCRIBED TIME-LIMIT Effective date: 20170426 Ref country code: EE Free format text: LAPSE BECAUSE OF FAILURE TO SUBMIT A TRANSLATION OF THE DESCRIPTION OR TO PAY THE FEE WITHIN THE PRESCRIBED TIME-LIMIT Effective date: 20170426 Ref country code: CZ Free format text: LAPSE BECAUSE OF FAILURE TO SUBMIT A TRANSLATION OF THE DESCRIPTION OR TO PAY THE FEE WITHIN THE PRESCRIBED TIME-LIMIT Effective date: 20170426 Ref country code: RO Free format text: LAPSE BECAUSE OF FAILURE TO SUBMIT A TRANSLATION OF THE DESCRIPTION OR TO PAY THE FEE WITHIN THE PRESCRIBED TIME-LIMIT Effective date: 20170426 |
|
| PG25 | Lapsed in a contracting state [announced via postgrant information from national office to epo] |
Ref country code: IT Free format text: LAPSE BECAUSE OF FAILURE TO SUBMIT A TRANSLATION OF THE DESCRIPTION OR TO PAY THE FEE WITHIN THE PRESCRIBED TIME-LIMIT Effective date: 20170426 |
|
| PLBE | No opposition filed within time limit |
Free format text: ORIGINAL CODE: 0009261 |
|
| STAA | Information on the status of an ep patent application or granted ep patent |
Free format text: STATUS: NO OPPOSITION FILED WITHIN TIME LIMIT |
|
| REG | Reference to a national code |
Ref country code: CH Ref legal event code: PL |
|
| PG25 | Lapsed in a contracting state [announced via postgrant information from national office to epo] |
Ref country code: MC Free format text: LAPSE BECAUSE OF FAILURE TO SUBMIT A TRANSLATION OF THE DESCRIPTION OR TO PAY THE FEE WITHIN THE PRESCRIBED TIME-LIMIT Effective date: 20170426 |
|
| 26N | No opposition filed |
Effective date: 20180129 |
|
| GBPC | Gb: european patent ceased through non-payment of renewal fee |
Effective date: 20170818 |
|
| PG25 | Lapsed in a contracting state [announced via postgrant information from national office to epo] |
Ref country code: LI Free format text: LAPSE BECAUSE OF NON-PAYMENT OF DUE FEES Effective date: 20170831 Ref country code: CH Free format text: LAPSE BECAUSE OF NON-PAYMENT OF DUE FEES Effective date: 20170831 |
|
| REG | Reference to a national code |
Ref country code: IE Ref legal event code: MM4A |
|
| PG25 | Lapsed in a contracting state [announced via postgrant information from national office to epo] |
Ref country code: SI Free format text: LAPSE BECAUSE OF FAILURE TO SUBMIT A TRANSLATION OF THE DESCRIPTION OR TO PAY THE FEE WITHIN THE PRESCRIBED TIME-LIMIT Effective date: 20170426 |
|
| REG | Reference to a national code |
Ref country code: BE Ref legal event code: MM Effective date: 20170831 |
|
| PG25 | Lapsed in a contracting state [announced via postgrant information from national office to epo] |
Ref country code: LU Free format text: LAPSE BECAUSE OF NON-PAYMENT OF DUE FEES Effective date: 20170818 |
|
| REG | Reference to a national code |
Ref country code: DE Ref legal event code: R084 Ref document number: 602006052379 Country of ref document: DE |
|
| PG25 | Lapsed in a contracting state [announced via postgrant information from national office to epo] |
Ref country code: IE Free format text: LAPSE BECAUSE OF NON-PAYMENT OF DUE FEES Effective date: 20170818 Ref country code: GB Free format text: LAPSE BECAUSE OF NON-PAYMENT OF DUE FEES Effective date: 20170818 |
|
| REG | Reference to a national code |
Ref country code: FR Ref legal event code: PLFP Year of fee payment: 13 |
|
| PG25 | Lapsed in a contracting state [announced via postgrant information from national office to epo] |
Ref country code: BE Free format text: LAPSE BECAUSE OF NON-PAYMENT OF DUE FEES Effective date: 20170831 |
|
| PG25 | Lapsed in a contracting state [announced via postgrant information from national office to epo] |
Ref country code: HU Free format text: LAPSE BECAUSE OF FAILURE TO SUBMIT A TRANSLATION OF THE DESCRIPTION OR TO PAY THE FEE WITHIN THE PRESCRIBED TIME-LIMIT; INVALID AB INITIO Effective date: 20060818 |
|
| PG25 | Lapsed in a contracting state [announced via postgrant information from national office to epo] |
Ref country code: CY Free format text: LAPSE BECAUSE OF NON-PAYMENT OF DUE FEES Effective date: 20170426 |
|
| PG25 | Lapsed in a contracting state [announced via postgrant information from national office to epo] |
Ref country code: TR Free format text: LAPSE BECAUSE OF FAILURE TO SUBMIT A TRANSLATION OF THE DESCRIPTION OR TO PAY THE FEE WITHIN THE PRESCRIBED TIME-LIMIT Effective date: 20170426 |
|
| PG25 | Lapsed in a contracting state [announced via postgrant information from national office to epo] |
Ref country code: PT Free format text: LAPSE BECAUSE OF FAILURE TO SUBMIT A TRANSLATION OF THE DESCRIPTION OR TO PAY THE FEE WITHIN THE PRESCRIBED TIME-LIMIT Effective date: 20170426 |
|
| PGFP | Annual fee paid to national office [announced via postgrant information from national office to epo] |
Ref country code: FR Payment date: 20230824 Year of fee payment: 18 Ref country code: DE Payment date: 20230828 Year of fee payment: 18 |
|
| REG | Reference to a national code |
Ref country code: DE Ref legal event code: R119 Ref document number: 602006052379 Country of ref document: DE |
|
| PG25 | Lapsed in a contracting state [announced via postgrant information from national office to epo] |
Ref country code: DE Free format text: LAPSE BECAUSE OF NON-PAYMENT OF DUE FEES Effective date: 20250301 |
|
| PG25 | Lapsed in a contracting state [announced via postgrant information from national office to epo] |
Ref country code: FR Free format text: LAPSE BECAUSE OF NON-PAYMENT OF DUE FEES Effective date: 20240831 |