EP1922325B1 - Methods for the diagnosis of dementia and other neurological disorders - Google Patents
Methods for the diagnosis of dementia and other neurological disorders Download PDFInfo
- Publication number
- EP1922325B1 EP1922325B1 EP07710657A EP07710657A EP1922325B1 EP 1922325 B1 EP1922325 B1 EP 1922325B1 EP 07710657 A EP07710657 A EP 07710657A EP 07710657 A EP07710657 A EP 07710657A EP 1922325 B1 EP1922325 B1 EP 1922325B1
- Authority
- EP
- European Patent Office
- Prior art keywords
- dementia
- metabolite
- patient
- metabolites
- disease
- Prior art date
- Legal status (The legal status is an assumption and is not a legal conclusion. Google has not performed a legal analysis and makes no representation as to the accuracy of the status listed.)
- Active
Links
Images


















Classifications
-
- G—PHYSICS
- G16—INFORMATION AND COMMUNICATION TECHNOLOGY [ICT] SPECIALLY ADAPTED FOR SPECIFIC APPLICATION FIELDS
- G16H—HEALTHCARE INFORMATICS, i.e. INFORMATION AND COMMUNICATION TECHNOLOGY [ICT] SPECIALLY ADAPTED FOR THE HANDLING OR PROCESSING OF MEDICAL OR HEALTHCARE DATA
- G16H10/00—ICT specially adapted for the handling or processing of patient-related medical or healthcare data
- G16H10/40—ICT specially adapted for the handling or processing of patient-related medical or healthcare data for data related to laboratory analysis, e.g. patient specimen analysis
-
- C—CHEMISTRY; METALLURGY
- C07—ORGANIC CHEMISTRY
- C07F—ACYCLIC, CARBOCYCLIC OR HETEROCYCLIC COMPOUNDS CONTAINING ELEMENTS OTHER THAN CARBON, HYDROGEN, HALOGEN, OXYGEN, NITROGEN, SULFUR, SELENIUM OR TELLURIUM
- C07F9/00—Compounds containing elements of Groups 5 or 15 of the Periodic Table
- C07F9/02—Phosphorus compounds
- C07F9/06—Phosphorus compounds without P—C bonds
- C07F9/08—Esters of oxyacids of phosphorus
- C07F9/09—Esters of phosphoric acids
-
- C—CHEMISTRY; METALLURGY
- C07—ORGANIC CHEMISTRY
- C07F—ACYCLIC, CARBOCYCLIC OR HETEROCYCLIC COMPOUNDS CONTAINING ELEMENTS OTHER THAN CARBON, HYDROGEN, HALOGEN, OXYGEN, NITROGEN, SULFUR, SELENIUM OR TELLURIUM
- C07F9/00—Compounds containing elements of Groups 5 or 15 of the Periodic Table
- C07F9/02—Phosphorus compounds
- C07F9/06—Phosphorus compounds without P—C bonds
- C07F9/08—Esters of oxyacids of phosphorus
- C07F9/09—Esters of phosphoric acids
- C07F9/10—Phosphatides, e.g. lecithin
-
- C—CHEMISTRY; METALLURGY
- C07—ORGANIC CHEMISTRY
- C07F—ACYCLIC, CARBOCYCLIC OR HETEROCYCLIC COMPOUNDS CONTAINING ELEMENTS OTHER THAN CARBON, HYDROGEN, HALOGEN, OXYGEN, NITROGEN, SULFUR, SELENIUM OR TELLURIUM
- C07F9/00—Compounds containing elements of Groups 5 or 15 of the Periodic Table
- C07F9/02—Phosphorus compounds
- C07F9/06—Phosphorus compounds without P—C bonds
- C07F9/08—Esters of oxyacids of phosphorus
- C07F9/09—Esters of phosphoric acids
- C07F9/10—Phosphatides, e.g. lecithin
- C07F9/106—Adducts, complexes, salts of phosphatides
-
- G—PHYSICS
- G01—MEASURING; TESTING
- G01N—INVESTIGATING OR ANALYSING MATERIALS BY DETERMINING THEIR CHEMICAL OR PHYSICAL PROPERTIES
- G01N27/00—Investigating or analysing materials by the use of electric, electrochemical, or magnetic means
-
- G—PHYSICS
- G01—MEASURING; TESTING
- G01N—INVESTIGATING OR ANALYSING MATERIALS BY DETERMINING THEIR CHEMICAL OR PHYSICAL PROPERTIES
- G01N33/00—Investigating or analysing materials by specific methods not covered by groups G01N1/00 - G01N31/00
- G01N33/48—Biological material, e.g. blood, urine; Haemocytometers
- G01N33/483—Physical analysis of biological material
-
- G—PHYSICS
- G01—MEASURING; TESTING
- G01N—INVESTIGATING OR ANALYSING MATERIALS BY DETERMINING THEIR CHEMICAL OR PHYSICAL PROPERTIES
- G01N33/00—Investigating or analysing materials by specific methods not covered by groups G01N1/00 - G01N31/00
- G01N33/48—Biological material, e.g. blood, urine; Haemocytometers
- G01N33/50—Chemical analysis of biological material, e.g. blood, urine; Testing involving biospecific ligand binding methods; Immunological testing
- G01N33/68—Chemical analysis of biological material, e.g. blood, urine; Testing involving biospecific ligand binding methods; Immunological testing involving proteins, peptides or amino acids
- G01N33/6893—Chemical analysis of biological material, e.g. blood, urine; Testing involving biospecific ligand binding methods; Immunological testing involving proteins, peptides or amino acids related to diseases not provided for elsewhere
- G01N33/6896—Neurological disorders, e.g. Alzheimer's disease
-
- G—PHYSICS
- G01—MEASURING; TESTING
- G01N—INVESTIGATING OR ANALYSING MATERIALS BY DETERMINING THEIR CHEMICAL OR PHYSICAL PROPERTIES
- G01N37/00—Details not covered by any other group of this subclass
-
- G—PHYSICS
- G01—MEASURING; TESTING
- G01N—INVESTIGATING OR ANALYSING MATERIALS BY DETERMINING THEIR CHEMICAL OR PHYSICAL PROPERTIES
- G01N2800/00—Detection or diagnosis of diseases
- G01N2800/28—Neurological disorders
- G01N2800/2814—Dementia; Cognitive disorders
-
- G—PHYSICS
- G01—MEASURING; TESTING
- G01N—INVESTIGATING OR ANALYSING MATERIALS BY DETERMINING THEIR CHEMICAL OR PHYSICAL PROPERTIES
- G01N2800/00—Detection or diagnosis of diseases
- G01N2800/28—Neurological disorders
- G01N2800/2814—Dementia; Cognitive disorders
- G01N2800/2821—Alzheimer
-
- G—PHYSICS
- G01—MEASURING; TESTING
- G01N—INVESTIGATING OR ANALYSING MATERIALS BY DETERMINING THEIR CHEMICAL OR PHYSICAL PROPERTIES
- G01N2800/00—Detection or diagnosis of diseases
- G01N2800/50—Determining the risk of developing a disease
-
- G—PHYSICS
- G01—MEASURING; TESTING
- G01N—INVESTIGATING OR ANALYSING MATERIALS BY DETERMINING THEIR CHEMICAL OR PHYSICAL PROPERTIES
- G01N2800/00—Detection or diagnosis of diseases
- G01N2800/52—Predicting or monitoring the response to treatment, e.g. for selection of therapy based on assay results in personalised medicine; Prognosis
-
- G—PHYSICS
- G01—MEASURING; TESTING
- G01N—INVESTIGATING OR ANALYSING MATERIALS BY DETERMINING THEIR CHEMICAL OR PHYSICAL PROPERTIES
- G01N30/00—Investigating or analysing materials by separation into components using adsorption, absorption or similar phenomena or using ion-exchange, e.g. chromatography or field flow fractionation
- G01N30/02—Column chromatography
- G01N30/62—Detectors specially adapted therefor
- G01N30/72—Mass spectrometers
- G01N30/7233—Mass spectrometers interfaced to liquid or supercritical fluid chromatograph
-
- Y—GENERAL TAGGING OF NEW TECHNOLOGICAL DEVELOPMENTS; GENERAL TAGGING OF CROSS-SECTIONAL TECHNOLOGIES SPANNING OVER SEVERAL SECTIONS OF THE IPC; TECHNICAL SUBJECTS COVERED BY FORMER USPC CROSS-REFERENCE ART COLLECTIONS [XRACs] AND DIGESTS
- Y10—TECHNICAL SUBJECTS COVERED BY FORMER USPC
- Y10T—TECHNICAL SUBJECTS COVERED BY FORMER US CLASSIFICATION
- Y10T436/00—Chemistry: analytical and immunological testing
- Y10T436/16—Phosphorus containing
- Y10T436/163333—Organic [e.g., chemical warfare agents, insecticides, etc.]
Definitions
- the present invention relates to small molecules or metabolites that are found to have significantly different abundances between clinically diagnosed dementia or other neurological disorders, and normal patients.
- the present invention also relates to methods for diagnosing dementia and other neurological disorders.
- DSM-IV Diagnostic and Statistical Manual of Mental Disorders, 4th edition
- the clinical manifestation of dementia can result from neurodegeneration (e.g. Alzheimer's Disease [AD], dementia with Lewy bodies [DLB] and frontotemporal lobe dementia [FTLD]), vascular (e.g. multi-infarct dementia) or anoxic event (e.g. cardiac arrest), trauma to the brain (e.g. dementia pugilistica [boxer's dementia]), or exposure to an infectious (e.g. Creutzfeldt-Jakob Disease) or toxic agent (e.g. alcohol-induced dementia) [3].
- AD Alzheimer's Disease
- DLB dementia with Lewy bodies
- FTLD frontotemporal lobe dementia
- vascular e.g. multi-infarct dementia
- anoxic event e.g. cardiac arrest
- trauma to the brain e.g. dementia pugilistica [boxer's dementia]
- an infectious e.g. Creutzfeldt-Jakob Disease
- toxic agent e.g. alcohol-induced dementia
- AD Alzheimer's disease
- DLB vascular dementia
- FTLD vascular dementia
- the differential diagnosis of the types of dementia is not straightforward, and is typically based on exclusion of other disorders [5]. For example, blood chemistry values are measured to determine if Vitamin B12 deficiency, anemia, infection, venereal disease or thyroid disorder may be possible reasons for the dementia symptoms.
- Various neuroimaging techniques may be employed, such as magnetic resonance imaging or computerized tomography scans to determine if the symptoms may be due to the presence of a tumor, infection or vascular event [4].
- AD dementia symptoms
- DLB or FTLD a diagnosis of AD, DLB or FTLD is made exclusively based on the clinical symptoms (e.g. frequency of falls, rapid onset, presence of visual or auditory hallucinations, etc). It is not until a histopathological evaluation of the brain during autopsy is performed that a definitive diagnosis can be obtained [5-7].
- AD Alzheimer's disease .
- tau intraneuronal neurofibrillary tangles
- SPs senile plaques
- Tau is important for the formation of microtubules in the neuronal axon by binding and promoting polymerization of tubules.
- tau becomes hyperphosphorylated thereby disrupting its main function.
- the tau accumulates and forms tangles within the axon. The neuron can no longer function and dies.
- Tau protein is released into the extracellular space where it can be detected in the cerebrospinal fluid (CSF) [9].
- CSF cerebrospinal fluid
- SPs cerebrospinal fluid
- APP amyloid precursor protein
- the formation and secretion of ⁇ -amyloid is closely regulated by homeostasis, but something occurs in AD that disrupts homeostasis resulting in the accumulation of the protein within the brain and disrupting the neurons within its vicinity [11-12].
- the increased amount of tau and the absence of ⁇ -amyloid in CSF have been proposed as possible diagnostic markers for AD, but results have not been consistent.
- the problem may be due to the presence ofNFTs and SPs that increase in number during normal aging [13].
- NFTs and SPs In order for the NFTs and SPs to be diagnostic of AD, they must be localized together in specific areas of the brain (neocortex and limbic region) [12]. SPs without NFTs are present in the same area in individuals with mild cognitive impairment (MCI) and in 27% of non-demented individuals greater then 75 years old [13].
- MCI mild cognitive impairment
- a diagnosis of DLB is based on the presence of protein deposits called alpha-synuclein, which is referred to as Lewy Bodies, within brainstem and cortical neurons [6].
- the cognitive deficit corresponds to the amount of Lewy Bodies within the brain.
- FTLD is not characterized by a specific neuropathological feature. Typically, areas of the frontal/temporal cortices have neuronal loss, spongiform changes (microvacuolation) and severe astrocytic gliosis. The clinical symptoms in FTLD are dependent upon where the pathology is found rather than the type of pathology [7].
- ADAS Alzheimer's Disease Assessment Scale
- MMSE Folstein's Mini-Mental State Exam
- MCI is characterized by a prominent impairment in memory with normal cognitive functions [15]. MCI is considered a transitional stage between normal aging and several types of dementia since a large proportion of individuals with MCI are later diagnosed with AD, DLB, or FTLD and all individuals with fully developed dementia first exhibit mild dementia symptoms similar to MCI [16].
- AD-specific biomarkers in human serum would be extremely useful since it would be noninvasive and could be used to detect the presence of AD pathology prior to the manifestation of clinical symptoms and differentiate those patients who may have a different form of dementia but similar clinical symptoms.
- CSF cerebrospinal fluid
- CRH corticotropin-releasing hormone
- MID multi-infarct dementia
- CVD cerebrovascular accident
- PPE ethanolamine plasmalogen
- AD Alzheimer's disease
- This lipid defect showed anatomic specificity, being more marked at a site of neurodegeneration in AD brain than in a region relatively spared by the disease (mid-temporal cortex vs. cerebellum) and disease specificity for AD: it was not observed at the primary site of neurodegeneration in Huntington's disease (caudate nucleus) nor Parkinson's disease (substantia nigra).
- PPE deficiency parallels an inherent tendency towards membrane bilayer instability previously detected in AD brain which is necessarily due to a change in membrane lipid composition, and which may contribute to AD pathogenesis.
- CDR 0.5 a correlation of the deficiency in gray matter plasmalogen content with the AD CDR (i.e. approximately 10 mol% of deficiency at CDR 0.5 (very mild dementia) to approximately 30 mol% of deficiency at CDR 3 (severe dementia); (3) an absence of alterations of plasmalogen content and molecular species in cerebellar gray matter at any CDR despite dramatic alterations of plasmalogen content in cerebellar white matter. Alterations of ethanolamine plasmalogen content in two mouse models of AD, APP(V717F) and APPsw, were also examined by ESI/MS.
- a plasmalogen deficiency was present (up to 10 mol% of total plasmalogen at the age of 18 months) in cerebral cortices, but was absent in cerebella from both animal models. These results suggest plasmalogen deficiency may play an important role in the AD pathogenesis, particularly in the white matter, and suggest that altered plasmalogen content may contribute to neurodegeneration, synapse loss and synaptic dysfunction in AD.
- the present invention relates to small molecules or metabolites that are found to have significantly different abundances between clinically diagnosed dementia or other neurological disorders, and normal patients.
- the present invention also relates to methods for diagnosing dementia.
- the present invention provides a method for diagnosing dementia or the risk of dementia in a patient, the method comprising the steps of:
- the plasmanylethanolamine of paragraph [0021] is selected from the group consisting of: plasmanyl 16:0/18:1, plasmanyl 16:0/18:2, plasmanyl 16:0/20:4, plasmanyl 16:0/22:4, plasmanyl 16:0/22:6, plasmanyl 18:0/18:1, plasmanyl 18:0/18:2, plasmanyl 18:0/20:4, plasmanyl 18:0/22:4, plasmanyl 18:0/22:6, and combinations thereof.
- the plasmenylethanolamine of paragraph [0021] is selected from the group consisting of: plasmenyl 16:0/18:1, plasmenyl 16:0/18:2, plasmenyl 16:0/20:4, plasmenyl 16:0/22:4, plasmenyl 16:0/22:6, plasmenyl 18:0/18:1, plasmenyl 18:0/18:2, plasmenyl 18:0/20:4, plasmenyl 18:0/22:4, plasmenyl 18:0/22:6, and combinations thereof.
- diagnosing dementia or the risk of dementia in a patient comprises diagnosing a patient's Alzheimer's disease health state or change in health state, Alzheimer's disease, non-Alzheimer's disease dementia, cognitive impairment, the risk of Alzheimer's disease, the risk of cognitive impairment, or the risk of non-Alzheimer's disease dementia in a patient
- step a) comprises analyzing the blood sample by mass spectrometry to obtain the quantifying data using a Fourier transform ion cyclotron resonance, time of flight, orbitrap, quadrupole or triple quadrupole mass spectrometer.
- the mass spectrometer of paragraph [0025] is equipped with a chromatographic system.
- the blood sample is a blood serum sample.
- a liquid/liquid extraction is performed on the blood sample whereby non-polar metabolites are dissolved in an organic solvent and polar metabolites are dissolved in an aqueous solvent.
- the extracted samples of paragraph [0028] are analyzed by positive or negative electrospray ionization (ESI) or positive or negative atmospheric pressure chemical ionization (APCI).
- ESI electrospray ionization
- APCI atmospheric pressure chemical ionization
- the extracted samples of paragraphs [0028] or [0029] are analyzed by MS/MS transition.
- the extracted samples of paragraphs [0028] or [0029] are analyzed by extracted ion chromatography and MS/MS transition.
- said one or more than one reference sample is
- the method further comprises:
- the one or more than one internal control metabolite includes a phosphatidylethanolamine 16:0/18:0.
- a decrease in the level of said one or more than one metabolite marker in said blood sample is identified in the comparing step (b).
- the method of paragraphs [0022] or [0023] comprises a liquid/liquid extraction is performed on the blood sample whereby non-polar metabolites are dissolved in an organic solvent and polar metabolites are dissolved in an aqueous solvent, and the extracted samples are analyzed by MS/MS transition, whereby:
- said diagnosing of the patient's Alzheimer's disease health state or change in health state further comprises evaluating the efficacy of a therapy for treating Alzheimer's disease, dementia or cognitive impairment in a patient.
- At least one of said one or more than one reference sample defined in step b) is one or more than one pre-therapy baseline sample obtained from the patient.
- evaluating the efficacy of the therapy includes determining whether the therapy is improving the demented state of the patient.
- the method may further comprise selecting a minimal number of metabolite markers needed for optimal diagnosis.
- the high resolution mass spectrometer is a Fourier Transfrom Ion Cyclotron Resonance Mass Spectrometer (FTMS).
- HTS assays can be used for the following, wherein the specific "health-state” in this application refers to, but is not limited to dementia:
- diagnosing a given health-state, or risk for development of a health-state by determining the levels of any combination of metabolite features disclosed from the FTMS analysis patient serum, using any method including but not limited to mass spectrometry, NMR, UV detection, ELISA (enzyme-linked immunosorbant assay), chemical reaction, image analysis, or other.
- FIGURE 1 shows a mean signal-to-noise +/-SEM of the AD serum 8 biomarker panel for each different clinical group (AD with significant cognitive impairment, Non-AD dementia, and AD with no significant cognitive impairment) relative to non-demented controls.
- FIGURE 2 shows a mean signal-to-noise +/-SEM of the AD serum 8 biomarker panel for two clinical groups with a significant cognitive impairment (AD and Non-AD dementia).
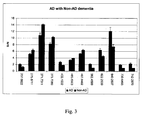
- FIGURE 3 shows a mean signal-to-noise +/-SEM of the AD CSF 12 biomarker panel for two clinical groups with a significant cognitive impairment (AD and Non-AD dementia).
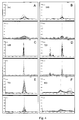
- FIGURE 4 shows Q-Star extracted ion chromatograms (EIC) for the metabolites 541.3432 (A), 569.3687 (B), 699.5198 (C), 723.5195 (D), 751.5555 (E), and 803.568 (F). Top panel, 8 samples from non-demented subjects, bottom panel, 8 samples from clinically-diagnosed AD subjects.
- EIC Q-Star extracted ion chromatograms
- FIGURE 5 shows averaged AD biomarker intensities of the 8 AD and 8 non-demented controls samples from FTMS and Q-Star Analysis.
- FIGURE 6 shows MS/MS spectra for metabolite 541.3432 with CE voltage -50V.
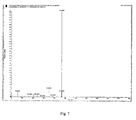
- FIGURE 7 shows MS/MS spectra for metabolite 569.3687 with CE voltage -50V.
- FIGURE 8 shows MS/MS spectra for metabolite 699.5198 with CE voltage-50V.
- FIGURE 9 shows MS/MS spectra for metabolite 723.5195 with CE voltage-50V.
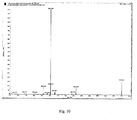
- FIGURE 10 shows MS/MS spectra for metabolite 751.5555 with CE voltage - 50V.
- FIGURE 11 shows MS/MS spectra for metabolite 803.568 with CE voltage -50V.
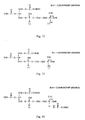
- FIGURE 12 shows structural determination of ADAS-cog serum biomarker 541.3432.
- FIGURE 13 shows structural determination of ADAS-cog serum biomarker 569.3687.
- FIGURE 14 shows structural determination of ADAS-cog serum biomarker 803.568.
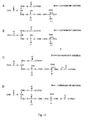
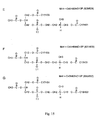
- FIGURE 15 shows putative structures of additional serum biomarkers.
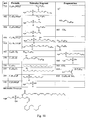
- FIGURE 16 shows the fragments obtained for the MS/MS analysis of the 751.5555 metabolite, along with its proposed structure.
- FIGURE 17 shows the fragments obtained for the MS/MS analysis of the 699.5198 metabolite, along with its proposed structure.
- FIGURE 18 shows the fragments obtained for the MS/MS analysis of the 723.5195 metabolite, along with its proposed structure.
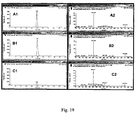
- FIGURE 19 shows the LC-MS and MS/MS analysis of the 751.5555 metabolite (18:0/20:4 EtnPls):
- Panel A1 is an extracted ion chromatogram (EIC) of parent ion 750 (M-H-) of a pure standard;
- panel A2 is MS/MS spectra of parent ion M/Z 750 @ retention time 4.8-5.0 minutes.
- Panel B1 is the EIC of parent ion 750 from a cognitively normal subject;
- panel B2 is the MS/MS spectra of parent ion M/Z 750 @ 4.8-5.0 min.
- Panel C1 is the EIC of parent ion 750 from an AD subject; and panel C2 is the MS/MS spectra of parent ion M/Z 750 @ 4.8-5.0 min.
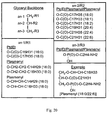
- FIGURE 20 shows the general structure of ethanolamine phospholipids, as well as the naming convention used herein.
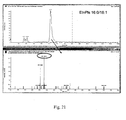
- FIGURE 21 is an extracted ion chromatogram (upper panel) and MS/MS spectrum (lower panel) of EtnPls 16:0/18:1 (M15) in human serum.
- FIGURE 22 is an extracted ion chromatogram (upper panel) and MS/MS spectrum (lower panel) of EtnPls 16:0/18:2 (M16) in human serum.
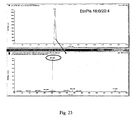
- FIGURE 23 is an extracted ion chromatogram (upper panel) and MS/MS spectrum (lower panel) of EtnPls 16:0/20:4 (M17) in human serum.
- FIGURE 24 is an extracted ion chromatogram (upper panel) and MS/MS spectrum (lower panel) of EtnPls 16:0/22:6 (M 19) in human serum.
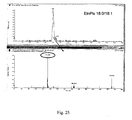
- FIGURE 25 is an extracted ion chromatogram (upper panel) and MS/MS spectrum (lower panel) of EtnPls 18:0/18:1 (M20) in human serum.
- FIGURE 26 is an extracted ion chromatogram (upper panel) and MS/MS spectrum (lower panel) of EtnPls 18:0/18:2 (M21) in human serum.
- FIGURE 27 is an extracted ion chromatogram (upper panel) and MS/MS spectrum (lower panel) of EtnPls 18:0/20:4 (M23) in human serum.
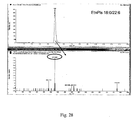
- FIGURE 28 is an extracted ion chromatogram (upper panel) and MS/MS spectrum (lower panel) of EtnPls 18:0/22:6 (M24) in human serum.
- FIGURE 29 is an extracted ion chromatogram (upper panel) and MS/MS spectrum (lower panel) of EtnPls 18:1/18:2 and Plasmanyl 16:0/20:4 (M07) in human serum.
- FIGURE 30 is an extracted ion chromatogram (upper panel) and MS/MS spectrum (lower panel) of EtnPls 20:0/20:4 and EtnPls 18:0/22:4 (M23) in human serum.
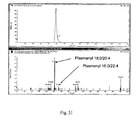
- FIGURE 31 is an extracted ion chromatogram (upper panel) and MS/MS spectrum (lower panel) of Plasmanyl 18:0/20:4 (M 12) and Plasmanyl 16:0/22:4 (M08) in human serum.
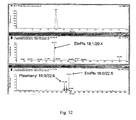
- FIGURE 32 is an extracted ion chromatogram (upper panel) and MS/MS spectrum (lower panels) of EtnPls 18:1/20:4, EtnPls 16:0/22:5, Plasmanyl 16:0/22:6 (M09) in human serum.
- FIGURE 33 shows a Q-Trap flow injection analysis standard curve of EtnPls 16:0/22:6 (M19) in healthy human serum.
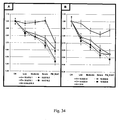
- FIGURE 34 shows ehe effect of dementia severity and SDAT pathology on serum EtnP1 levels (male and female subjects combined).
- A Mono and di-unsaturated EtnPls and saturated PtdEt internal control.
- B Polyunsaturated EtnPls and free DHA (22:6).
- EtnPls abbreviations: (fatty acid carbons : double bonds, not including the vinyl ether double bond) and position on glycerol backbone (sn-1/sn-2).
- FIGURE 35 shows serum DHA-EtnPls (Log(2) EtnPls 16:0/22:6 (M19) to PtdEt 16:0/18:0 (M01) ratio) distributions in subjects with different levels of dementia severity (male and female subjects combined).
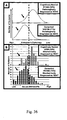
- FIGURE 36 is a comparison of theoretical distributions of AD pathology (A) compiled from references 5-8 and experimentally determined distributions of serum 22:6-containing EtnPls (Log(2) EtnPls 16:0/22:6 (M19) to PtdEt 16:0/18:0 (M01) ratio) (B) in cognitively normal and demented subjects. Arrow indicates positive diagnosis of AD.
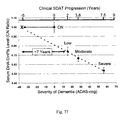
- FIGURE 37 is a linear regression analysis of disease severity (ADAS-cog) and serum 22:6-containing EtnPls (EtnPls 16:0/22:6 (M19) to PtdEt 16:0/18:0 (M01) ratio) levels in 256 AD subjects.
- FIGURE 38 shows serum 22:6-containing EtnPls (EtnPls 16:0/22:6 (M19) to PtdEt 16:0/18:0 (M01) ratio) levels in AD, Cognitive Normal, and general population subjects.
- EtnPls 16:0/22:6 (M19) to PtdEt 16:0/18:0 (M01) ratio serum 22:6-containing EtnPls (EtnPls 16:0/22:6 (M19) to PtdEt 16:0/18:0 (M01) ratio) levels in AD, Cognitive Normal, and general population subjects.
- B Log(2) distributions.
- FIGURE 39 shows the distribution of serum white and gray matter EtnP1 scores in males and females.
- the present invention relates to methods for diagnosing dementia.
- Such a method for identifying specific biomarkers for differentially diagnosing AD dementia, non-AD dementia, cognitive impairment, or a combination thereof comprises the steps of: introducing one or more than one sample from one or more than one patient with clinically diagnosed AD dementia, clinically diagnosed non-AD dementia, or significant cognitive impairment, said sample containing a plurality of metabolites into a high resolution mass spectrometer (for example, and without wishing to be limiting, a Fourier Transform Ion Cyclotron Resonance Mass Spectrometer (FTMS)); obtaining, identifying and quantifying data for the metabolites; creating a database of said identifying and quantifying data; comparing the identifying and quantifying data from the sample with corresponding data from a sample from a non-demented normal patient; identifying one or more than one metabolites that differ.
- the metabolite markers identified using the method may include the metabolites listed in Table
- a group of patients representative of the health state i.e. a particular disease
- a group of "normal" counterparts are required.
- Biological samples taken from the patients in the particular health-state category can then be compared to the same samples taken from the normal population as well as to patients in similar health-state category in the hopes of identifying biochemical differences between the two groups, by analyzing the biochemicals present in the samples using FTMS and/or LC-MS.
- the method for the discovery of metabolite markers as described above may be done using non-targeted metabolomic strategies or methods. Multiple non-targeted metabolomics strategies have been described in the scientific literature including NMR [18], GC-MS [19-21], LC-MS, and FTMS strategies [18, 22-24].
- the metabolic profiling strategy employed for the discovery of differentially expressed metabolites in the present invention was the non-targeted FTMS strategy by Phenomenome Discoveries [21,24-27; see also US Published Application No. 2004-0029120 A1 , Canadian Application No. 2,298,181 , and WO 0157518 ].
- Non-targeted analysis involves the measurement of as many molecules in a sample as possible, without any prior knowledge or selection of components prior to the analysis. Therefore, the potential for non-targeted analysis to discover novel metabolite biomarkers is high versus targeted methods, which detect a predefined list of molecules.
- a non-targeted method may be used to identify metabolite components in serum samples that differ between clinically diagnosed AD individuals and non AD individuals. The same technology was used to identify metabolite components that differ between clinically diagnosed AD individuals with dementia from clinically diagnosed non-AD individuals with dementia in CSF samples.
- differential diagnosis or “differentially diagnosing” it is meant that various aspects of a disease state may be distinguished from one another.
- the present invention allows for differential diagnosis a various states of dementia; for example and without wishing to be limiting, the present invention may provide differential diagnosis of AD dementia, non-AD dementia, cognitive impariment, or a combination thereof.
- AD dementia refers to dementia caused by Alzheimer's disease (AD, which may also be referred to herein as “SDAT”); types of “non-AD dementia” include, but are not limited to, dementia with Lewy bodies (DLB), frontotemporal lobe dementia (FTD), vascular induced dementia (e.g. multi-infarct dementia), anoxic event induced dementia (e.g.
- AD dementia dementia pugilistica [boxer's dementia]
- Autism Multiple Sclerosis, Parkinson's Disease, Bipolar Disorder, Ischemia, Huntington's Chorea, Major Depressive Disorder, Closed Head Injury, Hydrocephalus, Amnesia, Anxiety Disorder, Traumatic Brain Injury, Obsessive Compulsive Disorder, Schizophrenia, Mental Retardation, and/or Epilepsy.
- AD dementia and FTD and DLB non-AD dementias.
- Cognitive impairment can be assessed by any method known in the art.
- ADAS Alzheimer's Disease Assessment Scale
- This neuropsychological test is used to test the language ability (speech and comprehension), memory, ability to copy geometric figures and orientation to current time and place. Errors on the test are recorded resulting in a reverse score impairment (i.e., the higher the score on ADAS, the greater the cognitive impairment).
- a score of 0-15 is considered normal, 16-47 is considered mild-moderate impairment and a score of 48-70 is considered moderate-severe impairment [28].
- Another neuropsychological test Folstein's Mini-Mental State Exam (MMSE), which measures cognitive impairment, may be used.
- MMSE Folstein's Mini-Mental State Exam
- the MMSE is widely used and is an extensively validated test of orientation, short and long-term memory, praxis, language and comprehension.
- additional neuropsychological assessment that measure aspects of the same cognitive deficit, such as, but not exclusive to, the Blessed Roth Dementia Rating Scale, the 7-Minute Screen, Wechsler Memory Scale (WMS), Halstead-Reitan Battery, Rey Auditory Verbal Learning Test, California Verbal Learning Test, Buschke Selective Reminding Test, Boston Naming Test, Clinical Evaluation of Language Functioning, Peabody Picture Vocabulary Tests, Mattis Dementia Rating Scale, Memory Assessment Scale, Tests of Memory and Learning, Wide Range Assessment of Memory and Learning, can also be used.
- any imaging technique that has the potential to show a cognitive impairment or structural change such as, but not exclusive to, structural magnetic resonance imaging (MRI), positron emission tomography (PET), computerized tomography (CT), functional magnetic resonance imaging (fMRI), electroencephalography (EEG), single positron emission tomography (SPECT), event related potentials, magnetoencephalography, multi-modal imaging, would be measuring the structural/regional brain areas that are responsible for that cognitive deficit and AD pathology, and therefore, would be related to the metabolites disclosed in this invention.
- MRI structural magnetic resonance imaging
- PET positron emission tomography
- CT computerized tomography
- fMRI functional magnetic resonance imaging
- EEG electroencephalography
- SPECT single positron emission tomography
- event related potentials magnetoencephalography
- multi-modal imaging would be measuring the structural/regional brain areas that are responsible for that cognitive deficit and AD pathology, and therefore, would be related to the metabolites disclosed in this invention.
- a blood (serum/plasma) sample is used.
- samples that are serum While the term "serum” is used herein, those skilled in the art will recognize that plasma or whole blood or a sub-fraction of whole blood may also be used.
- a blood sample when drawn from a patient there are several ways in which the sample can be processed.
- the range of processing can be as little as none (i.e. frozen whole blood) or as complex as the isolation of a particular cell type.
- the most common and routine procedures involve the preparation of either serum or plasma from whole blood. All blood sample processing methods, including spotting of blood samples onto solid-phase supports, such as filter paper or other immobile materials, are also contemplated by the present invention.
- the processed blood or serum sample described above may then be further processed to make it compatible with the methodical analysis technique to be employed in the detection and measurement of the metabolites contained within the processed serum sample.
- the types of processing can range from as little as no further processing to as complex as differential extraction and chemical derivatization.
- Extraction methods could include sonication, soxhlet extraction, microwave assisted extraction (MAE), supercritical fluid extraction (SFE), accelerated solvent extraction (ASE), pressurized liquid extraction (PLE), pressurized hot water extraction (PHWE) and/or surfactant assisted extraction (PHWE) in common solvents such as methanol, ethanol, mixtures of alcohols and water, or organic solvents such as ethyl acetate or hexane.
- a method of particular interest for extracting metabolites for FTMS non-targeted analysis is to perform a liquid/liquid extraction whereby non-polar metabolites dissolve in an organic solvent and polar metabolites dissolve in an aqueous solvent.
- the extracted samples may be analyzed using any suitable method know in the art.
- extracts of biological samples are amenable to analysis on essentially any mass spectrometry platform, either by direct injection or following chromatographic separation.
- Typical mass spectrometers are comprised of a source which ionizes molecules within the sample, and a detector for detecting the ionized molecules or fragments of molecules.
- Non-limiting examples of common sources include electron impact, electrospray ionization (ESI), atmospheric pressure chemical ionization (APCI), atmospheric pressure photo ionization (APPI), matrix assisted laser desorption ionization (MALDI), surface enhanced laser desorption ionization (SELDI), and derivations thereof.
- Common mass separation and detection systems can include quadrupole, quadrupole ion trap, linear ion trap, time-of flight (TOF), magnetic sector, ion cyclotron (FTMS), Orbitrap, and derivations and combinations thereof.
- TOF time-of flight
- FTMS ion cyclotron
- the advantage of FTMS over other MS-based platforms is its high resolving capability that allows for the separation of metabolites differing by only hundredths of a Dalton, many which would be missed by lower resolution instruments.
- metabolic it is meant specific small molecules, the levels or intensities of which are measured in a sample, and that may be used as markers to diagnose a disease state. These small molecules may also be referred to herein as “metabolite marker”, “metabolite component”, “biomarker”, or “biochemical marker”.
- the metabolites are generally characterized by their accurate mass, as measured by mass spectormetry technique used in the above method.
- the accurate mass may also be referred to as "accurate neutral mass” or “neutral mass”.
- the accurate mass of a metabolite is given herein in Daltons (Da), or a mass substantially equivalent thereto. By “substantially equivalent thereto”, it is meant that a +/- 5 ppm difference in the accurate mass would indicate the same metabolite, as would be recognized by a person of skill in the art.
- the accurate mass is given as the mass of the neutral metabolite.
- the ionization of the metabolites which occurs during analysis of the sample, the metabolite will cause either a loss or gain of one or more hydrogen atoms and a loss or gain of an electron.
- This changes the accurate mass to the "ionized mass” which differs from the accurate mass by the mass of hydrogens and electrons lost or gained during ionization.
- the accurate neutral mass will be refered to herein.
- Data is collected during analysis and quantifying data for one or more than one metabolite is obtained.
- Quantifying data is obtained by measuring the levels or intensities of specific metabolites present in a sample.
- the quantifying data is compared to correponding data from one or more than one reference sample.
- the "reference sample” is any suitable reference sample for the particular disease state.
- the reference sample may be a sample from a non-demented control individual, i.e., a person not suffering from AD dementia, non-AD dementia or cognitive impairment (also refered to herein as a " 'normal' counterpart"); the reference sample may also be a sample obtained from a patient with clinically diagnosed with AD, a patient with clinically diagnosed non-AD dementia, or a patient diagnosed with significant cognitive impairment.
- more than one reference sample may be used for comparison to the quantifying data.
- the one or more than one reference sample may be a first reference sample obtained from a non-demented control individual.
- the one or more than one reference sample may further include a second reference sample obtained from a patient with clinically diagnosed AD-dementia, a third reference sample obtained from a patient with clinically diagnosed non-AD dementia, a fourth reference sample obtained from a patient suffering from significant cognitive impairment, or any combination thereof.
- novel compounds identified using the methods described herein.
- the novel compounds may be used as metabolite markers in the differential diagnosis of dementia, as described above.
- metabolites listed in Tables 1 to 7. These metabolites were identified in serum samples, and may be phosphatidylcholine-related compounds, ethanolamine plasmalogens, endogenous fatty acids, essential fatty acids, lipid oxidation byproducts, metabolite derivatives of said metabolite classes, and any metabolite that may contribute in any way to the anabolic/catabolic metabolism of said metabolite classes.
- an optimal panel of compounds may be indentified from those metabolites listed in Tables 1 to 7.
- the metabolite markers may be metabolites with accurate masses measured in Daltons of, or substantially equivalent to, 541.3432, 569.3687, 699.5198, 723.5195, 723.5197, 751.5555, 803.568, 886.5582.
- the metabolites of accurate masses 699.5198, 723.5195, 723.5197, and 751.555 have presently been identified as ethanolamine plasmalogens, and are specifically decreased in patients with AD dementia.
- the metabolite markers of accurate masses 541.3432, 569.3687, 803.568, and 886.5582 have presently been identified as phosphatidylcholine related metabolites, and are decreased in patients with cognitive impairment on ADAS-cog, and severity of cognitive impairment correlates to the degree of decrease.
- the metabolites with accurate masses measured in Daltons of, or substantially equivalent to, a) 541.3432, b) 569.3687, c) 699.5198, d) 723.5195, e) 751.5555, f) 803.568, can be further characterized by
- the ethanolamine plasmalogen metabolites (neutral masses 699.5198, 723.5195, 751.5555) and the phosphatidylcholine metabolites (neutral masses 699.5198, 723.5195, 751.5555) are decreased in the serum of AD subjects exhibiting significant cognitive impairment. This is the first report of serum-based changes in these metabolites associated with AD and dementia. It is further shown that the decrease in the disclosed serum phospatidylcholine related metabolites occurs in all patients exhibiting a significant cognitive impairment as measured by the ADAS-cog regardless of AD status, and that the degree of decrease correlates with the severity of the cognitive impairment. However, the observed decrease in disclosed ethanolamine plasmalogens is independent of cognitive impairment, occurs specifically in subjects with AD and is therefore a true diagnostic of AD.
- Ethanolamine plasmalogens are a type of ethanolamine phospholipid. Ethanolamine phospholipids can be further differentiated based on their sn-1 configurations (either acyl, ether, or vinyl ether). The sn-2 position is typically acyl and the sn-3 position contains the phosphoethanolamine moiety. Therefore, the three classes are described as either diacyl (also referred to herein as PtdEt), alkyl-acyl (also referred to herein as plasmanyl) or alkenyl-acyl (also referred to herein as EtnP1 or plasmenyl).
- Various basic structures of ethanolamine phospholipids are shown in Figure 20 , along with the standard naming convention used herein.
- a decrease in the disclosed ethanolamine plasmalogens may represent the initial or early stages AD, and can be detected non-invasively in living subjects by measuring serum levels of specific ethanolamine plasmalogens.
- cognitive impairment can be quantitated non-invasively by measuring the serum levels of specific phosphatidylcholine metabolites.
- metabolites have also been identified.
- the metabolites with accurate masses measured in Daltons of, or substantially equivalent to, a) 541.3432, b) 569.3687, c) 699.5198, d) 723.5195, e) 751.5555, f) 803.568 which may be further characterized by
- metabolites specific to AD dementia (accurate masses 699.5198, 723.5195, 723.5197, 751.555) as ethanolamine plasmalogens
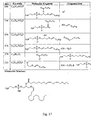
- metabolites M05 to M24 as listed and characterized (accurate mass, name/composition, molecular formula) in Table 18.
- the structure of the metabolite can be deduced based on the metabolite name as indicated in Table 18 and the nomenclature, as indicated in Figure 20 .
- those of particular interest include metabolites with accurate masses measured in Daltons of, or substantially equivalent to, a) 701.53591, b) 699.52026, c) 723.52026, d) 747.52026, e) 729.56721, f) 727.55156, g) 779.58286, and h) 775.55156, which can be further characterized by
- metabolites listed in Table 13 were identified in CSF samples. Of particular interest are the metabolites with accurate masses measured in Daltons of, or substantially equivalent to, 207.0822, 275.8712, 371.7311, 373.728, 432.1532, 485.5603, 487.6482, 562.46, 622.2539, 640.2637, 730.6493, 742.2972.
- the metabolite markers 207.0822, 432.1532, 562.46, 622.2539, 640.2637, 730.6493, and 742.2972 are increased in patients with AD dementia; and metabolite markers 275.8712, 371.7311, 373.728, 485.5603, and 487.6482 are decreased in patients with AD dementia.
- a method for assessing dementia or the risk of dementia in a patient comprises the steps of:
- the step of analyzing the sample (steb b)) may comprise analyzing the sample by liquid chromatography mass spectrometry (LC-MS).
- the step of analyzing the sample (step b)) may comprise analyzing the sample by linear ion trap mass spectrometry followed by liquid chromatograph, when the method is a highthroughput method.
- the one or more than one reference sample may include a first reference sample obtained from a non-demented control individual, a second reference sample obtained from a patient with cognitive impairment as measured by ADAS-cog, a third reference sample obtained from a patient with with cognitive impairment as measured by MMSE, or a combination of one or more of these.
- the one or more than one metabolite marker used to asses dementia or the risk of dementia may be selected from the metabolites listed in Tables 10-12, or a combination thereof.
- metabolites with accurate masses measured in Daltons of, or substantially equivalent to 541.3432, 569.3687, 699.5198, 723.5195, 723.5197, 751.5555, 803.568, 886.5582, 565.3394, 569.369, 801.555, 857.6186.
- a decrease in the patient sample in metabolite markers 699.5198, 723.5195, 723.5197, and 751.555 indicates AD pathology; a decrease in the patient sample in metabolite markers 541.3432, 569.3687, 803.568, and 886.5582 indicates cognitive impairment on ADAS-cog; and 565.3394, 569.369, 801.555, and 857.6186 indicates cognitive impairment on MMSE.
- the method comprising the steps of:
- the step of analyzing the sample may comprise analyzing the sample using a mass spectrometer (MS).
- MS mass spectrometer
- mass spectrometer could be of the FTMS, orbitrap, time of flight (TOF) or quadrupole types.
- the mass spectrometer could be equipped with an additional pre-detector mass filter.
- Q-FTMS quadrupole-FTMS
- Q-TOF quadrupole - TOF
- TQ or QQQ triple quadrupole
- MSn refers to the situation where the parent ion is fragmented by collision induced dissociation (CID) or other fragmentation procedures to create fragment ions, and then one or more than one of said fragments are detected by the mass spectrometer. Such framents can then be further fragmented to create further fragments.
- the sample could be introduced into the mass spectrometer using a liquid or gas chromatographic system or by direct injection.
- the one or more than one reference sample may be a first reference sample obtained from a non-demented control individual.
- the one or more than one reference sample may further include a second reference sample obtained from a patient with clinically diagnosed AD-dementia, a third reference sample obtained from a patient with clinically diagnosed non-AD dementia, a fourth reference sample obtained from a patient suffering from significant cognitive impairment, or any combination thereof.
- the sample and reference sample may be serum samples.
- the one or more than one metabolite marker may be selected from the metabolites as listed and characterized (accurate mass, name/composition, molecular formula) in Table 18.
- the "internal control metabolite” refers to an endogenous metabolite naturally present in the patient. Any suitable endogenous metabolite that does not vary over the disease states can be used as the internal control metabolite.
- the internal control metabolite may be phosphatidylethanolamine 16:0/18:0 (PtdEt 16:0/18:0, M01), as shown in Table 18; this internal control metabolite has a molecular formula of C 39 H 78 NO 8 P, and a structure characterized as
- those of particular interest in the above method include metabolites with accurate masses measured in Daltons of, or substantially equivalent to, a) 701.53591, b) 699.52026, c) 723.52026, d) 747.52026, e) 729.56721, f) 727.55156, g) 779.58286, and h) 775.55156.
- a decrease in the ratio of a) to h) to the internal control metabolite indicates AD dementia with a severe cognitive impairment.
- Also disclosed herein is a method for evaluating the efficacy of a therapy for treating dementia in a patient, comprising:
- a ratio for each of the one or more than one metabolite marker to an internal control metabolite may be obtained.
- each ratio of said one or more than one metabolite marker to the internal control metabolite to corresponding data obtained from one or more than one reference sample is compared to evaluate the efficacy of the therapy.
- the step of analyzing may comprise analyzing the sample by liquid chromatography mass spectrometry (LC-MS), or alternatively may comprise analyzing the sample by liquid chromatography and linear ion trap mass spectrometry when the method is a highthroughput method.
- LC-MS liquid chromatography mass spectrometry
- therapy it is meant any suitable course of therapy that may improve the health state or demented state of the patient being evaluated.
- the efficacy of the therapy the effect of the particular therapy in improving or degrading the health state of the patient will be measured. In doing so, a person of skill in the art would be capable of determining whether the therapy is effective for treating the demented state.
- the one or more than one reference sample may be any suitable reference sample.
- the reference sample may be a plurality of samples obtained from from non-demented control individuals; a plurality of samples obtained from clinically diagnosed AD patients; one or more than one pre-therapy baseline sample obtained from the patient; or any combination thereof.
- a pre-therapy baseline sample from the patient is particularly useful, as the variation in metabolites will then be specific to the patient.
- the sample and the reference sample may be serum samples.
- the one or more than one metabolite marker could be selected from the metabolites listed in Tables 1 to 7, or a combination thereof, for example, metabolite markers with accurate masses measured in Daltons of, or substantially equivalent to, 541.3432, 569.3687, 699.5198, 723.5195, 723.5197, 751.5555, 803.568, 886.5582.
- the metabolite markers may be selected from metabolites M05 to M24 with accurate masses of, or substantially equivalent to those listed in Table 18, for example, metabolites with accurate masses measured in Daltons of, or substantially equivalent to, 701.53591, 699.52026, 723.52026, 747.52026, 729.56721, 727.55156, 779.58286, and 775.55156.
- Metabolites M05-M24 could also be used when a ratio is obtained between the metabolites and the internal control metabolite; the internal metabolite could be, for example, metabolite M01, as described in Table 18.
- the sample and the reference sample may also be cerebrospinal fluid (CSF) samples.
- CSF cerebrospinal fluid
- the one or more than one metabolite marker could be selected from the metabolites listed in Table 13, or a combination thereof; for example, metabolites with accurate masses measured in Daltons of, or substantially equivalent to, 207.0822, 275.8712, 371.7311, 373.728, 432.1532, 485.5603, 487.6482, 562.46, 622.2539, 640.2637, 730.6493, 742.2972.
- the identified metabolites can be readily measured systemically. This point is of fundamental importance, since the majority of research pertaining to AD and other neurological disorders has ignored the peripheral systems.
- the ability to measure neurodegenerative processes within a blood sample is of substantial value in the diagnosis of dementia.
- these are a valid biochemical marker of AD pathology since this molecular species' content does not change in Parkinson's disease, a disease which is often accompanied by dementia [29].
- the specificity of the plasmalogen metabolites to AD indicates that its levels in serum could be readily measured longitudinally throughout the lifetime of an individual to assess the risk or for early detection of the disease prior to the emergence of clinical symptoms.
- the method may involve fragmentation of the parent molecule; in a non-limiting example, this may be accomplished by a Q-TrapTM system.
- Detection of the metabolites may be performed using one of various assay platforms, including colorimetric chemical assays (UV, or other wavelength), antibody-based enzyme-linked immunosorbant assays (ELISAs), chip-based and polymerase-chain reaction for nucleic acid detection assays, bead-based nucleic-acid detection methods, dipstick chemical assays or other chemical reaction, image analysis such as magnetic resonance imaging (MRI), positron emission tomography (PET) scan, computerized tomography (CT) scan, nuclear magnetic resonance (NMR), and various mass spectrometry-based systems.
- MRI magnetic resonance imaging
- PET positron emission tomography
- CT computerized tomography
- NMR nuclear magnetic resonance
- a high-throughput method for determining the levels of the metabolites in a person's blood and comparing the levels to levels in a normal "reference" population can lead to a prediction of whether the person has AD or not. This can be carried out in several ways. One way is to use a prediction algorithm to classify the test sample, as previously described, which would output a percentage probability for having AD. A predictive approach would work independently of the assay method, as long as the intensities of the metabolites could be measured. Another method could simply be based on setting a threshold intensity level from the mass spectrometer, and determining whether a person's profile is above or below the threshold which would indicate their AD status.
- a preferred method is a truly quantitative assay could be performed to determine the molar concentration of the six metabolites in the non-demented normal and AD population.
- An absolute threshold concentration could then be determined for AD-positivity. In a clinical setting, this would mean that if the measured levels of the metabolites, or combinations of the metabolites, were below a certain concentration, there would be an associated probability that the individual is positive for AD. Therefore, the optimal diagnostic test could comprise a method of measuring the intensities of the metabolites in serum, and an algorithm for taking the intensity values and outputting a predicted probability for having AD as well as for being healthy (i.e., AD-negative).
- biomarkers described herein based on small molecules or metabolites in a sample, fulfills the criteria identified in 1999 for an ideal screening test [82], as development of assays capable of detecting specific metabolites is relatively simple and cost effective per assay.
- the test is minimally invasive and is indicative of cognitive impairment and of AD pathology.
- Translation of the method into a clinical assay compatible with current clinical chemistry laboratory hardware is commercially acceptable and effective.
- the method of the present invention does not require highly trained personnel to perform and interpret the test.
- Differentially expressed metabolites were identified in clinically diagnosed AD with and without significant cognitive impairment, clinically diagnosed non-AD and non-demented controls.
- samples were obtained from representative populations of non-demented healthy individuals and of clinically diagnosed AD and non-AD dementia patients.
- the biochemical markers of AD described in the invention were derived from the analysis of 75 serum samples from patients clinically diagnosed with probable AD (43 patients with significant cognitive impairment, 32 with no cognitive impairment), serum samples from 30 patients with clinically diagnosed non-AD dementia, and 31 serum samples from non-demented controls. Samples in the three groups were from a diverse population of individuals, ranging in age, ethnicity, weight, occupation, and displaying varying non-dementia-related health-states. All samples were single time-point collections. Cognitive impairment of the patients was also assessed using the Alzheimer's Disease Assessment Scale (ADAS)-cognitive subset.
- ADAS Alzheimer's Disease Assessment Scale
- samples were obtained from a group of patients that represented clinically diagnosed AD with dementia and non-AD patients with dementia.
- the biochemical markers of AD described in this invention were derived from the analysis of 6 CSF samples from clinically diagnosed AD patients with dementia and 5 CSF samples from clinically diagnosed non-AD patients with dementia.
- Samples in both groups were from a diverse population of individuals, ranging in age, ethnicity, weight, occupation, and displaying varying non-dementia-related health-states. All samples were single time-point collections. The metabolites contained within the 136 serum samples and 11 CSF samples used in this application were separated into polar and non-polar extracts through sonication and vigorous mixing (vortex mixing).
- Mass Spectrometry Analysis Analysis of serum extracts collected from 136 individuals (75 clinically diagnosed AD, 30 clinically diagnosed non-AD, and 31 non-demented healthy controls) and 11 CSF extracts (6 clinically-diagnosed AD and 5 clinically diagnosed non-AD patients) was performed by direct injection into a FTMS and ionization by either ESI or atmospheric pressure chemical ionization (APCI) in both positive and negative modes. Sample extracts were diluted either three or six-fold in methanol:0.1 %(v/v) ammonium hydroxide (50:50, v/v) for negative ionization modes, or in methanol:0.1% (v/v) formic acid (50:50, v/v) for positive ionization modes.
- sample extracts were directly injected without diluting. All analyses were performed on a Bruker Daltonics APEX III Fourier transform ion cyclotron resonance mass spectrometer equipped with a 7.0 T actively shielded superconducting magnet (Bruker Daltonics, Billerica, MA). Samples were directly injected using electrospray ionization (ESI) and/or APCI at a flow rate of 1200 ⁇ L per hour. Ion transfer/detection parameters were optimized using a standard mix of serine, tetra-alanine, reserpine, Hewlett-Packard tuning mix and the adrenocorticotrophic hormone fragment 4-10.
- ESI electrospray ionization
- the instrument conditions were tuned to optimize ion intensity and broad-band accumulation over the mass range of 100-1000 amu according to the instrument manufacturer's recommendations.
- a mixture of the abovementioned standards was used to internally calibrate each sample spectrum for mass accuracy over the acquisition range of 100-1000 amu.
- Mass Spectrometry Data Processing Using a linear least-squares regression line, mass axis values were calibrated such that each internal standard mass peak had a mass error of ⁇ 1 p.p.m. compared with its theoretical mass. Using XMASS software from Bruker Daltonics Inc., data file sizes of 1 megaword were acquired and zero-filled to 2 megawords. A sinm data transformation was performed prior to Fourier transform and magnitude calculations. The mass spectra from each analysis were integrated, creating a peak list that contained the accurate mass and absolute intensity of each peak. Compounds in the range of 100-2000 m/z were analyzed.
- Tables 1-7 show biochemical markers whose concentrations or amounts in serum are significantly different (p ⁇ 0.05) between the tested populations and therefore have potential diagnostic utility for identifying each of the aforesaid populations.
- the features are described by their accurate mass and analysis mode, which together are sufficient to provide the putative molecular formulas and chemical characteristics (such as polarity and putative functional groups) for each metabolite.
- a combination of 8 metabolites fulfills the criteria for a serum dementia test: the combination can differentiate AD dementia from non-AD dementia, the early stages of AD and healthy controls.
- the best combination of 8 metabolites included the metabolites with neutral masses (measured in Daltons) 541.3432, 569.3687, 699.5198, 723.5195, 723.5197, 751.5555, 803.568, 886.5582. Although these are the actual masses, a person skilled in the art of this technology would recognize that +/- 5 ppm difference would indicate the same metabolite.
- MMSE Folstein's Mini-Mental State Exam
- a total of three 4-biomarker panels can be applied to the 136 patients to classify them into one of 8 categories which will simultaneously indicate the presence of AD pathology (biomarkers 699.5198, 723.5195, 723.5997, 751.5555), cognitive impaired on ADAS-cog (541.3432, 569.3687, 803.568, 886.5582) and cognitive impaired on MMSE (565.3394, 569.369, 801.555, 857.6186).
- each patient can be labeled using a 3 digit code from "000” indicating no cognitive impairment and no AD pathology to "111" indicating both MMSE and ADAS-cog impairment and AD pathology.
- Table 9 indicates the separation of the patient samples into the 8 categories.
- a student's t-test was performed between the different clinical groups (p ⁇ 0.05).
- the 116 metabolites that met the p-value criteria for AD vs. non-AD pathology are listed in Table 10.
- Table 11 lists the 124 metabolites that met the p-value criteria for high ADAS score vs. low ADAS score, and Table 12 contains the list of 344 metabolites that met the p-value criteria for impaired score on MMSE and normal cognition on MMSE.
- biomarkers associated with ADAS-cog score and/or MMSE are related to the ability to conceive of, organize and initiate unfamiliar sequences, the awareness of one's self and environment, as well as memory and language ability. As such, these biomarkers are not exclusive to cognitive impairment associated with dementia; rather any condition that results in any type of praxis, orientation, memory and/or language deficit would show a similar reduction within a biological sample.
- the sample set (136 individuals) used for this discovery was not trivial, and was comprised of individuals of various ethnic and geographical backgrounds, and of varying age and health status. Therefore, there is sound reason to expect that the findings are representative of the general dementia population.
- the 12 biomarker panel was tested using 5 CSF samples from undiagnosed patients. The only information available on the samples was the subject's age, gender, and whether an individual had a cognitive deficit. If the 12 biomarker panel was correct, the subject could be diagnosed as having AD dementia, non-AD dementia, or normal. From the 5 CSF samples provided by undiagnosed patients, 1 was diagnosed with non-AD dementia, 2 with AD dementia, and 2 as normal. The two normal subjects did not have a cognitive impairment as indicated by the Mini Mental State Examination (MMSE) score. Therefore, using a 12 metabolite feature set it was possible to both diagnose AD and non-AD dementia.
- MMSE Mini Mental State Examination
- FTMS-based platform was used in the identification and selection of the optimal metabolites in serum and CSF
- other methods of subsequently detecting the molecules including other MS-based platforms, ELISAs, colorimetric assays, etc can used to detect the molecules.
- An independent mass spectrometry method was used to verify the intensity differences between non-demented normal and clinically-diagnosed AD serums of the eight diagnostic metabolites discovered using the FTMS method.
- Eight representative clinically-diagnosed AD sample extracts and eight representative non-demented control sample extracts were analyzed by LC-MS using an HP 1100 high-performance liquid chromatography interfaced to an ABI Q-Star mass spectrometer.
- Aqueous fractions from five clinically-diagnosed AD and five non-demented control sample extracts were evaporated under nitrogen gas and reconstituted in 100 uL of methanol:water:formic acid (5:94.9:0.1).
- Five ⁇ L of the reconstituted sample was subjected to HPLC (Agilent Technologies) (HP 1100 with Metasil AQ 3u, 100 x 2 mm column) for full scan and 10 ⁇ L for MS/MS at a flow rate of 0.2 ml/min.
- Eluate from the HPLC was analyzed using an ABI Q-Star XL mass spectrometer fitted with a Turboion spray ion (ESI) source in negative mode.
- the scan type in full scan mode was time-of-flight (TOF) with an accumulation time of 1.0000 seconds, mass range between 50 and 1500 Da, and duration time of 70 min.
- Source parameters were as follows: Ion source gas 1 (GS 1) 55; Ion source gas 2 (GS2) 90; Curtain gas (CUR) 40; Nebulizer Current (NC) 0; Temperature 450°C; Declustering Potential (DP) -55; Focusing Potential (FP) -265; Declustering Potential 2 (DP2) -15.
- the extracted ion chromatograms (EICs) for the six biomarkers are shown in Figure 4
- the top panel shows the eight non-demented control EICs, and the bottom panel of each shows the eight clinically-diagnosed AD EICs.
- the sensitivity of the Q-star is superior to the FTMS, resulting in a greater magnitude in intensity difference between the non-demented control subjects and clinically diagnosed AD population for the selected biomarkers.
- Figure 5 shows the average raw intensity of the six biomarkers of the eight non-demented control and eight clinically-diagnosed AD samples as detected on the FTMS and Q-Star.
- metabolites and their associations with the clinical variables described in this invention are further confirmed using an independent mass spectrometry system.
- Representative sample extracts from each variable group are re-analyzed by LC-MS using an HP 1050 high-performance liquid chromatography, or equivalent interfaced to an ABI Q-Star, or equivalent mass spectrometer to obtain mass and intensity information for the purpose of identifying metabolites that differ in intensity between the clinical variables under investigation.
- Characteristics that can be used for structure elucidation of metabolites include accurate mass and molecular formula determination, polarity, acid/base properties, NMR spectra, and MS/MS or MSn spectra. These data, and in particular theMS/MS spectrum, can be used as fingerprints of a particular metabolite and are unique identifiers of a particular metabolite regardless of whether the complete structure has been determined.
- metabolite markers were extracted into an organic ethyl acetate fraction (plasmalogen metabolites), indicating that these metabolites are non-polar under acidic condition; one was extracted into an organic ethyl acetate fraction dried down and resuspended in butanol, indicating that this metabolite (plasmalogen metabolite) is non-polar under acidic conditions.
- phosphatidyl choline related metabolites did not extract into the organic fraction, but rather remained in the aqueous methanol/ammonium hydroxide fraction, indicating that these metabolites are very polar.
- MS / MS spectra The six serum metabolites identified as having the best diagnostic ability were subject to MS/MS fragmentation using collision induced dissociation (CID).
- CID collision induced dissociation
- the structure of a given molecule will dictate a specific fragmentation pattern under defined conditions that is specific for that molecule (equivalent to a person's fingerprint). Even slight changes to the molecule's structure can result in a different fragmentation pattern.
- the fragments generated by CID can be used to gain insights about the structure of a molecule, and for generating a very specific high-throughput quantitative detection method (see [30-33] for examples).
- Figures 6 through 11 show the MS/MS spectra for each of the six markers at -50V collision energy (CE) voltages.
- CE collision energy
- the metabolite markers specific to the ADAS-cog scores have been assigned structures having a phosphatidylcholine-related backbone. From the CID MS/MS, the molecular formulae of 3 metabolites specific to the ADAS-cog scores (accurate neutral masses of 541.3432, 569.3687, 803.568) were determined to be C 25 H 51 NO 9 P, C 27 H 55 NO 9 P, and C 43 H 81 NO 10 P, respectively. Their structures are shown in Figures 12-14 . The putative structures of additional markers are shown in Figure 15 .
- the 3 metabolites specific to AD pathology were analyzed using FT-ICRMS and LC/MS techniques, and by HRAPCI-MS, and MS/MS spectral analysis.
- Daughter ions determined from the fragmentation pattern for each metabolite marker are shown in figures 16-18 .
- the molecular formulae were determined to be C 43 H 78 NO 7 P, C 39 H 74 NO 7 P, and C 41 H 74 NO 7 P, respectively. Based on the fragmentation pattern and masses, the metabolite markers specific to AD patehology have been assigned structures having an ethanolamine plasmalogen backbone.
- the HRAPCI-MS m/z measured was 750.5482 ([M - H]-, calcd. 750.5477 for C 43 H 77 NO 7 P).
- the relative intensity of the MS/MS fragment masses (MS/MS m/z) were measured as follows: 750 ([M - H]-, 25%), 482 (1%), 464 (12%), 446 (5%), 329 (8%), 303 (100%), 259 (12%), 205 (8%), 140 (8%).
- the MS/MS fragments are shown in Figure 16 .
- the HRAPCI-MS m/z measured was 698.5125 ([M - H]-, calcd. 698.5130 for C 39 H 73 NO 7 P).
- the relative intensity of the MS/MS m/z were measured as follows: 698 ([M-H] - , 8%), 536 (4%), 279 (100%), 255 (15%), 119 (10%).
- the MS/MS fragments are shown in Figure 17 .
- the structure of the 699.5198 metabolite was determined to be 1-O-1'-(Z)-hexadecenyl-2-linoleyl-sn-glycero-3-phosphoethanolamine.
- the HRAPCI-MS m/z measured was 722.5124 ([M-H] - , calcd. 722.5130 for C 41 H 73 NO 7 P).
- the relative intensity of the MS/MS m/z were measured as follows: 722 ([M-H] - , 12%), 482 (1%), 436 (15%), 418 (6%), 303 (100%), 279 (6%), 259 (15%), 255 (10%), 205 (4%),140 (5%).
- the MS/MS fragments are shown in Figure 18 .
- NMR spectra The MS/MS fragmentation provides highly specific descriptive information about a metabolite.
- nuclear magnetic resonance (NMR) can assist in solving and confirming the structures of the metabolites.
- NMR analysis techniques are typically less sensitive than mass spectrometry techniques, multiple injections are performed on the HPLC and the retention time window corresponding to the metabolites of interest collected and combined. The combined extract is then evaporated to dryness and reconstituted in the appropriate solvent for NMR analysis.
- NMR techniques and instruments are available, for example, NMR spectral data are recorded on Bruker Avance 600 MHz spectrometer with cryogenic probe after the chromatographic separation and purification of the metabolites of interest.
- 1H NMR, 13C NMR, noe-difference spec, as well as 2-D NMR techniques like heteronuclear multiple quantum correlation (HMQC), and heteronuclear multiple bond correlation (HMBC) are used for structure elucidation work on the biomarkers.
- an Agilent 1100 HPLC system was used in combination with an Applied Biosystems QSTAR XL mass spectrometer.
- An Agilent Zorbax RX-SIL (4.6 x 150mm, 5 ⁇ m) column was used for normal phase chromatography.
- the column was heated to 35°C.
- the sample injection volume was 10 ⁇ L.
- Organic solvent extracts (ethyl acetate) of samples were evaporated to dryness under nitrogen gas and the residue was reconstituted in 100 ⁇ L of 55:40:5 isopropanol:hexane:H2O solution prior to injection.
- the QSTAR XL instrument was equipped with an APCI (Heated Nebulizer) source operating in negative mode. Values of major instrument parameters were DP, -60; FP, -265; DP2, -15; GS1, 75; GS2, 15; CUR, 30; NC, -3; TEM, 400°C; Scan range, 50-1500amu; Accumulation time, I sec.
- APCI Heated Nebulizer
- ethanolamine phospholipids are described as diacyl (also referred to herein as PtdEt), alkyl-acyl (also referred to herein as plasmanyl) or alkenyl-acyl (also referred to herein as EtnP1 or plasmenyl).
- Various basic structures of ethanolamine phospholipids are shown in Figure 20 , along with the standard naming convention used herein.
- Table 18 shows a list of plasmanyl and plasmenyl ethanolamine phospholipids (M5-M24) that are presently identified and are of particular interest.
- Figures 21-32 show structural information pertaining to selected metabolites detected in serum. These figures illustrate the retention time, MS/MS fragmentation patterns, and putative structures for selected molecules. Due to the conserved MS/MS fragmentation mechanism between these molecules, the theoretical MS/MS transition can be determined for any ethanolamine phospholipid by using a combination of the parent ion mass and the fragment mass of the moiety at either the sn-1 or sn-2 position.
- High throughput screening was performed with a linear ion trap mass spectrometer (Q-trap 4000, Applied Biosystem) coupled with Agilent 1100 LC system.
- Sample was prepared by adding 15uL of internal standard (5 ⁇ g/mL of (24-13C)-Cholic Acid in methanol) to 120uL ethyl acetate fraction of each sample.100 ul sample was injected by flow injection analysis (FIA), and monitored under negative APCI mode.
- FIA flow injection analysis
- the method was based on multiple reaction monitoring (MRM) scan mode of one parent/daughter transition for each metabolite and one internal standard. Each transition was scanned for 70 ms for a total cycle time of 2.475 sec.
- MRM multiple reaction monitoring
- the isocratic 10% EtOAc in MeOH elution was performed with a flow rate at 360 ⁇ l/min for 1min.
- the source parameters were set as follows: CUR: 10.0, CAD: 8, NC: -4.0, TEM: 400, GS1:30, GS2: 50, interface heater on.
- the compound parameters were set as follows: DP: -120.0, EP: - 10, NC: -4.0, CE: -40, CXP: -15.
- Figure 33 illustrates a representative standard curve for this method for EtnPls 16:0/22:6 generated by diluting a normal serum sample while maintaining a constant concentration of internal standard (24-13C)-Cholic Acid).
- the effect of age was evaluated using a set of aged 30 to 95 subjects of untested cognitive status who did not suffer from dementia. Subjects were divided into one of five subgroups based upon their decade of life (30's, 40's, 50's, 60's, and ⁇ 70). The 40-49 cohort was used as the pre-dementia reference group due to the low incidence of dementia at this age. The metabolites of interest (see Table 18) were measured using the high throughput method described in Example 5.
- MMSE ⁇ 28 cognitively confirmed non-demented subjects
- ADAS-cog 6-70 MMSE 0-26
- 20 post-mortem confirmed SDAT 20 post-mortem confirmed controls.
- Brain white matter contains primarily 18:1- and 18:2-containing EtnPls with low levels of 20:4-containing and 22:6-containing EtnPls, whereas gray matter contains significantly higher levels of 20:4-containing and 22:6-containing EtnPls [34].
- increasing dementia appears to affect both white (18:2) and gray (20:4) matter EtnPls equally, whereas in males predominantly gray (22:6) matter EtnPls appear to be affected to a greater extent.
- Post-mortem collected serum samples from 20 pathologically confirmed AD subjects and 20 subjects containing minimal amyloid deposition were also analyzed. Both gray and white matter EtnPls were significantly decreased in post-mortem confirmed AD relative to age matched controls (see Tables 30 and 31).
- EtnPls to M01 ratios of all eight EtnPls (16:0/18:1 (M15), 16:0/18:2 (M16), 16:0/20:4 (M17), 16:0/22:6 (M19), 18:0/18:1 (M20), 18:0/18:2 (M21), 18:0/20:4 (M22), 18:0/22:6 (M24)) were significantly lower in the severely demented group relative to the low group while six of the eight were significantly lower in the severe group relative to the moderate group
- Example 7 The Grey and White Matter Score Distribution
- a white and gray matter specific EtnPl scoring system was developed whereby each EtnPl in each subject was normalized to their respective gender-specific cognitively normal mean, log2 transformed and mean centered.
- Each subject's white matter score was taken as the lowest such value of plasmenyl 16:0/18:1 (M15), 16:0/18:2 (M 16), 18:0/18:1 (M20), and 18:0/18:2 (M21) EtnPls, and their gray matter score as the lowest of plasmenyl 16:0/20:4 (M17), 16:0/22:6 (M19), 18:0/20:4 (M22), and 18:0/22:6 (M24) EtnPls.
- risk prediction can be performed on both male and female subjects (Tables 49-50) where a cut-off value that results in approximately 20-30% of cognitively normal subjects being classified as either intermediate or high risk is used. Using this cut-off value, a subject's white and gray matter score is evaluated. If the subject tests normal on both scores, the subject is deemed to be at low risk. If the subject tests positive on one of the scores, the subjects is deemed to be at intermediate risk and if the subject tests positive on both scores, the subject is deemed to be at high risk.
- the effect of dementia severity was determined using 324 subjects (176 female, 148 male) aged 56 to 95, comprised of 68 cognitively confirmed non-demented subjects (MMSE ⁇ 28) and 256 subjects currently diagnosed with AD (ADAS-cog 6-70, MMSE 0-26).
- Example 9 Population Distributions as a Function of Dementia Severity
- the serum 22:6-containing EtnPls levels in 209 subjects 110 male, 99 female, Table 19 of unknown cognitive status but currently not diagnosed with dementia was determined and compared to the clinical AD and CN cohorts ( Figure 38 ).
- the results of this analysis revealed a significant drop in serum 22:6-containing EtnPls in the aged 60-69 cohort versus the aged 50-59 cohort ( Figure 38A ).
- This cohort also had significantly lower levels versus the CN group even though the CN group was, on average, 13 years older.
- the aged 70-95 cohort was not significantly different from either the aged 50-59 cohort or the CN cohort, but had significantly higher levels than the SDAT cohort.
- the populations were assigned as: P1 - subjects with AD pathology and no remaining reserve capacity; P3 - subjects with little or no AD pathology; P2 - subjects that are transitioning from P3 to P1. These P2 subjects are hypothesized to have AD pathology and some level of reserve remaining.
- AD subjects have a life expectancy of less than 10 years from diagnosis [38, 39] and low 22:6-containing EtnPls are highly associated with AD severity
- the decreased number of P1 subjects observed in the aged 70-95 cohort is most likely due to differences in life expectancy between P1 and P2 or P3.
- the transitory nature of P2 is best illustrated by examining the different ratios between the percentages of subjects present in P3 compared to P2, as observed in the lower three panels of Figure 7B . These three cohorts differ only in dementia status.
- the P3 to P2 ratio changes from 3:1 (68% versus 22%) in the confirmed cognitive normal group to an intermediate ratio of 1:1 (43% versus 46%) in the normal healthy elderly group of unknown cognitive status, to 0.6:1 (25% versus 40%) in the confirmed demented AD cohort.
- Table 1 Accurate mass features differing between clinically diagnosed AD patients and non-demented controls (p ⁇ 0.05, log2 transformed).
- Detected Mass Analysis Mode AVG (log2) AD SEM AD AVG (log2) Normal SEM Normal log(2) Ratio P Value 723.5197 1204 3.576 0.039 4.350 0.056 0.822 5.09E-19 723.5195 1202 2.186 0.040 2.892 0.052 0.756 4.86E-17 724.5257 1204 2.866 0.032 3.463 0.055 0.828 4.15E-16 749.5367 1202 3.176 0.034 3.714 0.041 0.855 3.82E-15 751.5555 1204 4.575 0.041 5.248 0.060 0.872 1.07E-14 751.5529 1202 3.335 0.036 3.920 0.050 0.851 1.14E-14 752.5564 1202 2.251 0.038 2.836 0.050 0.794 3.13E-14 752.5583 1204 3.472 0.042 4.094 0.061 0.848 6.47
- Table 2 Accurate mass features differing between clinically diagnosed AD patients with a significant cognitive impairment and non-demented controls (p ⁇ 0.05, log2 transformed).
- Table 4 Accurate mass features differing between clinically diagnosed AD patients with a significant cognitive impairment and clinically diagnosed AD patients without a significant cognitive impairment (p ⁇ 0.05, log2 transformed).
- Detected Mass Analysis Mode AVG (log2) AD SEM AD AVG (log2) AD noCog SEM AD noCog log(2) Ratio P Value 541.3432 1102 3.138 0.034 3.518 0.039 0.892 3.47E-10 569.3687 1102 2.063 0.042 2.479 0.045 0.832 3.90E-09 829.5856 1102 3.806 0.059 4.301 0.048 0.885 1.30E-08 567.3547 1102 2.629 0.050 3.031 0.045 0.868 1.02E-07 831.5997 1102 4.372 0.055 4.774 0.042 0.916 1.93E-07 832.6026 1102 3.268 0.055 3.662 0.042 0.892 2.67E-07 804.5713 1102 4.017 0.048 4.426
- Table 5 Accurate mass features differing between clinically diagnosed non-AD patients and non-demented controls (p ⁇ 0.05, log2 transformed).
- Detected Mass Analysis Mode AVG (log2) NON-AD SEM NON-AD AVG (log2) Normal SEM Normal log(2) Ratio P Value 541.3432 1102 3.255 0.043 3.679 0.048 0.885 3.43E-12 567.3547 1102 2.621 0.052 3.117 0.054 0.841 2.78E-11 805.5605 1101 5.159 0.072 5.604 0.048 0.921 1.08E-09 806.5639 1101 4.150 0.073 4.630 0.049 0.896 1.51E-09 804.5713 1102 4.159 0.056 4.466 0.033 0.931 3.79E-09 783.5672 1101 3.515 0.077 4.126 0.079 0.852 4.13E-09 781.5617 1101 5.919 0.072 6.403 0.072 0.924 4.19E-09 780.5474 1101
- Table 6 Accurate mass features differing between clinically diagnosed AD patients with a mild cognitive impairment and non-demented controls (p ⁇ 0.05, log2 transformed).
- Detected Mass Analysis Mode AVG (log2) AD noCog SEM AD noCog AVG (log2) Normal SEM Normal log(2) Ratio P Value 723.5197 1204 3.576 0.058 4.350 0.056 0.822 6.42E-14 723.5195 1202 2.181 0.056 2.892 0.052 0.754 2.49E-13 751.5529 1202 3.293 0.050 3.920 0.050 0.840 1.39E-12 724.5257 1204 2.883 0.044 3.463 0.055 0.833 9.96E-12 749.5367 1202 3.168 0.051 3.714 0.041 0.853 1.33E-11 752.5564 1202 2.216 0.057 2.836 0.050 0.781 1.91E-11 751.5555 1204 4.553 0.060 5.248 0.060 0.868 1.96E-11 750.5402 1202 2.175
- Table 7 Accurate mass features differing between dementia patients with a significant cognitive impairment (ADAS ⁇ 16) and dementia patients with a mild cognitive impairment (ADAS ⁇ 15) (p ⁇ 0.05, log2 transformed).
- Detected Mass Analysis Mode AVG (log2) ADAS high SEM ADAS HIGH AVG (log2) ADAS LOW SEM ADAS LOW log(2) Ratio P Value 541.3432 1102 3.155 0.038 3.581 0.054 0.881 6.71E-09 567.3547 1102 2.633 0.052 3.122 0.058 0.843 3.84E-08 569.3687 1102 2.079 0.053 2.526 0.054 0.823 2.41E-07 829.5856 1102 3.861 0.057 4.303 0.059 0.897 1.71E-06 565.3394 1102 3.268 0.064 3.784 0.081 0.864 3.73E-06 837.5027 1101 3.373 0.056 3.818 0.070 0.884 4.53E-06 8
- Table 8 Accurate mass features differing between patients with mild cognitive impairment (MMSE 18-23), severe cognitive impairment (MMSE ⁇ 17) and normal cognitive ability (MMSE ⁇ 28) as measured on the MMSE.
- Table 9 Grouping of patients into one of 8 groups based on the presence of AD pathology, ADAS score and MMSE score. A score of 1 was given for the presence of AD pathology, high ADAS score ( ⁇ 16), or low MMSE score ( ⁇ 23); a score of 0 was given in the absence of AD pathology, low ADAS score ( ⁇ 15), or high MMSE score ( ⁇ 28).
- Table 11 Accurate mass features differing between patients showing the best discrimination between high ADAS score and low ADAS score (p ⁇ 0.05, log2 transformed).
- Detected Mass Analysis Mode AVG (log2) high ADAS SEM high ADAS AVG (log2) low ADAS SEM low ADAS log(2) Ratio P Value 541.3435 1102 3.007 0.047 3.741 0.083 0.804 5.76E-09 569.3685 1102 1.862 0.065 2.686 0.070 0.693 9.27E-09 804.5713 1102 3.915 0.047 4.494 0.080 0.871 3.59E-07 803.5681 1102 5.145 0.046 5.720 0.084 0.899 5.31E-07 837.5027 1101 3.257 0.058 3.866 0.070 0.842 5.33E-07 807.5758 1101 5.318 0.076 6.045 0.065 0.880 5.92E-07 808.5792 1101 4.265 0.076 4.992 0.0
- Table 12 Accurate mass features differing between patients showing the best discrimination between high MMSE score and low MMSE score (p ⁇ 0.05, log2 transformed).
- Detected Mass Analysis Mode AVG (log2) low MMSE SEM low MMSE AVG (log2) high MMSE SEM high MMSE log(2)
- Ratio P Value 505.3229 1202 3.585 0.045 4.514 0.053 0.794 3.90E-15 857.6186 1202 3.339 0.058 4.298 0.053 0.777 5.05E-14 803.5678 1202 6.747 0.056 7.962 0.082 0.847 5.19E-14 858.6211 1202 2.300 0.058 3.221 0.059 0.714 6.73E-13 566.3434 1202 4.856 0.055 5.682 0.055 0.855 1.90E-12 801.555 1202 2.220 0.057 3.128 0.064 0.710 2.89E-12 832.6036 1202 4.692 0.057 5.569 0.061
- Table 13 Accurate mass features differing between clinically diagnosed AD and non-AD patients in CSF (p ⁇ 0.05, log2 transformed).
- Detected Mass Analysis Mode AVG (log2) AD SEM AD AVG (log2) non-AD SEM non-AD log(2) Ratio P Value 742.2972 1203 1.187 0.130 0.000 0.000 1.187 1.69E-05 562.46 1203 1.080 0.134 0.000 0.000 1.080 4.84E-05 731.653 1203 0.905 0.193 0.000 0.000 0.905 0.0022 432.1532 1203 1.445 0.125 0.880 0.053 0.609 0.0037 487.6482 1101 2.388 0.044 2.668 0.057 1.117 0.0037 275.8712 1101 2.362 0.057 2.664 0.058 1.128 0.0045 371.7311 1101 3.417 0.098 3.818 0.022 1.117 0.0053 622.2539 1203 2.667 0.110 2.166 0.074 0.812 0.0056
- Qstar-detected The detected mass from the ABI Q-Star XL. delta: The difference between the theoretical and neutral mass.
- diff The mass difference between the Qstar-detected parent ion mass and the Qstar-detected fragmant ion mass.
- Loss The putative molecular formulas of the " diff " column Note: These are only predicted formulas for each fragment and are not necessarily the actual formulas.
Landscapes
- Chemical & Material Sciences (AREA)
- Health & Medical Sciences (AREA)
- Life Sciences & Earth Sciences (AREA)
- Engineering & Computer Science (AREA)
- General Health & Medical Sciences (AREA)
- Biochemistry (AREA)
- Molecular Biology (AREA)
- Organic Chemistry (AREA)
- Biomedical Technology (AREA)
- Immunology (AREA)
- Physics & Mathematics (AREA)
- General Physics & Mathematics (AREA)
- Analytical Chemistry (AREA)
- Hematology (AREA)
- Urology & Nephrology (AREA)
- Pathology (AREA)
- Food Science & Technology (AREA)
- Medicinal Chemistry (AREA)
- Medical Informatics (AREA)
- Proteomics, Peptides & Aminoacids (AREA)
- Neurosurgery (AREA)
- Epidemiology (AREA)
- Microbiology (AREA)
- Primary Health Care (AREA)
- Public Health (AREA)
- Neurology (AREA)
- Cell Biology (AREA)
- Biotechnology (AREA)
- Biophysics (AREA)
- Electrochemistry (AREA)
- Chemical Kinetics & Catalysis (AREA)
- Other Investigation Or Analysis Of Materials By Electrical Means (AREA)
- Investigating Or Analysing Biological Materials (AREA)
- Medicines Containing Antibodies Or Antigens For Use As Internal Diagnostic Agents (AREA)
- Medicines That Contain Protein Lipid Enzymes And Other Medicines (AREA)
Abstract
Description
- The present invention relates to small molecules or metabolites that are found to have significantly different abundances between clinically diagnosed dementia or other neurological disorders, and normal patients. The present invention also relates to methods for diagnosing dementia and other neurological disorders.
- The most severe consequence of the aging brain is dementia, which is defined in the Diagnostic and Statistical Manual of Mental Disorders, 4th edition (DSM-IV) as
- "the development of multiple cognitive deficits that included memory impairment and at least one of the following cognitive disturbances: aphasia, apraxia, agnosia, or a disturbance in executive functions. The cognitive impairment must be sufficiently severe to cause impairment in occupational or social functioning and must represent a decline from a previously higher level of functioning." [1]
- The number of elderly people is increasing rapidly within our society and as a consequence, dementia is growing into a major health problem. In 1991, the Canadian Study of Health and Aging had estimated 25% of the population over the age of 65 had a form of dementia. The study also estimated the number of people living with dementia will double and triple in Canada by 2011 and 2031, respectively [2].
- The clinical manifestation of dementia can result from neurodegeneration (e.g. Alzheimer's Disease [AD], dementia with Lewy bodies [DLB] and frontotemporal lobe dementia [FTLD]), vascular (e.g. multi-infarct dementia) or anoxic event (e.g. cardiac arrest), trauma to the brain (e.g. dementia pugilistica [boxer's dementia]), or exposure to an infectious (e.g. Creutzfeldt-Jakob Disease) or toxic agent (e.g. alcohol-induced dementia) [3].
- AD is the most common cause of dementia, followed by vascular dementia (VaD), DLB and FTLD [4]. The differential diagnosis of the types of dementia is not straightforward, and is typically based on exclusion of other disorders [5]. For example, blood chemistry values are measured to determine if Vitamin B12 deficiency, anemia, infection, venereal disease or thyroid disorder may be possible reasons for the dementia symptoms. Various neuroimaging techniques may be employed, such as magnetic resonance imaging or computerized tomography scans to determine if the symptoms may be due to the presence of a tumor, infection or vascular event [4].
- If the dementia symptoms can not be explained by another disorder, a diagnosis of AD, DLB or FTLD is made exclusively based on the clinical symptoms (e.g. frequency of falls, rapid onset, presence of visual or auditory hallucinations, etc). It is not until a histopathological evaluation of the brain during autopsy is performed that a definitive diagnosis can be obtained [5-7]. A prospective study on the prevalence of AD in people over the age of 85 indicated that more than half of the individuals with neuropathological criteria for AD were either non-demented or were incorrectly diagnosed with VaD. As well, 35% of those individuals diagnosed with AD based on clinical features were incorrectly diagnosed as the neuropathological evaluation did not support that diagnosis [8]. The degree of misdiagnosis is understandable since the clinical symptoms of the various dementias often overlap and is dependent upon whether the pertinent information is made known to the clinician.
- The different types of dementias are based on specific neuropathological features. A definitive diagnosis of AD relies on the deposition of two types of neuronal protein: tau in the form of intraneuronal neurofibrillary tangles (NFTs) and the accumulation of extracellular β-amyloid to form senile plaques (SPs). Tau is important for the formation of microtubules in the neuronal axon by binding and promoting polymerization of tubules. In AD, tau becomes hyperphosphorylated thereby disrupting its main function. The tau accumulates and forms tangles within the axon. The neuron can no longer function and dies. Tau protein is released into the extracellular space where it can be detected in the cerebrospinal fluid (CSF) [9]. The formation of SPs, however, is due to the accumulation of a 40 and 42 residue protein β-amyloid from amyloid precursor protein (APP) [10]. The formation and secretion of β-amyloid is closely regulated by homeostasis, but something occurs in AD that disrupts homeostasis resulting in the accumulation of the protein within the brain and disrupting the neurons within its vicinity [11-12]. The increased amount of tau and the absence of β-amyloid in CSF have been proposed as possible diagnostic markers for AD, but results have not been consistent. The problem may be due to the presence ofNFTs and SPs that increase in number during normal aging [13]. In order for the NFTs and SPs to be diagnostic of AD, they must be localized together in specific areas of the brain (neocortex and limbic region) [12]. SPs without NFTs are present in the same area in individuals with mild cognitive impairment (MCI) and in 27% of non-demented individuals greater then 75 years old [13].
- A diagnosis of DLB is based on the presence of protein deposits called alpha-synuclein, which is referred to as Lewy Bodies, within brainstem and cortical neurons [6]. The cognitive deficit corresponds to the amount of Lewy Bodies within the brain.
- FTLD is not characterized by a specific neuropathological feature. Typically, areas of the frontal/temporal cortices have neuronal loss, spongiform changes (microvacuolation) and severe astrocytic gliosis. The clinical symptoms in FTLD are dependent upon where the pathology is found rather than the type of pathology [7].
- Currently, various neuropsychological tests are used to help diagnose dementia. For example, the Alzheimer's Disease Assessment Scale (ADAS)-cognitive subset is used to test the language ability (speech and comprehension), memory, ability to copy geometric figures and orientation to current time and place. The Folstein's Mini-Mental State Exam (MMSE), which also measures cognitive impairment, is an extensively validated test of orientation, short and long-term memory, praxis, language and comprehension. While these tests may indicate the level of cognitive impairment in an individual, they give no indication of whether the dementia may be caused by AD or by non-AD dementias.
- It is commonly accepted that by the time any symptom is evident in any of the dementias described, irreversible neuronal loss has occurred [14]. MCI is characterized by a prominent impairment in memory with normal cognitive functions [15]. MCI is considered a transitional stage between normal aging and several types of dementia since a large proportion of individuals with MCI are later diagnosed with AD, DLB, or FTLD and all individuals with fully developed dementia first exhibit mild dementia symptoms similar to MCI [16].
- There is a need to objectively differentiate the types of dementia from one another. Preferably, such a method would be specific, accurate, and efficient. Clearly, there is a pressing need for differential diagnosis of dementia prior to autopsy.
- A biomarker that could detect neuropathological changes prior to clinical symptoms would be of enormous value. A consensus was reached in 1999 [17] as to what would be expected in a biomarker in AD:
- 1. Detect a fundamental feature of neuropathology
- 2. Diagnostic sensitivity of >80 % for detecting AD
- 3. Specificity of >80% for distinguishing other dementias
- 4. Reliable
- 5. Reproducible
- 6. Noninvasive
- 7. Simple to perform
- 8. Inexpensive
- The identification of AD-specific biomarkers in human serum would be extremely useful since it would be noninvasive and could be used to detect the presence of AD pathology prior to the manifestation of clinical symptoms and differentiate those patients who may have a different form of dementia but similar clinical symptoms.
- Suremaru et al. Life Sc., vol. 53, pages 697-706 (1993) disclose a study in which cerebrospinal fluid (CSF) levels of corticotropin-releasing hormone (CRH) and ACTH, plasma levels of ACTH and cortisol, and serum levels of phospholipid and its fractions were determined in samples taken simultaneously from patients with senile dementia of the Alzheimer type (SDAT), multi-infarct dementia (MID) or dementia following a cerebrovascular accident (CVD), and the borderline-to-normal control subjects. CRH levels in CSF were significantly reduced in patients with SDAT and CVD but not with MID compared to the borderline-to-normal controls. ACTH levels in CSF were significantly reduced in SDAT compared to MID. The levels of circulating lecithin (phosphatidyl-choline) were depressed in a similar fashion to the levels of CRH in CSF in the SDAT patients and the group of severe dementia. Dementia and its severity did not affect the morning plasma levels of ACTH and cortisol. CSF CRH was positively correlated with CSF ACTH, while CSF ACTH was negatively correlated with plasma cortisol. No significant correlations were found between serum lecithin and CSF CRH or ACTH. These findings suggest that: 1) abnormalities in the extrahypothalamic CRH system play a role in the pathophysiology of senile dementia, which may not be specific to SDAT; 2) the CRH system and the ACTH system correlate with each other within the brain; 3) CSF ACTH is subject to the feedback inhibition by circulating cortisol; and 4) in the SDAT patients and the severe dementia group CSF CRH and serum lecithin are reduced probably via independent mechanisms.
- Ginsberg, et al. Brain Research, vol. 698, pages 223-226 (1995) discloses identified a significant and selective deficiency of ethanolamine plasmalogen (PPE) relative to phosphatidylethanolamine in post mortem brain samples from patients with Alzheimer's disease (AD). This lipid defect showed anatomic specificity, being more marked at a site of neurodegeneration in AD brain than in a region relatively spared by the disease (mid-temporal cortex vs. cerebellum) and disease specificity for AD: it was not observed at the primary site of neurodegeneration in Huntington's disease (caudate nucleus) nor Parkinson's disease (substantia nigra). PPE deficiency parallels an inherent tendency towards membrane bilayer instability previously detected in AD brain which is necessarily due to a change in membrane lipid composition, and which may contribute to AD pathogenesis.
- Farooqui, et al.Neurochemical Research, vol. 22, pages 523-527 (1997) discloses that ethanolamine plasmalogens are decreased whereas serine glycerophospholipids are significantly increased in plasma membrane phospholipid in affected regions of brain in Alzheimer's disease. This may be due to stimulation of Ca2+-independent plasmalogen-selective phospholipase A2, which was recently discovered in brain. This phospholipase A2 differs from other Ca2+-independent phospholipases A2 in response to ATP and various inhibitors. It may be responsible for excess release of arachidonic acid and accumulation of prostaglandins and lipid peroxides in AD. Accumulation of the above lipid metabolites due to abnormal receptor function and signal transduction may contribute to neurodegeneration in AD.
- Han, et al. Journal of Neurochemistry, vol. 77, pages 1168-1180 (2001) discloses a study to explore the hypothesis that alterations in ethanolamine plasmalogen may be directly related to the severity of dementia in Alzheimer's disease (AD), we performed a systematic examination of plasmalogen content in cellular membranes of gray and white matter from different regions of human subjects with a spectrum of AD clinical dementia ratings (CDR) using electrospray ionization mass spectrometry (ESI/MS). The results demonstrate: (1) a dramatic decrease in plasmalogen content (up to 40 mol% of total plasmalogen) in white matter at a very early stage of AD (i.e. CDR 0.5); (2) a correlation of the deficiency in gray matter plasmalogen content with the AD CDR (i.e. approximately 10 mol% of deficiency at CDR 0.5 (very mild dementia) to approximately 30 mol% of deficiency at CDR 3 (severe dementia); (3) an absence of alterations of plasmalogen content and molecular species in cerebellar gray matter at any CDR despite dramatic alterations of plasmalogen content in cerebellar white matter. Alterations of ethanolamine plasmalogen content in two mouse models of AD, APP(V717F) and APPsw, were also examined by ESI/MS. A plasmalogen deficiency was present (up to 10 mol% of total plasmalogen at the age of 18 months) in cerebral cortices, but was absent in cerebella from both animal models. These results suggest plasmalogen deficiency may play an important role in the AD pathogenesis, particularly in the white matter, and suggest that altered plasmalogen content may contribute to neurodegeneration, synapse loss and synaptic dysfunction in AD.
- The present invention relates to small molecules or metabolites that are found to have significantly different abundances between clinically diagnosed dementia or other neurological disorders, and normal patients. The present invention also relates to methods for diagnosing dementia.
- The present invention provides a method for diagnosing dementia or the risk of dementia in a patient, the method comprising the steps of:
- a) analyzing a blood sample from said patient to obtain quantifying data for one or more than one metabolite marker;
- b) comparing the quantifying data for said one or more than one metabolite marker to corresponding data obtained for one or more than one reference sample to identify an increase or decrease in the level of said one or more than one metabolite marker in said blood sample; and
- c) using said increase or decrease in the level of said one or more than one metabolite marker in said blood sample to diagnose dementia or the risk of dementia in said patient,
- Suitably, the plasmanylethanolamine of paragraph [0021] is selected from the group consisting of: plasmanyl 16:0/18:1, plasmanyl 16:0/18:2, plasmanyl 16:0/20:4, plasmanyl 16:0/22:4, plasmanyl 16:0/22:6, plasmanyl 18:0/18:1, plasmanyl 18:0/18:2, plasmanyl 18:0/20:4, plasmanyl 18:0/22:4, plasmanyl 18:0/22:6, and combinations thereof.
- Suitably, the plasmenylethanolamine of paragraph [0021] is selected from the group consisting of: plasmenyl 16:0/18:1, plasmenyl 16:0/18:2, plasmenyl 16:0/20:4, plasmenyl 16:0/22:4, plasmenyl 16:0/22:6, plasmenyl 18:0/18:1, plasmenyl 18:0/18:2, plasmenyl 18:0/20:4, plasmenyl 18:0/22:4, plasmenyl 18:0/22:6, and combinations thereof.
- Suitably, diagnosing dementia or the risk of dementia in a patient comprises diagnosing a patient's Alzheimer's disease health state or change in health state, Alzheimer's disease, non-Alzheimer's disease dementia, cognitive impairment, the risk of Alzheimer's disease, the risk of cognitive impairment, or the risk of non-Alzheimer's disease dementia in a patient
- Suitably step a) comprises analyzing the blood sample by mass spectrometry to obtain the quantifying data using a Fourier transform ion cyclotron resonance, time of flight, orbitrap, quadrupole or triple quadrupole mass spectrometer.
- Suitably, the mass spectrometer of paragraph [0025] is equipped with a chromatographic system.
- Suitably, the blood sample is a blood serum sample.
- Suitably, a liquid/liquid extraction is performed on the blood sample whereby non-polar metabolites are dissolved in an organic solvent and polar metabolites are dissolved in an aqueous solvent.
- Suitably, the extracted samples of paragraph [0028] are analyzed by positive or negative electrospray ionization (ESI) or positive or negative atmospheric pressure chemical ionization (APCI).
- Suitably, the extracted samples of paragraphs [0028] or [0029] are analyzed by MS/MS transition.
- Suitably, the extracted samples of paragraphs [0028] or [0029] are analyzed by extracted ion chromatography and MS/MS transition.
- Suitably, said one or more than one reference sample is
- a) one or more than one reference sample obtained from a non-demented control individual;
- b) one or more than one reference sample obtained from a demented subject;
- c) one or more than one reference sample obtained from a subject pathologically diagnosed as having Alzheimer's Disease;
- d) one or more than one reference sample obtained from a subject clinically diagnosed as having Alzheimer's Disease;
- e) one or more than one reference sample obtained from a patient with cognitive impairment as measured by the Alzheimer's Disease Assessment Scale-cognitive subset (ADAS-cog);
- f) one or more than one reference sample obtained from a patient with cognitive impairment as measured by the Folstein's Mini-Mental State Exam (MMSE); or
- g) any combination of a) to f) thereof.
- Suitably, the method further comprises:
- analyzing a blood sample to obtain quantifying data for one or more than one internal control metabolite; and
- obtaining a ratio for each of the levels of said one or more than one metabolite marker to the level obtained for the one or more than one internal control metabolite; wherein the comparing step (b) comprises comparing each ratio to one or more corresponding ratios obtained for the one or more than one reference sample.
- Suitably, the one or more than one internal control metabolite includes a phosphatidylethanolamine 16:0/18:0.
- Suitably, a decrease in the level of said one or more than one metabolite marker in said blood sample is identified in the comparing step (b).
- Suitably, the method of paragraphs [0022] or [0023] comprises a liquid/liquid extraction is performed on the blood sample whereby non-polar metabolites are dissolved in an organic solvent and polar metabolites are dissolved in an aqueous solvent, and the extracted samples are analyzed by MS/MS transition, whereby:
- the MS/MS transitions for the phosphatidylethanolamines are 718.0 / 255.0, 716.0 / 255.0, 746.0 / 283.0 and 744.0 / 283.0, respectively;
- the MS/MS transitions for the plasmanylethanolamines are 702.0 / 281.0, 700.0 / 279.0, 724.0 / 303.0, 752.0 / 331.0, 748.0 / 327.0, 730.0 / 281.0, 728.0 / 279.0, 752.0 / 303.0, 780.0 / 331.0 and 776.0 / 327.0, respectively; and
- the MS/MS transitions for the plasmenylethanolamines are 700.0 / 281.0, 698.0 / 279.0, 722.0 / 303.0, 750.0 / 331.0, 746.0 / 327.0, 728.0 / 281.0, 726.0 / 279.0, 750.6 / 303.2, 778.0 / 331.0 and 774.0 / 327.0, respectively.
- Suitably, said diagnosing of the patient's Alzheimer's disease health state or change in health state further comprises evaluating the efficacy of a therapy for treating Alzheimer's disease, dementia or cognitive impairment in a patient.
- Suitably, in the method of paragraph [0037] at least one of said one or more than one reference sample defined in step b) is one or more than one pre-therapy baseline sample obtained from the patient.
- Suitably, the method of paragraphs [0022] or [0023] wherein evaluating the efficacy of the therapy includes determining whether the therapy is improving the demented state of the patient.
- The method may further comprise selecting a minimal number of metabolite markers needed for optimal diagnosis. In a non-limiting example, the high resolution mass spectrometer is a Fourier Transfrom Ion Cyclotron Resonance Mass Spectrometer (FTMS).
- The methods described herein, including HTS assays, can be used for the following, wherein the specific "health-state" in this application refers to, but is not limited to dementia:
- 1. identifying small-molecule metabolite biomarkers which can discriminate between multiple health-states using any biological sample taken from an individual,
- 2. specifically diagnosing a health-state using metabolites identified in serum, plasma, whole blood, serum, CSF, and/or other tissue biopsy as described in this application,
- 3. selecting the minimal number of metabolite features required for optimal diagnostic assay performance statistics using supervised statistical methods such as those mentioned in this application,
- 4. identifying structural characteristics of biomarker metabolites selected from non-targeted metabolomic analysis using LC-MS/MS, MSn and NMR,
- 5. developing a high-throughput LC-MS/MS method for assaying selected metabolite levels in serum,
- 6. diagnosing a given health-state, or risk for development of a health-state by determining the levels of any combination of metabolite features disclosed from the FTMS analysis patient serum, using any method including but not limited to mass spectrometry, NMR, UV detection, ELISA (enzyme-linked immunosorbant assay), chemical reaction, image analysis, or other.
- The impact of the present invention on the diagnosis of dementia would be tremendous, as literally everyone could be screened longitudinally throughout their lifetime to assess risk. Given that the performance characteristics of the test of the present invention are representative for the general population, this test alone may be superior to any other currently available screening method, as it may have the potential to detect disease progression prior to the emergence of clinical symptoms.
- This summary of the invention does not necessarily describe all features of the invention.
- These and other features of the invention will become more apparent from the following description in which reference is made to the appended drawings wherein:
-
FIGURE 1 shows a mean signal-to-noise +/-SEM of theAD serum 8 biomarker panel for each different clinical group (AD with significant cognitive impairment, Non-AD dementia, and AD with no significant cognitive impairment) relative to non-demented controls. -
FIGURE 2 shows a mean signal-to-noise +/-SEM of theAD serum 8 biomarker panel for two clinical groups with a significant cognitive impairment (AD and Non-AD dementia). -
FIGURE 3 shows a mean signal-to-noise +/-SEM of theAD CSF 12 biomarker panel for two clinical groups with a significant cognitive impairment (AD and Non-AD dementia). -
FIGURE 4 shows Q-Star extracted ion chromatograms (EIC) for the metabolites 541.3432 (A), 569.3687 (B), 699.5198 (C), 723.5195 (D), 751.5555 (E), and 803.568 (F). Top panel, 8 samples from non-demented subjects, bottom panel, 8 samples from clinically-diagnosed AD subjects. -
FIGURE 5 shows averaged AD biomarker intensities of the 8 AD and 8 non-demented controls samples from FTMS and Q-Star Analysis. -
FIGURE 6 shows MS/MS spectra for metabolite 541.3432 with CE voltage -50V. -
FIGURE 7 shows MS/MS spectra for metabolite 569.3687 with CE voltage -50V. -
FIGURE 8 shows MS/MS spectra for metabolite 699.5198 with CE voltage-50V. -
FIGURE 9 shows MS/MS spectra for metabolite 723.5195 with CE voltage-50V. -
FIGURE 10 shows MS/MS spectra for metabolite 751.5555 with CE voltage - 50V. -
FIGURE 11 shows MS/MS spectra for metabolite 803.568 with CE voltage -50V. -
FIGURE 12 shows structural determination of ADAS-cog serum biomarker 541.3432. -
FIGURE 13 shows structural determination of ADAS-cog serum biomarker 569.3687. -
FIGURE 14 shows structural determination of ADAS-cog serum biomarker 803.568. -
FIGURE 15 shows putative structures of additional serum biomarkers. A - metabolite with mass of 567.3547; B-metabolite with mass of 565.3394; C-metabolite with mass of 805.5832; D - metabolite with mass of 827.57; E - metabolite with mass of 829.5856; F - metabolite with mass of 531.5997; and G - metabolite with mass of 853.5854. -
FIGURE 16 shows the fragments obtained for the MS/MS analysis of the 751.5555 metabolite, along with its proposed structure. -
FIGURE 17 shows the fragments obtained for the MS/MS analysis of the 699.5198 metabolite, along with its proposed structure. -
FIGURE 18 shows the fragments obtained for the MS/MS analysis of the 723.5195 metabolite, along with its proposed structure. -
FIGURE 19 shows the LC-MS and MS/MS analysis of the 751.5555 metabolite (18:0/20:4 EtnPls): Panel A1 is an extracted ion chromatogram (EIC) of parent ion 750 (M-H-) of a pure standard; panel A2 is MS/MS spectra of parent ion M/Z 750 @ retention time 4.8-5.0 minutes. Panel B1 is the EIC ofparent ion 750 from a cognitively normal subject; panel B2 is the MS/MS spectra of parent ion M/Z 750 @ 4.8-5.0 min. Panel C1 is the EIC ofparent ion 750 from an AD subject; and panel C2 is the MS/MS spectra of parent ion M/Z 750 @ 4.8-5.0 min. -
FIGURE 20 shows the general structure of ethanolamine phospholipids, as well as the naming convention used herein. -
FIGURE 21 is an extracted ion chromatogram (upper panel) and MS/MS spectrum (lower panel) of EtnPls 16:0/18:1 (M15) in human serum. -
FIGURE 22 is an extracted ion chromatogram (upper panel) and MS/MS spectrum (lower panel) of EtnPls 16:0/18:2 (M16) in human serum. -
FIGURE 23 is an extracted ion chromatogram (upper panel) and MS/MS spectrum (lower panel) of EtnPls 16:0/20:4 (M17) in human serum. -
FIGURE 24 is an extracted ion chromatogram (upper panel) and MS/MS spectrum (lower panel) of EtnPls 16:0/22:6 (M 19) in human serum. -
FIGURE 25 is an extracted ion chromatogram (upper panel) and MS/MS spectrum (lower panel) of EtnPls 18:0/18:1 (M20) in human serum. -
FIGURE 26 is an extracted ion chromatogram (upper panel) and MS/MS spectrum (lower panel) of EtnPls 18:0/18:2 (M21) in human serum. -
FIGURE 27 is an extracted ion chromatogram (upper panel) and MS/MS spectrum (lower panel) of EtnPls 18:0/20:4 (M23) in human serum. -
FIGURE 28 is an extracted ion chromatogram (upper panel) and MS/MS spectrum (lower panel) of EtnPls 18:0/22:6 (M24) in human serum. -
FIGURE 29 is an extracted ion chromatogram (upper panel) and MS/MS spectrum (lower panel) of EtnPls 18:1/18:2 and Plasmanyl 16:0/20:4 (M07) in human serum. -
FIGURE 30 is an extracted ion chromatogram (upper panel) and MS/MS spectrum (lower panel) of EtnPls 20:0/20:4 and EtnPls 18:0/22:4 (M23) in human serum. -
FIGURE 31 is an extracted ion chromatogram (upper panel) and MS/MS spectrum (lower panel) of Plasmanyl 18:0/20:4 (M 12) and Plasmanyl 16:0/22:4 (M08) in human serum. -
FIGURE 32 is an extracted ion chromatogram (upper panel) and MS/MS spectrum (lower panels) of EtnPls 18:1/20:4, EtnPls 16:0/22:5, Plasmanyl 16:0/22:6 (M09) in human serum. -
FIGURE 33 shows a Q-Trap flow injection analysis standard curve of EtnPls 16:0/22:6 (M19) in healthy human serum. -
FIGURE 34 shows ehe effect of dementia severity and SDAT pathology on serum EtnP1 levels (male and female subjects combined). (A) Mono and di-unsaturated EtnPls and saturated PtdEt internal control. (B) Polyunsaturated EtnPls and free DHA (22:6). EtnPls abbreviations: (fatty acid carbons : double bonds, not including the vinyl ether double bond) and position on glycerol backbone (sn-1/sn-2). D16:0118:0 represents diacylglycerophosphatidylethanolamine with palmitic acid (16:0) at sn-1 and stearic acid (18:0) at sn-2; 22:6 represents free DHA. Values are expressed as mean ± SEM (n=19-112). -
FIGURE 35 shows serum DHA-EtnPls (Log(2) EtnPls 16:0/22:6 (M19) to PtdEt 16:0/18:0 (M01) ratio) distributions in subjects with different levels of dementia severity (male and female subjects combined). -
FIGURE 36 is a comparison of theoretical distributions of AD pathology (A) compiled from references 5-8 and experimentally determined distributions of serum 22:6-containing EtnPls (Log(2) EtnPls 16:0/22:6 (M19) to PtdEt 16:0/18:0 (M01) ratio) (B) in cognitively normal and demented subjects. Arrow indicates positive diagnosis of AD. -
FIGURE 37 is a linear regression analysis of disease severity (ADAS-cog) and serum 22:6-containing EtnPls (EtnPls 16:0/22:6 (M19) to PtdEt 16:0/18:0 (M01) ratio) levels in 256 AD subjects. X = predicted initiation of EtnPls depletion. Values are expressed as mean ± SEM (n=66-112). Clinical progression assumes 7.5 ADAS-cog points/year. -
FIGURE 38 shows serum 22:6-containing EtnPls (EtnPls 16:0/22:6 (M19) to PtdEt 16:0/18:0 (M01) ratio) levels in AD, Cognitive Normal, and general population subjects. (A) Mean ± SEM (n= 68-256). (B) Log(2) distributions. -
FIGURE 39 shows the distribution of serum white and gray matter EtnP1 scores in males and females. - Small molecules or metabolites are described that are found to have significantly different abundances between clinically diagnosed dementia or other neurological disorders, and normal patients. The present invention relates to methods for diagnosing dementia.
- There are described methods for discovering, validating, and implementing a metabolite markers for one or more diseases or particular health-states. Such a method for identifying specific biomarkers for differentially diagnosing AD dementia, non-AD dementia, cognitive impairment, or a combination thereof, comprises the steps of: introducing one or more than one sample from one or more than one patient with clinically diagnosed AD dementia, clinically diagnosed non-AD dementia, or significant cognitive impairment, said sample containing a plurality of metabolites into a high resolution mass spectrometer (for example, and without wishing to be limiting, a Fourier Transform Ion Cyclotron Resonance Mass Spectrometer (FTMS)); obtaining, identifying and quantifying data for the metabolites; creating a database of said identifying and quantifying data; comparing the identifying and quantifying data from the sample with corresponding data from a sample from a non-demented normal patient; identifying one or more than one metabolites that differ. The metabolite markers identified using the method may include the metabolites listed in Tables 1-7, 10-13, and 18. The method may further comprise selecting the minimal number of metabolite markers needed for optimal diagnosis.
- In order to determine the biochemical markers of a given health-state in a particular population, a group of patients representative of the health state (i.e. a particular disease) and/or a group of "normal" counterparts are required. Biological samples taken from the patients in the particular health-state category can then be compared to the same samples taken from the normal population as well as to patients in similar health-state category in the hopes of identifying biochemical differences between the two groups, by analyzing the biochemicals present in the samples using FTMS and/or LC-MS.
- The method for the discovery of metabolite markers as described above may be done using non-targeted metabolomic strategies or methods. Multiple non-targeted metabolomics strategies have been described in the scientific literature including NMR [18], GC-MS [19-21], LC-MS, and FTMS strategies [18, 22-24]. The metabolic profiling strategy employed for the discovery of differentially expressed metabolites in the present invention was the non-targeted FTMS strategy by Phenomenome Discoveries [21,24-27; see also
US Published Application No. 2004-0029120 A1 , Canadian Application No.2,298,181 , andWO 0157518 - However, a person skilled in the art would recognize that other metabolite profiling strategies could be used to discover some or all of the differentially regulated metabolites disclosed in the present invention and that the metabolites described herein, however discovered or measured, represent unique chemical entities that are independent of the analytical technology that may be used to detect and measure them.
- There is also described a method for differentially diagnosing dementia or the risk of dementia in a patient, the method comprising the steps of:
- a) obtaining a sample from said patient;
- b) analyzing said sample to obtain quantifiying data for one or more than one metabolite marker;
- c) comparing the quantifying data for said one or more than one metabolite marker to corresponding data obtained from one or more than one reference sample; and
- d) using said comparison to differentially diagnose dementia or the risk of dementia.
- By the term "differential diagnosis" or "differentially diagnosing", it is meant that various aspects of a disease state may be distinguished from one another. In particular, the present invention allows for differential diagnosis a various states of dementia; for example and without wishing to be limiting, the present invention may provide differential diagnosis of AD dementia, non-AD dementia, cognitive impariment, or a combination thereof.
- The diagnosis of or the exclusion of any types of neurological disorders is contemplated, using all or a subset of the metabolites disclosed herein. The term "dementia" is used herein as a broad term indicating both cognitive imparment as well as pathologies causing cognitive impairment. Dementia may be caused by a number of neurological disorders. "AD dementia" as used herein refers to dementia caused by Alzheimer's disease (AD, which may also be referred to herein as "SDAT"); types of "non-AD dementia" include, but are not limited to, dementia with Lewy bodies (DLB), frontotemporal lobe dementia (FTD), vascular induced dementia (e.g. multi-infarct dementia), anoxic event induced dementia (e.g. cardiac arrest), trauma to the brain induced dementia (e.g. dementia pugilistica [boxer's dementia]), dementia resulting from exposure to an infectious (e.g. Creutzfeldt-Jakob Disease) or toxic agent (e.g. alcohol-induced dementia), Autism, Multiple Sclerosis, Parkinson's Disease, Bipolar Disorder, Ischemia, Huntington's Chorea, Major Depressive Disorder, Closed Head Injury, Hydrocephalus, Amnesia, Anxiety Disorder, Traumatic Brain Injury, Obsessive Compulsive Disorder, Schizophrenia, Mental Retardation, and/or Epilepsy. Of particular interest are AD dementia, and FTD and DLB non-AD dementias.
- Cognitive impairment can be assessed by any method known in the art. For example, and without wishing to be limiting, the Alzheimer's Disease Assessment Scale (ADAS)-cognitive subset may be used. This neuropsychological test is used to test the language ability (speech and comprehension), memory, ability to copy geometric figures and orientation to current time and place. Errors on the test are recorded resulting in a reverse score impairment (i.e., the higher the score on ADAS, the greater the cognitive impairment). A score of 0-15 is considered normal, 16-47 is considered mild-moderate impairment and a score of 48-70 is considered moderate-severe impairment [28]. Another neuropsychological test, Folstein's Mini-Mental State Exam (MMSE), which measures cognitive impairment, may be used. The MMSE is widely used and is an extensively validated test of orientation, short and long-term memory, praxis, language and comprehension. A person skilled in the art would recognize that additional neuropsychological assessment that measure aspects of the same cognitive deficit, such as, but not exclusive to, the Blessed Roth Dementia Rating Scale, the 7-Minute Screen, Wechsler Memory Scale (WMS), Halstead-Reitan Battery, Rey Auditory Verbal Learning Test, California Verbal Learning Test, Buschke Selective Reminding Test, Boston Naming Test, Clinical Evaluation of Language Functioning, Peabody Picture Vocabulary Tests, Mattis Dementia Rating Scale, Memory Assessment Scale, Tests of Memory and Learning, Wide Range Assessment of Memory and Learning, can also be used.
- In addition, a person skilled in the art would recognize that any imaging technique that has the potential to show a cognitive impairment or structural change, such as, but not exclusive to, structural magnetic resonance imaging (MRI), positron emission tomography (PET), computerized tomography (CT), functional magnetic resonance imaging (fMRI), electroencephalography (EEG), single positron emission tomography (SPECT), event related potentials, magnetoencephalography, multi-modal imaging, would be measuring the structural/regional brain areas that are responsible for that cognitive deficit and AD pathology, and therefore, would be related to the metabolites disclosed in this invention.
- In accordance with the present invention, a blood (serum/plasma) sample is used. Of particular interest are samples that are serum. While the term "serum" is used herein, those skilled in the art will recognize that plasma or whole blood or a sub-fraction of whole blood may also be used.
- In a non-limiting example, when a blood sample is drawn from a patient there are several ways in which the sample can be processed. The range of processing can be as little as none (i.e. frozen whole blood) or as complex as the isolation of a particular cell type. The most common and routine procedures involve the preparation of either serum or plasma from whole blood. All blood sample processing methods, including spotting of blood samples onto solid-phase supports, such as filter paper or other immobile materials, are also contemplated by the present invention.
- Without wishing to be limiting in any manner, the processed blood or serum sample described above may then be further processed to make it compatible with the methodical analysis technique to be employed in the detection and measurement of the metabolites contained within the processed serum sample. The types of processing can range from as little as no further processing to as complex as differential extraction and chemical derivatization. Extraction methods could include sonication, soxhlet extraction, microwave assisted extraction (MAE), supercritical fluid extraction (SFE), accelerated solvent extraction (ASE), pressurized liquid extraction (PLE), pressurized hot water extraction (PHWE) and/or surfactant assisted extraction (PHWE) in common solvents such as methanol, ethanol, mixtures of alcohols and water, or organic solvents such as ethyl acetate or hexane. A method of particular interest for extracting metabolites for FTMS non-targeted analysis is to perform a liquid/liquid extraction whereby non-polar metabolites dissolve in an organic solvent and polar metabolites dissolve in an aqueous solvent.
- The extracted samples may be analyzed using any suitable method know in the art. For example, and without wishing to be limiting in any manner, extracts of biological samples are amenable to analysis on essentially any mass spectrometry platform, either by direct injection or following chromatographic separation. Typical mass spectrometers are comprised of a source which ionizes molecules within the sample, and a detector for detecting the ionized molecules or fragments of molecules. Non-limiting examples of common sources include electron impact, electrospray ionization (ESI), atmospheric pressure chemical ionization (APCI), atmospheric pressure photo ionization (APPI), matrix assisted laser desorption ionization (MALDI), surface enhanced laser desorption ionization (SELDI), and derivations thereof. Common mass separation and detection systems can include quadrupole, quadrupole ion trap, linear ion trap, time-of flight (TOF), magnetic sector, ion cyclotron (FTMS), Orbitrap, and derivations and combinations thereof. The advantage of FTMS over other MS-based platforms is its high resolving capability that allows for the separation of metabolites differing by only hundredths of a Dalton, many which would be missed by lower resolution instruments.
- By the term "metabolite", it is meant specific small molecules, the levels or intensities of which are measured in a sample, and that may be used as markers to diagnose a disease state. These small molecules may also be referred to herein as "metabolite marker", "metabolite component", "biomarker", or "biochemical marker".
- The metabolites are generally characterized by their accurate mass, as measured by mass spectormetry technique used in the above method. The accurate mass may also be referred to as "accurate neutral mass" or "neutral mass". The accurate mass of a metabolite is given herein in Daltons (Da), or a mass substantially equivalent thereto. By "substantially equivalent thereto", it is meant that a +/- 5 ppm difference in the accurate mass would indicate the same metabolite, as would be recognized by a person of skill in the art. The accurate mass is given as the mass of the neutral metabolite. As would be recognized by a person of skill in the art, the ionization of the metabolites, which occurs during analysis of the sample, the metabolite will cause either a loss or gain of one or more hydrogen atoms and a loss or gain of an electron. This changes the accurate mass to the "ionized mass", which differs from the accurate mass by the mass of hydrogens and electrons lost or gained during ionization. Unless otherwise specified, the accurate neutral mass will be refered to herein.
- Similarly, when a metabolite is described by its molecular formula or structure, the molecular formula or structure of the neutral metabolite will be given. Naturally, the molecular formula or structure of the ionized metabolite will differ from the neutral molecular formula or structure by the number of hydrogens lost or gained during ionization.
- Data is collected during analysis and quantifying data for one or more than one metabolite is obtained. "Quantifying data" is obtained by measuring the levels or intensities of specific metabolites present in a sample.
- The quantifying data is compared to correponding data from one or more than one reference sample. The "reference sample" is any suitable reference sample for the particular disease state. For example, and without wishing to be limiting in any manner, in the present invention the reference sample may be a sample from a non-demented control individual, i.e., a person not suffering from AD dementia, non-AD dementia or cognitive impairment (also refered to herein as a " 'normal' counterpart"); the reference sample may also be a sample obtained from a patient with clinically diagnosed with AD, a patient with clinically diagnosed non-AD dementia, or a patient diagnosed with significant cognitive impairment. As would be understood by a person of skill in the art, more than one reference sample may be used for comparison to the quantifying data. For example and without wishing to be limiting, the one or more than one reference sample may be a first reference sample obtained from a non-demented control individual. The one or more than one reference sample may further include a second reference sample obtained from a patient with clinically diagnosed AD-dementia, a third reference sample obtained from a patient with clinically diagnosed non-AD dementia, a fourth reference sample obtained from a patient suffering from significant cognitive impairment, or any combination thereof.
- There are also described novel compounds, identified using the methods described herein. The novel compounds may be used as metabolite markers in the differential diagnosis of dementia, as described above.
- Also described are compounds selected from the metabolites listed in Tables 1 to 7. These metabolites were identified in serum samples, and may be phosphatidylcholine-related compounds, ethanolamine plasmalogens, endogenous fatty acids, essential fatty acids, lipid oxidation byproducts, metabolite derivatives of said metabolite classes, and any metabolite that may contribute in any way to the anabolic/catabolic metabolism of said metabolite classes.
- An optimal panel of compounds may be indentified from those metabolites listed in Tables 1 to 7. For example and without wishing to be limiting, the metabolite markers may be metabolites with accurate masses measured in Daltons of, or substantially equivalent to, 541.3432, 569.3687, 699.5198, 723.5195, 723.5197, 751.5555, 803.568, 886.5582. The metabolites of accurate masses 699.5198, 723.5195, 723.5197, and 751.555 have presently been identified as ethanolamine plasmalogens, and are specifically decreased in patients with AD dementia. The metabolite markers of accurate masses 541.3432, 569.3687, 803.568, and 886.5582 have presently been identified as phosphatidylcholine related metabolites, and are decreased in patients with cognitive impairment on ADAS-cog, and severity of cognitive impairment correlates to the degree of decrease.
- The metabolites with accurate masses measured in Daltons of, or substantially equivalent to, a) 541.3432, b) 569.3687, c) 699.5198, d) 723.5195, e) 751.5555, f) 803.568, can be further characterized by
- a) an extracted ion chromatogram (EIC) as shown in
Figure 4A , and an MS/MS spectrum as shown inFigure 6 ; a molecular formula of C25H51NO9P; and/or the structure shown infigure 12 ; - b) an EIC as shown in
Figure 4B , and an MS/MS spectrum as shown inFigure 7 ; a molecular formula of C27H55NO9P; and/or the structure shown infigure 13 ; - c) an EIC as shown in
Figure 4C , and an MS/MS spectrum as shown inFigure 8 ; a molecular formula of C39H74NO7P; and/or the structure shown infigure 17 ; - d) an EIC as shown in
Figure 4D , and an MS/MS spectrum as shown inFigure 9 ; a molecular formula of C41H74NO7P; and/or the structure shown infigure 18 ; - e) an EIC as shown in
Figure 4E , and an MS/MS spectrum as shown inFigure 10 ; a molecular formula of C43H78NO7P; and/or the structure shown infigure 19 ; - f) an EIC as shown in
Figure 4F , and an MS/MS spectrum as shown inFigure 11 ; a molecular formula of C43H81NO10P; and/or the structure shown infigure 14 , - respectively.
- It is presently shown that the ethanolamine plasmalogen metabolites (neutral masses 699.5198, 723.5195, 751.5555) and the phosphatidylcholine metabolites (neutral masses 699.5198, 723.5195, 751.5555) are decreased in the serum of AD subjects exhibiting significant cognitive impairment. This is the first report of serum-based changes in these metabolites associated with AD and dementia. It is further shown that the decrease in the disclosed serum phospatidylcholine related metabolites occurs in all patients exhibiting a significant cognitive impairment as measured by the ADAS-cog regardless of AD status, and that the degree of decrease correlates with the severity of the cognitive impairment. However, the observed decrease in disclosed ethanolamine plasmalogens is independent of cognitive impairment, occurs specifically in subjects with AD and is therefore a true diagnostic of AD.
- Ethanolamine plasmalogens are a type of ethanolamine phospholipid. Ethanolamine phospholipids can be further differentiated based on their sn-1 configurations (either acyl, ether, or vinyl ether). The sn-2 position is typically acyl and the sn-3 position contains the phosphoethanolamine moiety. Therefore, the three classes are described as either diacyl (also referred to herein as PtdEt), alkyl-acyl (also referred to herein as plasmanyl) or alkenyl-acyl (also referred to herein as EtnP1 or plasmenyl). Various basic structures of ethanolamine phospholipids are shown in
Figure 20 , along with the standard naming convention used herein. - A decrease in the disclosed ethanolamine plasmalogens may represent the initial or early stages AD, and can be detected non-invasively in living subjects by measuring serum levels of specific ethanolamine plasmalogens. Similarly, cognitive impairment can be quantitated non-invasively by measuring the serum levels of specific phosphatidylcholine metabolites.
- Other metabolites have also been identified. For example, the metabolites with accurate masses measured in Daltons of, or substantially equivalent to, a) 541.3432, b) 569.3687, c) 699.5198, d) 723.5195, e) 751.5555, f) 803.568, which may be further characterized by
- a) the molecular formula C27H55NO9P; and/or the structure shown in
Figure 15A - b) the molecular formula C27H55NO9P; and/or the structure shown in
Figure 15B - c) the molecular formula C43H83NO10P; and/or the structure shown in
Figure 15C ; - d) the molecular formula C45H81NO10P; and/or the structure shown in
Figure 15D ; - e) the molecular formula C45H83NO10P; and/or the structure shown in
Figure 15E ; - f) the molecular formula C45H85NO10P; and/or the structure shown in
Figure 15F ; - g) the molecular formula C47H83NO10P; and/or the structure shown in
Figure 15G , - respectively.
- Based on the identification of metabolites specific to AD dementia (accurate masses 699.5198, 723.5195, 723.5197, 751.555) as ethanolamine plasmalogens, other ethanolamine phospholipid metabolite markers were identified. These are metabolites M05 to M24 as listed and characterized (accurate mass, name/composition, molecular formula) in Table 18. The structure of the metabolite can be deduced based on the metabolite name as indicated in Table 18 and the nomenclature, as indicated in
Figure 20 . - Of the compounds listed in Table 18, those of particular interest include metabolites with accurate masses measured in Daltons of, or substantially equivalent to, a) 701.53591, b) 699.52026, c) 723.52026, d) 747.52026, e) 729.56721, f) 727.55156, g) 779.58286, and h) 775.55156, which can be further characterized by
- a) a MS/MS spectrum as shown in
figure 21 ; molecular formula C27H55NO9P; and/or the structure
- b) a MS/MS spectrum as shown in
figure 22 ; molecular formula C39H74NO7P; and/or the structure
- c) a MS/MS spectrum as shown in
figure 23 ; molecular formula C41H74NO7P; and/or the structure
- d) a MS/MS spectrum as shown in
figure 24 ; molecular formula C43H74NO7P; and/or the structure
- e) a MS/MS spectrum as shown in
figure 25 : molecular formula C41H80NO7P; and/or the structure
- f) a MS/MS spectrum as shown in
figure 26 ; molecular formula C41H78NO7P; and/or the structure
- g) a MS/MS spectrum as shown in
figure 27 ; molecular formula C45H82NO7P; and/or the structure
- h) a MS/MS spectrum as shown in
figure 28 ; molecular formula C45H78NO7P; and/or the structure
- respectively.
- Also described are compounds selected from the metabolites listed in Table 13. These metabolites were identified in CSF samples. Of particular interest are the metabolites with accurate masses measured in Daltons of, or substantially equivalent to, 207.0822, 275.8712, 371.7311, 373.728, 432.1532, 485.5603, 487.6482, 562.46, 622.2539, 640.2637, 730.6493, 742.2972. When used to diagnose dementia, the metabolite markers 207.0822, 432.1532, 562.46, 622.2539, 640.2637, 730.6493, and 742.2972 are increased in patients with AD dementia; and metabolite markers 275.8712, 371.7311, 373.728, 485.5603, and 487.6482 are decreased in patients with AD dementia.
- A method for assessing dementia or the risk of dementia in a patient is also described. The method comprises the steps of:
- a) obtaining a serum sample from said patient;
- b) analyzing said sample to obtain quantifiying data for one or more than one metabolite marker;
- c) comparing the quantifying data for said one or more than one metabolite marker to corresponding data obtained from one or more than one reference sample; and
- d) using said comparison to assess dementia or the risk of dementia.
- The step of analyzing the sample (steb b)) may comprise analyzing the sample by liquid chromatography mass spectrometry (LC-MS). Alternatively, the step of analyzing the sample (step b)) may comprise analyzing the sample by linear ion trap mass spectrometry followed by liquid chromatograph, when the method is a highthroughput method.
- The one or more than one reference sample may include a first reference sample obtained from a non-demented control individual, a second reference sample obtained from a patient with cognitive impairment as measured by ADAS-cog, a third reference sample obtained from a patient with with cognitive impairment as measured by MMSE, or a combination of one or more of these.
- Without wishing to be limiting in any manner, the one or more than one metabolite marker used to asses dementia or the risk of dementia may be selected from the metabolites listed in Tables 10-12, or a combination thereof. Of particular interest are metabolites with accurate masses measured in Daltons of, or substantially equivalent to 541.3432, 569.3687, 699.5198, 723.5195, 723.5197, 751.5555, 803.568, 886.5582, 565.3394, 569.369, 801.555, 857.6186. A decrease in the patient sample in metabolite markers 699.5198, 723.5195, 723.5197, and 751.555 indicates AD pathology; a decrease in the patient sample in metabolite markers 541.3432, 569.3687, 803.568, and 886.5582 indicates cognitive impairment on ADAS-cog; and 565.3394, 569.369, 801.555, and 857.6186 indicates cognitive impairment on MMSE.
- There is described a method for differentially diagnosing dementia or the risk of dementia in a patient. The method comprising the steps of:
- a) obtaining a sample from said patient;
- b) analyzing said sample to obtain quantifiying data for one or more than one metabolite marker;
- c) obtaining a ratio for each of the one or more than one metabolite marker to an internal control metabolite;
- d) comparing each ratio of said one or more than one metabolite marker to the internal control metabolite to corresponding data obtained from one or more than one reference sample; and
- e) using said comparison to differentially diagnose dementia or the risk of dementia.
- The step of analyzing the sample (steb b) may comprise analyzing the sample using a mass spectrometer (MS). For example, and without wishing to be limiting, such mass spectrometer could be of the FTMS, orbitrap, time of flight (TOF) or quadrupole types. Alternatively, the mass spectrometer could be equipped with an additional pre-detector mass filter. For example, and without wishing to be limiting such instruments are commonly referred to as quadrupole-FTMS (Q-FTMS), quadrupole - TOF (Q-TOF) or triple quadrupole (TQ or QQQ). In addition, the mass spectrometer could be operated in either the parent ion detection mode (MS) or in MSn mode, where n>=2. MSn refers to the situation where the parent ion is fragmented by collision induced dissociation (CID) or other fragmentation procedures to create fragment ions, and then one or more than one of said fragments are detected by the mass spectrometer. Such framents can then be further fragmented to create further fragments. Alternatively, the sample could be introduced into the mass spectrometer using a liquid or gas chromatographic system or by direct injection.
- In the method as just described above, the one or more than one reference sample may be a first reference sample obtained from a non-demented control individual. The one or more than one reference sample may further include a second reference sample obtained from a patient with clinically diagnosed AD-dementia, a third reference sample obtained from a patient with clinically diagnosed non-AD dementia, a fourth reference sample obtained from a patient suffering from significant cognitive impairment, or any combination thereof.
- In the method as described above, the sample and reference sample may be serum samples. The one or more than one metabolite marker may be selected from the metabolites as listed and characterized (accurate mass, name/composition, molecular formula) in Table 18. The "internal control metabolite" refers to an endogenous metabolite naturally present in the patient. Any suitable endogenous metabolite that does not vary over the disease states can be used as the internal control metabolite. For example, and without wishing to be limiting, the internal control metabolite may be phosphatidylethanolamine 16:0/18:0 (PtdEt 16:0/18:0, M01), as shown in Table 18; this internal control metabolite has a molecular formula of C39H78NO8P, and a structure characterized as

- Use of the ratio of the metabolite marker to the internal control metabolite offers measurement that are more stable and reproducible than measurement of absolute levels of the metabolite marker. As the internal control metabolite is naturally present in all samples and does not appear to vary significantly over disease states, the sample-to-sample variability (due to handling, extraction, etc) is minimized.
- Of the compounds listed in Table 18, those of particular interest in the above method include metabolites with accurate masses measured in Daltons of, or substantially equivalent to, a) 701.53591, b) 699.52026, c) 723.52026, d) 747.52026, e) 729.56721, f) 727.55156, g) 779.58286, and h) 775.55156. A decrease in the ratio of a) to h) to the internal control metabolite indicates AD dementia with a severe cognitive impairment. These metabolites can be further characterized by
- a) a MS/MS spectrum as shown in
figure 21 ; molecular formula C27H55NO9P; and/or the structure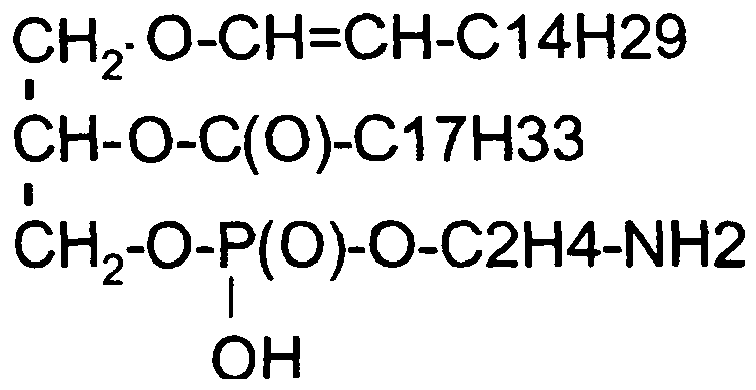
- b) a MS/MS spectrum as shown in
figure 22 ; molecular formula C39H74NO7P; and/or the structure
- c) a MS/MS spectrum as shown in
figure 23 ; molecular formula C41H74NO7P; and/or the structure
- d) a MS/MS spectrum as shown in
figure 24 ; molecular formula C43H74NO7P; and/or the structure
- e) a MS/MS spectrum as shown in
figure 25 ; molecular formula C41H80NO7P; and/or the structure
- f) a MS/MS spectrum as shown in
figure 26 ; molecular formula C41H78NO7P; and/or the structure
- g) a MS/MS spectrum as shown in
figure 27 ; molecular formula C45H82NO7P; and/or the structure
- h) a MS/MS spectrum as shown in
figure 28 ; molecular formula C45H78NO7P; and/or the structure
- respectively.
- Also disclosed herein is a method for evaluating the efficacy of a therapy for treating dementia in a patient, comprising:
- a) obtaining a sample from said patient;
- b) analyzing said sample to obtain quantifying data for one or more than one metabolite marker;
- c) comparing said quantifying data to corresponding data obtained from one or more than one reference sample; and
- d) using said comparison to determine whether the therapy is improving the demented state of the patient.
- Optionally, after the step of analyzing (step b), a ratio for each of the one or more than one metabolite marker to an internal control metabolite may be obtained. In this case, each ratio of said one or more than one metabolite marker to the internal control metabolite to corresponding data obtained from one or more than one reference sample is compared to evaluate the efficacy of the therapy.
- The step of analyzing (step b) may comprise analyzing the sample by liquid chromatography mass spectrometry (LC-MS), or alternatively may comprise analyzing the sample by liquid chromatography and linear ion trap mass spectrometry when the method is a highthroughput method.
- By the term "therapy", it is meant any suitable course of therapy that may improve the health state or demented state of the patient being evaluated. When evaluating the efficacy of the therapy, the effect of the particular therapy in improving or degrading the health state of the patient will be measured. In doing so, a person of skill in the art would be capable of determining whether the therapy is effective for treating the demented state.
- In the methods as described, the one or more than one reference sample may be any suitable reference sample. For example, and without wishing to be limiting in any manner, the reference sample may be a plurality of samples obtained from from non-demented control individuals; a plurality of samples obtained from clinically diagnosed AD patients; one or more than one pre-therapy baseline sample obtained from the patient; or any combination thereof. A pre-therapy baseline sample from the patient is particularly useful, as the variation in metabolites will then be specific to the patient.
- The sample and the reference sample may be serum samples. In this case, the one or more than one metabolite marker could be selected from the metabolites listed in Tables 1 to 7, or a combination thereof, for example, metabolite markers with accurate masses measured in Daltons of, or substantially equivalent to, 541.3432, 569.3687, 699.5198, 723.5195, 723.5197, 751.5555, 803.568, 886.5582. Alternatively, the metabolite markers may be selected from metabolites M05 to M24 with accurate masses of, or substantially equivalent to those listed in Table 18, for example, metabolites with accurate masses measured in Daltons of, or substantially equivalent to, 701.53591, 699.52026, 723.52026, 747.52026, 729.56721, 727.55156, 779.58286, and 775.55156. Metabolites M05-M24 could also be used when a ratio is obtained between the metabolites and the internal control metabolite; the internal metabolite could be, for example, metabolite M01, as described in Table 18.
- The sample and the reference sample may also be cerebrospinal fluid (CSF) samples. In this case, the one or more than one metabolite marker could be selected from the metabolites listed in Table 13, or a combination thereof; for example, metabolites with accurate masses measured in Daltons of, or substantially equivalent to, 207.0822, 275.8712, 371.7311, 373.728, 432.1532, 485.5603, 487.6482, 562.46, 622.2539, 640.2637, 730.6493, 742.2972.
- The identified metabolites can be readily measured systemically. This point is of fundamental importance, since the majority of research pertaining to AD and other neurological disorders has ignored the peripheral systems. The ability to measure neurodegenerative processes within a blood sample is of substantial value in the diagnosis of dementia. With respect to the specific ethanolamine plasmalogen metabolites of the present invention, these are a valid biochemical marker of AD pathology since this molecular species' content does not change in Parkinson's disease, a disease which is often accompanied by dementia [29]. Furthermore, the specificity of the plasmalogen metabolites to AD indicates that its levels in serum could be readily measured longitudinally throughout the lifetime of an individual to assess the risk or for early detection of the disease prior to the emergence of clinical symptoms.
- Also described are high throughput methods for differential diagnosis of AD dementia and non-AD dementia states. The method may involve fragmentation of the parent molecule; in a non-limiting example, this may be accomplished by a Q-Trap™ system. Detection of the metabolites may be performed using one of various assay platforms, including colorimetric chemical assays (UV, or other wavelength), antibody-based enzyme-linked immunosorbant assays (ELISAs), chip-based and polymerase-chain reaction for nucleic acid detection assays, bead-based nucleic-acid detection methods, dipstick chemical assays or other chemical reaction, image analysis such as magnetic resonance imaging (MRI), positron emission tomography (PET) scan, computerized tomography (CT) scan, nuclear magnetic resonance (NMR), and various mass spectrometry-based systems.
- A high-throughput method for determining the levels of the metabolites in a person's blood and comparing the levels to levels in a normal "reference" population can lead to a prediction of whether the person has AD or not. This can be carried out in several ways. One way is to use a prediction algorithm to classify the test sample, as previously described, which would output a percentage probability for having AD. A predictive approach would work independently of the assay method, as long as the intensities of the metabolites could be measured. Another method could simply be based on setting a threshold intensity level from the mass spectrometer, and determining whether a person's profile is above or below the threshold which would indicate their AD status. Alternatively, and without wishing to be limiting in any manner, a preferred method is a truly quantitative assay could be performed to determine the molar concentration of the six metabolites in the non-demented normal and AD population. An absolute threshold concentration could then be determined for AD-positivity. In a clinical setting, this would mean that if the measured levels of the metabolites, or combinations of the metabolites, were below a certain concentration, there would be an associated probability that the individual is positive for AD. Therefore, the optimal diagnostic test could comprise a method of measuring the intensities of the metabolites in serum, and an algorithm for taking the intensity values and outputting a predicted probability for having AD as well as for being healthy (i.e., AD-negative).
- The methods and identified biomarkers described herein, based on small molecules or metabolites in a sample, fulfills the criteria identified in 1999 for an ideal screening test [82], as development of assays capable of detecting specific metabolites is relatively simple and cost effective per assay. The test is minimally invasive and is indicative of cognitive impairment and of AD pathology. Translation of the method into a clinical assay compatible with current clinical chemistry laboratory hardware is commercially acceptable and effective. Furthermore, the method of the present invention does not require highly trained personnel to perform and interpret the test.
- The present invention will be further illustrated in the following examples.
- Differentially expressed metabolites were identified in clinically diagnosed AD with and without significant cognitive impairment, clinically diagnosed non-AD and non-demented controls.
- Clinical Samples. For the AD serum diagnostic assay described, samples were obtained from representative populations of non-demented healthy individuals and of clinically diagnosed AD and non-AD dementia patients. The biochemical markers of AD described in the invention were derived from the analysis of 75 serum samples from patients clinically diagnosed with probable AD (43 patients with significant cognitive impairment, 32 with no cognitive impairment), serum samples from 30 patients with clinically diagnosed non-AD dementia, and 31 serum samples from non-demented controls. Samples in the three groups were from a diverse population of individuals, ranging in age, ethnicity, weight, occupation, and displaying varying non-dementia-related health-states. All samples were single time-point collections. Cognitive impairment of the patients was also assessed using the Alzheimer's Disease Assessment Scale (ADAS)-cognitive subset.
- For the AD CSF diagnostic assay described, samples were obtained from a group of patients that represented clinically diagnosed AD with dementia and non-AD patients with dementia. The biochemical markers of AD described in this invention were derived from the analysis of 6 CSF samples from clinically diagnosed AD patients with dementia and 5 CSF samples from clinically diagnosed non-AD patients with dementia.
- Samples in both groups were from a diverse population of individuals, ranging in age, ethnicity, weight, occupation, and displaying varying non-dementia-related health-states. All samples were single time-point collections. The metabolites contained within the 136 serum samples and 11 CSF samples used in this application were separated into polar and non-polar extracts through sonication and vigorous mixing (vortex mixing).
- Mass Spectrometry Analysis. Analysis of serum extracts collected from 136 individuals (75 clinically diagnosed AD, 30 clinically diagnosed non-AD, and 31 non-demented healthy controls) and 11 CSF extracts (6 clinically-diagnosed AD and 5 clinically diagnosed non-AD patients) was performed by direct injection into a FTMS and ionization by either ESI or atmospheric pressure chemical ionization (APCI) in both positive and negative modes. Sample extracts were diluted either three or six-fold in methanol:0.1 %(v/v) ammonium hydroxide (50:50, v/v) for negative ionization modes, or in methanol:0.1% (v/v) formic acid (50:50, v/v) for positive ionization modes. For APCI, sample extracts were directly injected without diluting. All analyses were performed on a Bruker Daltonics APEX III Fourier transform ion cyclotron resonance mass spectrometer equipped with a 7.0 T actively shielded superconducting magnet (Bruker Daltonics, Billerica, MA). Samples were directly injected using electrospray ionization (ESI) and/or APCI at a flow rate of 1200 µL per hour. Ion transfer/detection parameters were optimized using a standard mix of serine, tetra-alanine, reserpine, Hewlett-Packard tuning mix and the adrenocorticotrophic hormone fragment 4-10. In addition, the instrument conditions were tuned to optimize ion intensity and broad-band accumulation over the mass range of 100-1000 amu according to the instrument manufacturer's recommendations. A mixture of the abovementioned standards was used to internally calibrate each sample spectrum for mass accuracy over the acquisition range of 100-1000 amu.
- In total, six separate analyses comprising combinations of extracts and ionization modes were obtained for each sample:
- Aqueous Extract
- 1. Positive ESI (analysis mode 1101)
- 2. Negative ESI (analysis mode 1102)
- Organic Extract
- 3. Positive ESI (analysis mode 1201)
- 4. Negative ESI (analysis mode 1202)
- 5. Positive APCI (analysis mode 1203)
- 6. Negative APCI (analysis mode 1204)
- Mass Spectrometry Data Processing. Using a linear least-squares regression line, mass axis values were calibrated such that each internal standard mass peak had a mass error of <1 p.p.m. compared with its theoretical mass. Using XMASS software from Bruker Daltonics Inc., data file sizes of 1 megaword were acquired and zero-filled to 2 megawords. A sinm data transformation was performed prior to Fourier transform and magnitude calculations. The mass spectra from each analysis were integrated, creating a peak list that contained the accurate mass and absolute intensity of each peak. Compounds in the range of 100-2000 m/z were analyzed. In order to compare and summarize data across different ionization modes and polarities, all detected mass peaks were converted to their corresponding neutral masses assuming hydrogen adduct formation. A self-generated two-dimensional (mass vs. sample intensity) array was then created using DISCOVAmetrics™ software (Phenomenome Discoveries Inc., Saskatoon, SK, Canada). The data from multiple files were integrated and this combined file was then processed to determine the unique masses. The average of each unique mass was determined, representing the y axis. This value represents the average of all of the detected accurate masses that were statistically determined to be equivalent. Considering that the mass accuracy of the instrument for the calibration standards is approximately 1 ppm, a person skilled in the art will recognize that these average masses may include individual masses that fall within +/- 5 ppm of this average mass. A column was created for each file that was originally selected to be analyzed, representing the x axis. The intensity for each mass found in each of the files selected was then filled into its representative x,y coordinate. Coordinates that did not contain an intensity value were left blank. Once in the array, the data were further processed, visualized and interpreted, and putative chemical identities were assigned. Each of the spectra were then peak picked to obtain the mass and intensity of all metabolites detected. These data from all of the modes were then merged to create one data file per sample. The data from all 136 samples was then merged and aligned to create a two-dimensional metabolite array in which each sample is represented by a column and each unique metabolite is represented by a single row. In the cell corresponding to a given metabolite sample combination, the intensity of the metabolite in that sample is displayed. When the data is represented in this format, metabolites showing differences between groups of samples were determined. The same procedure was utilized to combine the 11 CSF samples in a two-dimensional metabolite array.
- A. Serum Biomarkers
- A student's T-test was used to select for metabolites which differed significantly between the following different clinical groups in serum. Metabolites that were less than p<0.05 were considered significant.
- A1 - Clinically diagnosed AD patients (n=75) vs. non-demented controls (n=31). This comparison yielded 262 metabolites (see Table 1).
- A2 - Clinically diagnosed AD patients with a significant cognitive impairment (n=32) vs. non-demented controls (n=31). This comparison yielded 292 metabolites (see Table 2).
- A3 - Clinically diagnosed AD patients with a significant cognitive impairment (n=32) vs. clinically diagnosed non-AD patients with a significant cognitive impairment (n=30); this comparison yielded 118 metabolites markers (see Table 3).
- A4 - Clinically diagnosed AD patients with significant cognitive impairment (n=32) vs. clinically diagnosed AD patients without significant cognitive impairment (n=43). This comparison yielded 97 metabolites markers (see Table 4).
- A5 - Clinically diagnosed non-AD patients (n=30) vs. non-demented controls (n=31); this comparison yielded 199 metabolites markers (see Table 5).
- A6 - Clinically diagnosed AD patients with mild cognitive impairment (n=43) vs. non-demented controls (n=31). This comparison yielded 136 metabolites (see Table 6).
- A7 - Patients with significant cognitive impairment (n=42) and patients with a mild cognitive impairment (n=43). This comparison yielded 81 metabolites (Table 7).
- Tables 1-7 show biochemical markers whose concentrations or amounts in serum are significantly different (p<0.05) between the tested populations and therefore have potential diagnostic utility for identifying each of the aforesaid populations. The features are described by their accurate mass and analysis mode, which together are sufficient to provide the putative molecular formulas and chemical characteristics (such as polarity and putative functional groups) for each metabolite.
- From the initial lists of several hundred possible metabolites, it was determined that a combination of 8 metabolites fulfills the criteria for a serum dementia test: the combination can differentiate AD dementia from non-AD dementia, the early stages of AD and healthy controls. The best combination of 8 metabolites included the metabolites with neutral masses (measured in Daltons) 541.3432, 569.3687, 699.5198, 723.5195, 723.5197, 751.5555, 803.568, 886.5582. Although these are the actual masses, a person skilled in the art of this technology would recognize that +/- 5 ppm difference would indicate the same metabolite.
- In analyzing the present results, a person of skill in the art would understand that the following clinical groups are of interest: non-AD with significant cognitive impairment, AD with significant cognitive impairment, AD without significant cognitive impairment and non-demented controls. Bar graphs representing the mean +/-SEM of the 8 biomarkers for the four different clinical groups are shown in
Figure 1 . Relative to control, non-demented individuals, the three non-control states can be described as follows: - 1. Non-AD with significant cognitive impairment vs. control:
- a. Biomarker 541.3432 - decreased
- b. Biomarker 569.3687 - decreased
- c. Biomarker 699.5198 - no difference
- d. Biomarker 723.5195 - no difference
- e. Biomarker 723.5197 - no difference
- f. Biomarker 751.5555 - no difference
- g. Biomarker 803.568 - decreased
- h. Biomarker 886.5582 - decreased
- 2. Clinically diagnosed AD with significant cognitive impairment vs. control
- a. Biomarker 541.3432 - decreased
- b. Biomarker 569.3687 - decreased
- c. Biomarker 699.5198 - decreased
- d. Biomarker 723.5195 - decreased
- e. Biomarker 723.5197 - decreased
- f. Biomarker 751.5555 - decreased
- g. Biomarker 803.568 - decreased
- h. Biomarker 886.5582 - decreased
- 3. Clinically diagnosed AD without significant cognitive impairment vs. control
- a. Biomarker 541.3432 - decreased
- b. Biomarker 569.3687 - no difference
- c. Biomarker 699.5198 - decreased
- d. Biomarker 723.5195 - decreased
- e. Biomarker 723.5197 - decreased
- f. Biomarker 751.5555 - decreased
- g. Biomarker 803.568 - no difference
- h. Biomarker 886.5582 - no difference
- In each of the three non-control cases described above, a unique subset of markers was decreased.
- Bar graphs representing the mean +/- SEM of the 8 biomarkers for the two different clinical groups with a significant cognitive impairment are shown in
Figure 2 . Relative to non-AD dementia with significant cognitive impairment, AD patients with significant cognitive impairment can be described as: - a. Biomarker 541.3432 - no difference
- b. Biomarker 569.3687 - no difference
- c. Biomarker 699.5198 - decreased
- d. Biomarker 723.5195 - decreased
- e. Biomarker 723.5197 - decreased
- f. Biomarker 751.5555 - decreased
- g. Biomarker 803.568 - no difference
- h. Biomarker 886.5582 - no difference
- The results show a clear distinction between the serum of individuals with clinically diagnosed AD WITH a significant cognitive impairment, individuals with clinically diagnosed AD WITHOUT a significant cognitive impairment (this could be early stage AD), individuals with non-AD dementia WITH a significant cognitive impairment, and non-demented controls. These findings are capable of identifying and distinguishing the different types of dementia from one another and from the early stages of cognitive impairment as described in this application. From the above results, it can be further concluded that the metabolite markers with masses 699.5198, 723.5195, 723.5997, 751.5555 are specific for AD pathology; while markers with masses of 541.3432, 569.3687, 803.568, 886.5582 are specific for cognitive impaired based on ADAS-cog testing.
- A second neuropsychological test, Folstein's Mini-Mental State Exam (MMSE), which measures cognitive impairment, was applied to all 136 patients. The MMSE is widely used and is an extensively validated test of orientation, short and long-term memory, praxis, language and comprehension. In the clinically diagnosed AD patients that had no significant cognitive impairment (n=43), 15 of those patients had a score on MMSE that would indicate normal cognition (MMSE ≥ 28), whereas the remaining 28 patients had MMSE scores that indicated a mild impairment (score 18-23, n=11) or severe cognitive impairment (score 9-17, n=17). A F-test was used to select for metabolites which differed significantly between the MMSE scores (normal, mild or severe cognitive impairment) for 43 clinically diagnosed AD patients with no significant cognitive impairment on the ADAS-cog test (p<0.05). 23 metabolites met this criterion (shown in Table 8). These are all features which differ statistically between the two populations and therefore have potential diagnostic utility. The features are described by their accurate mass and analysis mode, which together are sufficient to provide the putative molecular formulas and chemical characteristics (such as polarity and putative functional groups) of each metabolite.
- An optimal subset of 4 metabolites, all of which were observed to decrease, from the 23 metabolites was selected using Principal Components Analysis (PCA). The 4 metabolites able to produce the greatest separation between the groups were 565.3394, 569.369, 801.555, 857.6186. The metabolites are indicated by asterisks on Table 8 and represent a 4-metabolite biomarker panel associated with cognitive impairment on MMSE. The fact that a second set of metabolites were associated cognitive impairment suggests that the MMSE must be specific to one or several other cognitive states that the ADAS-cog is not specifically measuring.
- Therefore, a total of three 4-biomarker panels can be applied to the 136 patients to classify them into one of 8 categories which will simultaneously indicate the presence of AD pathology (biomarkers 699.5198, 723.5195, 723.5997, 751.5555), cognitive impaired on ADAS-cog (541.3432, 569.3687, 803.568, 886.5582) and cognitive impaired on MMSE (565.3394, 569.369, 801.555, 857.6186). Using a 0/1 binary model, each patient can be labeled using a 3 digit code from "000" indicating no cognitive impairment and no AD pathology to "111" indicating both MMSE and ADAS-cog impairment and AD pathology. Table 9 indicates the separation of the patient samples into the 8 categories.
- The three 4-biomaker panels were applied individually to the metabolite array and the patients that showed the best separation on the PCA plot were selected. These patients were selected because they represented the best discriminator between the 3 different groups [AD (n=20) vs. non-AD pathology (n=20), high ADAS score (n=20) vs. low ADAS score (n=12), impaired cognition on the MMSE score (n=20) vs. normal cognition on the MMSE score (n=20)]. A student's t-test was performed between the different clinical groups (p<0.05). The 116 metabolites that met the p-value criteria for AD vs. non-AD pathology are listed in Table 10. Table 11 lists the 124 metabolites that met the p-value criteria for high ADAS score vs. low ADAS score, and Table 12 contains the list of 344 metabolites that met the p-value criteria for impaired score on MMSE and normal cognition on MMSE.
- Both the ADAS-cog and MMSE neuropsychological tests measure cognitive errors related to praxis, orientation, memory and language ability. Therefore, it would be reasonable to suggest biomarkers associated with ADAS-cog score and/or MMSE are related to the ability to conceive of, organize and initiate unfamiliar sequences, the awareness of one's self and environment, as well as memory and language ability. As such, these biomarkers are not exclusive to cognitive impairment associated with dementia; rather any condition that results in any type of praxis, orientation, memory and/or language deficit would show a similar reduction within a biological sample.
- The sample set (136 individuals) used for this discovery was not trivial, and was comprised of individuals of various ethnic and geographical backgrounds, and of varying age and health status. Therefore, there is sound reason to expect that the findings are representative of the general dementia population.
- B. CSF Biomarkers.
- A student's T-test was used to select for metabolites which differ between the clinically diagnosed AD patients and clinically diagnosed non-AD patients in CSF samples (p<0.05). 42 metabolites met this criterion (shown in Table 13). These metabolites differed statistically between the two populations and therefore have potential diagnostic utility. The metabolites are described by their accurate mass and analysis mode, which together are sufficient to provide the putative molecular formulas and chemical characteristics (such as polarity and putative functional groups) of each metabolite.
- An optimal subset of 12 metabolites from the 42 metabolites described above was selected. These metabolites had the greatest statistical difference between the two groups (p<0.01). Metabolites were excluded if they were not detected in at least 60% of the samples in each group (4/6 clinically diagnosed AD and 3/5 clinically diagnosed non-AD). The panel comprises masses 207.0822, 275.8712, 371.7311, 373.728, 432.1532, 485.5603, 487.6482, 562.46, 622.2539, 640.2637, 730.6493, 742.2972. Although these are the actual masses, a person skilled in the art of this technology would recognize that an +/- 5 ppm difference would indicate the same metabolite.
- The 12 biomarker panel was tested using 5 CSF samples from undiagnosed patients. The only information available on the samples was the subject's age, gender, and whether an individual had a cognitive deficit. If the 12 biomarker panel was correct, the subject could be diagnosed as having AD dementia, non-AD dementia, or normal. From the 5 CSF samples provided by undiagnosed patients, 1 was diagnosed with non-AD dementia, 2 with AD dementia, and 2 as normal. The two normal subjects did not have a cognitive impairment as indicated by the Mini Mental State Examination (MMSE) score. Therefore, using a 12 metabolite feature set it was possible to both diagnose AD and non-AD dementia.
- Bar graphs representing the mean +/- SEM of the 12 biomarkers for the two different clinical groups are shown in
Figure 3 . Relative to non-AD dementia with significant cognitive impairment, AD patients with a significant cognitive impairment can be described as: - a. Biomarker 207.0822 - increased
- b. Biomarker 275.8712 - decreased
- c. Biomarker 371.7311 - decreased
- d. Biomarker 373.728 - decreased
- e. Biomarker 432.1532 - increased
- f. Biomarker 485.5603 - decreased
- g. Biomarker 487.6482 - decreased
- h. Biomarker 562.46 - increased
- i. Biomarker 622.2539 - increased
- j. Biomarker 640.2637 - increased
- k. Biomarker 730.6493 - increased
- l. Biomarker 742.2972 -increased
- Based on these results, a clear distinction was made between the CSF of clinically diagnosed non-AD and AD patients. Therefore, such findings are capable of identifying and distinguishing AD dementia from non-AD dementia and can form the basis of a dementia diagnostic test in CSF as described in this application. It is expected that the finding are representative of the general dementia population.
- Although a non-targeted FTMS-based platform was used in the identification and selection of the optimal metabolites in serum and CSF, other methods of subsequently detecting the molecules, including other MS-based platforms, ELISAs, colorimetric assays, etc can used to detect the molecules.
- A. Serum Biomarkers
- An independent mass spectrometry method was used to verify the intensity differences between non-demented normal and clinically-diagnosed AD serums of the eight diagnostic metabolites discovered using the FTMS method. Eight representative clinically-diagnosed AD sample extracts and eight representative non-demented control sample extracts were analyzed by LC-MS using an
HP 1100 high-performance liquid chromatography interfaced to an ABI Q-Star mass spectrometer. - Aqueous fractions from five clinically-diagnosed AD and five non-demented control sample extracts were evaporated under nitrogen gas and reconstituted in 100 uL of methanol:water:formic acid (5:94.9:0.1). Five µL of the reconstituted sample was subjected to HPLC (Agilent Technologies) (
HP 1100 with Metasil AQ 3u, 100 x 2 mm column) for full scan and 10 µL for MS/MS at a flow rate of 0.2 ml/min. - Eluate from the HPLC was analyzed using an ABI Q-Star XL mass spectrometer fitted with a Turboion spray ion (ESI) source in negative mode. The scan type in full scan mode was time-of-flight (TOF) with an accumulation time of 1.0000 seconds, mass range between 50 and 1500 Da, and duration time of 70 min. Source parameters were as follows: Ion source gas 1 (GS 1) 55; Ion source gas 2 (GS2) 90; Curtain gas (CUR) 40; Nebulizer Current (NC) 0;
Temperature 450°C; Declustering Potential (DP) -55; Focusing Potential (FP) -265; Declustering Potential 2 (DP2) -15. In MS/MS mode, scan type was product ion, accumulation time was 1.0000 seconds, scan range between 50 and 1000 Da andduration time 70 min. All source parameters are the same as above, with a collision energy of (CE) of -50 V and collision gas (CAD, nitrogen) of 5 psi. - Six of the eight metabolite masses previously discovered on the FTMS were verified on the ABI Q-Star mass spectrometer. The metabolites with the accurate masses of 723.5195 and 723.5197 were determined to be the same metabolite, and the metabolite with accurate mass of 886.5582 was not detected. Therefore, only six metabolites (699.5198, 723.5195, 751.5555, 541.3432, 569.3687, 803.568) were used for the remaining analyses.
- The extracted ion chromatograms (EICs) for the six biomarkers are shown in
Figure 4 The top panel shows the eight non-demented control EICs, and the bottom panel of each shows the eight clinically-diagnosed AD EICs. The sensitivity of the Q-star is superior to the FTMS, resulting in a greater magnitude in intensity difference between the non-demented control subjects and clinically diagnosed AD population for the selected biomarkers.Figure 5 shows the average raw intensity of the six biomarkers of the eight non-demented control and eight clinically-diagnosed AD samples as detected on the FTMS and Q-Star. - B. CSF Biomarkers
- The metabolites and their associations with the clinical variables described in this invention are further confirmed using an independent mass spectrometry system. Representative sample extracts from each variable group are re-analyzed by LC-MS using an
HP 1050 high-performance liquid chromatography, or equivalent interfaced to an ABI Q-Star, or equivalent mass spectrometer to obtain mass and intensity information for the purpose of identifying metabolites that differ in intensity between the clinical variables under investigation. - Characteristics that can be used for structure elucidation of metabolites include accurate mass and molecular formula determination, polarity, acid/base properties, NMR spectra, and MS/MS or MSn spectra. These data, and in particular theMS/MS spectrum, can be used as fingerprints of a particular metabolite and are unique identifiers of a particular metabolite regardless of whether the complete structure has been determined.
- A. Serum Biomarkers - Structural Elucidation
- 1. LC retention time. The extracts containing the metabolites of interest were subjected to reverse phase LC-MS using a
C 18 column and analysis by MS as described in Example 2 above. Table 14 lists the resulting retention times and detected masses for each of the six serum metabolite markers. The retention time for all six of the biomarkers is approximately 29-42 minutes under these HPLC conditions. - 2. Extraction conditions. The conditions of extraction also provide insights about the chemical properties of the biomarkers. All eight metabolites in the serum (from Example 1) were ionized in negative mode (3 in APCI and 5 in ESI), which is indicative of a molecule containing an acidic moiety such as a carboxylic acid or phosphate. Any moiety capable of losing a hydrogen atom can be detected in negative ionization mode. Three of the metabolite markers were extracted into an organic ethyl acetate fraction (plasmalogen metabolites), indicating that these metabolites are non-polar under acidic condition; one was extracted into an organic ethyl acetate fraction dried down and resuspended in butanol, indicating that this metabolite (plasmalogen metabolite) is non-polar under acidic conditions. Four of the metabolites (phosphatidyl choline related metabolites) did not extract into the organic fraction, but rather remained in the aqueous methanol/ammonium hydroxide fraction, indicating that these metabolites are very polar.
- 3. MS/MS spectra. The six serum metabolites identified as having the best diagnostic ability were subject to MS/MS fragmentation using collision induced dissociation (CID). The structure of a given molecule will dictate a specific fragmentation pattern under defined conditions that is specific for that molecule (equivalent to a person's fingerprint). Even slight changes to the molecule's structure can result in a different fragmentation pattern. In addition to providing a fingerprint of the molecule's identity, the fragments generated by CID can be used to gain insights about the structure of a molecule, and for generating a very specific high-throughput quantitative detection method (see [30-33] for examples).
Figures 6 through 11 show the MS/MS spectra for each of the six markers at -50V collision energy (CE) voltages. - The masses resulting from CID MS/MS of each parent mass were then used to calculate putative formulas for each of the fragment ions for the metabolites specific to the ADAS-cog scores, as shown in the tables for each marker (Tables 15 to 17). The information inherent in the fragmentation data is highly specific and descriptive for each metabolite, which can be used to gain structural insights about each molecule. MS/MS was carried out on the ABI-Q Star XL with all parameters as previously mentioned using Nitrogen as the collision gas at 5 psi and collision energy (CE) settings of -50 volts.
- Based on the fragmentation pattern and masses, the metabolite markers specific to the ADAS-cog scores have been assigned structures having a phosphatidylcholine-related backbone. From the CID MS/MS, the molecular formulae of 3 metabolites specific to the ADAS-cog scores (accurate neutral masses of 541.3432, 569.3687, 803.568) were determined to be C25H51NO9P, C27H55NO9P, and C43H81NO10P, respectively. Their structures are shown in
Figures 12-14 . The putative structures of additional markers are shown inFigure 15 . - The 3 metabolites specific to AD pathology, with accurate neutral masses of 751.5555, 699.5198, and 723.5195, were analyzed using FT-ICRMS and LC/MS techniques, and by HRAPCI-MS, and MS/MS spectral analysis. Daughter ions determined from the fragmentation pattern for each metabolite marker are shown in
figures 16-18 . The molecular formulae were determined to be C43H78NO7P, C39H74NO7P, and C41H74NO7P, respectively. Based on the fragmentation pattern and masses, the metabolite markers specific to AD patehology have been assigned structures having an ethanolamine plasmalogen backbone. - For the 751.5555 metabolite (C43H78NO7P), and due to negative ionization conditions, the HRAPCI-MS m/z measured was 750.5482 ([M - H]-, calcd. 750.5477 for C43H77NO7P). The relative intensity of the MS/MS fragment masses (MS/MS m/z) were measured as follows: 750 ([M - H]-, 25%), 482 (1%), 464 (12%), 446 (5%), 329 (8%), 303 (100%), 259 (12%), 205 (8%), 140 (8%). The MS/MS fragments are shown in
Figure 16 . The strong MS/MS fragment ion at m/z 303 and other fragment ions due to loss of sn-2 acyl group (m/z 464) as a ketone, loss of the sn-1 vinyl ether side chain (m/z 482) though small, and the fragment ion due to phosphoethanolamine (m/z 140) indicated the metabolite to be a plasmenyl phosphatidylethanolamine-type molecule with arachidonic acid at the sn-2 position. Based on these results, the structure of the 751.5555 metabolite was elucidated as 1-O-1'-(Z)-octadecenyl-2-arachidoyl-sn-glycero-3-phosphoethanolamine. This was confirmed by comparison of their LC/MS and MS/MS spectral data (Figure 19 ) - The two remaining metabolites with molecular formulae C39H74NO7P (neutral mass 699.5198) and C41H74NO7P (neutral mass 723.5195) were found to co-elute with the 751.5555 metabolite in LC/MS. The metabolites' MS/MS fragment ions and fragmentation patterns were similar to those of the 751.5555 metabolite.
- For the 699.5198 metabolite, the HRAPCI-MS m/z measured was 698.5125 ([M - H]-, calcd. 698.5130 for C39H73NO7P). The relative intensity of the MS/MS m/z were measured as follows: 698 ([M-H]-, 8%), 536 (4%), 279 (100%), 255 (15%), 119 (10%). The MS/MS fragments are shown in
Figure 17 . Based on these results and on its structural similarity to the 751.5555 metabolite, the structure of the 699.5198 metabolite was determined to be 1-O-1'-(Z)-hexadecenyl-2-linoleyl-sn-glycero-3-phosphoethanolamine. - For the 723.5195 metabolite, the HRAPCI-MS m/z measured was 722.5124 ([M-H]-, calcd. 722.5130 for C41H73NO7P). The relative intensity of the MS/MS m/z were measured as follows: 722 ([M-H]-, 12%), 482 (1%), 436 (15%), 418 (6%), 303 (100%), 279 (6%), 259 (15%), 255 (10%), 205 (4%),140 (5%). The MS/MS fragments are shown in
Figure 18 . Based on these results and on its structural similarity to the 751.5555 metabolite, the structure of the 723.5195 metabolite was proposed as 1-O-1'-(Z)-hexadecenyl-2-arachidoyl-sn-glycero-3-phosphoethanolamine. - 4. NMR spectra. The MS/MS fragmentation provides highly specific descriptive information about a metabolite. However, nuclear magnetic resonance (NMR) can assist in solving and confirming the structures of the metabolites. As NMR analysis techniques are typically less sensitive than mass spectrometry techniques, multiple injections are performed on the HPLC and the retention time window corresponding to the metabolites of interest collected and combined. The combined extract is then evaporated to dryness and reconstituted in the appropriate solvent for NMR analysis.
- Multiple NMR techniques and instruments are available, for example, NMR spectral data are recorded on
Bruker Avance 600 MHz spectrometer with cryogenic probe after the chromatographic separation and purification of the metabolites of interest. 1H NMR, 13C NMR, noe-difference spec, as well as 2-D NMR techniques like heteronuclear multiple quantum correlation (HMQC), and heteronuclear multiple bond correlation (HMBC) are used for structure elucidation work on the biomarkers. - B. CSF Biomarkers
- The structural characteristics (LC retention time, extraction conditions, MS/MS fragments) for the 12 CSF metabolite markers are determined in the same manner as detailed above.
- Based on the fact that the metabolite markers specific to AD pathology have an ethanolamine plasmalogen backbone, it was further investigated whether other serum plasmalogens could be indicative of AD. This characterization of ethanolamine phospholipids in serum was made using a chromatographic method combined with a mass spectrometric detector.
- For MS/MS applications and experiments involving chromatography, an
Agilent 1100 HPLC system was used in combination with an Applied Biosystems QSTAR XL mass spectrometer. An Agilent Zorbax RX-SIL (4.6 x 150mm, 5µm) column was used for normal phase chromatography. Conditions included an isocratic mobile phase (55:40:5 isopropanol:hexane:H2O) at a flow rate of 1.0mL/min for a total run time of 15min. The column was heated to 35°C. The sample injection volume was 10µL. Organic solvent extracts (ethyl acetate) of samples were evaporated to dryness under nitrogen gas and the residue was reconstituted in 100µL of 55:40:5 isopropanol:hexane:H2O solution prior to injection. - The QSTAR XL instrument was equipped with an APCI (Heated Nebulizer) source operating in negative mode. Values of major instrument parameters were DP, -60; FP, -265; DP2, -15; GS1, 75; GS2, 15; CUR, 30; NC, -3; TEM, 400°C; Scan range, 50-1500amu; Accumulation time, I sec.
- The three classes of ethanolamine phospholipids are described as diacyl (also referred to herein as PtdEt), alkyl-acyl (also referred to herein as plasmanyl) or alkenyl-acyl (also referred to herein as EtnP1 or plasmenyl). Various basic structures of ethanolamine phospholipids are shown in
Figure 20 , along with the standard naming convention used herein. Table 18 shows a list of plasmanyl and plasmenyl ethanolamine phospholipids (M5-M24) that are presently identified and are of particular interest. -
Figures 21-32 show structural information pertaining to selected metabolites detected in serum. These figures illustrate the retention time, MS/MS fragmentation patterns, and putative structures for selected molecules. Due to the conserved MS/MS fragmentation mechanism between these molecules, the theoretical MS/MS transition can be determined for any ethanolamine phospholipid by using a combination of the parent ion mass and the fragment mass of the moiety at either the sn-1 or sn-2 position. - A high throughput method for differential diagnosis of AD dementia and non-AD dementia states was established.
- High throughput screening (HTS) was performed with a linear ion trap mass spectrometer (Q-
trap 4000, Applied Biosystem) coupled withAgilent 1100 LC system. Sample was prepared by adding 15uL of internal standard (5 µg/mL of (24-13C)-Cholic Acid in methanol) to 120uL ethyl acetate fraction of each sample.100 ul sample was injected by flow injection analysis (FIA), and monitored under negative APCI mode. The method was based on multiple reaction monitoring (MRM) scan mode of one parent/daughter transition for each metabolite and one internal standard. Each transition was scanned for 70 ms for a total cycle time of 2.475 sec. The isocratic 10% EtOAc in MeOH elution was performed with a flow rate at 360 µl/min for 1min. The source parameters were set as follows: CUR: 10.0, CAD: 8, NC: -4.0, TEM: 400, GS1:30, GS2: 50, interface heater on. The compound parameters were set as follows: DP: -120.0, EP: - 10, NC: -4.0, CE: -40, CXP: -15.Figure 33 illustrates a representative standard curve for this method for EtnPls 16:0/22:6 generated by diluting a normal serum sample while maintaining a constant concentration of internal standard (24-13C)-Cholic Acid). - The effect of aging and severity of dementia on serum levels of ethanolamine phospholipids in 752 subjects aged 40-95 with various levels of dementia was investigated. The clinical data on the subject cohorts is shown in Table 19.
- The effect of age was evaluated using a set of aged 30 to 95 subjects of untested cognitive status who did not suffer from dementia. Subjects were divided into one of five subgroups based upon their decade of life (30's, 40's, 50's, 60's, and ≥70). The 40-49 cohort was used as the pre-dementia reference group due to the low incidence of dementia at this age. The metabolites of interest (see Table 18) were measured using the high throughput method described in Example 5.
- The effect of dementia severity was determined in subjects aged 56 to 95, comprised of 68 cognitively confirmed non-demented subjects (MMSE ≥ 28); 256 subjects currently diagnosed with SDAT (ADAS-cog 6-70, MMSE 0-26); 20 post-mortem confirmed SDAT and 20 post-mortem confirmed controls. Subjects were grouped into one of four dementia subgroups based upon either their MMSE score [≥ 28 = Cognitively Normal] or their ADAS-cog score [5-19 = low cognitive impairment); 20-39 = moderate; 40-70 = severe].
- 6A. Absolute levels of Ethanolamine Phospholipids
- A significant gender bias was observed in that only females exhibited an age-related decrease in EtnPls. Free docosohexanoic acid (DHA, Free 22:6, M25) in both males and females was significantly increased in the 50-59, 60-69, and 70+ cohorts relative to the 40-49 cohorts. However, only males exhibited a concomitant increase in both 16:0/22:6-EtnPl (M19) and 18:0/22:6-EtnPl (M24) (see Tables 20-21 for males; Tables 22-23 for females). These data indicate that, in females, there may be an age-related dysfunction in the packaging of DHA into EtnPls. This gender difference may explain the increased incidence of dementia in very old females (19).
- In both males and females, the majority of EtnPls in all dementia subgroups were significantly reduced relative to cognitive controls. In both males and females, free DHA (M25) was significantly decreased only in severely demented subjects. In females, a dementia effect was observed for three EtnPls (16:0/18:2 (M16),18:0/18:2 (M21), and 16:0/20:4 (M17)) in that both 18:2-containing EtnPls were significantly lower in severely demented subjects versus either low or moderately demented females, and 16:0/20:4 (M17) was lower in the severe group versus the low group (see Tables 24-26). In males, a dementia effect was observed for DHA (M25) and 16:0/22:6 (M19) in that free DHA (M25) was reduced in the moderate group versus the low group and in the severe group versus the moderate group and 16:0/22:6 (M19) was reduced in the severe group versus the low group (see Tables 27-29). These results indicate that the progressive cognitive deterioration in AD manifests slightly differently in the two sexes.
- Brain white matter contains primarily 18:1- and 18:2-containing EtnPls with low levels of 20:4-containing and 22:6-containing EtnPls, whereas gray matter contains significantly higher levels of 20:4-containing and 22:6-containing EtnPls [34]. In females, increasing dementia appears to affect both white (18:2) and gray (20:4) matter EtnPls equally, whereas in males predominantly gray (22:6) matter EtnPls appear to be affected to a greater extent.
- Post-mortem collected serum samples from 20 pathologically confirmed AD subjects and 20 subjects containing minimal amyloid deposition were also analyzed. Both gray and white matter EtnPls were significantly decreased in post-mortem confirmed AD relative to age matched controls (see Tables 30 and 31).
- 6B. Relative levels of Ethanolamine Phospholipid
- The data collected above was re-analyzed to obtain a ratio between the levels of each ethanolamine phospholipids with 16:0/18:0 PtdEt (M01). Measurement of the ethanolamine phospholipid levels in this manner is more stable and reproducible than measurement of the absolute levels. Furthermore, because the 16:0/18:0 PtdEt (M01) is naturally present in all samples and does not appear to vary significantly over disease states, this approach minimizes the sample-to-sample variability (due to handling, extraction, etc).
- The results obtained further support the observations and conclusions made in 6A. The gender bias was with respect to an age-related decrease in EtnPls was evident in data where ratios to M01 were measured (see Tables 32-33 for males; Tables 34-35 for females). The same trends with respect to the severity of cognitive impairment were also observed (see Tables 36-38 for males; Tables 39-41 for females). In addition, pathology results on post-mortem serum samples show similar trends (Tables 42 and 43).
- Both the absolute EtnPls levels and the EtnPls to M01 ratio exhibited a significant dementia effect. The EtnPls to M01 ratios of all eight EtnPls (16:0/18:1 (M15), 16:0/18:2 (M16), 16:0/20:4 (M17), 16:0/22:6 (M19), 18:0/18:1 (M20), 18:0/18:2 (M21), 18:0/20:4 (M22), 18:0/22:6 (M24)) were significantly lower in the severely demented group relative to the low group while six of the eight were significantly lower in the severe group relative to the moderate group
- A white and gray matter specific EtnPl scoring system was developed whereby each EtnPl in each subject was normalized to their respective gender-specific cognitively normal mean, log2 transformed and mean centered. Each subject's white matter score was taken as the lowest such value of plasmenyl 16:0/18:1 (M15), 16:0/18:2 (M 16), 18:0/18:1 (M20), and 18:0/18:2 (M21) EtnPls, and their gray matter score as the lowest of plasmenyl 16:0/20:4 (M17), 16:0/22:6 (M19), 18:0/20:4 (M22), and 18:0/22:6 (M24) EtnPls.
- These simplified scores revealed that both gray and white matter EtnPls were decreased at all stages of AD (
Figure 39 ) and that the levels in post-mortem confirmed AD closely matched levels in severely demented subjects of both sexes (Tables 44-45). The cross-sectional white and gray matter score distributions in subjects of various levels of dementia clearly showed a dementia dependent shift in the population means (Tables 46-47). The effect of age on the white and gray matter scores was also determined (Tables 48-49). This also indicated that changes in serum levels of gray matter EtnPls may precede white matter changes and potentially be an early risk factor for AD. Such cross-sectional data does not account for baseline variability among subjects. Individual longitudinal trajectories of these scores may be more accurate at detecting early risk of AD in otherwise healthy, non-demented subjects. - Based on these scores, risk prediction can be performed on both male and female subjects (Tables 49-50) where a cut-off value that results in approximately 20-30% of cognitively normal subjects being classified as either intermediate or high risk is used. Using this cut-off value, a subject's white and gray matter score is evaluated. If the subject tests normal on both scores, the subject is deemed to be at low risk. If the subject tests positive on one of the scores, the subjects is deemed to be at intermediate risk and if the subject tests positive on both scores, the subject is deemed to be at high risk.
- The effect of dementia severity was determined using 324 subjects (176 female, 148 male) aged 56 to 95, comprised of 68 cognitively confirmed non-demented subjects (MMSE≥ 28) and 256 subjects currently diagnosed with AD (ADAS-cog 6-70, MMSE 0-26). The effect of AD pathology was determined using serum samples collected from 20 post-mortem confirmed AD and 19 control subjects (Table 19). Subjects were grouped into one of four dementia severity cohorts based upon either their MMSE score [≥ 28 = Cognitively Normal] or their ADAS-cog score [5-19 = low cognitive impairment; 20-39 = moderate; 40-70 = severe].
- Mean serum levels of 16:0/18:1 (M15), 16:0/18:2 (M16), 16:0/20:4 (M17), 16:0/22:6 (M19), 18:0/18: (M20), 18:0/18:2 (M21), 18:0/20:4 (M22), 18:0/22:6 (M24) EtnPls; free docosahexaenoic acid (DHA, Free 22:6, M25); and phosphatidylethanolamine (PtdEt) 16:0/18:0 (D16:0/18:0; M01) were determined for each group (
Figure 34 ). All eight EtnPls in all dementia subgroups were observed to be significantly reduced relative to cognitive controls (24 pair-wise comparisons, t-test p-values 2.6e-2 to 2.0e-10, median = 3.9e-5). Free DHA (M25) was significantly decreased in both moderately and severely demented subjects (p<0.05). All eight EtnPls were also significantly decreased in post-mortem confirmed SDAT relative to age matched controls. D16:0/18:0 (M01) levels, a non-plasmalogen phoshopholipid remained unchanged across the different dementia cohorts. - The EtnPls 16:0/22:6 (M19) to PtdEt 16:0/18:0 ratio (M01) (DHA-EtnPls) showed the strongest overall sex-independent dementia effect (Tables 38, 41) and was used for all subsequent population distributions and comparisons. A summary of the key comparisons using this ratio are listed in Table 52. This ratio was then log(2) transformed and used to create a population histogram for each cohort of increasing cognitive impairment (
Figure 35 ). A cut-off value was selected based upon the findings of Bennett et al [35], (i.e. ~30% of the CN group being detected as AD) (Figure 35 , dotted line). Using this cut-off, 63%, 79% and 83% of low, moderate and severely demented subjects, respectively, were subsequently classified as AD. - To compare these distributions with the known distributions of Aβ pathology in AD, the results of four prospective pathology studies [8, 35-37] were combined to generate the theoretical population distributions of Aβ pathology in demented and non-demented populations, assuming that Aβ is normally distributed in each population (
Figure 36A ). These studies reported that only 71% (140/198) of clinically diagnosed AD subjects have AD pathology at death and that 32% (87/268) of cognitively normal subjects meet neuropathological criteria for AD at death. When the data from all of our cognitively tested subjects were combined, 32% (22/68) of our non-demented population and 75% (192/256) of our demented population were classified as AD positive based upon their serum EtnPls level (Figure 36B ). This comparison revealed that the observed distribution of depleted 22:6-containing EtnPls perfectly matched the theoretical distribution of AD pathology in demented and non-demented subjects. - To investigate whether a correlation between the decrease in EtnPls and increasing dementia in the clinically diagnosed AD population exists, a linear regression analysis was performed using the mean 22:6-containing EtnPls level (normalized to CN) of each of the dementia cohorts and the average ADAS-cog score for each of these three cohorts (
Figure 37 ). A very high correlation was observed between the mean 22:6-containing EtnPls level and the mean ADAS-cog scores of the three dementia cohorts (r2=0.99). However, this linear decrease did not extrapolate back to the CN group (X vs. CN). Assuming a clinical AD progression of 7.5 ADAS-cog units per year, this extrapolation predicts that that 22:6-containing EtnPls levels begin to decline approximately seven years before clinical cognitive impairment (ADAS-cog = 15) is evident. - To investigate whether the above prediction could be verified experimentally, the serum 22:6-containing EtnPls levels in 209 subjects (110 male, 99 female, Table 19) of unknown cognitive status but currently not diagnosed with dementia was determined and compared to the clinical AD and CN cohorts (
Figure 38 ). The results of this analysis revealed a significant drop in serum 22:6-containing EtnPls in the aged 60-69 cohort versus the aged 50-59 cohort (Figure 38A ). This cohort also had significantly lower levels versus the CN group even though the CN group was, on average, 13 years older. Interestingly, the aged 70-95 cohort was not significantly different from either the aged 50-59 cohort or the CN cohort, but had significantly higher levels than the SDAT cohort. - The distribution of serum DHA-EtnPls within each age group, as shown in
Figure 38B , was also examined. The population distributions of the five groups (three age groups, CN and AD) differentiated by age and dementia status reveal the presence of three distinct populations (P1-P3,Figure 38B ). The populations were assigned as: P1 - subjects with AD pathology and no remaining reserve capacity; P3 - subjects with little or no AD pathology; P2 - subjects that are transitioning from P3 to P1. These P2 subjects are hypothesized to have AD pathology and some level of reserve remaining. - Since AD subjects have a life expectancy of less than 10 years from diagnosis [38, 39] and low 22:6-containing EtnPls are highly associated with AD severity, the decreased number of P1 subjects observed in the aged 70-95 cohort is most likely due to differences in life expectancy between P1 and P2 or P3. The transitory nature of P2 is best illustrated by examining the different ratios between the percentages of subjects present in P3 compared to P2, as observed in the lower three panels of
Figure 7B . These three cohorts differ only in dementia status. The P3 to P2 ratio changes from 3:1 (68% versus 22%) in the confirmed cognitive normal group to an intermediate ratio of 1:1 (43% versus 46%) in the normal healthy elderly group of unknown cognitive status, to 0.6:1 (25% versus 40%) in the confirmed demented AD cohort. -
Table 1: Accurate mass features differing between clinically diagnosed AD patients and non-demented controls (p<0.05, log2 transformed). Detected Mass Analysis Mode AVG (log2) AD SEM AD AVG (log2) Normal SEM Normal log(2) Ratio P Value 723.5197 1204 3.576 0.039 4.350 0.056 0.822 5.09E-19 723.5195 1202 2.186 0.040 2.892 0.052 0.756 4.86E-17 724.5257 1204 2.866 0.032 3.463 0.055 0.828 4.15E-16 749.5367 1202 3.176 0.034 3.714 0.041 0.855 3.82E-15 751.5555 1204 4.575 0.041 5.248 0.060 0.872 1.07E-14 751.5529 1202 3.335 0.036 3.920 0.050 0.851 1.14E-14 752.5564 1202 2.251 0.038 2.836 0.050 0.794 3.13E-14 752.5583 1204 3.472 0.042 4.094 0.061 0.848 6.47E-13 699.5198 1204 2.216 0.038 2.775 0.054 0.799 6.76E-13 750.544 1204 3.279 0.038 3.858 0.063 0.850 1.07E-12 749.5407 1204 4.426 0.039 5.012 0.064 0.883 1.33E-12 541.3432 1102 3.315 0.033 3.798 0.048 0.873 1.42E-12 750.5402 1202 2.192 0.038 2.704 0.044 0.811 2.76E-12 725.5385 1204 2.884 0.043 3.417 0.054 0.844 1.28E-10 569.3687 1102 2.262 0.039 2.724 0.048 0.830 6.22E-10 727.5568 1204 3.518 0.038 3.986 0.060 0.882 1.70E-09 804.5713 1102 4.207 0.042 4.610 0.033 0.913 3.88E-08 803.568 1102 5.432 0.043 5.838 0.035 0.930 7.10E-08 726.5461 1204 2.808 0.032 3.150 0.050 0.892 7.50E-08 827.57 1102 4.151 0.048 4.630 0.062 0.897 9.42E-08 803.5445 1101 5.123 0.055 5.655 0.059 0.906 1.01E-07 555.3102 1102 1.818 0.045 2.240 0.046 0.812 1.27E-07 565.3394 1102 3.480 0.050 3.958 0.055 0.879 1.28E-07 804.5476 1101 4.169 0.056 4.703 0.060 0.887 1.33E-07 828.5737 1102 3.138 0.046 3.590 0.061 0.874 1.89E-07 567.3547 1102 2.822 0.041 3.218 0.054 0.877 2.89E-07 728.5627 1204 2.935 0.033 3.281 0.060 0.895 5.16E-07 817.5377 1102 2.282 0.048 2.712 0.057 0.842 8.85E-07 779.5444 1101 6.433 0.053 6.874 0.043 0.936 1.06E-06 780.5474 1101 5.437 0.053 5.875 0.043 0.925 1.28E-06 812.5762 1202 1.659 0.050 2.084 0.058 0.796 2.24E-06 832.6026 1102 3.455 0.041 3.795 0.040 0.910 2.48E-06 811.5732 1202 2.705 0.036 3.027 0.055 0.893 3.40E-06 871.5528 1102 3.068 0.042 3.408 0.040 0.900 3.47E-06 831.5997 1102 4.564 0.042 4.903 0.040 0.931 3.48E-06 793.5386 1102 3.604 0.043 3.950 0.039 0.912 3.50E-06 782.5085 1204 3.401 0.045 3.780 0.055 0.900 3.81E-06 805.5832 1102 4.075 0.047 4.485 0.068 0.909 3.87E-06 781.5617 1101 6.109 0.061 6.610 0.072 0.924 5.14E-06 813.5885 1202 3.012 0.030 3.276 0.048 0.919 6.23E-06 794.5421 1102 2.523 0.042 2.853 0.040 0.885 6.30E-06 814.5917 1202 2.041 0.026 2.289 0.051 0.892 7.46E-06 747.5245 1204 3.473 0.043 3.886 0.090 0.894 9.55E-06 837.5027 1101 3.578 0.045 3.933 0.050 0.910 1.02E-05 782.565 1101 5.083 0.063 5.589 0.078 0.909 1.09E-05 746.5717 1204 3.085 0.031 3.362 0.061 0.918 1.82E-05 829.5856 1102 4.043 0.048 4.398 0.046 0.919 1.85E-05 784.5237 1204 3.310 0.040 3.603 0.037 0.919 1.91E-05 786.5416 1204 3.815 0.035 4.087 0.043 0.933 1.91E-05 760.5216 1204 4.075 0.036 4.347 0.039 0.938 2.11E-05 745.5658 1204 3.937 0.034 4.242 0.068 0.928 2.12E-05 744.5536 1204 4.322 0.034 4.605 0.058 0.939 2.46E-05 783.5672 1101 3.755 0.068 4.259 0.079 0.882 3.48E-05 807.5758 1101 5.736 0.052 6.102 0.047 0.940 3.69E-05 808.5792 1101 4.697 0.052 5.063 0.047 0.928 4.20E-05 743.5471 1204 5.286 0.036 5.579 0.063 0.947 4.94E-05 482.3215 1202 1.971 0.038 2.251 0.062 0.875 0.0001 755.486 1204 3.221 0.047 3.561 0.057 0.905 0.0001 758.5092 1204 4.574 0.033 4.808 0.042 0.951 0.0001 775.5533 1202 2.120 0.044 2.449 0.068 0.866 0.0001 787.5729 1202 1.847 0.040 2.145 0.057 0.861 0.0001 795.5181 1101 2.630 0.059 3.044 0.064 0.864 0.0001 795.555 1102 2.665 0.043 2.986 0.065 0.892 0.0001 805.5605 1101 5.414 0.057 5.785 0.048 0.936 0.0001 831.5759 1101 4.297 0.056 4.677 0.060 0.919 0.0001 855.6016 1102 3.538 0.045 3.873 0.065 0.914 0.0001 517.314 1101 5.470 0.038 5.755 0.069 0.951 0.0002 541.3139 1101 4.091 0.053 4.494 0.096 0.910 0.0002 542.3173 1101 2.284 0.055 2.687 0.089 0.850 0.0002 747.5201 1202 1.937 0.051 2.313 0.088 0.838 0.0002 757.4991 1101 3.644 0.065 4.073 0.070 0.895 0.0002 775.5528 1204 3.197 0.045 3.537 0.085 0.904 0.0002 806.5639 1101 4.423 0.057 4.779 0.049 0.926 0.0002 832.5791 1101 3.357 0.055 3.723 0.061 0.902 0.0002 915.5191 1101 2.376 0.051 2.717 0.063 0.874 0.0002 755.5468 1101 2.326 0.064 2.753 0.085 0.845 0.0003 777.553 1202 1.859 0.072 2.384 0.130 0.780 0.0003 829.5604 1101 3.535 0.053 3.875 0.058 0.912 0.0003 518.3174 1101 3.438 0.038 3.717 0.073 0.925 0.0004 731.5464 1101 1.945 0.096 2.600 0.157 0.748 0.0004 757.5626 1101 6.655 0.074 7.108 0.079 0.936 0.0004 758.5656 1101 5.702 0.075 6.160 0.078 0.926 0.0004 759.5779 1101 5.547 0.069 5.997 0.099 0.925 0.0004 760.5811 1101 4.419 0.071 4.886 0.103 0.904 0.0004 768.5539 1204 3.964 0.046 4.279 0.077 0.927 0.0004 748.5287 1204 2.277 0.091 2.820 0.088 0.807 0.0005 783.5148 1204 3.284 0.047 3.574 0.056 0.919 0.0005 821.5712 1102 3.064 0.040 3.304 0.044 0.927 0.0005 523.4679 1203 3.252 0.121 4.011 0.165 0.811 0.0006 781.562 1201 7.364 0.040 7.638 0.071 0.964 0.0006 810.5399 1204 2.835 0.050 3.145 0.066 0.901 0.0006 732.4938 1204 4.249 0.042 4.511 0.057 0.942 0.0007 522.4635 1203 4.713 0.126 5.485 0.176 0.859 0.0008 810.5969 1101 3.957 0.072 4.370 0.080 0.905 0.0009 853.5854 1102 2.626 0.043 2.880 0.052 0.912 0.0009 819.5551 1102 2.394 0.046 2.654 0.046 0.902 0.001 828.5743 1202 5.243 0.058 5.598 0.085 0.936 0.001 478.254 1201 1.584 0.083 1.051 0.148 1.507 0.0011 579.5325 1203 4.102 0.089 4.636 0.127 0.885 0.0011 744.4956 1204 3.881 0.039 4.117 0.058 0.943 0.0011 761.5843 1101 2.422 0.065 2.829 0.106 0.856 0.0011 809.5936 1101 4.964 0.070 5.362 0.079 0.926 0.0011 886.5582 1102 3.041 0.037 3.250 0.041 0.936 0.0011 481.3172 1202 3.923 0.039 4.159 0.060 0.943 0.0012 767.5495 1204 5.063 0.049 5.369 0.082 0.943 0.0012 782.5653 1201 6.339 0.043 6.614 0.076 0.959 0.0012 827.5701 1202 6.306 0.063 6.684 0.092 0.943 0.0012 847.5316 1101 2.742 0.059 3.091 0.083 0.887 0.0012 789.5892 1202 1.723 0.036 1.952 0.065 0.883 0.0013 543.3296 1101 3.733 0.044 4.023 0.087 0.928 0.0014 575.2728 1101 2.470 0.043 2.739 0.074 0.902 0.0014 580.5351 1203 1.456 0.127 2.192 0.174 0.664 0.0014 521.4522 1203 2.302 0.131 3.028 0.158 0.760 0.0016 731.4916 1204 5.482 0.046 5.746 0.063 0.954 0.0016 759.5163 1204 4.724 0.042 4.954 0.048 0.954 0.0016 306.2569 1204 2.998 0.046 3.266 0.067 0.918 0.0017 771.5814 1204 4.164 0.036 4.367 0.046 0.954 0.0017 786.5967 1101 4.808 0.074 5.203 0.078 0.924 0.0019 458.2405 1101 1.736 0.040 1.986 0.077 0.874 0.0021 520.4499 1203 3.956 0.112 4.577 0.148 0.864 0.0021 748.5735 1202 3.918 0.035 3.722 0.050 1.053 0.0021 490.3641 1203 1.944 0.092 1.397 0.159 1.391 0.0023 545.3453 1101 3.606 0.051 3.898 0.078 0.925 0.0023 605.5457 1203 5.135 0.068 5.509 0.089 0.932 0.0023 769.5656 1204 3.963 0.038 4.174 0.054 0.950 0.0023 570.3725 1202 2.976 0.032 3.155 0.045 0.943 0.0024 785.5933 1101 5.884 0.074 6.271 0.080 0.938 0.0024 582.2473 1201 3.325 0.096 2.793 0.141 1.191 0.0026 569.369 1202 4.908 0.033 5.089 0.047 0.964 0.0027 784.5811 1101 4.405 0.079 4.817 0.089 0.915 0.0027 811.6096 1101 3.078 0.083 3.511 0.096 0.877 0.0027 590.343 1202 4.025 0.050 4.304 0.076 0.935 0.0028 856.672 1202 2.764 0.038 2.553 0.057 1.082 0.0028 833.5932 1101 3.276 0.068 3.608 0.056 0.908 0.003 506.2851 1201 3.142 0.077 2.656 0.165 1.183 0.0031 793.5681 1204 3.155 0.040 3.372 0.055 0.936 0.0031 546.3485 1101 1.999 0.050 2.287 0.089 0.874 0.0036 591.3542 1202 4.045 0.061 4.345 0.058 0.931 0.0037 741.5305 1204 2.931 0.056 3.250 0.102 0.902 0.0042 796.5876 1204 2.634 0.043 2.860 0.062 0.921 0.0042 804.7227 1203 1.842 0.145 2.611 0.220 0.705 0.0044 807.59 1202 2.463 0.045 2.718 0.082 0.906 0.0045 506.3213 1202 2.538 0.040 2.748 0.061 0.923 0.0046 552.5022 1203 3.164 0.088 3.643 0.147 0.869 0.0047 589.3403 1202 5.876 0.056 6.171 0.085 0.952 0.0048 806.5873 1202 4.366 0.047 4.635 0.092 0.942 0.0048 550.4957 1203 6.898 0.096 7.415 0.160 0.930 0.0049 604.5433 1203 6.554 0.069 6.901 0.089 0.950 0.005 805.5839 1202 5.562 0.048 5.841 0.097 0.952 0.0052 551.4986 1203 5.480 0.095 5.988 0.158 0.915 0.0053 743.5469 1202 3.061 0.055 3.348 0.086 0.914 0.0056 541.3435 1202 5.669 0.059 5.974 0.094 0.949 0.0058 183.0661 1101 2.590 0.091 3.015 0.094 0.859 0.006 858.6212 1202 2.707 0.059 2.994 0.074 0.904 0.0061 614.4914 1203 2.779 0.060 2.448 0.114 1.135 0.0062 787.5465 1204 2.675 0.077 3.017 0.054 0.887 0.0062 772.5862 1204 3.287 0.031 3.437 0.042 0.956 0.007 837.5881 1202 2.429 0.027 2.577 0.053 0.942 0.007 509.3493 1202 2.403 0.035 2.579 0.055 0.931 0.0071 529.3167 1202 3.032 0.048 3.265 0.069 0.928 0.0075 564.5134 1203 2.706 0.075 3.075 0.111 0.880 0.0075 566.3434 1202 5.203 0.049 5.436 0.062 0.957 0.0075 833.7571 1203 2.962 0.109 3.507 0.170 0.845 0.0077 631.628 1203 1.795 0.127 2.391 0.161 0.751 0.008 857.6186 1202 3.773 0.058 4.049 0.076 0.932 0.008 858.6861 1202 2.943 0.040 2.756 0.052 1.068 0.0081 519.3321 1101 3.964 0.084 4.382 0.133 0.905 0.0083 685.26 1202 1.771 0.048 1.998 0.063 0.886 0.0083 757.5014 1204 3.755 0.048 3.971 0.052 0.946 0.0085 744.55 1202 1.968 0.051 2.222 0.083 0.886 0.0086 671.5723 1204 2.231 0.084 2.604 0.087 0.857 0.0087 304.241 1204 4.887 0.041 5.088 0.066 0.961 0.0092 536.4794 1203 2.320 0.101 2.799 0.143 0.829 0.0093 542.3461 1202 3.873 0.049 4.106 0.074 0.943 0.0095 675.6377 1204 3.953 0.043 4.160 0.066 0.950 0.0098 520.3354 1101 2.240 0.085 2.646 0.130 0.846 0.01 832.7523 1203 3.859 0.107 4.374 0.169 0.882 0.0103 409.0208 1202 2.806 0.035 2.980 0.063 0.942 0.0106 768.5503 1202 1.942 0.076 2.277 0.090 0.853 0.0111 303.1079 1202 5.648 0.034 5.802 0.047 0.973 0.0113 592.3571 1202 2.291 0.063 2.560 0.062 0.895 0.0115 837.718 1204 2.888 0.176 3.662 0.217 0.788 0.0121 832.7492 1204 3.286 0.119 3.848 0.190 0.854 0.0125 832.6037 1202 5.066 0.047 5.274 0.062 0.961 0.013 411.3212 1202 2.868 0.038 3.033 0.048 0.946 0.0134 838.7226 1204 2.313 0.148 2.973 0.206 0.778 0.0136 670.569 1204 3.239 0.061 3.515 0.093 0.921 0.0141 795.5838 1204 3.566 0.046 3.769 0.063 0.946 0.0141 767.547 1202 3.073 0.064 3.358 0.092 0.915 0.0143 305.2438 1204 2.519 0.044 2.719 0.067 0.926 0.0146 505.3229 1202 3.994 0.051 4.222 0.076 0.946 0.0156 803.5677 1202 7.196 0.070 7.502 0.098 0.959 0.0157 711.2577 1202 2.250 0.049 2.454 0.056 0.917 0.0159 827.5448 1101 3.549 0.077 3.873 0.095 0.916 0.016 548.4815 1203 7.094 0.072 7.405 0.103 0.958 0.0174 568.3573 1202 4.008 0.035 4.167 0.060 0.962 0.0175 578.5277 1203 4.301 0.303 5.548 0.355 0.775 0.0175 601.5164 1203 7.640 0.038 7.463 0.069 1.024 0.0185 549.4845 1203 5.666 0.077 5.994 0.110 0.945 0.0187 743.5466 1203 1.987 0.064 2.266 0.099 0.877 0.0189 772.5278 1204 3.324 0.039 3.488 0.055 0.953 0.019 765.5334 1204 3.269 0.060 3.540 0.104 0.923 0.0193 440.3532 1204 1.417 0.096 0.975 0.180 1.453 0.0205 495.332 1101 5.251 0.073 5.565 0.112 0.944 0.0205 804.5718 1202 5.877 0.057 6.117 0.080 0.961 0.0206 340.2976 1203 1.597 0.082 1.937 0.112 0.825 0.0208 856.6061 1202 4.565 0.056 4.805 0.086 0.950 0.0212 584.2646 1204 3.136 0.115 2.649 0.172 1.184 0.0218 733.6426 1204 2.978 0.049 2.718 0.126 1.096 0.0219 588.4731 1203 2.387 0.064 2.031 0.179 1.175 0.0223 765.5313 1202 1.802 0.073 2.098 0.095 0.859 0.0226 523.3634 1101 3.466 0.082 3.791 0.103 0.914 0.0235 830.5894 1202 4.847 0.051 5.051 0.064 0.960 0.0236 887.7352 1204 6.295 0.082 5.963 0.113 1.056 0.0244 598.5124 1204 2.094 0.134 1.513 0.233 1.385 0.0249 616.5052 1203 4.205 0.062 3.957 0.084 1.062 0.025 916.7743 1204 5.894 0.081 5.571 0.107 1.058 0.025 430.3818 1204 4.938 0.075 5.253 0.122 0.940 0.0262 855.6023 1202 5.552 0.056 5.784 0.087 0.960 0.0266 684.5489 1204 2.523 0.055 2.745 0.080 0.919 0.0269 831.6001 1202 6.192 0.053 6.404 0.074 0.967 0.0269 826.7069 1204 2.482 0.089 2.819 0.099 0.880 0.0275 915.7681 1204 6.304 0.085 5.972 0.116 1.056 0.0293 615.3539 1202 2.463 0.043 2.629 0.058 0.937 0.0296 431.386 1204 3.491 0.075 3.795 0.118 0.920 0.0298 942.7879 1204 3.487 0.078 3.195 0.092 1.091 0.0302 665.501 1204 3.388 0.071 3.074 0.142 1.102 0.0305 861.7806 1203 2.531 0.099 2.902 0.119 0.872 0.0306 618.4829 1201 1.791 0.120 1.310 0.185 1.367 0.0309 830.7352 1204 4.252 0.096 4.638 0.150 0.917 0.031 801.555 1202 2.660 0.056 2.881 0.082 0.923 0.0311 739.5143 1204 2.754 0.087 3.121 0.158 0.883 0.0317 492.3816 1203 3.513 0.055 3.302 0.077 1.064 0.0339 741.5319 1202 1.106 0.080 1.424 0.125 0.777 0.0339 914.7583 1204 5.082 0.083 4.763 0.118 1.067 0.0339 507.3316 1202 2.940 0.035 3.094 0.071 0.950 0.034 504.3814 1203 1.701 0.070 1.413 0.124 1.204 0.0341 496.3355 1101 3.442 0.074 3.736 0.119 0.921 0.0347 521.3477 1101 3.717 0.075 4.021 0.127 0.925 0.0351 829.5859 1202 5.976 0.056 6.181 0.070 0.967 0.0353 686.4877 1204 2.700 0.051 2.881 0.052 0.937 0.0358 888.7394 1204 5.702 0.080 5.400 0.110 1.056 0.0358 825.6926 1203 1.840 0.110 2.235 0.124 0.823 0.0369 746.557 1202 2.166 0.030 2.057 0.037 1.053 0.0378 757.5625 1201 7.728 0.046 7.909 0.077 0.977 0.0391 615.4798 1204 2.647 0.049 2.827 0.067 0.936 0.0396 831.7408 1203 4.104 0.085 4.425 0.130 0.928 0.0405 761.5846 1201 3.155 0.051 3.357 0.091 0.940 0.0414 581.3344 1202 1.927 0.076 2.207 0.110 0.873 0.0423 1098.9739 1204 2.955 0.090 2.606 0.152 1.134 0.0427 380.3096 1204 1.650 0.070 1.899 0.090 0.869 0.0434 565.3394 1202 7.001 0.052 7.186 0.068 0.974 0.0439 478.3664 1203 1.493 0.068 1.212 0.143 1.232 0.0475 835.7006 1204 2.799 0.115 3.214 0.167 0.871 0.0485 320.2356 1204 1.447 0.070 1.686 0.085 0.858 0.0486 493.385 1203 1.979 0.066 1.722 0.124 1.149 0.049 512.4082 1204 2.415 0.121 1.954 0.215 1.236 0.0493 610.3686 1201 5.156 0.083 4.771 0.223 1.081 0.0495 760.5811 1201 5.225 0.052 5.422 0.091 0.964 0.0495 600.5127 1203 8.858 0.044 8.692 0.074 1.019 0.0496 715.5167 1204 2.592 0.082 2.902 0.141 0.893 0.0498 759.5779 1201 6.347 0.051 6.541 0.090 0.970 0.0499 -
Table 2: Accurate mass features differing between clinically diagnosed AD patients with a significant cognitive impairment and non-demented controls (p<0.05, log2 transformed). Detected Mass Analysis Mode AVG (log2) AD + Cog SEM AD + Cog AVG (log2) Normal SEM Normal log(2) Ratio P Value 541.3432 1102 3.138 0.034 3.798 0.048 1.210 3.45E-17 569.3687 1102 2.063 0.042 2.724 0.048 1.320 1.67E-15 723.5197 1204 3.581 0.053 4.350 0.056 1.215 1.04E-14 803.568 1102 5.238 0.048 5.838 0.035 1.115 2.00E-14 804.5713 1102 4.017 0.048 4.610 0.033 1.148 2.02E-14 723.5195 1202 2.193 0.056 2.892 0.052 1.319 4.37E-13 749.5367 1202 3.187 0.044 3.714 0.041 1.165 2.12E-12 555.3102 1102 1.634 0.053 2.240 0.046 1.371 3.10E-12 565.3394 1102 3.265 0.058 3.958 0.055 1.212 3.23E-12 724.5257 1204 2.850 0.048 3.463 0.055 1.215 4.54E-12 699.5198 1204 2.129 0.055 2.775 0.054 1.303 9.18E-12 871.5528 1102 2.885 0.049 3.408 0.040 1.181 2.08E-11 567.3547 1102 2.629 0.050 3.218 0.054 1.224 2.92E-11 751.5555 1204 4.591 0.056 5.248 0.060 1.143 3.18E-11 780.5474 1101 5.241 0.064 5.875 0.043 1.121 3.70E-11 752.5564 1202 2.281 0.049 2.836 0.050 1.244 4.78E-11 779.5444 1101 6.239 0.065 6.874 0.043 1.102 5.01E-11 829.5856 1102 3.806 0.059 4.398 0.046 1.156 9.29E-11 794.5421 1102 2.364 0.048 2.853 0.040 1.206 1.01E-10 793.5386 1102 3.435 0.052 3.950 0.039 1.150 1.05E-10 831.5997 1102 4.372 0.055 4.903 0.040 1.121 1.61E-10 832.6026 1102 3.268 0.055 3.795 0.040 1.161 1.67E-10 751.5529 1202 3.369 0.052 3.920 0.050 1.163 1.89E-10 749.5407 1204 4.423 0.047 5.012 0.064 1.133 1.93E-10 827.57 1102 3.984 0.059 4.630 0.062 1.162 1.95E-10 725.5385 1204 2.815 0.058 3.417 0.054 1.214 2.58E-10 804.5476 1101 3.987 0.073 4.703 0.060 1.180 2.67E-10 837.5027 1101 3.402 0.050 3.933 0.050 1.156 2.76E-10 803.5445 1101 4.941 0.074 5.655 0.059 1.144 3.46E-10 752.5583 1204 3.484 0.056 4.094 0.061 1.175 3.59E-10 828.5737 1102 2.982 0.056 3.590 0.061 1.204 3.85E-10 750.544 1204 3.258 0.054 3.858 0.063 1.184 6.22E-10 750.5402 1202 2.210 0.052 2.704 0.044 1.224 1.19E-09 805.5832 1102 3.874 0.056 4.485 0.068 1.158 1.95E-09 727.5568 1204 3.445 0.055 3.986 0.060 1.157 7.95E-09 807.5758 1101 5.531 0.069 6.102 0.047 1.103 8.66E-09 805.5605 1101 5.184 0.074 5.785 0.048 1.116 9.26E-09 808.5792 1101 4.488 0.071 5.063 0.047 1.128 1.11E-08 806.5639 1101 4.199 0.075 4.779 0.049 1.138 3.65E-08 915.5191 1101 2.189 0.058 2.717 0.063 1.241 5.21E-08 817.5377 1102 2.175 0.064 2.712 0.057 1.247 5.29E-08 781.5617 1101 5.928 0.084 6.610 0.072 1.115 8.47E-08 819.5551 1102 2.198 0.058 2.654 0.046 1.208 9.28E-08 726.5461 1204 2.759 0.044 3.150 0.050 1.141 1.31E-07 783.5672 1101 3.535 0.092 4.259 0.079 1.205 1.69E-07 886.5582 1102 2.911 0.041 3.250 0.041 1.117 2.03E-07 782.565 1101 4.901 0.088 5.589 0.078 1.140 2.35E-07 784.5237 1204 3.211 0.056 3.603 0.037 1.122 4.12E-07 853.5854 1102 2.449 0.056 2.880 0.052 1.176 4.56E-07 795.555 1102 2.520 0.054 2.986 0.065 1.185 5.49E-07 855.6016 1102 3.386 0.060 3.873 0.065 1.144 6.32E-07 821.5712 1102 2.919 0.053 3.304 0.044 1.132 6.68E-07 795.5181 1101 2.458 0.082 3.044 0.064 1.238 7.57E-07 832.5791 1101 3.184 0.076 3.723 0.061 1.169 9.68E-07 786.5416 1204 3.729 0.049 4.087 0.043 1.096 1.02E-06 831.5759 1101 4.123 0.080 4.677 0.060 1.134 1.03E-06 728.5627 1204 2.875 0.047 3.281 0.060 1.141 1.07E-06 757.4991 1101 3.450 0.089 4.073 0.070 1.181 1.08E-06 760.5216 1204 4.008 0.048 4.347 0.039 1.084 1.13E-06 829.5604 1101 3.360 0.075 3.875 0.058 1.153 1.41E-06 847.5316 1101 2.564 0.060 3.091 0.083 1.205 1.84E-06 755.5468 1101 2.115 0.086 2.753 0.085 1.302 1.88E-06 782.5085 1204 3.369 0.056 3.780 0.055 1.122 2.13E-06 755.486 1204 3.146 0.061 3.561 0.057 1.132 5.93E-06 833.5932 1101 3.045 0.095 3.608 0.056 1.185 7.05E-06 758.5656 1101 5.511 0.107 6.160 0.078 1.118 1.11E-05 758.5092 1204 4.504 0.047 4.808 0.042 1.068 1.24E-05 757.5626 1101 6.470 0.106 7.108 0.079 1.099 1.48E-05 760.5811 1101 4.216 0.099 4.886 0.103 1.159 1.48E-05 744.5536 1204 4.260 0.047 4.605 0.058 1.081 1.55E-05 759.5779 1101 5.352 0.096 5.997 0.099 1.121 1.60E-05 811.6096 1101 2.801 0.116 3.511 0.096 1.253 1.84E-05 731.5464 1101 1.634 0.139 2.600 0.157 1.591 1.89E-05 812.5762 1202 1.752 0.045 2.084 0.058 1.190 1.95E-05 743.5471 1204 5.227 0.047 5.579 0.063 1.067 2.40E-05 784.5811 1101 4.161 0.112 4.817 0.089 1.158 3.03E-05 632.5762 1203 0.925 0.149 1.830 0.132 1.979 3.07E-05 761.5843 1101 2.241 0.084 2.829 0.106 1.262 4.28E-05 517.314 1101 5.399 0.050 5.755 0.069 1.066 0.0001 518.3174 1101 3.358 0.051 3.717 0.073 1.107 0.0001 591.3542 1202 3.870 0.092 4.345 0.058 1.123 0.0001 732.4938 1204 4.186 0.056 4.511 0.057 1.078 0.0001 745.5658 1204 3.881 0.052 4.242 0.068 1.093 0.0001 746.5717 1204 3.047 0.043 3.362 0.061 1.103 0.0001 747.5245 1204 3.433 0.058 3.886 0.090 1.132 0.0001 777.553 1202 1.720 0.100 2.384 0.130 1.386 0.0001 783.5148 1204 3.217 0.063 3.574 0.056 1.111 0.0001 785.5933 1101 5.687 0.112 6.271 0.080 1.103 0.0001 786.5967 1101 4.611 0.112 5.203 0.078 1.128 0.0001 809.5936 1101 4.786 0.104 5.362 0.079 1.120 0.0001 810.5969 1101 3.779 0.108 4.370 0.080 1.157 0.0001 811.5732 1202 2.729 0.047 3.027 0.055 1.109 0.0001 858.6212 1202 2.533 0.080 2.994 0.074 1.182 0.0001 306.2569 1204 2.878 0.070 3.266 0.067 1.135 0.0002 482.3215 1202 1.940 0.050 2.251 0.062 1.160 0.0002 522.4635 1203 4.489 0.181 5.485 0.176 1.222 0.0002 523.4679 1203 3.035 0.180 4.011 0.165 1.322 0.0002 579.5325 1203 3.962 0.112 4.636 0.127 1.170 0.0002 759.5163 1204 4.645 0.061 4.954 0.048 1.066 0.0002 787.5729 1202 1.834 0.054 2.145 0.057 1.170 0.0002 810.5399 1204 2.760 0.071 3.145 0.066 1.140 0.0002 814.5917 1202 2.054 0.035 2.289 0.051 1.114 0.0002 857.6186 1202 3.614 0.081 4.049 0.076 1.121 0.0002 458.2405 1101 1.632 0.054 1.986 0.077 1.217 0.0003 481.3172 1202 3.866 0.050 4.159 0.060 1.076 0.0003 541.3139 1101 4.022 0.081 4.494 0.096 1.117 0.0003 545.3453 1101 3.500 0.071 3.898 0.078 1.114 0.0003 592.3571 1202 2.113 0.095 2.560 0.062 1.212 0.0003 757.5014 1204 3.642 0.067 3.971 0.052 1.091 0.0003 833.7551 1204 2.061 0.223 3.140 0.161 1.524 0.0003 543.3296 1101 3.652 0.055 4.023 0.087 1.102 0.0004 605.5457 1203 5.025 0.091 5.509 0.089 1.096 0.0004 731.4916 1204 5.419 0.060 5.746 0.063 1.060 0.0004 775.5533 1202 2.106 0.063 2.449 0.068 1.163 0.0004 813.5885 1202 3.034 0.043 3.276 0.048 1.080 0.0004 542.3173 1101 2.234 0.087 2.687 0.089 1.203 0.0005 722.5335 1101 2.406 0.062 2.717 0.056 1.129 0.0005 744.55 1202 1.842 0.064 2.222 0.083 1.206 0.0005 769.5656 1204 3.889 0.055 4.174 0.054 1.073 0.0005 807.59 1202 2.348 0.061 2.718 0.082 1.158 0.0005 828.5743 1202 5.181 0.076 5.598 0.085 1.081 0.0005 521.4522 1203 2.124 0.191 3.028 0.158 1.425 0.0007 604.5433 1203 6.440 0.091 6.901 0.089 1.072 0.0007 744.4956 1204 3.851 0.049 4.117 0.058 1.069 0.0007 748.5287 1204 2.249 0.127 2.820 0.088 1.254 0.0007 771.5814 1204 4.118 0.051 4.367 0.046 1.061 0.0007 827.5701 1202 6.245 0.082 6.684 0.092 1.070 0.0007 747.5201 1202 1.886 0.083 2.313 0.088 1.226 0.0008 775.5528 1204 3.176 0.061 3.537 0.085 1.114 0.0008 787.5465 1204 2.543 0.116 3.017 0.054 1.187 0.0008 827.5448 1101 3.373 0.104 3.873 0.095 1.148 0.0008 546.3485 1101 1.890 0.073 2.287 0.089 1.210 0.0009 520.4499 1203 3.775 0.176 4.577 0.148 1.212 0.001 570.3725 1202 2.926 0.047 3.155 0.045 1.078 0.001 781.562 1201 7.334 0.054 7.638 0.071 1.041 0.001 632.5032 1203 1.435 0.112 0.795 0.154 0.554 0.0011 743.5469 1202 2.976 0.070 3.348 0.086 1.125 0.0012 768.5539 1204 3.928 0.069 4.279 0.077 1.089 0.0012 806.5873 1202 4.280 0.057 4.635 0.092 1.083 0.0012 575.2728 1101 2.419 0.061 2.739 0.074 1.132 0.0013 550.4957 1203 6.766 0.117 7.415 0.160 1.096 0.0014 805.5839 1202 5.470 0.060 5.841 0.097 1.068 0.0014 183.0661 1101 2.412 0.147 3.015 0.094 1.250 0.0015 551.4986 1203 5.350 0.117 5.988 0.158 1.119 0.0015 741.5305 1204 2.825 0.080 3.250 0.102 1.150 0.0015 541.3435 1202 5.595 0.072 5.974 0.094 1.068 0.0018 552.5022 1203 3.055 0.110 3.643 0.147 1.193 0.0018 506.3213 1202 2.487 0.054 2.748 0.061 1.105 0.0019 569.369 1202 4.867 0.049 5.089 0.047 1.046 0.0019 782.5653 1201 6.310 0.058 6.614 0.076 1.048 0.002 490.3641 1203 2.028 0.121 1.397 0.159 0.689 0.0021 542.3461 1202 3.803 0.061 4.106 0.074 1.080 0.0021 566.3434 1202 5.130 0.071 5.436 0.062 1.060 0.0022 833.7571 1203 2.853 0.122 3.507 0.170 1.229 0.0022 837.718 1204 2.593 0.250 3.662 0.217 1.412 0.0023 549.4845 1203 5.510 0.107 5.994 0.110 1.088 0.0025 793.5681 1204 3.116 0.058 3.372 0.055 1.082 0.0025 478.254 1201 1.629 0.116 1.051 0.148 0.645 0.0027 536.4794 1203 2.188 0.134 2.799 0.143 1.279 0.0027 548.4815 1203 6.949 0.103 7.405 0.103 1.066 0.0027 832.6037 1202 4.981 0.069 5.274 0.062 1.059 0.0028 830.5894 1202 4.738 0.076 5.051 0.064 1.066 0.0029 1098.9739 1204 3.097 0.070 2.606 0.152 0.842 0.0031 767.5495 1204 5.033 0.074 5.369 0.082 1.067 0.0034 675.6377 1204 3.875 0.066 4.160 0.066 1.074 0.0035 564.5134 1203 2.641 0.093 3.075 0.111 1.164 0.0036 789.5892 1202 1.703 0.053 1.952 0.065 1.147 0.0036 832.7523 1203 3.734 0.131 4.374 0.169 1.171 0.0036 748.5735 1202 3.940 0.052 3.722 0.050 0.945 0.0037 801.555 1202 2.543 0.077 2.881 0.082 1.133 0.0037 856.672 1202 2.777 0.048 2.553 0.057 0.919 0.0037 858.6861 1202 2.982 0.055 2.756 0.052 0.924 0.0043 803.5677 1202 7.101 0.095 7.502 0.098 1.057 0.0045 838.7226 1204 2.127 0.200 2.973 0.206 1.398 0.0046 685.26 1202 1.708 0.074 1.998 0.063 1.169 0.0047 826.7069 1204 2.279 0.148 2.819 0.099 1.237 0.0047 582.2473 1201 3.332 0.122 2.793 0.141 0.838 0.0049 590.343 1202 4.005 0.069 4.304 0.076 1.075 0.005 832.7492 1204 3.163 0.146 3.848 0.190 1.217 0.0051 829.5859 1202 5.864 0.082 6.181 0.070 1.054 0.0053 772.5862 1204 3.263 0.043 3.437 0.042 1.053 0.0054 409.0208 1202 2.753 0.050 2.980 0.063 1.082 0.0055 509.3493 1202 2.358 0.054 2.579 0.055 1.094 0.0056 589.3403 1202 5.847 0.076 6.171 0.085 1.056 0.0057 430.3818 1204 4.790 0.109 5.253 0.122 1.097 0.0061 804.5718 1202 5.801 0.078 6.117 0.080 1.054 0.0066 505.3229 1202 3.931 0.071 4.222 0.076 1.074 0.0068 523.3634 1101 3.365 0.111 3.791 0.103 1.127 0.0072 671.5723 1204 2.131 0.140 2.604 0.087 1.222 0.0073 830.7352 1204 4.091 0.130 4.638 0.150 1.134 0.0073 431.386 1204 3.354 0.108 3.795 0.118 1.132 0.0074 631.628 1203 1.746 0.166 2.391 0.161 1.369 0.0075 825.6926 1203 1.644 0.169 2.235 0.124 1.359 0.0079 614.4914 1203 2.821 0.080 2.448 0.114 0.868 0.008 831.6001 1202 6.109 0.077 6.404 0.074 1.048 0.0081 615.3539 1202 2.394 0.063 2.629 0.058 1.098 0.0083 568.3573 1202 3.959 0.049 4.167 0.060 1.053 0.0088 767.547 1202 2.992 0.097 3.358 0.092 1.122 0.0088 768.5503 1202 1.849 0.125 2.277 0.090 1.231 0.0089 831.7408 1203 3.971 0.109 4.425 0.130 1.114 0.0089 411.3212 1202 2.838 0.054 3.033 0.048 1.069 0.0099 796.5876 1204 2.633 0.059 2.860 0.062 1.087 0.0099 863.6876 1204 4.853 0.087 5.188 0.092 1.069 0.0104 492.3816 1203 3.588 0.076 3.302 0.077 0.920 0.0105 772.5278 1204 3.282 0.056 3.488 0.055 1.063 0.0107 825.5544 1202 2.644 0.112 3.084 0.126 1.167 0.0108 320.2356 1204 1.302 0.114 1.686 0.085 1.295 0.011 380.3096 1204 1.580 0.083 1.899 0.090 1.202 0.0112 519.3321 1101 3.914 0.122 4.382 0.133 1.119 0.0116 711.2577 1202 2.205 0.075 2.454 0.056 1.113 0.0118 493.385 1203 2.083 0.073 1.722 0.124 0.827 0.0119 565.3394 1202 6.924 0.073 7.186 0.068 1.038 0.0119 670.569 1204 3.179 0.090 3.515 0.093 1.106 0.012 856.6061 1202 4.500 0.081 4.805 0.086 1.068 0.0121 340.2976 1203 1.502 0.124 1.937 0.112 1.290 0.0124 287.2824 1101 1.958 0.180 1.265 0.202 0.646 0.0126 495.332 1101 5.196 0.094 5.565 0.112 1.071 0.0137 304.241 1204 4.876 0.053 5.088 0.066 1.044 0.0138 305.2438 1204 2.492 0.061 2.719 0.067 1.091 0.0145 616.5052 1203 4.260 0.086 3.957 0.084 0.929 0.0145 746.5119 1204 2.615 0.165 3.137 0.119 1.200 0.0152 861.7806 1203 2.533 0.092 2.902 0.119 1.146 0.0152 686.4877 1204 2.617 0.088 2.881 0.052 1.101 0.0155 830.7363 1203 4.834 0.111 5.263 0.135 1.089 0.0162 835.7006 1204 2.651 0.155 3.214 0.167 1.212 0.0165 867.7579 1204 2.654 0.185 3.308 0.189 1.246 0.0167 870.7307 1203 3.361 0.074 2.985 0.142 0.888 0.0169 246.1465 1202 3.761 0.084 4.072 0.096 1.083 0.017 507.3316 1202 2.891 0.047 3.094 0.071 1.070 0.0173 855.6023 1202 5.497 0.079 5.784 0.087 1.052 0.0173 578.5277 1203 4.183 0.420 5.548 0.355 1.326 0.0176 615.4938 1203 1.386 0.133 0.902 0.148 0.651 0.0177 808.5803 1201 5.667 0.029 5.784 0.039 1.021 0.0177 860.7752 1204 3.643 0.124 4.070 0.125 1.117 0.0185 518.4345 1203 1.584 0.180 2.199 0.178 1.388 0.0186 520.3354 1101 2.215 0.123 2.646 0.130 1.195 0.0188 765.5313 1202 1.717 0.123 2.098 0.095 1.222 0.0195 777.5287 1201 2.793 0.063 3.020 0.072 1.082 0.0198 887.8005 1203 2.948 0.118 3.306 0.086 1.122 0.0198 739.5143 1204 2.602 0.149 3.121 0.158 1.200 0.0199 831.7387 1204 3.193 0.121 3.648 0.150 1.142 0.02 521.3477 1101 3.643 0.099 4.021 0.127 1.104 0.0203 584.2646 1204 3.154 0.130 2.649 0.172 0.840 0.0207 661.6233 1204 2.430 0.088 2.715 0.079 1.117 0.0209 715.5167 1204 2.449 0.131 2.902 0.141 1.185 0.0218 529.3167 1202 3.031 0.071 3.265 0.069 1.077 0.0221 544.4481 1203 2.105 0.067 2.333 0.071 1.108 0.0234 866.7532 1204 4.149 0.145 4.693 0.189 1.131 0.0235 581.3344 1202 1.844 0.111 2.207 0.110 1.197 0.0245 795.5838 1204 3.569 0.060 3.769 0.063 1.056 0.0246 807.5768 1201 6.720 0.030 6.829 0.037 1.016 0.0256 854.5902 1202 3.801 0.070 4.031 0.073 1.060 0.0266 865.7487 1204 4.895 0.152 5.445 0.193 1.112 0.0268 496.3355 1101 3.396 0.095 3.736 0.119 1.100 0.027 755.5467 1201 3.507 0.072 3.755 0.084 1.071 0.0274 1019.3838 1102 3.035 0.036 2.919 0.037 0.962 0.0291 684.5489 1204 2.508 0.071 2.745 0.080 1.094 0.0294 774.0316 1204 1.789 0.192 1.167 0.203 0.652 0.0294 765.5334 1204 3.218 0.101 3.540 0.104 1.100 0.0299 630.5587 1203 3.126 0.072 3.344 0.064 1.070 0.0301 488.3873 1203 2.241 0.069 1.986 0.096 0.886 0.0321 302.2255 1204 3.506 0.085 3.765 0.081 1.074 0.0322 757.5625 1201 7.689 0.066 7.909 0.077 1.029 0.0325 617.5089 1203 2.978 0.089 2.698 0.092 0.906 0.0328 829.7239 1204 2.802 0.120 3.185 0.131 1.137 0.0344 303.1079 1202 5.656 0.048 5.802 0.047 1.026 0.0348 826.5581 1202 1.648 0.107 2.032 0.149 1.233 0.0362 506.2851 1201 3.080 0.117 2.656 0.165 0.862 0.0363 504.3814 1203 1.746 0.098 1.413 0.124 0.809 0.0366 691.1957 1102 2.130 0.060 1.938 0.068 0.910 0.0373 626.5278 1203 3.820 0.064 4.009 0.060 1.049 0.0375 522.3511 1101 1.753 0.091 2.069 0.121 1.180 0.0385 759.5779 1201 6.294 0.076 6.541 0.090 1.039 0.0386 625.5161 1203 2.856 0.057 3.045 0.070 1.066 0.0387 760.5811 1201 5.173 0.077 5.422 0.091 1.048 0.0395 484.3794 1204 2.181 0.092 1.776 0.178 0.815 0.0396 819.5642 1202 2.811 0.080 3.104 0.120 1.104 0.0404 853.5862 1202 4.775 0.069 4.985 0.075 1.044 0.0423 700.552 1101 2.278 0.124 2.617 0.102 1.149 0.0426 709.2594 1202 2.152 0.092 2.382 0.053 1.107 0.0426 662.5175 1204 3.806 0.120 3.420 0.145 0.899 0.0432 761.5846 1201 3.118 0.074 3.357 0.091 1.077 0.0436 743.5466 1203 2.011 0.077 2.266 0.099 1.127 0.0442 478.3664 1203 1.545 0.088 1.212 0.143 0.785 0.0447 784.5811 1201 5.585 0.073 5.809 0.082 1.040 0.0448 860.7756 1203 4.383 0.087 4.653 0.100 1.061 0.0448 601.5164 1203 7.642 0.056 7.463 0.069 0.976 0.0453 758.5655 1201 6.637 0.074 6.860 0.084 1.034 0.0488 371.3542 1203 3.253 0.055 3.435 0.074 1.056 0.0489 783.5778 1201 6.661 0.074 6.883 0.083 1.033 0.049 921.8145 1204 2.716 0.211 3.255 0.155 1.198 0.0494 824.6892 1203 2.657 0.108 2.964 0.108 1.116 0.0497 -
Table 3: Accurate mass features differing between clinically diagnosed AD patients with a significant cognitive impairment and clinically diagnosed non-AD patients with a significant cognitive impairment (p<0.05, log2 transformed). Detected Mass Analysis Mode AVG (log2) AD + Cog SEM AD + Cog AVG (log2) Non-AD + Cog SEM Non-AD + Cog log(2) Ratio P Value 723.5197 1204 3.581 0.053 4.571 0.070 0.783 1.07E-17 723.5195 1202 2.193 0.056 3.033 0.049 0.723 2.70E-17 749.5367 1202 3.187 0.044 3.812 0.045 0.836 5.25E-15 724.5257 1204 2.850 0.048 3.630 0.066 0.785 1.68E-14 752.5564 1202 2.281 0.049 2.975 0.056 0.767 5.71E-14 751.5555 1204 4.591 0.056 5.427 0.071 0.846 6.78E-14 751.5529 1202 3.369 0.052 4.055 0.054 0.831 1.46E-13 752.5583 1204 3.484 0.056 4.284 0.070 0.813 2.38E-13 749.5407 1204 4.423 0.047 5.185 0.073 0.853 5.02E-13 750.5402 1202 2.210 0.052 2.804 0.044 0.788 9.50E-13 750.544 1204 3.258 0.054 4.004 0.074 0.814 7.49E-12 725.5385 1204 2.815 0.058 3.543 0.078 0.794 1.10E-10 699.5198 1204 2.129 0.055 2.825 0.079 0.754 3.41E-10 727.5568 1204 3.445 0.055 4.039 0.076 0.853 1.48E-08 728.5627 1204 2.875 0.047 3.301 0.056 0.871 1.21E-07 726.5461 1204 2.759 0.044 3.175 0.057 0.869 1.35E-07 775.5528 1204 3.176 0.061 3.712 0.075 0.856 3.75E-07 813.5885 1202 3.034 0.043 3.369 0.049 0.901 2.08E-06 775.5533 1202 2.106 0.063 2.524 0.056 0.834 4.26E-06 747.5245 1204 3.433 0.058 3.933 0.088 0.873 8.18E-06 814.5917 1202 2.054 0.035 2.355 0.055 0.872 1.16E-05 747.5201 1202 1.886 0.083 2.357 0.062 0.800 2.25E-05 811.5732 1202 2.729 0.047 3.041 0.055 0.897 4.54E-05 789.5892 1202 1.703 0.053 2.013 0.061 0.846 0.0002 810.5399 1204 2.760 0.071 3.111 0.064 0.887 0.0004 795.5838 1204 3.569 0.060 3.845 0.050 0.928 0.0007 856.6061 1202 4.500 0.081 4.894 0.078 0.919 0.0008 783.5148 1204 3.217 0.063 3.512 0.061 0.916 0.0011 855.6023 1202 5.497 0.079 5.876 0.079 0.935 0.0011 858.6212 1202 2.533 0.080 2.917 0.080 0.868 0.0011 787.5465 1204 2.543 0.116 2.964 0.045 0.858 0.0013 857.6186 1202 3.614 0.081 3.989 0.081 0.906 0.0015 773.537 1202 1.581 0.066 1.875 0.065 0.843 0.002 784.5237 1204 3.211 0.056 3.464 0.056 0.927 0.002 748.5287 1204 2.249 0.127 2.811 0.123 0.800 0.0021 828.5743 1202 5.181 0.076 5.517 0.075 0.939 0.0023 827.5701 1202 6.245 0.082 6.608 0.083 0.945 0.0026 786.5416 1204 3.729 0.049 3.961 0.058 0.941 0.0029 871.5934 1202 1.841 0.085 2.189 0.076 0.841 0.0031 744.5536 1204 4.260 0.047 4.473 0.054 0.952 0.0037 787.5729 1202 1.834 0.054 2.081 0.065 0.881 0.0042 755.486 1204 3.146 0.061 3.395 0.059 0.927 0.0044 796.5876 1204 2.633 0.059 2.868 0.056 0.918 0.0048 812.5762 1202 1.752 0.045 2.034 0.088 0.861 0.0049 817.5377 1102 2.175 0.064 2.427 0.060 0.896 0.0053 383.3284 1204 1.263 0.120 1.722 0.107 0.733 0.0055 840.6063 1202 2.746 0.042 2.927 0.050 0.938 0.0065 544.397 1204 2.998 0.111 2.235 0.255 1.342 0.0066 570.3725 1202 2.926 0.047 3.115 0.049 0.939 0.0071 782.5085 1204 3.369 0.056 3.596 0.062 0.937 0.0077 847.5954 1202 2.317 0.089 2.662 0.090 0.870 0.0079 855.6016 1102 3.386 0.060 3.619 0.062 0.936 0.0082 769.5656 1204 3.889 0.055 4.103 0.057 0.948 0.0084 819.5642 1202 2.811 0.080 3.149 0.099 0.893 0.0089 828.5737 1102 2.982 0.056 3.197 0.058 0.933 0.009 590.343 1202 4.005 0.069 4.261 0.066 0.940 0.0091 719.6231 1204 4.528 0.074 4.158 0.119 1.089 0.0092 589.3403 1202 5.847 0.076 6.129 0.075 0.954 0.0098 768.5539 1204 3.928 0.069 4.189 0.071 0.938 0.0102 839.6031 1202 3.723 0.041 3.895 0.051 0.956 0.0102 821.5712 1102 2.919 0.053 3.120 0.056 0.936 0.0106 1226.097 1203 3.278 0.092 2.921 0.105 1.122 0.0122 664.5323 1204 4.909 0.126 4.391 0.161 1.118 0.0126 733.6426 1204 2.981 0.074 2.625 0.120 1.135 0.0126 771.5814 1204 4.118 0.051 4.313 0.057 0.955 0.0126 809.5937 1201 6.453 0.060 6.677 0.065 0.966 0.0126 720.6258 1204 3.565 0.076 3.215 0.117 1.109 0.0127 667.5475 1204 3.516 0.124 3.013 0.157 1.167 0.0132 665.5354 1204 3.705 0.121 3.182 0.170 1.164 0.0133 666.5456 1204 4.713 0.126 4.232 0.146 1.114 0.0142 793.5386 1102 3.435 0.052 3.632 0.061 0.946 0.015 810.5971 1201 5.436 0.063 5.665 0.068 0.959 0.015 832.6037 1202 4.981 0.069 5.231 0.074 0.952 0.0151 663.5216 1204 2.566 0.145 1.946 0.210 1.319 0.0159 743.5471 1204 5.227 0.047 5.417 0.062 0.965 0.0162 767.5495 1204 5.033 0.074 5.287 0.074 0.952 0.017 796.5292 1204 2.928 0.063 3.142 0.062 0.932 0.017 671.5723 1204 2.131 0.140 2.568 0.113 0.830 0.0173 758.5092 1204 4.504 0.047 4.670 0.051 0.964 0.0188 509.3493 1202 2.358 0.054 2.542 0.056 0.927 0.0192 827.57 1102 3.984 0.059 4.191 0.064 0.951 0.0194 569.369 1202 4.867 0.049 5.033 0.049 0.967 0.02 831.6001 1202 6.109 0.077 6.380 0.085 0.958 0.02 638.5149 1204 3.530 0.120 3.086 0.150 1.144 0.0224 768.5503 1202 1.849 0.125 2.190 0.080 0.845 0.0249 313.1153 1204 3.859 0.102 3.338 0.209 1.156 0.025 592.3571 1202 2.113 0.095 2.375 0.065 0.890 0.0262 794.5421 1102 2.364 0.048 2.536 0.061 0.932 0.0276 662.5175 1204 3.806 0.120 3.377 0.153 1.127 0.0292 670.569 1204 3.179 0.090 3.474 0.101 0.915 0.0312 870.7307 1203 3.361 0.074 3.012 0.144 1.116 0.0312 1098.974 1204 3.097 0.070 2.739 0.151 1.131 0.0313 694.6161 1204 2.845 0.080 2.437 0.173 1.168 0.0324 541.3432 1102 3.138 0.034 3.255 0.043 0.964 0.0335 581.3344 1202 1.844 0.111 2.147 0.087 0.859 0.0351 691.596 1204 2.394 0.098 1.999 0.159 1.198 0.0351 803.5677 1202 7.101 0.095 7.405 0.108 0.959 0.0364 591.3542 1202 3.870 0.092 4.110 0.064 0.942 0.0367 705.6093 1204 3.137 0.072 2.823 0.132 1.111 0.0367 847.5316 1101 2.564 0.060 2.815 0.104 0.911 0.0367 854.5902 1202 3.801 0.070 4.027 0.082 0.944 0.0376 215.9153 1101 4.405 0.297 5.221 0.247 0.844 0.0379 569.3687 1102 2.063 0.042 2.217 0.062 0.931 0.0404 640.5294 1204 3.725 0.127 3.313 0.154 1.124 0.0407 853.5862 1202 4.775 0.069 4.993 0.081 0.956 0.0413 830.5894 1202 4.738 0.076 4.968 0.082 0.954 0.0415 760.5216 1204 4.008 0.048 4.156 0.053 0.964 0.0417 530.3821 1204 2.614 0.172 2.016 0.240 1.296 0.0441 1225.092 1203 3.451 0.135 3.011 0.170 1.146 0.0445 819.5551 1102 2.198 0.058 2.369 0.062 0.928 0.0456 743.5469 1202 2.976 0.070 3.200 0.087 0.930 0.0464 444.2717 1202 1.304 0.083 1.577 0.109 0.827 0.0471 678.5477 1204 3.874 0.101 3.523 0.145 1.099 0.0485 741.5305 1204 2.825 0.080 3.086 0.104 0.916 0.0489 759.5163 1204 4.645 0.061 4.811 0.057 0.966 0.0493 820.568 1202 1.757 0.128 2.102 0.117 0.836 0.0497 -
Table 4: Accurate mass features differing between clinically diagnosed AD patients with a significant cognitive impairment and clinically diagnosed AD patients without a significant cognitive impairment (p<0.05, log2 transformed). Detected Mass Analysis Mode AVG (log2) AD SEM AD AVG (log2) AD noCog SEM AD noCog log(2) Ratio P Value 541.3432 1102 3.138 0.034 3.518 0.039 0.892 3.47E-10 569.3687 1102 2.063 0.042 2.479 0.045 0.832 3.90E-09 829.5856 1102 3.806 0.059 4.301 0.048 0.885 1.30E-08 567.3547 1102 2.629 0.050 3.031 0.045 0.868 1.02E-07 831.5997 1102 4.372 0.055 4.774 0.042 0.916 1.93E-07 832.6026 1102 3.268 0.055 3.662 0.042 0.892 2.67E-07 804.5713 1102 4.017 0.048 4.426 0.054 0.908 3.40E-07 803.568 1102 5.238 0.048 5.656 0.057 0.926 3.97E-07 871.5528 1102 2.885 0.049 3.279 0.054 0.880 8.30E-07 565.3394 1102 3.265 0.058 3.728 0.064 0.876 1.14E-06 805.5832 1102 3.874 0.056 4.292 0.055 0.903 1.41E-06 819.5551 1102 2.198 0.058 2.604 0.053 0.844 2.52E-06 555.3102 1102 1.634 0.053 2.033 0.059 0.803 3.32E-06 853.5854 1102 2.449 0.056 2.824 0.051 0.867 5.09E-06 805.5605 1101 5.184 0.074 5.665 0.065 0.915 6.42E-06 808.5792 1101 4.488 0.071 4.925 0.057 0.911 9.48E-06 793.5386 1102 3.435 0.052 3.799 0.057 0.904 1.17E-05 807.5758 1101 5.531 0.069 5.961 0.059 0.928 1.20E-05 806.5639 1101 4.199 0.075 4.669 0.066 0.899 1.28E-05 837.5027 1101 3.402 0.050 3.781 0.064 0.900 1.45E-05 794.5421 1102 2.364 0.048 2.703 0.059 0.875 2.79E-05 780.5474 1101 5.241 0.064 5.661 0.070 0.926 3.62E-05 779.5444 1101 6.239 0.065 6.654 0.070 0.938 4.37E-05 821.5712 1102 2.919 0.053 3.221 0.048 0.906 0.0001 827.57 1102 3.984 0.059 4.337 0.063 0.919 0.0001 886.5582 1102 2.911 0.041 3.189 0.053 0.913 0.0001 915.5191 1101 2.189 0.058 2.592 0.073 0.845 0.0001 722.5335 1101 2.406 0.062 2.735 0.057 0.880 0.0002 828.5737 1102 2.982 0.056 3.313 0.063 0.900 0.0002 833.5932 1101 3.045 0.095 3.522 0.077 0.865 0.0002 855.6016 1102 3.386 0.060 3.704 0.055 0.914 0.0002 755.5468 1101 2.115 0.086 2.563 0.082 0.825 0.0003 795.555 1102 2.520 0.054 2.818 0.057 0.894 0.0003 803.5445 1101 4.941 0.074 5.324 0.070 0.928 0.0003 811.6096 1101 2.801 0.116 3.370 0.096 0.831 0.0003 804.5476 1101 3.987 0.073 4.370 0.073 0.912 0.0004 829.5604 1101 3.360 0.075 3.728 0.063 0.901 0.0004 783.5672 1101 3.535 0.092 3.993 0.085 0.885 0.0005 832.5791 1101 3.184 0.076 3.541 0.067 0.899 0.0008 847.5316 1101 2.564 0.060 2.955 0.095 0.868 0.0008 784.5811 1101 4.161 0.112 4.668 0.093 0.891 0.0009 831.5759 1101 4.123 0.080 4.485 0.066 0.919 0.0009 757.4991 1101 3.450 0.089 3.866 0.083 0.892 0.0011 781.5617 1101 5.928 0.084 6.305 0.075 0.940 0.0014 795.5181 1101 2.458 0.082 2.823 0.073 0.871 0.0015 782.565 1101 4.901 0.088 5.279 0.080 0.928 0.0022 760.5811 1101 4.216 0.099 4.632 0.089 0.910 0.0027 759.5779 1101 5.352 0.096 5.752 0.085 0.930 0.0028 591.3542 1202 3.870 0.092 4.224 0.068 0.916 0.0031 592.3571 1202 2.113 0.095 2.472 0.070 0.855 0.0035 761.5843 1101 2.241 0.084 2.609 0.088 0.859 0.0035 858.6212 1202 2.533 0.080 2.870 0.078 0.883 0.0037 458.2405 1101 1.632 0.054 1.858 0.054 0.878 0.0042 785.5933 1101 5.687 0.112 6.096 0.083 0.933 0.0047 786.5967 1101 4.611 0.112 5.018 0.084 0.919 0.005 758.5656 1101 5.511 0.107 5.915 0.094 0.932 0.0061 306.2569 1204 2.878 0.070 3.125 0.053 0.921 0.0066 857.6186 1202 3.614 0.081 3.925 0.076 0.921 0.0066 757.5626 1101 6.470 0.106 6.861 0.094 0.943 0.0075 809.5936 1101 4.786 0.104 5.150 0.081 0.929 0.0077 810.5969 1101 3.779 0.108 4.144 0.083 0.912 0.0095 807.59 1202 2.348 0.061 2.574 0.062 0.912 0.0113 383.3284 1204 1.263 0.120 1.659 0.095 0.761 0.012 786.5416 1204 3.729 0.049 3.903 0.046 0.955 0.012 744.55 1202 1.842 0.064 2.093 0.074 0.880 0.0124 827.5448 1101 3.373 0.104 3.751 0.105 0.899 0.0128 784.5237 1204 3.211 0.056 3.405 0.052 0.943 0.0133 746.5119 1204 2.615 0.165 3.058 0.057 0.855 0.0145 817.5377 1102 2.175 0.064 2.405 0.066 0.905 0.0155 699.5198 1204 2.129 0.055 2.309 0.047 0.922 0.0161 757.5014 1204 3.642 0.067 3.869 0.063 0.941 0.0161 826.7069 1204 2.279 0.148 2.684 0.086 0.849 0.0215 758.5092 1204 4.504 0.047 4.652 0.043 0.968 0.0235 546.3485 1101 1.890 0.073 2.115 0.064 0.894 0.0236 801.555 1202 2.543 0.077 2.788 0.077 0.912 0.0272 829.7239 1204 2.802 0.120 3.161 0.105 0.886 0.0272 748.5721 1102 3.795 0.067 3.996 0.060 0.950 0.0288 518.3174 1101 3.358 0.051 3.523 0.054 0.953 0.0296 826.5581 1202 1.648 0.107 1.983 0.108 0.831 0.0309 830.5894 1202 4.738 0.076 4.956 0.064 0.956 0.0317 430.3818 1204 4.790 0.109 5.108 0.096 0.938 0.0322 313.1153 1204 3.859 0.102 3.311 0.233 1.166 0.0327 755.5467 1201 3.507 0.072 3.728 0.072 0.941 0.0327 545.3453 1101 3.500 0.071 3.713 0.069 0.943 0.0353 320.2356 1204 1.302 0.114 1.590 0.070 0.819 0.0363 183.0661 1101 2.412 0.147 2.779 0.096 0.868 0.0416 825.5544 1202 2.644 0.112 2.968 0.109 0.891 0.0418 549.4845 1203 5.510 0.107 5.818 0.103 0.947 0.0424 829.5859 1202 5.864 0.082 6.087 0.070 0.963 0.0433 431.386 1204 3.354 0.108 3.651 0.099 0.919 0.0463 784.5811 1201 5.585 0.073 5.782 0.064 0.966 0.0463 777.5287 1201 2.793 0.063 2.986 0.072 0.935 0.0466 278.2254 1204 4.828 0.056 4.996 0.062 0.966 0.0467 548.4815 1203 6.949 0.103 7.233 0.096 0.961 0.0472 777.553 1202 1.720 0.100 2.002 0.098 0.859 0.0483 517.314 1101 5.399 0.050 5.547 0.055 0.973 0.0488 661.6233 1204 2.430 0.088 2.638 0.054 0.921 0.0489 -
Table 5: Accurate mass features differing between clinically diagnosed non-AD patients and non-demented controls (p<0.05, log2 transformed). Detected Mass Analysis Mode AVG (log2) NON-AD SEM NON-AD AVG (log2) Normal SEM Normal log(2) Ratio P Value 541.3432 1102 3.255 0.043 3.679 0.048 0.885 3.43E-12 567.3547 1102 2.621 0.052 3.117 0.054 0.841 2.78E-11 805.5605 1101 5.159 0.072 5.604 0.048 0.921 1.08E-09 806.5639 1101 4.150 0.073 4.630 0.049 0.896 1.51E-09 804.5713 1102 4.159 0.056 4.466 0.033 0.931 3.79E-09 783.5672 1101 3.515 0.077 4.126 0.079 0.852 4.13E-09 781.5617 1101 5.919 0.072 6.403 0.072 0.924 4.19E-09 780.5474 1101 5.276 0.075 5.691 0.043 0.927 4.35E-09 803.568 1102 5.379 0.056 5.656 0.035 0.951 4.43E-09 779.5444 1101 6.291 0.073 6.659 0.043 0.945 5.24E-09 760.5811 1101 4.034 0.079 4.733 0.103 0.852 6.28E-09 805.5832 1102 3.897 0.057 4.344 0.068 0.897 6.49E-09 759.5779 1101 5.166 0.082 5.810 0.099 0.889 1.04E-08 782.565 1101 4.878 0.077 5.415 0.078 0.901 1.14E-08 829.5856 1102 3.952 0.051 4.261 0.046 0.927 1.44E-08 569.3687 1102 2.217 0.062 2.639 0.048 0.840 1.99E-08 755.5468 1101 1.974 0.089 2.667 0.085 0.740 2.63E-08 757.4991 1101 3.368 0.086 3.945 0.070 0.854 2.69E-08 871.5528 1102 2.960 0.059 3.301 0.040 0.897 4.58E-08 804.5476 1101 4.125 0.073 4.556 0.060 0.906 6.76E-08 803.5445 1101 5.084 0.072 5.478 0.059 0.928 7.46E-08 758.5656 1101 5.440 0.089 5.968 0.078 0.912 8.14E-08 565.3394 1102 3.359 0.081 3.834 0.055 0.876 8.59E-08 757.5626 1101 6.417 0.087 6.886 0.079 0.932 1.74E-07 808.5792 1101 4.527 0.078 4.904 0.047 0.923 2.30E-07 795.5181 1101 2.491 0.071 2.948 0.064 0.845 2.65E-07 807.5758 1101 5.569 0.080 5.911 0.047 0.942 3.99E-07 731.5464 1101 1.460 0.132 2.519 0.157 0.580 4.14E-07 837.5027 1101 3.437 0.071 3.810 0.050 0.902 4.34E-07 761.5843 1101 2.053 0.092 2.740 0.106 0.749 5.01E-07 784.5811 1101 4.092 0.095 4.666 0.089 0.877 5.41E-07 831.5997 1102 4.512 0.057 4.749 0.040 0.950 6.07E-07 832.6026 1102 3.409 0.056 3.677 0.040 0.927 6.72E-07 555.3102 1102 1.792 0.066 2.170 0.046 0.826 8.11E-07 833.5932 1101 3.038 0.087 3.495 0.056 0.869 1.09E-06 829.5604 1101 3.381 0.077 3.754 0.058 0.901 3.91E-06 811.6096 1101 2.826 0.097 3.401 0.096 0.831 4.19E-06 785.5933 1101 5.629 0.100 6.075 0.080 0.927 5.08E-06 786.5967 1101 4.566 0.101 5.041 0.078 0.906 5.43E-06 827.57 1102 4.191 0.064 4.486 0.062 0.934 6.39E-06 828.5737 1102 3.197 0.058 3.478 0.061 0.919 1.44E-05 810.5969 1101 3.785 0.100 4.234 0.080 0.894 2.51E-05 809.5936 1101 4.804 0.094 5.194 0.079 0.925 2.81E-05 517.314 1101 5.339 0.065 5.575 0.069 0.958 3.58E-05 495.332 1101 5.003 0.083 5.391 0.112 0.928 0.0001 518.3174 1101 3.325 0.062 3.601 0.073 0.923 0.0001 793.5386 1102 3.632 0.061 3.827 0.039 0.949 0.0001 794.5421 1102 2.536 0.061 2.763 0.040 0.918 0.0001 832.5791 1101 3.305 0.080 3.607 0.061 0.916 0.0001 853.5854 1102 2.527 0.065 2.790 0.052 0.906 0.0001 915.5191 1101 2.278 0.083 2.632 0.063 0.866 0.0001 183.0661 1101 2.324 0.143 2.920 0.094 0.796 0.0002 521.3477 1101 3.406 0.099 3.895 0.127 0.875 0.0002 523.3634 1101 3.221 0.102 3.673 0.103 0.877 0.0002 543.3296 1101 3.579 0.072 3.898 0.087 0.918 0.0002 795.555 1102 2.608 0.069 2.893 0.065 0.902 0.0002 831.5759 1101 4.272 0.080 4.531 0.060 0.943 0.0002 886.5582 1102 2.998 0.049 3.149 0.041 0.952 0.0002 496.3355 1101 3.200 0.086 3.620 0.119 0.884 0.0004 827.5448 1101 3.340 0.105 3.752 0.095 0.890 0.0004 819.5551 1102 2.369 0.062 2.571 0.046 0.922 0.0005 522.3511 1101 1.480 0.111 2.005 0.121 0.738 0.0006 817.5377 1102 2.427 0.060 2.627 0.057 0.924 0.001 545.3453 1101 3.512 0.082 3.776 0.078 0.930 0.0011 575.2728 1101 2.381 0.076 2.653 0.074 0.897 0.0012 700.552 1101 2.150 0.094 2.535 0.102 0.848 0.0012 722.5335 1101 2.437 0.062 2.632 0.056 0.926 0.0014 520.3354 1101 2.075 0.117 2.564 0.130 0.809 0.0016 458.2405 1101 1.664 0.064 1.924 0.077 0.865 0.0017 542.3173 1101 2.268 0.092 2.603 0.089 0.871 0.0017 519.3321 1101 3.807 0.121 4.245 0.133 0.897 0.0019 546.3485 1101 1.931 0.069 2.216 0.089 0.872 0.0021 541.3139 1101 4.077 0.092 4.353 0.096 0.937 0.0025 1019.384 1102 3.095 0.042 2.828 0.037 1.094 0.0026 804.7227 1203 1.612 0.233 2.530 0.220 0.637 0.0027 831.7408 1203 3.839 0.137 4.286 0.130 0.896 0.0028 303.1079 1202 5.575 0.057 5.621 0.047 0.992 0.0032 549.4845 1203 5.480 0.127 5.807 0.110 0.944 0.0033 548.4815 1203 6.917 0.122 7.174 0.103 0.964 0.0034 746.5717 1204 3.115 0.058 3.257 0.061 0.957 0.0046 830.7363 1203 4.694 0.139 5.098 0.135 0.921 0.0046 306.2569 1204 3.015 0.059 3.164 0.067 0.953 0.0058 760.5216 1204 4.156 0.053 4.211 0.039 0.987 0.0058 732.4938 1204 4.274 0.060 4.370 0.057 0.978 0.0059 855.6016 1102 3.619 0.062 3.752 0.065 0.965 0.0059 523.4679 1203 3.249 0.212 3.886 0.165 0.836 0.0065 522.4635 1203 4.717 0.208 5.313 0.176 0.888 0.0066 1227.107 1203 3.235 0.116 3.547 0.100 0.912 0.0074 833.7551 1204 2.396 0.213 3.042 0.161 0.788 0.0075 520.4499 1203 3.898 0.194 4.434 0.148 0.879 0.0076 1228.111 1203 2.587 0.203 3.131 0.105 0.826 0.0077 521.4522 1203 2.319 0.204 2.933 0.158 0.790 0.0083 591.3542 1202 4.110 0.064 4.209 0.058 0.976 0.0085 856.672 1202 2.741 0.042 2.473 0.057 1.108 0.0086 777.553 1202 1.958 0.096 2.309 0.130 0.848 0.009 552.5022 1203 3.097 0.142 3.529 0.147 0.878 0.0092 777.5287 1201 2.781 0.055 2.926 0.072 0.951 0.0092 675.6377 1204 3.806 0.112 4.030 0.066 0.945 0.0098 748.5735 1202 3.883 0.036 3.606 0.050 1.077 0.0101 467.807 1101 1.408 0.134 0.863 0.144 1.631 0.0104 832.7523 1203 3.763 0.160 4.237 0.169 0.888 0.0104 837.718 1204 2.737 0.273 3.548 0.217 0.771 0.0107 745.5658 1204 4.005 0.060 4.109 0.068 0.975 0.0109 568.3573 1202 3.960 0.053 4.037 0.060 0.981 0.0113 550.4957 1203 6.848 0.150 7.184 0.160 0.953 0.0114 833.7571 1203 2.911 0.156 3.397 0.170 0.857 0.0115 838.7226 1204 2.158 0.237 2.880 0.206 0.749 0.0119 551.4986 1203 5.429 0.150 5.801 0.158 0.936 0.0121 585.2673 1202 1.612 0.153 1.034 0.148 1.558 0.0125 821.5712 1102 3.120 0.056 3.200 0.044 0.975 0.0133 835.7006 1204 2.553 0.198 3.113 0.167 0.820 0.0136 731.4916 1204 5.523 0.062 5.567 0.063 0.992 0.0138 867.7579 1204 2.503 0.252 3.205 0.189 0.781 0.0139 482.3215 1202 2.040 0.058 2.181 0.062 0.935 0.0145 858.6861 1202 2.935 0.050 2.670 0.052 1.099 0.0145 584.2646 1204 3.282 0.185 2.567 0.172 1.279 0.0148 829.7246 1203 4.743 0.119 4.973 0.101 0.954 0.015 828.7207 1203 5.497 0.121 5.716 0.107 0.962 0.0154 723.5197 1204 4.571 0.070 4.214 0.056 1.085 0.0167 864.738 1204 4.725 0.142 5.051 0.141 0.936 0.0171 691.1957 1102 2.168 0.067 1.878 0.068 1.155 0.0181 585.2664 1204 1.716 0.183 1.077 0.170 1.593 0.0187 749.5777 1202 2.879 0.034 2.659 0.046 1.083 0.0189 757.5014 1204 3.770 0.066 3.847 0.052 0.980 0.0197 863.7336 1204 5.458 0.146 5.763 0.147 0.947 0.02 830.7352 1204 4.133 0.151 4.493 0.150 0.920 0.0202 252.2095 1204 1.665 0.076 1.852 0.070 0.899 0.0206 860.7756 1203 4.306 0.109 4.507 0.100 0.955 0.0222 863.6876 1204 4.889 0.090 5.026 0.092 0.973 0.0227 861.7806 1203 2.435 0.158 2.811 0.119 0.866 0.0228 840.6063 1202 2.927 0.050 2.664 0.059 1.099 0.0229 632.5762 1203 1.325 0.170 1.773 0.132 0.747 0.0231 826.7069 1204 2.424 0.137 2.731 0.099 0.887 0.0242 419.8773 1101 1.946 0.176 1.305 0.194 1.491 0.0243 440.3532 1204 1.481 0.134 0.945 0.180 1.567 0.0247 831.7387 1204 3.137 0.164 3.534 0.150 0.888 0.0248 310.2883 1204 2.448 0.085 2.607 0.062 0.939 0.0256 481.3172 1202 3.978 0.053 4.029 0.060 0.987 0.0259 205.8865 1101 3.759 0.234 2.793 0.319 1.346 0.0271 513.4122 1204 1.142 0.153 0.623 0.163 1.833 0.0279 839.6031 1202 3.895 0.051 3.609 0.057 1.079 0.0286 865.7487 1204 4.847 0.188 5.275 0.193 0.919 0.029 579.5325 1203 4.188 0.154 4.491 0.127 0.933 0.0292 807.59 1202 2.477 0.072 2.633 0.082 0.941 0.0293 351.8903 1101 2.359 0.220 1.567 0.256 1.506 0.0296 782.5085 1204 3.596 0.062 3.662 0.055 0.982 0.0297 859.7696 1203 5.853 0.104 5.972 0.093 0.980 0.0298 409.8484 1101 2.107 0.192 1.437 0.210 1.466 0.0304 577.5137 1203 8.099 0.104 8.148 0.094 0.994 0.0305 1018.942 1203 3.468 0.142 3.767 0.126 0.921 0.0305 703.5709 1101 3.024 0.090 3.185 0.079 0.949 0.0314 484.3794 1204 2.234 0.118 1.721 0.178 1.298 0.0315 283.2602 1204 6.622 0.070 6.621 0.067 1.000 0.0316 401.8166 1101 1.696 0.161 1.139 0.177 1.489 0.0316 832.7492 1204 3.251 0.195 3.728 0.190 0.872 0.0316 190.033 1101 3.264 0.233 2.384 0.289 1.369 0.0317 806.5873 1202 4.367 0.082 4.490 0.092 0.973 0.032 282.2573 1204 9.088 0.073 9.019 0.071 1.008 0.0327 195.8577 1101 3.161 0.202 2.370 0.266 1.334 0.0328 744.4956 1204 3.941 0.058 3.988 0.058 0.988 0.0332 866.7532 1204 4.123 0.184 4.547 0.189 0.907 0.0334 215.9153 1101 5.221 0.247 4.183 0.346 1.248 0.0335 825.6926 1203 1.767 0.173 2.165 0.124 0.816 0.0339 469.8042 1101 1.617 0.150 1.096 0.170 1.475 0.0344 874.7645 1204 3.091 0.144 3.377 0.111 0.915 0.0345 494.4343 1203 2.119 0.275 2.809 0.232 0.754 0.0346 399.8196 1101 1.827 0.171 1.249 0.184 1.463 0.0348 802.7056 1204 1.701 0.206 2.248 0.202 0.756 0.0348 576.5098 1203 9.446 0.111 9.460 0.099 0.999 0.0355 382.1082 1101 2.222 0.229 1.494 0.220 1.487 0.0356 720.6438 1204 2.962 0.180 3.293 0.083 0.900 0.036 805.5839 1202 5.574 0.081 5.658 0.097 0.985 0.0365 779.5441 1201 7.096 0.041 7.010 0.053 1.012 0.0368 231.8893 1101 2.592 0.233 1.800 0.259 1.440 0.0372 686.4877 1204 2.721 0.054 2.791 0.052 0.975 0.0374 429.3749 1204 2.601 0.098 2.777 0.077 0.937 0.0378 265.8423 1101 2.499 0.220 1.743 0.252 1.433 0.0384 722.6424 1204 3.726 0.167 4.006 0.086 0.930 0.0385 780.5474 1201 6.022 0.043 5.972 0.054 1.008 0.0396 599.4936 1204 1.373 0.191 1.873 0.188 0.733 0.04 536.4794 1203 2.280 0.202 2.711 0.143 0.841 0.0422 244.0559 1101 3.574 0.126 3.098 0.132 1.153 0.0424 202.0453 1101 5.561 0.180 4.832 0.215 1.151 0.0425 535.7944 1101 1.480 0.143 1.018 0.153 1.455 0.0425 758.5092 1204 4.670 0.051 4.658 0.042 1.003 0.0426 626.5104 1204 2.100 0.135 2.391 0.114 0.878 0.0427 847.5316 1101 2.815 0.104 2.994 0.083 0.940 0.0432 592.3571 1202 2.375 0.065 2.480 0.062 0.958 0.0437 569.4784 1204 1.175 0.183 0.634 0.178 1.853 0.0447 721.639 1204 4.879 0.142 5.064 0.088 0.963 0.0447 752.5583 1204 4.284 0.070 3.966 0.061 1.080 0.0451 507.7055 1101 1.487 0.126 1.052 0.154 1.413 0.0454 827.7086 1203 3.916 0.119 4.098 0.096 0.956 0.046 784.5237 1204 3.464 0.056 3.490 0.037 0.993 0.0461 755.486 1204 3.395 0.059 3.450 0.057 0.984 0.0471 628.5237 1204 2.627 0.158 2.955 0.136 0.889 0.0472 218.0192 1101 3.591 0.258 2.716 0.302 1.322 0.049 -
Table 6: Accurate mass features differing between clinically diagnosed AD patients with a mild cognitive impairment and non-demented controls (p<0.05, log2 transformed). Detected Mass Analysis Mode AVG (log2) AD noCog SEM AD noCog AVG (log2) Normal SEM Normal log(2) Ratio P Value 723.5197 1204 3.576 0.058 4.350 0.056 0.822 6.42E-14 723.5195 1202 2.181 0.056 2.892 0.052 0.754 2.49E-13 751.5529 1202 3.293 0.050 3.920 0.050 0.840 1.39E-12 724.5257 1204 2.883 0.044 3.463 0.055 0.833 9.96E-12 749.5367 1202 3.168 0.051 3.714 0.041 0.853 1.33E-11 752.5564 1202 2.216 0.057 2.836 0.050 0.781 1.91E-11 751.5555 1204 4.553 0.060 5.248 0.060 0.868 1.96E-11 750.5402 1202 2.175 0.054 2.704 0.044 0.804 2.92E-10 752.5583 1204 3.453 0.063 4.094 0.061 0.844 6.11E-10 750.544 1204 3.299 0.052 3.858 0.063 0.855 3.31E-09 749.5407 1204 4.429 0.061 5.012 0.064 0.884 9.50E-09 699.5198 1204 2.309 0.047 2.775 0.054 0.832 1.20E-08 725.5385 1204 2.958 0.060 3.417 0.054 0.866 4.59E-07 727.5568 1204 3.588 0.050 3.986 0.060 0.900 3.00E-06 812.5762 1202 1.571 0.087 2.084 0.058 0.754 1.13E-05 541.3432 1102 3.518 0.039 3.798 0.048 0.926 2.42E-05 813.5885 1202 2.992 0.041 3.276 0.048 0.913 2.68E-05 811.5732 1202 2.683 0.055 3.027 0.055 0.886 3.92E-05 726.5461 1204 2.869 0.047 3.150 0.050 0.911 0.0001 814.5917 1202 2.028 0.040 2.289 0.051 0.886 0.0001 632.5762 1203 0.944 0.175 1.830 0.132 0.516 0.0002 728.5627 1204 2.998 0.045 3.281 0.060 0.914 0.0003 782.5085 1204 3.435 0.071 3.780 0.055 0.909 0.0003 569.3687 1102 2.479 0.045 2.724 0.048 0.910 0.0004 803.5445 1101 5.324 0.070 5.655 0.059 0.941 0.0007 804.5476 1101 4.370 0.073 4.703 0.060 0.929 0.0009 817.5377 1102 2.405 0.066 2.712 0.057 0.887 0.001 787.5729 1202 1.864 0.058 2.145 0.057 0.869 0.0011 747.5245 1204 3.521 0.063 3.886 0.090 0.906 0.0013 775.5533 1202 2.140 0.062 2.449 0.068 0.874 0.0013 746.5717 1204 3.117 0.043 3.362 0.061 0.927 0.0014 827.57 1102 4.337 0.063 4.630 0.062 0.937 0.0017 745.5658 1204 3.989 0.041 4.242 0.068 0.940 0.0018 828.5737 1102 3.313 0.063 3.590 0.061 0.923 0.0025 542.3173 1101 2.344 0.067 2.687 0.089 0.872 0.0027 760.5216 1204 4.140 0.052 4.347 0.039 0.952 0.0028 748.5287 1204 2.319 0.131 2.820 0.088 0.822 0.003 774.0316 1204 2.044 0.199 1.167 0.203 1.752 0.0031 784.5237 1204 3.405 0.052 3.603 0.037 0.945 0.0035 775.5528 1204 3.221 0.065 3.537 0.085 0.911 0.004 744.5536 1204 4.388 0.046 4.605 0.058 0.953 0.0042 482.3215 1202 2.001 0.057 2.251 0.062 0.889 0.0043 768.5539 1204 3.995 0.060 4.279 0.077 0.934 0.0044 506.2851 1201 3.210 0.100 2.656 0.165 1.209 0.0045 747.5201 1202 2.006 0.060 2.313 0.088 0.867 0.0045 755.486 1204 3.295 0.069 3.561 0.057 0.925 0.0047 781.5617 1101 6.305 0.075 6.610 0.072 0.954 0.005 786.5416 1204 3.903 0.046 4.087 0.043 0.955 0.0052 804.5713 1102 4.426 0.054 4.610 0.033 0.960 0.0064 743.5471 1204 5.349 0.054 5.579 0.063 0.959 0.0066 541.3139 1101 4.172 0.067 4.494 0.096 0.928 0.0069 767.5495 1204 5.085 0.063 5.369 0.082 0.947 0.0072 782.565 1101 5.279 0.080 5.589 0.078 0.945 0.0074 555.3102 1102 2.033 0.059 2.240 0.046 0.908 0.0086 567.3547 1102 3.031 0.045 3.218 0.054 0.942 0.0089 565.3394 1102 3.728 0.064 3.958 0.055 0.942 0.0094 582.2473 1201 3.346 0.151 2.793 0.141 1.198 0.0099 803.568 1102 5.656 0.057 5.838 0.035 0.969 0.0108 779.5444 1101 6.654 0.070 6.874 0.043 0.968 0.0113 796.5876 1204 2.630 0.063 2.860 0.062 0.919 0.0117 758.5092 1204 4.652 0.043 4.808 0.042 0.968 0.0126 783.5148 1204 3.344 0.068 3.574 0.056 0.936 0.0126 748.5735 1202 3.893 0.045 3.722 0.050 1.046 0.0135 529.3167 1202 3.028 0.064 3.265 0.069 0.927 0.0138 781.562 1201 7.406 0.060 7.638 0.071 0.970 0.0144 780.5474 1101 5.661 0.070 5.875 0.043 0.964 0.0145 810.5399 1204 2.905 0.069 3.145 0.066 0.923 0.0147 837.5881 1202 2.412 0.040 2.577 0.053 0.936 0.0147 590.343 1202 4.042 0.072 4.304 0.076 0.939 0.0149 580.5351 1203 1.531 0.200 2.192 0.174 0.699 0.0166 789.5892 1202 1.755 0.049 1.952 0.065 0.899 0.0167 887.7352 1204 6.359 0.115 5.963 0.113 1.066 0.0174 828.5743 1202 5.301 0.087 5.598 0.085 0.947 0.0178 916.7743 1204 5.952 0.113 5.571 0.107 1.068 0.0178 856.672 1202 2.753 0.058 2.553 0.057 1.078 0.0179 827.5701 1202 6.362 0.095 6.684 0.092 0.952 0.0187 942.7879 1204 3.531 0.102 3.195 0.092 1.105 0.019 523.4679 1203 3.471 0.153 4.011 0.165 0.865 0.0194 915.7681 1204 6.365 0.115 5.972 0.116 1.066 0.0194 517.314 1101 5.547 0.055 5.755 0.069 0.964 0.0195 777.553 1202 2.002 0.098 2.384 0.130 0.840 0.0204 744.4956 1204 3.916 0.061 4.117 0.058 0.951 0.0206 440.3532 1204 1.502 0.136 0.975 0.180 1.539 0.021 782.5653 1201 6.382 0.065 6.614 0.076 0.965 0.0222 494.4343 1203 2.145 0.226 2.900 0.232 0.740 0.0232 303.1079 1202 5.646 0.048 5.802 0.047 0.973 0.0233 771.5814 1204 4.208 0.050 4.367 0.046 0.964 0.0236 521.4522 1203 2.482 0.173 3.028 0.158 0.820 0.0242 793.5681 1204 3.191 0.055 3.372 0.055 0.946 0.0244 832.6026 1102 3.662 0.042 3.795 0.040 0.965 0.0252 589.3403 1202 5.900 0.084 6.171 0.085 0.956 0.026 732.4938 1204 4.319 0.061 4.511 0.057 0.957 0.0263 783.5672 1101 3.993 0.085 4.259 0.079 0.938 0.0265 569.369 1202 4.947 0.042 5.089 0.047 0.972 0.0273 522.4635 1203 4.938 0.167 5.485 0.176 0.900 0.0277 795.5181 1101 2.823 0.073 3.044 0.064 0.927 0.0287 888.7394 1204 5.759 0.115 5.400 0.110 1.066 0.0287 490.3641 1203 1.864 0.138 1.397 0.159 1.334 0.029 914.7583 1204 5.125 0.112 4.763 0.118 1.076 0.0294 520.4499 1203 4.141 0.131 4.577 0.148 0.905 0.03 805.5832 1102 4.292 0.055 4.485 0.068 0.957 0.0301 795.5838 1204 3.558 0.070 3.769 0.063 0.944 0.0305 575.2728 1101 2.532 0.060 2.739 0.074 0.925 0.0324 831.5997 1102 4.774 0.042 4.903 0.040 0.974 0.0325 518.3174 1101 3.523 0.054 3.717 0.073 0.948 0.0338 520.3354 1101 2.271 0.117 2.646 0.130 0.858 0.0354 573.4852 1203 4.919 0.063 4.740 0.053 1.038 0.0354 579.5325 1203 4.235 0.135 4.636 0.127 0.913 0.0355 570.3725 1202 3.021 0.043 3.155 0.045 0.958 0.0359 793.5386 1102 3.799 0.057 3.950 0.039 0.962 0.0359 481.3172 1202 3.980 0.058 4.159 0.060 0.957 0.0361 831.5759 1101 4.485 0.066 4.677 0.060 0.959 0.0365 913.7513 1204 5.358 0.113 5.006 0.120 1.070 0.037 772.5862 1204 3.306 0.045 3.437 0.042 0.962 0.0378 304.241 1204 4.898 0.062 5.088 0.066 0.963 0.0397 746.557 1202 2.177 0.042 2.057 0.037 1.058 0.0399 519.3321 1101 4.014 0.116 4.382 0.133 0.916 0.0405 833.7551 1204 2.611 0.191 3.140 0.161 0.831 0.0406 889.7492 1204 7.711 0.122 7.365 0.110 1.047 0.0415 614.4914 1203 2.747 0.091 2.448 0.114 1.122 0.0418 618.4829 1201 1.844 0.179 1.310 0.185 1.407 0.0429 601.5164 1203 7.639 0.052 7.463 0.069 1.024 0.0431 671.5723 1204 2.349 0.088 2.604 0.087 0.902 0.0435 794.5421 1102 2.703 0.059 2.853 0.040 0.948 0.0438 731.4916 1204 5.555 0.068 5.746 0.063 0.967 0.0444 512.4082 1204 2.523 0.180 1.954 0.215 1.292 0.0451 768.5503 1202 2.028 0.082 2.277 0.090 0.891 0.0453 665.501 1204 3.429 0.105 3.074 0.142 1.116 0.0454 890.7535 1204 7.055 0.116 6.731 0.106 1.048 0.0454 759.5163 1204 4.804 0.055 4.954 0.048 0.970 0.0455 605.5457 1203 5.235 0.100 5.509 0.089 0.950 0.0473 541.4425 1204 2.234 0.148 1.745 0.198 1.280 0.0488 572.4816 1203 6.271 0.061 6.108 0.052 1.027 0.049 743.5466 1203 1.977 0.103 2.266 0.099 0.873 0.0492 -
Table 7: Accurate mass features differing between dementia patients with a significant cognitive impairment (ADAS ≥ 16) and dementia patients with a mild cognitive impairment (ADAS ≤ 15) (p<0.05, log2 transformed). Detected Mass Analysis Mode AVG (log2) ADAS high SEM ADAS HIGH AVG (log2) ADAS LOW SEM ADAS LOW log(2) Ratio P Value 541.3432 1102 3.155 0.038 3.581 0.054 0.881 6.71E-09 567.3547 1102 2.633 0.052 3.122 0.058 0.843 3.84E-08 569.3687 1102 2.079 0.053 2.526 0.054 0.823 2.41E-07 829.5856 1102 3.861 0.057 4.303 0.059 0.897 1.71E-06 565.3394 1102 3.268 0.064 3.784 0.081 0.864 3.73E-06 837.5027 1101 3.373 0.056 3.818 0.070 0.884 4.53E-06 804.5713 1102 4.022 0.051 4.414 0.060 0.911 5.01E-06 831.5997 1102 4.379 0.055 4.761 0.046 0.920 5.17E-06 832.6026 1102 3.278 0.055 3.658 0.046 0.896 5.66E-06 803.568 1102 5.252 0.052 5.640 0.065 0.931 1.42E-05 805.5832 1102 3.894 0.056 4.293 0.063 0.907 1.48E-05 871.5528 1102 2.886 0.051 3.244 0.059 0.890 2.25E-05 555.3102 1102 1.669 0.053 2.070 0.074 0.806 2.34E-05 853.5854 1102 2.473 0.058 2.824 0.040 0.876 2.85E-05 886.5582 1102 2.898 0.036 3.166 0.051 0.916 4.34E-05 808.5792 1101 4.475 0.071 4.922 0.068 0.909 4.77E-05 780.5474 1101 5.229 0.067 5.665 0.086 0.923 0.0001 805.5605 1101 5.210 0.072 5.655 0.078 0.921 0.0001 807.5758 1101 5.522 0.071 5.962 0.069 0.926 0.0001 543.3296 1101 3.594 0.055 3.948 0.075 0.910 0.0002 779.5444 1101 6.228 0.067 6.660 0.086 0.935 0.0002 806.5639 1101 4.213 0.074 4.656 0.079 0.905 0.0002 829.5604 1101 3.368 0.070 3.766 0.069 0.894 0.0002 755.5468 1101 2.034 0.091 2.551 0.098 0.797 0.0003 819.5551 1102 2.270 0.062 2.611 0.062 0.869 0.0003 915.5191 1101 2.209 0.066 2.603 0.082 0.849 0.0004 794.5421 1102 2.389 0.054 2.705 0.073 0.883 0.0007 832.5791 1101 3.221 0.066 3.564 0.066 0.904 0.0007 793.5386 1102 3.462 0.057 3.778 0.069 0.916 0.0008 803.5445 1101 4.995 0.065 5.351 0.078 0.933 0.0008 804.5476 1101 4.045 0.064 4.402 0.080 0.919 0.0008 731.5464 1101 1.574 0.132 2.200 0.109 0.716 0.0011 827.57 1102 4.055 0.057 4.341 0.062 0.934 0.0014 722.5335 1101 2.379 0.064 2.687 0.064 0.885 0.0015 831.5759 1101 4.163 0.072 4.510 0.070 0.923 0.0015 517.314 1101 5.343 0.057 5.631 0.068 0.949 0.0019 757.4991 1101 3.393 0.086 3.828 0.102 0.886 0.0019 783.5672 1101 3.547 0.087 3.974 0.097 0.893 0.002 545.3453 1101 3.457 0.072 3.795 0.073 0.911 0.0022 518.3174 1101 3.321 0.056 3.600 0.068 0.922 0.0023 760.5811 1101 4.181 0.092 4.609 0.101 0.907 0.003 784.5811 1101 4.155 0.104 4.630 0.111 0.897 0.0033 546.3485 1101 1.883 0.067 2.196 0.078 0.857 0.0034 759.5779 1101 5.313 0.091 5.727 0.098 0.928 0.0034 855.6016 1102 3.447 0.060 3.709 0.056 0.929 0.0034 847.5316 1101 2.627 0.075 3.004 0.106 0.874 0.0037 781.5617 1101 5.942 0.079 6.291 0.082 0.945 0.0039 575.2728 1101 2.359 0.070 2.663 0.069 0.886 0.0042 828.5737 1102 3.070 0.054 3.317 0.064 0.926 0.0047 795.555 1102 2.558 0.065 2.831 0.063 0.904 0.0053 821.5712 1102 2.952 0.058 3.195 0.057 0.924 0.0053 833.5932 1101 3.069 0.092 3.444 0.083 0.891 0.0053 782.565 1101 4.918 0.082 5.266 0.085 0.934 0.0056 795.5181 1101 2.462 0.075 2.793 0.090 0.882 0.0066 725.5527 1101 3.222 0.073 3.500 0.057 0.921 0.0068 761.5843 1101 2.194 0.095 2.580 0.098 0.850 0.0078 738.5448 1102 2.493 0.076 2.766 0.047 0.901 0.0083 811.6096 1101 2.869 0.106 3.277 0.096 0.876 0.0088 758.5656 1101 5.459 0.101 5.870 0.112 0.930 0.0092 785.5933 1101 5.643 0.108 6.049 0.097 0.933 0.0103 458.2405 1101 1.635 0.057 1.880 0.075 0.870 0.0104 757.5626 1101 6.418 0.100 6.815 0.112 0.942 0.0112 541.3139 1101 3.968 0.074 4.278 0.096 0.928 0.0116 786.5967 1101 4.570 0.109 4.973 0.099 0.919 0.012 748.5721 1102 3.811 0.069 4.050 0.055 0.941 0.0137 749.5761 1102 2.699 0.066 2.929 0.053 0.922 0.0156 501.3212 1201 1.903 0.052 2.108 0.066 0.903 0.0176 809.5936 1101 4.792 0.099 5.124 0.084 0.935 0.0194 810.5969 1101 3.785 0.102 4.126 0.086 0.917 0.0199 542.3173 1101 2.183 0.077 2.464 0.091 0.886 0.0228 724.5493 1101 4.493 0.076 4.734 0.059 0.949 0.0232 723.5197 1204 3.966 0.083 3.699 0.091 1.072 0.0362 521.3477 1101 3.545 0.086 3.863 0.130 0.918 0.0374 1098.974 1204 3.016 0.105 2.552 0.219 1.182 0.039 523.3634 1101 3.263 0.100 3.596 0.130 0.907 0.0433 807.5768 1201 6.721 0.033 6.816 0.031 0.986 0.0452 826.7069 1204 2.385 0.134 2.766 0.113 0.862 0.0462 931.7695 1203 2.852 0.090 2.495 0.169 1.143 0.0475 183.0661 1101 2.358 0.139 2.748 0.116 0.858 0.0485 504.3814 1203 1.818 0.065 1.573 0.113 1.156 0.0489 -
Table 8: Accurate mass features differing between patients with mild cognitive impairment (MMSE 18-23), severe cognitive impairment (MMSE ≤ 17) and normal cognitive ability (MMSE ≥ 28) as measured on the MMSE. Detected Mass Analysis Modes AVG (log2) mild MMSE SEM (log2) mild MMSE AVG (log2) severe MMSE SEM (log2) severe MMSE AVG (log2) Normal SEM (log2) Normal log(2) Ratio mild/normal log(2) Ratio severe/normal log(2) Ratio mild/severe P Value 726.5461 1204 3.125 0.058 2.729 0.053 2.981 0.067 1.048 0.916 1.145 0.0002 675.6377 1204 4.131 0.049 3.856 0.082 4.124 0.061 1.002 0.935 1.071 0.0102 801.555* 1202 2.733 0.144 2.602 0.110 3.052 0.077 0.895 0.853 1.050 0.0108 570.3725 1202 3.071 0.067 2.895 0.054 3.130 0.054 0.981 0.925 1.061 0.0116 597.484 1203 2.915 0.146 2.582 0.101 3.046 0.110 0.957 0.848 1.129 0.0138 246.1472 1204 2.437 0.187 3.031 0.161 2.974 0.067 0.819 1.019 0.804 0.0161 565.3394* 1202 7.087 0.132 6.908 0.090 7.304 0.087 0.970 0.946 1.026 0.0171 596.4791 1203 4.125 0.172 3.792 0.112 4.283 0.111 0.963 0.886 1.088 0.0188 246.1465 1202 3.577 0.208 4.046 0.123 4.169 0.104 0.858 0.970 0.884 0.0199 432.3254 1204 2.540 0.059 2.325 0.058 2.495 0.047 1.018 0.932 1.092 0.0201 569.369* 1202 5.009 0.056 4.834 0.050 5.032 0.063 0.995 0.961 1.036 0.0285 661.6233 1204 2.783 0.091 2.448 0.090 2.683 0.079 1.037 0.912 1.137 0.0307 857.6186* 1202 3.923 0.122 3.699 0.104 4.090 0.101 0.959 0.904 1.061 0.0332 804.5718 1202 5.940 0.135 5.776 0.088 6.170 0.112 0.963 0.936 1.028 0.0334 803.5677 1202 7.274 0.174 7.084 0.116 7.570 0.131 0.961 0.936 1.027 0.0359 542.3461 1202 3.898 0.134 3.773 0.071 4.124 0.104 0.945 0.915 1.033 0.037 810.5399 1204 3.152 0.104 2.749 0.088 2.959 0.113 1.065 0.929 1.146 0.0374 728.5627 1204 3.233 0.078 2.954 0.065 3.054 0.071 1.059 0.967 1.094 0.0404 566.3434 1202 5.338 0.100 5.142 0.093 5.460 0.082 0.978 0.942 1.038 0.0417 481.3172 1202 3.940 0.088 3.875 0.069 4.136 0.077 0.953 0.937 1.017 0.0436 724.5257 1204 3.168 0.102 2.875 0.079 2.961 0.055 1.070 0.971 1.102 0.0447 825.5544 1202 2.933 0.173 2.605 0.144 3.160 0.171 0.928 0.824 1.126 0.0474 826.5581 1202 2.005 0.151 1.579 0.156 2.139 0.188 0.937 0.738 1.270 0.0488 -
Table 9: Grouping of patients into one of 8 groups based on the presence of AD pathology, ADAS score and MMSE score. A score of 1 was given for the presence of AD pathology, high ADAS score (≥ 16), or low MMSE score (≤ 23); a score of 0 was given in the absence of AD pathology, low ADAS score (≤ 15), or high MMSE score (≥ 28). Patient ID AD Pathology ADAS MMSE Patient ID AD Pathology ADAS MMSE 7001 1 1 1 7096 1 0 1 7002 0 1 1 7097 1 0 1 7006 1 0 1 7098 0 0 0 7007 1 1 1 7101 0 0 0 7008 1 0 1 7102 1 0 0 7009 1 0 1 7103 0 1 0 7010 1 0 1 7104 0 1 0 7011 1 0 1 7105 0 1 0 7014 1 0 1 7106 1 1 0 7015 0 1 1 7108 0 0 0 7016 1 1 1 7109 0 0 0 7017 1 1 1 7110 0 1 0 7022 1 1 1 7111 0 1 0 7023 1 1 1 7112 1 1 0 7024 1 0 1 7113 1 1 0 7025 1 0 1 7114 1 1 0 7027 1 0 1 7115 0 1 0 7028 1 1 1 7116 1 1 0 7029 1 1 1 7117 0 1 0 7030 1 0 1 7118 0 0 0 7031 1 0 1 7119 0 0 0 7033 0 1 1 7120 0 0 0 7034 1 0 1 7124 1 1 0 7035 0 1 1 7125 1 1 0 7037 1 1 1 7126 0 0 0 7039 1 0 1 7127 0 0 0 7042 1 0 1 7128 0 1 0 7043 0 1 1 7129 1 0 0 7044 1 1 1 7130 0 0 0 7045 1 0 1 7131 0 0 0 7046 1 1 1 7133 0 1 0 7047 0 1 1 7134 0 1 0 7048 1 0 1 7135 0 0 0 7049 1 0 1 7136 1 0 0 7050 0 1 1 7137 0 0 0 7051 1 0 1 7138 0 0 0 7052 1 0 1 7139 0 1 0 7053 1 0 1 7140 1 0 0 7055 0 1 1 7141 1 1 0 7056 1 1 1 7142 1 1 0 7057 1 0 1 7143 1 0 0 7058 1 0 1 7144 1 0 0 7059 0 1 1 7145 0 1 0 7062 0 0 0 7146 0 1 0 7063 1 1 1 7147 0 1 0 7064 0 0 0 7150 1 0 0 7066 0 0 1 7151 1 0 0 7067 1 1 1 7152 0 1 0 7070 0 0 0 7153 0 0 0 7074 0 1 1 7154 1 1 0 7075 1 1 1 7155 1 1 0 7076 0 1 1 7156 0 0 0 7077 1 1 1 7157 1 0 0 7078 1 0 1 7158 1 0 0 7079 0 1 1 7309 1 0 1 7080 0 1 1 7310 1 0 0 7081 1 1 1 7315 1 0 1 7082 1 1 1 7802 0 0 0 7084 1 1 1 7811 0 0 0 7085 1 0 1 7814 1 0 0 7086 0 1 1 7817 1 0 0 7087 0 1 1 7818 0 0 0 7088 1 1 1 7819 0 1 0 7089 1 1 1 7823 1 0 0 7090 1 1 1 7831 0 0 0 7091 0 1 1 7832 1 0 0 7093 1 0 1 7833 1 0 0 7094 0 1 1 7095 0 1 1 -
Table 10: Accurate mass features differing between patients showing the best discrimination between AD and non-AD pathology (p<0.05, log2 transformed). Detected Mass Analysis Mode AVG (log2) AD SEM AD AVG (log2) non-AD SEM AD log(2) Ratio P Value 699.5199 1204 1.985 0.043 2.956 0.067 0.672 1.24E-14 723.5195 1204 3.281 0.070 4.702 0.101 0.698 4.86E-14 723.5194 1202 2.039 0.077 3.191 0.069 0.639 1.59E-13 751.5553 1204 4.290 0.074 5.450 0.093 0.787 5.86E-12 724.5258 1204 2.667 0.062 3.750 0.092 0.711 6.50E-12 751.5529 1202 3.197 0.068 4.076 0.062 0.784 1.03E-11 752.5564 1202 2.126 0.069 3.010 0.061 0.706 1.16E-11 749.5367 1202 3.061 0.062 3.861 0.056 0.793 1.22E-11 752.5581 1204 3.170 0.072 4.292 0.094 0.739 1.52E-11 749.5406 1204 4.177 0.067 5.235 0.095 0.798 4.77E-11 750.5403 1202 2.081 0.074 2.886 0.051 0.721 6.77E-11 750.5438 1204 3.060 0.068 4.067 0.091 0.752 7.99E-11 727.5567 1204 3.305 0.074 4.064 0.053 0.813 4.71E-10 725.5385 1204 2.654 0.094 3.590 0.079 0.739 3.99E-09 728.5629 1204 2.813 0.063 3.345 0.057 0.841 2.54E-07 726.5462 1204 2.753 0.064 3.215 0.062 0.856 7.09E-06 768.5538 1204 3.755 0.060 4.250 0.084 0.884 2.34E-05 747.5244 1204 3.263 0.092 3.999 0.123 0.816 2.45E-05 744.5535 1204 4.147 0.050 4.492 0.053 0.923 3.13E-05 813.5885 1202 2.969 0.051 3.362 0.067 0.883 3.58E-05 743.547 1204 5.096 0.053 5.455 0.059 0.934 0.0001 767.5494 1204 4.835 0.065 5.337 0.092 0.906 0.0001 775.5527 1204 2.993 0.100 3.645 0.105 0.821 0.0001 775.5533 1202 1.993 0.078 2.525 0.088 0.789 0.0001 811.5732 1202 2.590 0.072 3.025 0.071 0.856 0.0001 812.5761 1202 1.599 0.064 2.057 0.084 0.777 0.0001 817.5376 1102 1.992 0.073 2.490 0.081 0.800 0.0001 747.5201 1202 1.829 0.090 2.412 0.110 0.758 0.0002 795.5837 1204 3.418 0.073 3.810 0.062 0.897 0.0002 796.5874 1204 2.468 0.051 2.839 0.074 0.869 0.0002 748.5286 1204 1.812 0.247 2.917 0.126 0.621 0.0003 810.54 1204 2.627 0.088 3.116 0.083 0.843 0.0003 782.5084 1204 3.308 0.060 3.687 0.078 0.897 0.0004 755.486 1204 3.069 0.080 3.477 0.073 0.883 0.0005 758.5092 1204 4.418 0.065 4.707 0.043 0.939 0.0007 771.5813 1204 3.965 0.074 4.288 0.046 0.925 0.0007 304.241 1204 4.716 0.057 5.013 0.062 0.941 0.0011 814.5919 1202 1.988 0.046 2.307 0.077 0.862 0.0011 786.5415 1204 3.671 0.074 3.979 0.050 0.923 0.0013 787.5728 1202 1.743 0.085 2.136 0.075 0.816 0.0013 793.5386 1102 3.337 0.086 3.690 0.057 0.904 0.0015 783.5147 1204 3.166 0.071 3.512 0.077 0.901 0.0022 828.5736 1102 2.906 0.080 3.292 0.087 0.883 0.0023 828.5743 1202 5.132 0.073 5.485 0.081 0.936 0.0024 743.5468 1203 1.812 0.118 2.235 0.061 0.811 0.0029 784.5235 1204 3.196 0.081 3.490 0.045 0.916 0.003 760.5215 1204 3.910 0.072 4.200 0.058 0.931 0.0032 787.5464 1204 2.617 0.090 2.937 0.050 0.891 0.0037 827.57 1102 3.933 0.078 4.313 0.096 0.912 0.0039 305.2438 1204 2.384 0.064 2.648 0.058 0.900 0.0041 794.5421 1102 2.275 0.090 2.601 0.058 0.875 0.0041 827.5701 1202 6.193 0.081 6.559 0.090 0.944 0.0046 590.343 1202 3.939 0.055 4.216 0.074 0.934 0.0047 589.3404 1202 5.769 0.061 6.076 0.085 0.950 0.0057 789.5893 1202 1.673 0.064 1.967 0.077 0.851 0.0057 670.5689 1204 3.048 0.095 3.510 0.127 0.868 0.006 855.6016 1102 3.325 0.079 3.646 0.079 0.912 0.0064 759.5162 1204 4.510 0.086 4.811 0.060 0.937 0.0065 671.5722 1204 2.157 0.123 2.635 0.111 0.819 0.0066 769.5654 1204 3.829 0.065 4.086 0.063 0.937 0.0069 856.6063 1202 4.446 0.076 4.777 0.087 0.931 0.007 409.0208 1202 2.638 0.057 2.899 0.073 0.910 0.0072 774.0313 1204 2.317 0.202 1.370 0.268 1.691 0.0076 804.5713 1.102 3.964 0.086 4.276 0.071 0.927 0.008 855.6025 1202 5.437 0.074 5.749 0.085 0.946 0.0083 530.382 1204 2.991 0.089 2.097 0.309 1.426 0.0085 626.5278 1203 3.676 0.068 3.915 0.053 0.939 0.0087 731.4914 1204 5.281 0.086 5.589 0.073 0.945 0.0093 732.4937 1204 4.050 0.083 4.348 0.070 0.931 0.0093 517.3722 1204 2.189 0.112 1.465 0.241 1.494 0.0096 741.5307 1204 2.754 0.086 3.117 0.105 0.884 0.0109 803.5681 1102 5.187 0.087 5.491 0.073 0.945 0.0111 746.5714 1204 2.962 0.065 3.228 0.076 0.918 0.0113 627.5304 1203 2.544 0.068 2.783 0.058 0.914 0.0118 544.397 1204 3.249 0.120 2.323 0.341 1.399 0.0145 745.5656 1204 3.812 0.071 4.091 0.083 0.932 0.0148 739.5142 1204 2.576 0.105 3.009 0.137 0.856 0.0162 570.3725 1202 2.879 0.050 3.071 0.057 0.938 0.0164 686.4877 1204 2.527 0.068 2.757 0.064 0.917 0.0179 517.3136 1201 2.907 0.104 2.575 0.088 1.129 0.0193 744.4956 1204 3.741 0.073 3.988 0.070 0.938 0.0202 529.3167 1202 2.929 0.057 3.199 0.095 0.916 0.0203 821.5713 1102 2.825 0.089 3.091 0.065 0.914 0.0207 819.5641 1202 2.632 0.117 3.063 0.136 0.859 0.0209 667.5474 1204 3.336 0.118 2.882 0.150 1.158 0.0222 886.5582 1102 2.820 0.064 3.038 0.067 0.928 0.0232 796.529 1204 2.815 0.070 3.063 0.078 0.919 0.0234 306.2569 1204 2.848 0.083 3.103 0.074 0.918 0.0256 581.3344 1202 1.676 0.132 2.082 0.115 0.805 0.0261 817.584 1202 2.181 0.064 2.383 0.060 0.915 0.0261 685.5538 1204 1.862 0.132 2.222 0.083 0.838 0.0263 555.3101 1102 1.640 0.094 1.944 0.093 0.844 0.0277 666.5455 1204 4.533 0.128 4.059 0.168 1.117 0.0301 820.5677 1202 1.550 0.163 2.037 0.145 0.761 0.031 773.5368 1202 1.455 0.109 1.808 0.114 0.805 0.0324 541.3432 1102 3.148 0.073 3.377 0.073 0.932 0.0328 767.547 1202 2.917 0.095 3.237 0.111 0.901 0.0345 569.369 1202 4.824 0.048 4.987 0.057 0.967 0.0352 871.5935 1202 1.702 0.068 2.049 0.145 0.830 0.0362 1226.0968 1203 3.089 0.116 2.709 0.130 1.140 0.0365 793.5679 1204 3.022 0.067 3.237 0.075 0.934 0.0407 411.3211 1202 2.817 0.068 2.988 0.042 0.943 0.0408 684.5491 1204 2.304 0.087 2.600 0.110 0.886 0.041 768.5504 1202 1.786 0.141 2.160 0.106 0.827 0.041 743.5469 1202 2.894 0.076 3.173 0.109 0.912 0.0417 482.3215 1202 1.866 0.054 2.056 0.072 0.908 0.0424 574.4637 1202 1.059 0.201 1.653 0.204 0.640 0.0444 509.3493 1202 2.290 0.057 2.490 0.079 0.919 0.0446 772.586 1204 3.167 0.062 3.330 0.050 0.951 0.0458 383.3283 1204 1.280 0.142 1.662 0.119 0.770 0.0462 664.5322 1204 4.643 0.145 4.176 0.173 1.112 0.0465 312.2312 1204 2.771 0.059 2.583 0.070 1.073 0.0467 481.3172 1202 3.803 0.057 3.982 0.065 0.955 0.0468 765.5335 1204 3.065 0.107 3.418 0.137 0.897 0.0491 847.5953 1202 2.162 0.114 2.518 0.134 0.858 0.0492 624.5131 1203 3.900 0.068 4.084 0.061 0.955 0.0497 -
Table 11: Accurate mass features differing between patients showing the best discrimination between high ADAS score and low ADAS score (p<0.05, log2 transformed). Detected Mass Analysis Mode AVG (log2) high ADAS SEM high ADAS AVG (log2) low ADAS SEM low ADAS log(2) Ratio P Value 541.3435 1102 3.007 0.047 3.741 0.083 0.804 5.76E-09 569.3685 1102 1.862 0.065 2.686 0.070 0.693 9.27E-09 804.5713 1102 3.915 0.047 4.494 0.080 0.871 3.59E-07 803.5681 1102 5.145 0.046 5.720 0.084 0.899 5.31E-07 837.5027 1101 3.257 0.058 3.866 0.070 0.842 5.33E-07 807.5758 1101 5.318 0.076 6.045 0.065 0.880 5.92E-07 808.5792 1101 4.265 0.076 4.992 0.069 0.854 7.70E-07 832.6024 1102 3.129 0.065 3.740 0.063 0.837 1.34E-06 779.5444 1101 6.061 0.061 6.691 0.082 0.906 1.39E-06 780.5474 1101 5.073 0.063 5.714 0.083 0.888 1.42E-06 831.5995 1102 4.245 0.068 4.850 0.061 0.875 2.37E-06 546.3486 1101 1.593 0.073 2.250 0.084 0.708 5.48E-06 871.5529 1102 2.778 0.050 3.307 0.090 0.840 6.59E-06 567.3545 1102 2.637 0.079 3.305 0.081 0.798 8.54E-06 545.3453 1101 3.142 0.085 3.836 0.077 0.819 9.04E-06 805.5604 1101 5.013 0.074 5.685 0.099 0.882 9.51E-06 794.5422 1102 2.287 0.056 2.795 0.079 0.818 1.22E-05 886.5584 1102 2.853 0.053 3.354 0.081 0.851 1.32E-05 827.57 1102 3.893 0.063 4.438 0.079 0.877 1.41E-05 828.5737 1102 2.920 0.061 3.425 0.069 0.852 1.56E-05 805.5831 1102 3.821 0.058 4.385 0.100 0.871 1.61E-05 829.5856 1102 3.781 0.076 4.393 0.077 0.861 1.68E-05 915.5191 1101 2.144 0.053 2.621 0.078 0.818 1.99E-05 793.5387 1102 3.352 0.056 3.854 0.086 0.870 2.76E-05 806.5637 1101 4.001 0.078 4.667 0.107 0.857 2.85E-05 821.5713 1102 2.834 0.067 3.309 0.046 0.856 3.30E-05 565.3396 1102 3.216 0.096 3.992 0.121 0.806 3.57E-05 555.3098 1102 1.608 0.081 2.242 0.094 0.717 4.04E-05 757.4989 1101 3.119 0.086 3.849 0.148 0.810 0.0001 832.5792 1101 3.024 0.092 3.662 0.085 0.826 0.0001 855.6015 1102 3.274 0.068 3.795 0.093 0.862 0.0001 458.2404 1101 1.430 0.076 1.984 0.109 0.721 0.0002 783.5671 1101 3.275 0.105 4.025 0.141 0.813 0.0002 803.5445 1101 4.778 0.095 5.397 0.079 0.885 0.0002 804.5475 1101 3.844 0.095 4.459 0.075 0.862 0.0002 831.576 1101 3.924 0.100 4.575 0.095 0.858 0.0002 518.3174 1101 3.093 0.072 3.609 0.101 0.857 0.0003 781.5616 1101 5.679 0.096 6.315 0.110 0.899 0.0003 517.314 1101 5.122 0.077 5.642 0.104 0.908 0.0004 782.5649 1101 4.649 0.100 5.296 0.118 0.878 0.0004 785.5933 1101 5.333 0.121 6.107 0.132 0.873 0.0004 786.5967 1101 4.256 0.124 5.039 0.133 0.844 0.0004 833.5932 1101 2.746 0.113 3.494 0.134 0.786 0.0004 853.5855 1102 2.333 0.088 2.875 0.080 0.811 0.0004 755.5468 1101 1.879 0.101 2.593 0.157 0.725 0.0005 811.6096 1101 2.512 0.140 3.375 0.152 0.744 0.0006 809.5936 1101 4.448 0.126 5.177 0.119 0.859 0.0007 761.5843 1101 1.993 0.094 2.654 0.160 0.751 0.0008 810.5969 1101 3.451 0.128 4.183 0.115 0.825 0.0008 847.5316 1101 2.543 0.093 3.082 0.092 0.825 0.0008 757.5626 1101 6.144 0.104 6.825 0.155 0.900 0.0009 758.5656 1101 5.185 0.107 5.885 0.158 0.881 0.0009 543.3296 1101 3.486 0.084 4.025 0.125 0.866 0.001 759.5779 1101 5.080 0.100 5.759 0.169 0.882 0.0011 760.5811 1101 3.952 0.102 4.645 0.177 0.851 0.0012 795.5551 1102 2.493 0.075 2.937 0.092 0.849 0.0012 829.5604 1101 3.200 0.098 3.759 0.106 0.851 0.0012 523.3635 1101 2.882 0.117 3.595 0.163 0.801 0.0014 575.2728 1101 2.204 0.078 2.673 0.104 0.824 0.0014 784.581 1101 3.921 0.129 4.667 0.171 0.840 0.0018 819.5553 1102 2.210 0.089 2.665 0.085 0.829 0.0025 817.5378 1102 2.089 0.088 2.491 0.068 0.839 0.0047 731.5463 1101 1.373 0.174 2.218 0.197 0.619 0.0052 795.5183 1101 2.270 0.081 2.725 0.140 0.833 0.0058 722.5334 1101 2.190 0.085 2.598 0.111 0.843 0.0083 760.5217 1204 4.084 0.063 4.331 0.042 0.943 0.0118 833.757 1203 2.531 0.161 3.274 0.231 0.773 0.0132 429.3749 1204 2.703 0.080 3.137 0.167 0.861 0.0143 722.4789 1201 1.895 0.093 2.247 0.064 0.843 0.0145 1228.1111 1203 2.699 0.127 3.291 0.194 0.820 0.0146 541.3139 1101 3.909 0.116 4.412 0.152 0.886 0.0158 860.7753 1203 4.152 0.110 4.647 0.161 0.893 0.016 703.5709 1101 2.858 0.095 3.216 0.072 0.888 0.0163 579.5325 1203 3.776 0.177 4.492 0.191 0.841 0.0166 858.686 1202 3.030 0.064 2.781 0.057 1.090 0.0166 831.7408 1203 3.708 0.137 4.286 0.176 0.865 0.0175 484.3041 1203 2.257 0.120 1.475 0.348 1.530 0.0176 580.5352 1203 1.310 0.222 2.135 0.172 0.614 0.0181 830.7362 1203 4.568 0.137 5.156 0.187 0.886 0.0182 495.332 1101 4.769 0.114 5.305 0.195 0.899 0.0186 183.0662 1101 1.868 0.215 2.671 0.183 0.699 0.0191 702.5677 1101 4.033 0.104 4.409 0.074 0.915 0.0194 887.8001 1203 2.884 0.137 3.396 0.122 0.849 0.0199 886.7916 1203 4.153 0.131 4.631 0.120 0.897 0.0232 759.5164 1204 4.697 0.077 4.975 0.066 0.944 0.0236 725.5527 1101 3.123 0.108 3.499 0.079 0.892 0.0244 832.7522 1203 3.418 0.170 4.119 0.245 0.830 0.0255 828.7207 1203 5.336 0.130 5.867 0.187 0.909 0.0263 496.3355 1101 2.972 0.113 3.473 0.195 0.856 0.0264 604.5432 1203 6.338 0.149 6.863 0.137 0.924 0.0283 864.738 1204 4.641 0.166 5.295 0.232 0.876 0.0298 680.5623 1204 3.590 0.125 4.126 0.214 0.870 0.0305 627.5201 1204 3.756 0.157 4.380 0.227 0.858 0.0315 1019.3838 1102 3.116 0.042 2.950 0.063 1.056 0.0323 825.6927 1203 1.408 0.212 2.138 0.204 0.658 0.0331 863.7336 1204 5.382 0.170 6.035 0.237 0.892 0.0338 521.3477 1101 3.368 0.126 3.890 0.213 0.866 0.0349 731.4916 1204 5.513 0.065 5.746 0.076 0.959 0.0351 542.3173 1101 2.116 0.120 2.565 0.157 0.825 0.0352 829.7242 1204 2.575 0.161 3.185 0.221 0.809 0.0356 835.6998 1204 2.285 0.247 3.153 0.271 0.725 0.0356 276.2095 1204 2.479 0.091 2.885 0.179 0.859 0.0358 653.536 1204 4.096 0.154 4.679 0.218 0.875 0.0368 523.4678 1203 2.747 0.238 3.609 0.295 0.761 0.0372 829.7246 1203 4.606 0.121 5.065 0.173 0.909 0.0376 921.8142 1204 2.618 0.338 3.654 0.184 0.716 0.039 605.5456 1203 4.920 0.154 5.420 0.131 0.908 0.0392 549.4844 1203 5.315 0.129 5.753 0.137 0.924 0.0398 732.4939 1204 4.258 0.065 4.480 0.069 0.950 0.04 365.3159 1203 1.907 0.098 1.449 0.217 1.316 0.0402 867.7581 1204 2.358 0.280 3.299 0.284 0.715 0.0402 738.5445 1102 2.458 0.122 2.825 0.059 0.870 0.0409 859.7695 1203 5.769 0.102 6.185 0.179 0.933 0.0414 625.5075 1204 3.271 0.138 3.811 0.224 0.858 0.0422 512.3356 1203 2.602 0.095 2.151 0.223 1.210 0.0432 842.7387 1203 2.626 0.103 2.998 0.139 0.876 0.0432 552.5021 1203 2.742 0.161 3.315 0.213 0.827 0.0444 724.5493 1101 4.410 0.105 4.736 0.081 0.931 0.0447 626.5108 1204 2.117 0.159 2.677 0.209 0.791 0.0454 928.7505 1203 2.869 0.168 2.238 0.265 1.282 0.0473 894.781 1204 3.884 0.196 4.542 0.228 0.855 0.048 866.7533 1204 3.905 0.219 4.667 0.292 0.837 0.0492 278.2255 1204 4.693 0.070 5.006 0.156 0.937 0.0494 865.7486 1204 4.644 0.223 5.419 0.296 0.857 0.0497 -
Table 12: Accurate mass features differing between patients showing the best discrimination between high MMSE score and low MMSE score (p<0.05, log2 transformed). Detected Mass Analysis Mode AVG (log2) low MMSE SEM low MMSE AVG (log2) high MMSE SEM high MMSE log(2) Ratio P Value 505.3229 1202 3.585 0.045 4.514 0.053 0.794 3.90E-15 857.6186 1202 3.339 0.058 4.298 0.053 0.777 5.05E-14 803.5678 1202 6.747 0.056 7.962 0.082 0.847 5.19E-14 858.6211 1202 2.300 0.058 3.221 0.059 0.714 6.73E-13 566.3434 1202 4.856 0.055 5.682 0.055 0.855 1.90E-12 801.555 1202 2.220 0.057 3.128 0.064 0.710 2.89E-12 832.6036 1202 4.692 0.057 5.569 0.061 0.842 3.64E-12 804.5718 1202 5.516 0.047 6.475 0.080 0.852 4.63E-12 565.3393 1202 6.629 0.054 7.462 0.062 0.888 9.30E-12 506.3214 1202 2.237 0.051 2.908 0.044 0.769 1.26E-11 743.5467 1202 2.635 0.077 3.621 0.066 0.728 2.57E-11 831.6 1202 5.793 0.055 6.774 0.087 0.855 4.69E-11 744.55 1202 1.608 0.082 2.504 0.056 0.642 1.72E-10 570.3724 1202 2.702 0.042 3.289 0.052 0.821 4.09E-10 829.5859 1202 5.572 0.065 6.476 0.085 0.860 8.42E-10 830.5894 1202 4.477 0.061 5.311 0.078 0.843 1.01E-09 509.3494 1202 2.113 0.042 2.685 0.059 0.787 4.17E-09 542.3461 1202 3.562 0.047 4.292 0.082 0.830 6.29E-09 711.2577 1202 1.891 0.072 2.585 0.057 0.731 1.12E-08 709.2595 1202 1.864 0.079 2.546 0.047 0.732 1.49E-08 481.3172 1202 3.642 0.055 4.233 0.060 0.860 2.74E-08 569.369 1202 4.664 0.046 5.203 0.063 0.897 7.82E-08 805.5839 1202 5.216 0.051 5.867 0.082 0.889 1.16E-07 806.5873 1202 4.024 0.052 4.658 0.078 0.864 1.16E-07 856.6061 1202 4.179 0.069 5.099 0.121 0.819 1.81E-07 743.5469 1204 5.166 0.051 5.635 0.049 0.917 1.96E-07 793.5386 1102 2.966 0.065 3.468 0.043 0.855 2.63E-07 855.6023 1202 5.166 0.065 6.090 0.128 0.848 2.81 E-07 482.3215 1202 1.742 0.057 2.291 0.066 0.761 4.15E-07 541.3433 1202 5.318 0.067 6.197 0.123 0.858 4.56E-07 744.5535 1204 4.203 0.048 4.631 0.048 0.908 4.68E-07 807.5899 1202 2.124 0.071 2.730 0.070 0.778 8.81 E-07 827.5701 1202 5.937 0.077 6.931 0.147 0.857 1.20E-06 847.5954 1202 2.030 0.095 2.867 0.104 0.708 1.37E-06 828.5742 1202 4.908 0.074 5.818 0.137 0.844 1.67E-06 787.5464 1204 2.601 0.059 3.069 0.056 0.847 2.17E-06 591.3542 1202 3.749 0.081 4.387 0.078 0.855 3.05E-06 794.5422 1102 1.910 0.065 2.338 0.040 0.817 3.76E-06 804.5713 1102 3.619 0.065 4.092 0.056 0.885 4.94E-06 803.568 1102 4.829 0.068 5.317 0.057 0.908 5.22E-06 758.5094 1201 4.437 0.052 4.813 0.046 0.922 5.89E-06 592.3571 1202 2.013 0.084 2.634 0.079 0.764 7.14E-06 760.5216 1204 3.930 0.056 4.313 0.045 0.911 8.02E-06 759.5165 1204 4.558 0.067 5.001 0.050 0.911 9.01E-06 767.5469 1202 2.700 0.119 3.526 0.101 0.766 9.49E-06 786.5416 1204 3.664 0.051 4.093 0.064 0.895 1.12E-05 784.5239 1204 3.102 0.069 3.575 0.060 0.868 1.23E-05 821.5711 1102 2.415 0.067 2.863 0.055 0.843 1.25E-05 819.5641 1202 2.451 0.109 3.287 0.126 0.746 2.03E-05 777.5531 1202 1.473 0.133 2.257 0.083 0.653 2.21E-05 853.5862 1202 4.524 0.069 5.222 0.126 0.866 3.29E-05 507.3316 1202 2.653 0.056 3.061 0.064 0.867 3.70E-05 731.4917 1204 5.356 0.062 5.744 0.053 0.932 4.18E-05 831.5998 1102 3.958 0.081 4.429 0.057 0.894 4.26E-05 854.5902 1202 3.521 0.075 4.231 0.130 0.832 4.70E-05 630.5586 1203 2.845 0.054 3.242 0.069 0.877 0.0001 732.494 1204 4.127 0.062 4.492 0.050 0.919 0.0001 741.5307 1204 2.661 0.099 3.337 0.105 0.797 0.0001 771.5815 1204 4.036 0.064 4.423 0.055 0.913 0.0001 819.5552 1102 1.733 0.081 2.149 0.045 0.806 0.0001 832.6027 1102 2.864 0.081 3.318 0.056 0.863 0.0001 871.5527 1102 2.467 0.073 2.914 0.066 0.846 0.0001 871.5935 1202 1.550 0.108 2.224 0.110 0.697 0.0001 886.7917 1203 3.826 0.095 4.459 0.099 0.858 0.0001 910.7968 1203 3.257 0.083 3.757 0.079 0.867 0.0001 529.3166 1202 2.771 0.071 3.332 0.112 0.832 0.0002 589.3404 1202 5.578 0.072 6.318 0.155 0.883 0.0002 768.5503 1202 1.668 0.144 2.412 0.103 0.691 0.0002 884.7801 1203 6.076 0.082 6.639 0.104 0.915 0.0002 568.3574 1202 3.760 0.055 4.144 0.074 0.907 0.0003 685.2601 1202 1.483 0.102 2.052 0.093 0.723 0.0003 765.5313 1202 1.447 0.148 2.219 0.120 0.652 0.0003 772.5863 1204 3.177 0.051 3.466 0.050 0.917 0.0003 829.5856 1102 3.407 0.088 3.862 0.064 0.882 0.0003 911.8032 1203 2.388 0.077 2.794 0.064 0.855 0.0003 786.5967 1101 4.302 0.096 4.955 0.132 0.868 0.0004 885.7854 1203 5.116 0.080 5.615 0.095 0.911 0.0004 174.1409 1203 1.904 0.122 2.872 0.212 0.663 0.0005 590.3431 1202 3.790 0.071 4.415 0.142 0.858 0.0005 604.5432 1203 6.172 0.114 6.803 0.113 0.907 0.0005 757.5626 1101 6.170 0.099 6.804 0.129 0.907 0.0005 879.5999 1202 2.601 0.104 3.235 0.124 0.804 0.0005 605.5456 1203 4.762 0.115 5.393 0.118 0.883 0.0006 757.5016 1204 3.549 0.094 3.977 0.057 0.893 0.0006 581.3345 1202 1.572 0.124 2.253 0.131 0.698 0.0007 628.5421 1203 3.231 0.070 3.606 0.070 0.896 0.0007 723.5195 1202 2.196 0.085 2.730 0.110 0.805 0.0007 749.5365 1202 3.146 0.084 3.579 0.078 0.879 0.0007 785.5933 1101 5.382 0.098 6.025 0.137 0.893 0.0007 887.7999 1203 2.493 0.171 3.227 0.087 0.773 0.0007 886.8012 1204 3.209 0.117 3.782 0.096 0.849 0.0008 186.1408 1203 1.539 0.100 2.279 0.172 0.675 0.0009 200.1564 1203 2.724 0.075 3.280 0.129 0.830 0.0009 769.5655 1204 3.833 0.075 4.197 0.063 0.913 0.0009 817.5838 1202 2.041 0.086 2.452 0.070 0.833 0.0009 715.5169 1204 2.238 0.200 3.073 0.108 0.728 0.001 699.52 1204 2.223 0.082 2.690 0.099 0.826 0.0011 758.5656 1101 5.231 0.101 5.844 0.134 0.895 0.0011 795.5182 1101 2.324 0.087 2.800 0.098 0.830 0.0011 772.528 1204 3.202 0.075 3.531 0.053 0.907 0.0012 739.5164 1202 1.109 0.170 1.859 0.124 0.597 0.0014 779.5444 1101 6.186 0.098 6.639 0.083 0.932 0.0014 244.2187 1203 2.645 0.062 3.037 0.093 0.871 0.0015 508.3356 1202 0.969 0.088 1.386 0.078 0.700 0.0015 811.6096 1101 2.569 0.101 3.204 0.152 0.802 0.0017 882.766 1203 7.238 0.092 7.755 0.117 0.933 0.0017 744.4954 1204 3.832 0.067 4.118 0.049 0.930 0.0018 884.7877 1204 4.658 0.101 5.127 0.092 0.909 0.0018 262.2293 1203 2.639 0.059 2.992 0.084 0.882 0.002 784.5811 1101 3.896 0.100 4.493 0.143 0.867 0.002 817.5375 1102 1.715 0.076 2.148 0.101 0.798 0.002 723.5197 1204 3.643 0.087 4.211 0.143 0.865 0.0021 810.5401 1204 2.693 0.070 3.119 0.104 0.863 0.0021 880.6035 1202 1.837 0.084 2.351 0.126 0.782 0.0021 807.5757 1101 5.434 0.097 5.912 0.102 0.919 0.0022 883.7705 1203 6.396 0.085 6.870 0.111 0.931 0.0022 749.576 1102 2.516 0.057 2.174 0.084 1.157 0.0023 852.5738 1202 3.365 0.120 3.968 0.135 0.848 0.0025 752.5564 1202 2.277 0.101 2.730 0.092 0.834 0.0027 783.5672 1101 3.273 0.106 3.856 0.141 0.849 0.0027 808.5792 1101 4.393 0.099 4.868 0.104 0.902 0.0027 755.5468 1101 1.885 0.107 2.412 0.121 0.782 0.0031 780.5475 1101 5.202 0.096 5.629 0.089 0.924 0.0031 826.707 1204 2.266 0.118 2.743 0.086 0.826 0.0031 851.5698 1202 4.297 0.118 4.898 0.142 0.877 0.0031 631.5619 1203 1.475 0.132 1.956 0.066 0.754 0.0033 755.4861 1204 3.019 0.074 3.424 0.102 0.882 0.0034 188.1566 1203 2.272 0.134 2.926 0.154 0.777 0.0035 883.7765 1204 4.148 0.099 4.589 0.095 0.904 0.0035 726.5459 1204 2.790 0.064 3.090 0.069 0.903 0.0038 750.5403 1202 2.185 0.089 2.549 0.073 0.857 0.0038 627.5302 1203 2.497 0.080 2.845 0.075 0.878 0.0039 885.7922 1204 3.954 0.103 4.382 0.089 0.902 0.0039 675.6357 1203 1.815 0.210 0.815 0.240 2.228 0.0042 751.5529 1202 3.374 0.098 3.787 0.090 0.891 0.0043 882.7723 1204 4.984 0.102 5.422 0.096 0.919 0.0043 530.3213 1202 1.209 0.089 1.698 0.129 0.712 0.0044 380.3096 1204 1.432 0.107 1.867 0.092 0.767 0.0046 783.5148 1204 3.121 0.064 3.517 0.111 0.887 0.0048 202.172 1203 3.048 0.112 3.631 0.153 0.839 0.0049 748.5721 1102 3.632 0.058 3.325 0.082 1.092 0.0049 603.5317 1203 7.585 0.077 7.883 0.060 0.962 0.005 243.0718 1101 4.430 0.144 3.210 0.373 1.380 0.0052 582.2473 1201 3.377 0.132 2.673 0.191 1.264 0.0055 739.5141 1204 2.498 0.195 3.173 0.109 0.787 0.0056 879.7454 1204 3.291 0.124 3.749 0.088 0.878 0.0057 494.4342 1203 1.382 0.353 2.777 0.303 0.497 0.0059 782.5086 1204 3.266 0.073 3.662 0.110 0.892 0.0059 855.6016 1102 2.984 0.080 3.363 0.097 0.887 0.006 921.8153 1204 2.175 0.312 3.187 0.131 0.682 0.006 724.5256 1204 2.877 0.077 3.324 0.128 0.866 0.0061 183.0661 1101 2.155 0.151 2.748 0.130 0.784 0.0065 522.4634 1203 4.325 0.238 5.237 0.198 0.826 0.0067 853.7296 1204 3.607 0.109 4.012 0.083 0.899 0.0068 216.1877 1203 2.796 0.092 3.282 0.140 0.852 0.0076 779.5442 1201 7.005 0.079 7.301 0.065 0.959 0.0076 777.5288 1201 2.657 0.093 3.009 0.079 0.883 0.0077 523.468 1203 2.895 0.227 3.731 0.183 0.776 0.0083 569.3687 1102 1.734 0.098 2.075 0.067 0.836 0.0085 775.5535 1202 2.112 0.083 2.438 0.079 0.866 0.0087 632.5035 1204 4.858 0.122 5.325 0.110 0.912 0.0088 805.5604 1101 5.112 0.099 5.504 0.097 0.929 0.0089 313.269 1203 1.592 0.175 2.180 0.112 0.730 0.009 743.5464 1203 1.703 0.150 2.156 0.056 0.790 0.009 768.5539 1204 3.881 0.077 4.240 0.100 0.915 0.009 686.488 1204 2.671 0.054 2.872 0.047 0.930 0.0092 886.5582 1102 2.503 0.058 2.781 0.079 0.900 0.0092 602.5282 1203 8.833 0.081 9.116 0.059 0.969 0.0093 558.4667 1202 1.932 0.201 2.652 0.159 0.728 0.0095 809.5936 1101 4.523 0.112 5.054 0.155 0.895 0.0101 881.7616 1204 4.015 0.111 4.427 0.099 0.907 0.0101 833.7558 1204 1.919 0.311 2.863 0.138 0.670 0.0103 864.7596 1203 2.184 0.067 2.468 0.078 0.885 0.0103 613.3405 1202 3.422 0.124 3.963 0.150 0.863 0.0104 626.5277 1203 3.649 0.073 3.946 0.079 0.925 0.0105 629.5449 1203 2.015 0.088 2.370 0.093 0.850 0.0106 767.5494 1204 4.975 0.083 5.343 0.104 0.931 0.0106 517.3722 1204 2.176 0.149 1.408 0.235 1.545 0.0107 773.5347 1204 3.151 0.056 3.426 0.082 0.920 0.0108 806.5638 1101 4.113 0.100 4.498 0.097 0.914 0.0109 204.1876 1203 2.205 0.099 2.682 0.143 0.822 0.0113 837.5027 1101 3.439 0.075 3.734 0.078 0.921 0.0116 595.4932 1202 1.393 0.217 2.170 0.185 0.642 0.0117 915.5192 1101 2.301 0.087 2.588 0.060 0.889 0.0117 257.8105 1101 3.636 0.084 2.677 0.344 1.358 0.0121 541.343 1102 2.816 0.087 3.105 0.062 0.907 0.0121 745.5656 1204 3.838 0.051 4.054 0.062 0.947 0.0125 749.5408 1204 4.465 0.071 4.865 0.130 0.918 0.0126 725.5385 1204 2.932 0.068 3.293 0.115 0.890 0.0128 757.4993 1101 3.262 0.095 3.716 0.140 0.878 0.0128 852.725 1204 3.774 0.105 4.122 0.076 0.916 0.0128 780.5474 1201 5.941 0.081 6.223 0.067 0.955 0.0129 880.7516 1203 7.205 0.107 7.651 0.127 0.942 0.0129 881.7558 1203 6.471 0.103 6.883 0.116 0.940 0.0132 338.2821 1203 4.474 0.095 4.792 0.073 0.934 0.0135 827.5699 1102 3.597 0.089 3.987 0.116 0.902 0.0136 880.7566 1204 4.483 0.117 4.882 0.094 0.918 0.0138 572.4468 1204 1.726 0.131 2.213 0.129 0.780 0.014 336.2662 1203 3.181 0.097 3.518 0.083 0.904 0.0141 615.3539 1202 2.263 0.089 2.598 0.092 0.871 0.0146 544.4479 1203 1.928 0.085 2.273 0.100 0.848 0.0148 579.5325 1203 3.737 0.170 4.362 0.166 0.857 0.0148 520.45 1203 3.613 0.209 4.378 0.204 0.825 0.0149 633.5078 1204 3.891 0.128 4.347 0.118 0.895 0.0149 519.3321 1101 3.416 0.099 3.875 0.146 0.881 0.0151 547.6031 1101 2.454 0.114 1.714 0.259 1.432 0.0152 727.5569 1204 3.548 0.077 3.866 0.093 0.918 0.0152 339.285 1203 2.242 0.107 2.601 0.087 0.862 0.0154 746.5719 1204 3.004 0.054 3.196 0.050 0.940 0.0154 828.5736 1102 2.605 0.083 2.966 0.111 0.878 0.0154 798.6742 1203 1.685 0.154 2.329 0.192 0.723 0.0155 860.7753 1203 4.054 0.129 4.507 0.117 0.899 0.0156 521.4522 1203 1.837 0.271 2.786 0.244 0.660 0.0158 594.4878 1202 2.699 0.253 3.523 0.191 0.766 0.0158 781.5617 1101 5.737 0.110 6.187 0.134 0.927 0.0158 810.5969 1101 3.498 0.121 4.023 0.161 0.870 0.0158 631.4902 1204 2.690 0.150 3.208 0.132 0.839 0.0163 518.4346 1203 1.198 0.238 2.121 0.267 0.565 0.0164 244.0559 1101 3.875 0.099 3.359 0.174 1.153 0.0165 751.5556 1204 4.690 0.092 5.091 0.126 0.921 0.0165 825.5544 1202 2.647 0.146 3.202 0.159 0.827 0.017 520.3353 1101 1.661 0.103 2.114 0.144 0.786 0.0176 858.7632 1203 6.769 0.125 7.244 0.137 0.935 0.0178 861.7801 1203 2.123 0.171 2.681 0.138 0.792 0.0179 646.4837 1204 1.688 0.192 2.245 0.108 0.752 0.0184 489.6451 1101 2.555 0.109 1.822 0.269 1.402 0.0186 255.8135 1101 4.518 0.090 3.502 0.393 1.290 0.019 260.2135 1203 1.422 0.129 1.878 0.128 0.757 0.0193 833.5931 1101 2.952 0.114 3.347 0.109 0.882 0.0197 831.5759 1101 4.038 0.114 4.451 0.121 0.907 0.0201 544.3971 1204 3.313 0.158 2.377 0.342 1.394 0.0203 294.2207 1204 5.248 0.117 5.652 0.112 0.929 0.0205 724.5493 1101 4.674 0.050 4.395 0.101 1.063 0.0205 663.487 1204 1.733 0.223 2.369 0.128 0.731 0.0207 860.7753 1204 3.460 0.170 3.955 0.104 0.875 0.0207 246.1465 1202 3.707 0.141 4.188 0.134 0.885 0.0209 606.4869 1204 4.562 0.137 5.023 0.126 0.908 0.0215 576.5097 1203 9.304 0.133 9.756 0.127 0.954 0.0216 311.775 1101 2.594 0.152 1.849 0.264 1.403 0.022 566.413 1204 2.026 0.190 2.553 0.100 0.794 0.0221 577.5136 1203 7.959 0.125 8.392 0.124 0.948 0.0224 835.7001 1204 2.246 0.249 3.007 0.187 0.747 0.0226 665.501 1204 2.974 0.116 3.370 0.114 0.883 0.0227 675.6377 1204 3.825 0.077 4.086 0.075 0.936 0.023 600.5127 1203 8.597 0.082 8.866 0.075 0.970 0.0232 752.5583 1204 3.555 0.096 3.939 0.126 0.902 0.0241 161.1053 1101 4.011 0.148 2.977 0.402 1.347 0.0242 616.4673 1201 1.329 0.218 2.031 0.193 0.654 0.0245 253.8163 1101 4.184 0.090 3.283 0.364 1.274 0.0248 878.74 1204 3.665 0.118 4.001 0.074 0.916 0.025 580.535 1203 1.221 0.219 1.936 0.203 0.631 0.0252 859.7694 1203 5.668 0.122 6.076 0.119 0.933 0.0252 538.4224 1202 1.087 0.172 1.689 0.184 0.643 0.0256 804.723 1203 1.425 0.264 2.238 0.214 0.637 0.0256 833.7571 1203 2.599 0.192 3.201 0.165 0.812 0.0261 530.382 1204 2.988 0.204 2.114 0.305 1.413 0.0262 908.7832 1203 5.011 0.090 5.309 0.088 0.944 0.027 653.5361 1204 3.973 0.129 4.367 0.107 0.910 0.0273 559.47 1202 0.812 0.174 1.388 0.171 0.585 0.0274 748.5735 1202 3.935 0.071 3.726 0.054 1.056 0.0279 803.5445 1101 4.899 0.121 5.305 0.124 0.924 0.028 832.7521 1203 3.434 0.205 4.059 0.169 0.846 0.0283 320.2357 1204 1.225 0.148 1.609 0.071 0.761 0.0284 728.5626 1204 2.941 0.066 3.161 0.067 0.930 0.0284 795.555 1102 2.053 0.080 2.292 0.062 0.896 0.0285 838.7232 1204 2.011 0.253 2.753 0.191 0.730 0.0285 782.565 1101 4.709 0.114 5.143 0.147 0.916 0.0286 750.544 1204 3.351 0.066 3.678 0.124 0.911 0.0287 783.4315 1101 2.505 0.125 1.807 0.271 1.386 0.029 214.172 1203 3.549 0.090 3.910 0.126 0.908 0.0292 312.2663 1203 3.879 0.140 4.315 0.126 0.899 0.03 857.7531 1203 7.332 0.109 7.738 0.138 0.947 0.03 202.0453 1101 5.911 0.122 5.238 0.266 1.128 0.0305 763.5157 1202 1.570 0.175 2.098 0.147 0.748 0.0306 218.0192 1101 4.023 0.134 3.143 0.357 1.280 0.0307 856.7481 1203 8.173 0.118 8.608 0.151 0.949 0.032 795.5839 1204 3.545 0.061 3.800 0.093 0.933 0.0321 565.4104 1204 3.353 0.123 3.754 0.127 0.893 0.0332 313.7722 1101 3.080 0.178 2.250 0.319 1.369 0.0334 909.7882 1203 4.177 0.092 4.456 0.081 0.938 0.0337 429.6888 1101 2.475 0.093 1.833 0.268 1.351 0.0341 431.957 1202 1.847 0.154 2.312 0.136 0.799 0.0341 607.4919 1204 2.906 0.259 3.579 0.147 0.812 0.0341 294.1443 1201 2.449 0.210 1.795 0.201 1.364 0.0348 598.4965 1203 6.590 0.104 6.923 0.106 0.952 0.035 549.6005 1101 2.027 0.167 1.424 0.212 1.424 0.0351 283.9028 1101 3.018 0.076 2.397 0.267 1.259 0.0353 820.5679 1202 1.438 0.153 2.061 0.231 0.698 0.0353 574.4597 1204 3.354 0.210 3.994 0.196 0.840 0.0359 826.7048 1203 4.509 0.145 4.950 0.134 0.911 0.0361 805.5832 1102 3.502 0.085 3.742 0.066 0.936 0.0364 550.4956 1203 6.603 0.188 7.165 0.167 0.922 0.0365 630.4861 1204 3.807 0.132 4.238 0.142 0.898 0.0369 551.4985 1203 5.182 0.182 5.733 0.167 0.904 0.0371 549.4845 1203 5.363 0.140 5.765 0.115 0.930 0.0372 827.7083 1203 3.751 0.145 4.174 0.124 0.899 0.0374 306.2569 1204 2.821 0.075 3.051 0.072 0.925 0.0375 775.553 1204 3.272 0.071 3.577 0.119 0.915 0.0377 242.203 1203 4.260 0.087 4.573 0.113 0.932 0.0382 828.7202 1204 3.465 0.158 3.906 0.122 0.887 0.0385 232.2188 1203 3.156 0.098 3.499 0.122 0.902 0.0387 722.4789 1201 1.873 0.084 2.132 0.082 0.879 0.0389 530.3471 1202 2.566 0.117 2.910 0.103 0.882 0.0393 264.2452 1203 1.753 0.138 2.114 0.090 0.829 0.0397 858.7663 1204 5.791 0.140 6.169 0.100 0.939 0.0401 759.5779 1101 5.093 0.108 5.471 0.136 0.931 0.0404 559.469 1204 2.761 0.191 3.288 0.149 0.840 0.0406 593.4743 1204 2.069 0.240 2.728 0.184 0.758 0.0406 392.2938 1204 1.941 0.277 2.718 0.225 0.714 0.041 575.499 1203 7.133 0.096 7.452 0.112 0.957 0.0414 826.5581 1202 1.759 0.125 2.203 0.163 0.798 0.0417 719.6233 1204 4.578 0.094 4.279 0.102 1.070 0.0419 295.2287 1204 2.883 0.203 3.414 0.138 0.844 0.0422 555.3101 1102 1.310 0.070 1.541 0.080 0.850 0.0424 830.7355 1204 3.947 0.183 4.447 0.141 0.888 0.0427 474.3706 1203 0.868 0.128 1.234 0.112 0.704 0.0433 203.1157 1101 3.694 0.116 2.965 0.319 1.246 0.0437 295.2239 1204 3.109 0.123 3.476 0.119 0.894 0.0437 855.7417 1204 4.834 0.122 5.184 0.107 0.932 0.0438 760.5811 1101 3.973 0.109 4.349 0.138 0.913 0.0441 625.5076 1204 3.218 0.140 3.624 0.126 0.888 0.0443 270.2343 1203 1.714 0.106 2.018 0.095 0.850 0.0444 661.6233 1204 2.375 0.073 2.644 0.103 0.898 0.0445 446.3403 1202 0.751 0.166 1.275 0.181 0.589 0.0446 521.3474 1201 2.493 0.169 2.031 0.137 1.228 0.0451 837.718 1204 2.369 0.329 3.272 0.267 0.724 0.0451 228.1877 1203 2.954 0.108 3.313 0.131 0.892 0.0458 832.7495 1204 2.994 0.226 3.588 0.164 0.834 0.0458 576.477 1202 1.734 0.213 2.337 0.187 0.742 0.0459 1085.3294 1101 3.756 0.022 3.463 0.136 1.085 0.0467 444.2717 1202 1.195 0.096 1.496 0.105 0.799 0.0473 545.6062 1101 1.955 0.134 1.427 0.213 1.370 0.0477 651.5221 1204 3.677 0.131 4.039 0.111 0.910 0.0482 829.7244 1203 4.651 0.135 5.044 0.130 0.922 0.0482 859.7706 1204 4.962 0.145 5.331 0.100 0.931 0.0482 575.4632 1204 2.109 0.207 2.692 0.185 0.783 0.0485 804.5476 1101 3.984 0.119 4.353 0.130 0.915 0.0485 725.5527 1101 3.407 0.058 3.160 0.102 1.078 0.0486 350.2423 1202 2.544 0.227 1.901 0.207 1.338 0.0489 382.1083 1101 2.600 0.210 1.858 0.286 1.399 0.049 836.7076 1204 1.427 0.242 2.163 0.256 0.660 0.0493 671.5726 1204 2.055 0.138 2.458 0.136 0.836 0.0495 197.8549 1101 3.431 0.102 2.697 0.337 1.272 0.0499 773.537 1202 1.569 0.078 1.805 0.082 0.869 0.0499 -
Table 13: Accurate mass features differing between clinically diagnosed AD and non-AD patients in CSF (p<0.05, log2 transformed). Detected Mass Analysis Mode AVG (log2) AD SEM AD AVG (log2) non-AD SEM non-AD log(2) Ratio P Value 742.2972 1203 1.187 0.130 0.000 0.000 1.187 1.69E-05 562.46 1203 1.080 0.134 0.000 0.000 1.080 4.84E-05 731.653 1203 0.905 0.193 0.000 0.000 0.905 0.0022 432.1532 1203 1.445 0.125 0.880 0.053 0.609 0.0037 487.6482 1101 2.388 0.044 2.668 0.057 1.117 0.0037 275.8712 1101 2.362 0.057 2.664 0.058 1.128 0.0045 371.7311 1101 3.417 0.098 3.818 0.022 1.117 0.0053 622.2539 1203 2.667 0.110 2.166 0.074 0.812 0.0056 485.6503 1101 1.758 0.051 1.976 0.024 1.124 0.0058 207.0822 1203 1.010 0.126 0.198 0.198 0.196 0.006 640.2637 1203 3.557 0.152 2.876 0.106 0.809 0.0063 373.728 1101 3.013 0.086 3.358 0.037 1.114 0.0071 656.2587 1203 0.977 0.080 0.322 0.199 0.330 0.0097 730.6493 1203 1.888 0.139 0.948 0.278 0.502 0.0109 220.0798 1101 2.252 0.078 2.556 0.044 1.135 0.011 641.2661 1203 1.915 0.148 1.010 0.282 0.527 0.0152 779.4393 1101 3.612 0.032 3.728 0.022 1.032 0.0167 782.5647 1201 1.898 0.208 1.128 0.142 0.594 0.0172 313.7721 1101 4.045 0.096 4.350 0.031 1.075 0.0215 785.4288 1101 3.273 0.039 3.410 0.033 1.042 0.0253 777.4426 1101 2.495 0.017 2.614 0.044 1.048 0.0279 341.8614 1101 2.747 0.069 2.990 0.061 1.089 0.0305 250.0366 1101 3.122 0.115 3.462 0.049 1.109 0.0309 315.7693 1101 3.347 0.090 3.618 0.044 1.081 0.0311 253.8164 1101 4.237 0.108 4.542 0.030 1.072 0.033 369.7338 1101 2.713 0.148 3.132 0.035 1.154 0.034 781.5607 1201 2.728 0.234 2.048 0.095 0.751 0.0345 206.0789 1203 4.178 0.147 3.484 0.253 0.834 0.0357 429.689 1101 3.232 0.042 3.392 0.051 1.050 0.0358 638.2465 1203 1.927 0.188 1.372 0.095 0.712 0.0362 578.1574 1101 1.828 0.042 1.674 0.046 0.916 0.0368 262.0777 1101 4.738 0.114 5.072 0.052 1.070 0.0371 265.8423 1101 3.682 0.101 3.960 0.028 1.076 0.0395 582.6334 1101 1.702 0.051 1.526 0.052 0.897 0.0395 255.8135 1101 4.678 0.113 4.978 0.029 1.064 0.0418 321.8039 1101 3.190 0.098 3.480 0.062 1.091 0.0423 514.6879 1101 2.650 0.037 2.534 0.032 0.956 0.0424 262.0221 1101 3.633 0.126 3.964 0.026 1.091 0.0435 746.621 1101 1.015 0.225 0.306 0.190 0.301 0.0438 781.4354 1101 4.163 0.028 4.254 0.025 1.022 0.045 311.775 1101 3.457 0.111 3.764 0.053 1.089 0.0461 257.8105 1101 3.753 0.115 4.056 0.036 1.081 0.0472 -
Table 14. Retention Time of Six Biomarkers FT Accurate Neutral Mass Formula Theoretical Neutral Mass Q-Star Mass (M-II) ion Retention Time (min) 541.3432 C25H52NO9P 541.3379 540.3616 29.4 569.3687 C27H56NO9P 569.3692 568.3979 31.0 699.5198 C39H74NO7P 699.5202 698.5392 40.5 723.5195 C41H74NO7P 723.5202 722.5331 40.2 751.5555 C43H78NO7P 751.5515 750.5667 41.9 803.568 C43H82NO10P 803.5676 802.5575 38.6 -
Table 15. Metabolite 541.3432 Fragments Frag Formula Theoretical Q-Star Detected Delta Diff Loss C25H51NO9P 540.33014 540.3616 0.0315 - - C23H47NO7P 480.30901 480.3313 0.0223 60.02112 C2H4O2 C16H31O2 255.23240 255.2521 0.0197 292.15251 C9H27NO7P C7H15NO5P 224.06878 224.0904 0.0216 300.26644 C18H36O3 O3P 78.95850 78.975 0.0165 461.37163 C25H51NO6 Legend:
frag formula: The putative computationally derived molecular formula of the fragment neutral mass.
theoretical: The theoretical mass of the formulas shown in the frag formula column.
Qstar-detected: The detected mass from the ABI Q-Star XL.
delta: The difference between the theoretical and neutral mass.
diff: The mass difference between the Qstar-detected parent ion mass and the Qstar-detected fragmant ion mass.
Loss: The putative molecular formulas of the "diff" column
Note: These are only predicted formulas for each fragment and are not necessarily the actual formulas. -
Table 16. Metabolite 569.3687 Fragments Frag Formula Theoretical Q-Star Detected Delta Diff Loss C27H55NO9P 568.3614 568.3979 0.0365 - - C25H51NO7P 508.34031 508.3612 0.0209 60.02112 C2H4O2 C18H35O2 283.26370 283.2900 0.0263 285.09773 C9H20NO7P C7H15NO5P 224.06878 224.0899 0.0211 344.23266 C20H40O4 C4H11NO4P 168.04256 168.0668 0.0242 400.31887 C23H44O5 C3H6PO5 152.99528 153.0196 0.0243 446.33992 C24H49NO4P O3P 78.95850 78.975 0.0165 489.40293 C27H55NO6 Legend:
frag formula: The putative computationally derived molecular formula of the fragment neutral mass
theoretical: The theoretical mass of the formulas shown in the frag formula column.
Qstar-detected: The detected mass from the ABI Q-Star XL.
delta: The difference between the theoretical and neutral mass.
diff: The mass difference between the Qstar-detected parent ion mass and the Qstar-detected fragmant ion mass.
Loss: The putative molecular formulas of the "diff" column
Note: These are only predicted formulas for each fragment and are not necessarily the actual formulas. -
Table 17. Metabolite 803.568 Fragments Frag Formula Theoretical Q-Star Detected Delta Diff Loss C43H81NO10P 802.55980 802.5575 -0.0023 - - C41H77NO8P 742.53868 742.5526 0.0139 76.01604 C2H4O3 C23H47NO7P 480.30901 480.3248 0.0158 322.25079 C20H34O3 C18H32O2 279.23240 279.2485 0.0161 522.31957 C25H49NO8P C16H31O2 255.23240 255.2469 0.0145 547.32740 C27H50NO8P C7H15NO5P 224.06878 224.0853 0.0165 578.49102 C36H66O5 C4H11NO4P 168.04256 168.0629 0.0203 634.51724 C39H70O6 Legend:
frag formula: The putative computationally derived molecular formula of the fragment neutral mass.
theoretical: The theoretical mass of the formulas shown in the frag formula column.
Qstar-detected: The detected mass from the ABI Q-Star XL.
delta: The difference between the theoretical and neutral mass.
diff: The mass difference between the Qstar-detected parent ion mass and the Qstar-detected fragmant ion mass.
Loss: The putative molecular formulas of the "diff" column
Note: These are only predicted formulas for each fragment and are not necessarily the actual formulas. -
Table 18. List of Preferred List of Metabolites Metabolite Code Metabolite Name Molecular Formula Parent Mass M-H Mass Diagnostic Fragment Mass MS/MS Transition M01 PtdEt 16:0/18:0 C39H78N1O8P1 719.54648 718.5 R1 (C16H31O2) - 255 718.0 / 255.0 M02 PtdEt 16:0/18:1 C39H76N1O8P1 717.53083 716.5 R1 (C16H31O2) - 255 716.0 / 255.0 M03 PtdEt 18:0/18:0 C41H82N1O8P1 747.57777 746.5 R1 (C18H35O2) - 283 746.0 / 283.0 M04 PtdEt 18:0/18:1 C41H80N1O8P1 745.56213 744.5 R1 (C18H35O2) - 283 744.0 / 283.0 M05 Plasmanyl 16:0/18:1 C39H78N1O7P1 703.55156 702.5 R2 (C18H33O2) - 281 702.0 / 281.0 M06 Plasmanyl 16:0/18:2 C39H76N1O7P1 701.53591 700.5 R2 (C18H31O2) - 279 700.0 / 279.0 M07 Plasmanyl 16:0/20:4 C41H76N1O7P1 725.53591 724.5 R2 (C20H31O2) - 303 724.0 / 303.0 M08 Plasmanyl 16:0/22:4 C43H80N1O7P1 753.56721 752.5 R2 (C22H35O2) - 331 752.0 / 331.0 M09 Plasmanyl 16:0/22:6 C43H76N1O7P1 749.53591 748.5 R2 (C22H31O2) - 327 748.0 / 327.0 M10 Plasmanyl 18:0/18:1 C41H82N1O7P1 731.58286 730.5 R2 (C18H33O2) - 281 730.0 / 281.0 M11 Plasmanyl 18:0/18:2 C41H80N1O7P1 729.56721 728.5 R2 (C18H31O2) - 279 728.0 / 279.0 M12 Plasmanyl 18:0/20:4 C43H80N1O7P1 753.56721 752.5 R2 (C20H31O2) - 303 752.0 / 303.0 M13 Plasmanyl 18:0/22:4 C45H84N1O7P1 781.59851 780.5 R2 (C22H35O2) - 331 780.0 / 331.0 M14 Plasmanyl 18:0/22:6 C45H80N1O7P1 777.56721 776.5 R2 (C22H31O2) - 327 776.0 / 327.0 M15 Plasmenyl 16:0/18:1 C39H76N1O7P1 701.53591 700.5 R2 (C18H33O2) - 281 700.0 / 281.0 M16 Plasmenyl 16:0/18:2 C39H74N1O7P1 699.52026 698.5 R2 (C18H31O2) - 279 698.0 / 279.0 M17 Plasmenyl 16:0/20:4 C41H74N1O7P1 723.52026 722.5 R2 (C20H31O2) - 303 722.0 / 303.0 M18 Plasmenyl 16:0/22:4 C43H78N1O7P1 751.55156 750.5 R2 (C22H35O2) - 331 750.0 / 331.0 M19 Plasmenyl 16:0/22:6 C43H74N1O7P1 747.52026 746.5 R2 (C22H31O2) - 327 746.0 / 327.0 M20 Plasmenyl 18:0/18:1 C41H80N1O7P1 729.56721 728.5 R2 (C18H33O2) - 281 728.0 / 281.0 M21 Plasmenyl 18:0/18:2 C41H78N1O7P1 727.55156 726.5 R2 (C18H31O2) - 279 726.0 / 279.0 M22 Plasmenyl 18:0/20:4 C43H78N1O7P1 751.55156 750.5 R2 (C20H31O2) - 303 750.6 / 303.2 M23 Plasmenyl 18:0/22:4 C45H82N1O7P1 779.58286 778.5 R2 (C22H35O2)- 331 778.0 / 331.0 M24 Plasmenyl 18:0/22:6 C45H78N1O7P1 775.55156 774.5 R2 (C22H31O2) - 327 774.0 / 327.0 M25 Free 22:6 C22H32O2 328.24022 327.2 (C21H31) - 283 327.2 / 283.0 M26 Free 20:4 C20H32O2 304.24022 303.2 (C19H31) - 259 303.2 / 259.5 -
Table 19. Clinical Data on Subject Cohorts Population n Age MMSE ADAS-cog Mean SEM Mean SEM Mean SEM Age Ctl, 30-39, Female 14 36.4 0.9 Age Ctl, 30-39, Male 11 35.2 1.0 Age Ctl, 40-49, Female 44 44.8 0.5 Age Ctl, 40-49, Male 27 44.7 0.6 Age Ctl, 50-59, Female 107 54.2 0.3 Age Ctl, 50-59, Male 59 54.1 0.4 Age Ctl, 60-69, Female 55 63.4 0.3 Age Ctl, 60-69, Male 34 64.4 0.5 Age Ctl, 70+ _Female 27 79.7 1.2 Age Ctl, 70+ _Male 35 75.5 0.7 Cognitive Normal, Female 36 77.6 1.1 29.6 0.1 Cognitive Normal, Male 32 76.8 1.1 29.3 0.1 SDAT_all, Female 140 80.0 0.6 12.6 0.7 34.2 1.6 SDAT_all, Male 117 79.8 0.7 15.3 0.5 27.4 1.3 SDAT, ADAS 5-19, Female 38 79.6 1.2 17.6 0.7 15.2 0.6 SDAT, ADAS 20-39, Female 54 78.6 1.0 16.6 0.7 27.0 0.8 SDAT, ADAS 40-70, Female 48 81.9 1.1 4.2 0.7 57.3 1.5 SDAT, ADAS 5-19, Male 40 79.0 1.1 17.3 0.7 15.3 0.5 SDAT, ADAS 20-39, Male 58 79.6 0.9 16.8 0.6 27.5 0.7 SDAT, ADAS 40-70, Male 18 82.6 2.1 6.2 1.1 53.2 2.2 Post Mortem SDAT Male 10 80.1 1.4 Post Mortem SDAT Female 10 77.6 1.5 Post Mortem Ctl, Female 9 84.4 1.8 Post Mortem Ctl, Male 10 77.9 1.4 -
Table 20. Effect of Age on Serum Ethanolamine Phospholipid Levels in Males Age Ctl, 30-39, Male Age Ctl, 40-49, Male Age Ctl, 50-59, Male Age Ctl, 60-69, Male Age Ctl, 70+ Male Metabolite Code Mean SEM Mean SEM Mean SEM Mean SEM Mean SEM M01 0.122 0.017 0.119 0.008 0.113 0.006 0.132 0.007 0.130 0.006 M02 0.056 0.008 0.058 0.006 0.058 0.004 0.059 0.007 0.056 0.005 M03 0.102 0.014 0.085 0.006 0.095 0.005 0.103 0.008 0.110 0.010 M04 0.026 0.004 0.027 0.003 0.025 0.002 0.027 0.003 0.027 0.003 M05 0.014 0.002 0.012 0.001 0.011 0.001 0.012 0.001 0.011 0.001 M06 0.032 0.005 0.026 0.002 0.026 0.001 0.025 0.002 0.027 0.002 M07 0.078 0.015 0.053 0.007 0.063 0.005 0.061 0.007 0.060 0.006 M08 0.010 0.002 0.007 0.001 0.007 0.001 0.007 0.001 0.006 0.001 M09 0.019 0.004 0.013 0.002 0.019 0.002 0.019 0.002 0.022 0.003 M10 0.058 0.009 0.052 0.004 0.049 0.003 0.055 0.004 0.053 0.003 M11 0.131 0.021 0.099 0.007 0.098 0.005 0.099 0.007 0.104 0.007 M12 0.244 0.037 0.186 0.015 0.210 0.012 0.213 0.017 0.202 0.016 M13 0.015 0.002 0.013 0.001 0.013 0.001 0.013 0.001 0.012 0.001 M14 0.034 0.005 0.026 0.003 0.036 0.002 0.040 0.004 0.047 0.006 M15 0.085 0.012 0.075 0.005 0.074 0.004 0.074 0.006 0.076 0.005 M16 0.291 0.043 0.220 0.016 0.244 0.013 0.223 0.018 0.246 0.018 M17 0.489 0.102 0.332 0.035 0.429 0.029 0.412 0.048 0.410 0.044 M18 0.032 0.005 0.025 0.003 0.027 0.002 0.026 0.004 0.023 0.002 M19 0.086 0.014 0.063 0.008 0.094 0.008 0.098 0.012 0.114 0.017 M20 0.086 0.013 0.070 0.006 0.068 0.004 0.069 0.006 0.071 0.006 M21 0.294 0.044 0.236 0.017 0.247 0.014 0.222 0.018 0.236 0.018 M22 1.054 0.220 0.788 0.079 0.930 0.067 0.933 0.102 0.906 0.104 M23 0.022 0.003 0.019 0.001 0.019 0.001 0.020 0.003 0.017 0.001 M24 0.077 0.014 0.063 0.008 0.086 0.007 0.088 0.010 0.103 0.016 M25 0.205 0.014 0.195 0.017 0.274 0.018 0.310 0.025 0.374 0.031 M26 0.091 0.011 0.082 0.005 0.096 0.003 0.109 0.009 0.114 0.009 -
Table 21. Ratio and T-test values between males of different ages 50-59 vs. 40-49, Male 60-69 vs. 40-49, Male 70+ vs. 40-49, Male Metabolite Code Ratio ttest Ratio ttest Ratio ttest M01 0.955 6.0E-01 1.110 2.2E-01 1.097 2.4E-01 M02 0.998 9.9E-01 1.024 8.8E-01 0.965 8.1E-01 M03 1.125 2.3E-01 1.213 9.4E-02 1.296 5.0E-02 M04 0.954 7.0E-01 1.019 9.1E-01 1.015 9.3E-01 M05 0.953 6.3E-01 1.011 9.3E-01 0.979 8.5E-01 M06 1.031 7.5E-01 0.976 8.3E-01 1.054 6.2E-01 M07 1.198 2.4E-01 1.164 4.1E-01 1.133 4.8E-01 M08 1.031 8.2E-01 1.014 9.4E-01 0.907 5.4E-01 M09 1.443 2.7E-02 1.473 4.5E-02 1.701 2.1E-02 M10 0.953 5.9E-01 1.061 5.9E-01 1.013 8.9E-01 M11 0.992 9.3E-01 1.004 9.7E-01 1.058 5.6E-01 M12 1.128 2.5E-01 1.147 2.5E-01 1.085 4.8E-01 M13 1.007 9.4E-01 1.032 8.0E-01 0.921 4.4E-01 M14 1.383 1.5E-02 1.536 7.0E-03 1.802 2.8E-03 M15 0.987 8.9E-01 0.985 8.9E-01 1.020 8.5E-01 M16 1.109 2.7E-01 1.013 9.1E-01 1.118 2.9E-01 M17 1.291 5.4E-02 1.241 2.1E-01 1.235 1.9E-01 M18 1.055 6.6E-01 1.032 8.7E-01 0.904 4.9E-01 M19 1.484 1.9E-02 1.540 2.6E-02 1.789 1.9E-02 M20 0.971 7.8E-01 0.976 8.4E-01 1.014 9.0E-01 M21 1.048 6.3E-01 0.941 5.8E-01 1.000 1.0E+00 M22 1.179 2.1E-01 1.183 2.9E-01 1.149 3.9E-01 M23 1.008 9.3E-01 1.066 7.5E-01 0.900 3.6E-01 M24 1.365 5.2E-02 1.403 6.0E-02 1.642 4.7E-02 M25 1.405 9.0E-03 1.589 6.7E-04 1.912 1.7E-05 M26 1.175 1.8E-02 1.324 1.7E-02 1.389 6.3E-03 -
Table 22. Effect of Age on Serum Ethanolamine Phospholipid Levels in Females Age Ctl, 30-39, Female Age Ctl, 40-49, Female Age Ctl, 50-59, Female Age Ctl, 60-69, Female Age Ctl, 70+ Female Metabolite Code Mean SEM Mean SEM Mean SEM Mean SEM Mean SEM M01 0.103 0.012 0.114 0.006 0.105 0.006 0.127 0.007 0.126 0.009 M02 0.047 0.006 0.069 0.006 0.058 0.004 0.058 0.004 0.056 0.004 M03 0.095 0.015 0.101 0.007 0.093 0.005 0.091 0.006 0.100 0.005 M04 0.028 0.005 0.033 0.003 0.025 0.002 0.023 0.002 0.026 0.002 M05 0.011 0.002 0.013 0.001 0.010 0.000 0.010 0.001 0.011 0.001 M06 0.031 0.005 0.031 0.002 0.025 0.001 0.023 0.001 0.025 0.002 M07 0.061 0.010 0.071 0.007 0.057 0.003 0.051 0.005 0.052 0.005 M08 0.008 0.001 0.010 0.001 0.007 0.000 0.006 0.001 0.006 0.001 M09 0.021 0.004 0.021 0.002 0.020 0.001 0.017 0.002 0.019 0.002 M10 0.050 0.007 0.059 0.003 0.049 0.002 0.052 0.003 0.051 0.003 M11 0.120 0.018 0.119 0.008 0.100 0.004 0.099 0.006 0.100 0.008 M12 0.196 0.022 0.222 0.015 0.191 0.009 0.181 0.011 0.188 0.013 M13 0.013 0.001 0.015 0.001 0.012 0.001 0.011 0.001 0.012 0.001 M14 0.040 0.007 0.043 0.004 0.042 0.003 0.041 0.003 0.049 0.004 M15 0.071 0.009 0.079 0.005 0.068 0.003 0.066 0.004 0.069 0.004 M16 0.274 0.044 0.268 0.021 0.226 0.011 0.210 0.013 0.232 0.017 M17 0.419 0.076 0.458 0.053 0.392 0.024 0.354 0.036 0.360 0.033 M18 0.028 0.004 0.032 0.003 0.025 0.002 0.019 0.002 0.023 0.003 M19 0.107 0.024 0.100 0.012 0.099 0.007 0.087 0.009 0.103 0.008 M20 0.074 0.013 0.075 0.006 0.063 0.003 0.063 0.004 0.068 0.005 M21 0.294 0.057 0.275 0.024 0.228 0.012 0.210 0.014 0.229 0.020 M22 0.938 0.170 1.025 0.108 0.853 0.055 0.759 0.068 0.837 0.096 M23 0.021 0.003 0.022 0.002 0.017 0.001 0.015 0.001 0.017 0.002 M24 0.102 0.025 0.093 0.011 0.089 0.006 0.081 0.008 0.096 0.008 M25 0.239 0.023 0.236 0.014 0.277 0.012 0.326 0.022 0.373 0.020 M26 0.091 0.012 0.093 0.006 0.093 0.003 0.094 0.004 0.107 0.007 -
Table 23. Ratio and T-test values between females of different ages 50-59 vs. 40-49, Female 60-69 vs. 40-49, Female 70+ vs. 40-49, Female Metabolite Code Ratio ttest Ratio ttest Ratio ttest M01 0.925 3.7E-01 1.118 1.8E-01 1.110 2.6E-01 M02 0.838 1.3E-01 0.835 9.5E-02 0.812 1.1E-01 M03 0.927 4.0E-01 0.906 2.9E-01 0.989 9.0E-01 M04 0.772 2.1E-02 0.709 5.1E-03 0.811 1.2E-01 M05 0.811 1.1E-02 0.798 2.0E-02 0.832 8.7E-02 M06 0.815 1.1E-02 0.731 1.5E-03 0.805 5.7E-02 M07 0.798 3.4E-02 0.718 1.9E-02 0.726 4.9E-02 M08 0.721 4.2E-03 0.569 1.3E-04 0.640 1.9E-02 M09 0.934 5.8E-01 0.784 9.4E-02 0.912 5.6E-01 M10 0.841 3.1E-02 0.882 1.3E-01 0.863 1.1E-01 M11 0.843 2.3E-02 0.832 3.5E-02 0.843 1.1E-01 M12 0.862 6.2E-02 0.815 2.5E-02 0.848 1.2E-01 M13 0.806 8.8E-03 0.737 2.0E-03 0.839 1.3E-01 M14 0.981 8.6E-01 0.953 6.9E-01 1.149 2.6E-01 M15 0.864 5.6E-02 0.841 3.7E-02 0.871 1.5E-01 M16 0.846 5.3E-02 0.786 1.5E-02 0.867 2.3E-01 M17 0.856 2.0E-01 0.773 1.0E-01 0.786 1.9E-01 M18 0.778 2.4E-02 0.594 1.8E-04 0.733 7.4E-02 M19 0.986 9.2E-01 0.872 3.8E-01 1.030 8.5E-01 M20 0.843 5.6E-02 0.842 9.5E-02 0.905 4.0E-01 M21 0.829 5.0E-02 0.763 1.8E-02 0.832 1.9E-01 M22 0.832 1.2E-01 0.741 3.3E-02 0.817 2.3E-01 M23 0.797 1.5E-02 0.663 3.3E-04 0.776 7.4E-02 M24 0.957 7.4E-01 0.871 3.6E-01 1.040 8.1E-01 M25 1.176 4.8E-02 1.381 1.7E-03 1.581 2.4E-07 M26 1.003 9.6E-01 1.021 7.9E-01 1.159 1.2E-01 -
Table 24. Effect of Dementia State on Serum Ethanolamine Phospholipid Levels in Females Cognitive Normal, Female SDAT_all, Female SDAT, ADAS 5-19, Female SDAT, ADAS 20-39, Female SDAT, ADAS 40-70, Female Metabolite Code Mean SEM Mean SEM Mean SEM Mean SEM Mean SEM M01 0.118 0.005 0.113 0.003 0.109 0.004 0.112 0.005 0.118 0.006 M02 0.062 0.005 0.053 0.002 0.050 0.003 0.057 0.004 0.052 0.004 M03 0.099 0.005 0.076 0.002 0.080 0.004 0.076 0.004 0.073 0.004 M04 0.026 0.002 0.025 0.001 0.024 0.002 0.027 0.002 0.024 0.003 M05 0.011 0.001 0.009 0.000 0.010 0.001 0.009 0.001 0.009 0.001 M06 0.027 0.001 0.022 0.001 0.024 0.001 0.023 0.001 0.020 0.001 M07 0.056 0.005 0.041 0.002 0.044 0.004 0.042 0.004 0.036 0.003 M08 0.006 0.001 0.005 0.000 0.005 0.000 0.006 0.001 0.005 0.000 M09 0.019 0.002 0.013 0.001 0.015 0.001 0.014 0.001 0.012 0.001 M10 0.054 0.003 0.048 0.001 0.049 0.002 0.047 0.002 0.048 0.003 M11 0.105 0.004 0.088 0.003 0.094 0.004 0.090 0.005 0.080 0.004 M12 0.196 0.012 0.153 0.005 0.166 0.009 0.152 0.010 0.142 0.010 M13 0.013 0.001 0.010 0.000 0.011 0.000 0.010 0.001 0.010 0.001 M14 0.046 0.003 0.035 0.002 0.040 0.003 0.034 0.002 0.033 0.003 M15 0.073 0.004 0.059 0.002 0.061 0.003 0.061 0.003 0.056 0.003 M16 0.250 0.013 0.192 0.007 0.214 0.013 0.201 0.012 0.164 0.008 M17 0.408 0.033 0.288 0.015 0.317 0.026 0.304 0.026 0.247 0.021 M18 0.024 0.002 0.018 0.001 0.019 0.001 0.019 0.002 0.016 0.001 M19 0.103 0.008 0.071 0.004 0.079 0.007 0.072 0.006 0.063 0.006 M20 0.077 0.004 0.059 0.002 0.064 0.004 0.060 0.004 0.054 0.003 M21 0.265 0.015 0.195 0.008 0.219 0.015 0.205 0.015 0.165 0.011 M22 0.933 0.077 0.702 0.036 0.753 0.061 0.738 0.066 0.620 0.057 M23 0.018 0.001 0.014 0.001 0.015 0.001 0.014 0.001 0.013 0.001 M24 0.103 0.009 0.073 0.004 0.079 0.008 0.073 0.007 0.067 0.008 M25 0.241 0.013 0.211 0.007 0.218 0.013 0.212 0.014 0.204 0.011 M26 0.069 0.003 0.073 0.002 0.076 0.003 0.072 0.004 0.072 0.003 -
Table 25. Ratio and T-test values between females of various levels of dementia AD, All to CN, Female ADAS 5-19 to CN, Female ADAS 20-39 to CN, Female ADAS 40-70 to CN, Female Metabolite Code Ratio ttest Ratio ttest Ratio ttest Ratio ttest M01 0.963 5.2E-01 0.929 2.1E-01 0.951 4.4E-01 1.004 9.6E-01 M02 0.856 9.0E-02 0.806 4.5E-02 0.912 3.9E-01 0.833 1.2E-01 M03 0.772 5.2E-05 0.814 6.0E-03 0.775 8.0E-04 0.737 1.8E-04 M04 0.963 7.5E-01 0.912 3.8E-01 1.027 8.3E-01 0.932 6.2E-01 M05 0.893 1.1E-01 0.925 3.4E-01 0.895 2.1E-01 0.867 8.4E-02 M06 0.843 1.4E-02 0.910 2.2E-01 0.869 9.8E-02 0.761 5.1E-04 M07 0.732 1.8E-03 0.798 5.9E-02 0.753 2.0E-02 0.656 1.1E-03 M08 0.821 5.0E-02 0.849 1.4E-01 0.889 3.7E-01 0.722 4.7E-03 M09 0.696 2.6E-04 0.777 3.9E-02 0.702 2.9E-03 0.624 4.3E-04 M10 0.877 3.1E-02 0.895 8.6E-02 0.860 4.1E-02 0.883 9.8E-02 M11 0.832 2.5E-03 0.894 7.5E-02 0.850 2.7E-02 0.762 1.4E-04 M12 0.778 5.3E-04 0.847 4.2E-02 0.776 4.7E-03 0.726 5.8E-04 M13 0.800 8.5E-04 0.834 2.5E-02 0.794 8.6E-03 0.780 3.2E-03 M14 0.772 4.8E-03 0.869 1.9E-01 0.746 3.0E-03 0.724 5.6E-03 M15 0.811 8.5E-04 0.835 1.5E-02 0.831 2.3E-02 0.770 4.4E-04 M16 0.765 7.5E-05 0.853 4.3E-02 0.801 6.9E-03 0.656 6.4E-08 M17 0.705 3.5E-04 0.776 3.2E-02 0.745 1.4E-02 0.605 4.3E-05 M18 0.754 3.4E-03 0.804 5.9E-02 0.792 6.8E-02 0.673 7.9E-04 M19 0.688 1.8E-04 0.768 2.5E-02 0.699 2.9E-03 0.612 7.0E-05 M20 0.768 4.9E-04 0.828 3.0E-02 0.782 1.1E-02 0.703 4.8E-05 M21 0.737 1.9E-04 0.826 3.7E-02 0.776 1.1E-02 0.624 6.8E-07 M22 0.752 5.2E-03 0.807 7.0E-02 0.790 6.1E-02 0.665 1.3E-03 M23 0.764 2.5E-03 0.809 3.2E-02 0.789 4.1E-02 0.699 7.8E-04 M24 0.708 2.5E-03 0.768 4.5E-02 0.713 9.3E-03 0.654 4.2E-03 M25 0.876 6.6E-02 0.907 2.3E-01 0.880 1.5E-01 0.847 3.5E-02 M26 1.056 3.8E-01 1.092 1.8E-01 1.043 5.8E-01 1.041 5.5E-01 -
Table 26. Ratio and T-test values between females of various levels of dementia ADAS 20-39 to 5-19, Female ADAS 40-70 to 5-19, Female ADAS 40-70 to 20-39, Female Metabolite Code Ratio ttest Ratio ttest Ratio ttest M01 1.023 7.2E-01 1.080 2.8E-01 1.056 4.4E-01 M02 1.132 2.3E-01 1.034 7.6E-01 0.914 4.1E-01 M03 0.951 5.1E-01 0.906 2.2E-01 0.952 5.3E-01 M04 1.126 3.6E-01 1.022 8.8E-01 0.907 5.0E-01 M05 0.967 7.0E-01 0.936 4.2E-01 0.968 7.1E-01 M06 0.955 5.9E-01 0.837 2.5E-02 0.876 1.2E-01 M07 0.944 6.4E-01 0.822 1.2E-01 0.871 2.8E-01 M08 1.046 7.2E-01 0.850 1.1E-01 0.812 1.1E-01 M09 0.903 3.9E-01 0.802 9.5E-02 0.889 3.5E-01 M10 0.961 5.8E-01 0.987 8.6E-01 1.027 7.2E-01 M11 0.951 5.1E-01 0.853 2.8E-02 0.896 1.6E-01 M12 0.917 3.1E-01 0.858 7.7E-02 0.935 4.7E-01 M13 0.953 5.4E-01 0.936 3.6E-01 0.982 8.2E-01 M14 0.858 1.6E-01 0.833 1.5E-01 0.971 8.0E-01 M15 0.996 9.6E-01 0.922 2.3E-01 0.926 3.1E-01 M16 0.940 4.7E-01 0.769 9.7E-04 0.819 1.6E-02 M17 0.960 7.4E-01 0.779 4.0E-02 0.812 9.8E-02 M18 0.985 9.0E-01 0.837 7.6E-02 0.850 1.8E-01 M19 0.911 4.7E-01 0.798 8.5E-02 0.875 3.1E-01 M20 0.945 5.7E-01 0.849 5.8E-02 0.898 2.7E-01 M21 0.939 5.5E-01 0.755 4.6E-03 0.804 4.1E-02 M22 0.979 8.7E-01 0.824 1.2E-01 0.841 1.9E-01 M23 0.975 8.3E-01 0.864 1.4E-01 0.886 3.0E-01 M24 0.928 6.0E-01 0.852 3.2E-01 0.918 5.8E-01 M25 0.971 7.5E-01 0.934 4.0E-01 0.962 6.6E-01 M26 0.955 5.2E-01 0.954 4.5E-01 0.998 9.8E-01 -
Table 27. Average Serum Ethanolamine Phospholipid Levels in Males of Different Levels of Dementia Severity Cognitive Normal, Male SDAT all, Male SDAT, ADAS 5-19, Male SDAT, ADAS 20-39, Male SDAT, ADAS 40-70, Male Metabolite Code Mean SEM Mean SEM Mean SEM Mean SEM Mean SEM M01 0.116 0.006 0.119 0.004 0.117 0.006 0.117 0.006 0.117 0.011 M02 0.066 0.006 0.056 0.004 0.060 0.009 0.054 0.004 0.046 0.006 M03 0.109 0.007 0.084 0.004 0.091 0.006 0.080 0.005 0.072 0.007 M04 0.030 0.002 0.026 0.002 0.025 0.004 0.027 0.002 0.022 0.003 M05 0.012 0.001 0.010 0.000 0.011 0.001 0.010 0.001 0.010 0.001 M06 0.028 0.002 0.025 0.001 0.024 0.002 0.025 0.002 0.024 0.002 M07 0.062 0.005 0.044 0.002 0.047 0.004 0.044 0.003 0.036 0.004 M08 0.007 0.001 0.005 0.000 0.006 0.001 0.005 0.000 0.004 0.001 M09 0.022 0.002 0.015 0.001 0.016 0.002 0.015 0.001 0.011 0.001 M10 0.054 0.002 0.052 0.002 0.053 0.003 0.051 0.002 0.047 0.005 M11 0.110 0.005 0.095 0.004 0.095 0.007 0.095 0.006 0.088 0.009 M12 0.205 0.011 0.162 0.006 0.170 0.011 0.160 0.008 0.141 0.013 M13 0.013 0.001 0.011 0.000 0.011 0.001 0.010 0.001 0.010 0.001 M14 0.051 0.004 0.036 0.002 0.041 0.004 0.034 0.002 0.028 0.003 M15 0.076 0.004 0.064 0.002 0.067 0.005 0.062 0.003 0.060 0.006 M16 0.266 0.015 0.207 0.009 0.213 0.015 0.202 0.012 0.191 0.018 M17 0.470 0.038 0.302 0.015 0.338 0.031 0.292 0.020 0.242 0.026 M18 0.026 0.003 0.019 0.001 0.020 0.002 0.018 0.001 0.016 0.002 M19 0.127 0.013 0.078 0.004 0.088 0.009 0.076 0.006 0.056 0.006 M20 0.078 0.005 0.064 0.003 0.069 0.005 0.061 0.003 0.059 0.007 M21 0.265 0.017 0.217 0.010 0.226 0.019 0.211 0.014 0.201 0.023 M22 1.040 0.087 0.736 0.037 0.789 0.071 0.723 0.052 0.624 0.067 M23 0.018 0.001 0.015 0.001 0.016 0.001 0.014 0.001 0.013 0.001 M24 0.116 0.012 0.079 0.005 0.090 0.010 0.075 0.006 0.061 0.008 M25 0.240 0.017 0.218 0.009 0.249 0.018 0.208 0.010 0.183 0.017 M26 0.072 0.003 0.070 0.002 0.074 0.004 0.070 0.003 0.065 0.006 -
Table 28. Ratio and T-test Values Between Males of Various Levels of Dementia AD, All to CN, Male ADAS 5-19 to CN, Male ADAS 20-39 to CN, Male ADAS 40-70 to CN, Male Metabolite Code Ratio ttest Ratio ttest Ratio ttest Ratio ttest M01 1.028 7.1E-01 1.011 8.9E-01 1.016 8.3E-01 1.014 8.9E-01 M02 0.845 2.1E-01 0.898 5.5E-01 0.816 7.5E-02 0.690 2.4E-02 M03 0.769 1.6E-03 0.836 6.9E-02 0.735 6.4E-04 0.655 1.4E-03 M04 0.882 3.9E-01 0.836 2.9E-01 0.896 4.1E-01 0.726 2.7E-02 M05 0.882 1.3E-01 0.896 2.7E-01 0.865 9.1E-02 0.836 1.5E-01 M06 0.877 1.3E-01 0.855 9.1E-02 0.876 1.6E-01 0.856 1.4E-01 M07 0.709 3.9E-04 0.753 1.8E-02 0.704 1.6E-03 0.589 1.1E-03 M08 0.759 1.9E-02 0.806 1.8E-01 0.755 2.1E-02 0.629 1.5E-02 M09 0.658 2.7E-04 0.731 2.7E-02 0.654 1.4E-03 0.472 2.2E-04 M10 0.960 6.0E-01 0.978 7.9E-01 0.942 4.0E-01 0.877 1.7E-01 M11 0.866 9.3E-02 0.861 1.1E-01 0.861 8.1E-02 0.798 2.6E-02 M12 0.793 1.8E-03 0.831 3.9E-02 0.783 2.2E-03 0.686 8.3E-04 M13 0.850 2.7E-02 0.890 1.8E-01 0.827 1.3E-02 0.786 1.8E-02 M14 0.704 3.7E-04 0.800 6.9E-02 0.666 1.1E-04 0.553 2.3E-04 M15 0.842 2.2E-02 0.883 1.8E-01 0.810 3.0E-03 0.784 1.9E-02 M16 0.778 1.6E-03 0.802 1.7E-02 0.759 1.2E-03 0.718 3.2E-03 M17 0.644 4.5E-06 0.718 7.5E-03 0.621 1.3E-05 0.515 1.0E-04 M18 0.708 1.6E-03 0.758 6.0E-02 0.689 2.0E-03 0.613 7.7E-03 M19 0.611 1.0E-05 0.688 1.1E-02 0.596 6.1E-05 0.442 2.0E-04 M20 0.826 2.3E-02 0.892 2.7E-01 0.786 6.1E-03 0.762 3.9E-02 M21 0.818 2.7E-02 0.852 1.3E-01 0.796 2.0E-02 0.757 2.9E-02 M22 0.708 4.4E-04 0.758 2.7E-02 0.695 1.3E-03 0.600 1.9E-03 M23 0.801 1.1E-02 0.857 1.6E-01 0.776 4.0E-03 0.723 8.6E-03 M24 0.680 1.1E-03 0.777 9.8E-02 0.647 1.3E-03 0.524 2.8E-03 M25 0.909 2.4E-01 1.035 7.4E-01 0.865 8.0E-02 0.760 3.0E-02 M26 0.978 7.4E-01 1.023 7.5E-01 0.968 6.5E-01 0.907 2.9E-01 -
Table 29. Ratio and T-test Values Between Males of Various Levels of Dementia ADAS 20-39 to 5-19, Male ADAS 40-70 to 5-19, Male ADAS 40-70 to 20-39, Male Metabolite Code Ratio ttest Ratio ttest Ratio ttest M01 1.005 9.4E-01 1.003 9.8E-01 0.998 9.8E-01 M02 0.908 5.3E-01 0.768 3.2E-01 0.846 2.8E-01 M03 0.880 1.5E-01 0.784 7.0E-02 0.891 3.4E-01 M04 1.072 6.8E-01 0.868 5.8E-01 0.810 2.8E-01 M05 0.966 7.0E-01 0.933 6.1E-01 0.966 7.7E-01 M06 1.024 8.1E-01 1.001 9.9E-01 0.978 8.6E-01 M07 0.935 5.5E-01 0.783 1.3E-01 0.837 2.5E-01 M08 0.936 6.3E-01 0.780 2.7E-01 0.833 2.4E-01 M09 0.895 4.2E-01 0.646 3.3E-02 0.721 1.0E-01 M10 0.963 6.3E-01 0.897 3.7E-01 0.932 5.0E-01 M11 1.000 1.0E+00 0.927 5.7E-01 0.927 5.4E-01 M12 0.942 4.8E-01 0.826 1.3E-01 0.877 2.4E-01 M13 0.930 3.8E-01 0.883 3.2E-01 0.950 6.3E-01 M14 0.832 1.1E-01 0.691 4.5E-02 0.830 2.0E-01 M15 0.917 3.0E-01 0.888 3.7E-01 0.968 7.4E-01 M16 0.947 5.4E-01 0.895 3.9E-01 0.946 6.4E-01 M17 0.865 1.9E-01 0.716 5.6E-02 0.828 1.9E-01 M18 0.909 4.5E-01 0.809 2.8E-01 0.890 4.4E-01 M19 0.866 2.5E-01 0.642 3.1E-02 0.741 7.4E-02 M20 0.880 1.6E-01 0.854 2.7E-01 0.970 8.0E-01 M21 0.934 5.2E-01 0.889 4.4E-01 0.952 7.2E-01 M22 0.917 4.5E-01 0.791 1.6E-01 0.863 3.3E-01 M23 0.906 3.3E-01 0.844 2.8E-01 0.931 5.6E-01 M24 0.833 1.7E-01 0.674 5.9E-02 0.810 2.3E-01 M25 0.836 3.7E-02 0.735 2.8E-02 0.879 2.1E-01 M26 0.946 4.3E-01 0.887 2.3E-01 0.937 5.2E-01 -
Table 30. Effect of Pathology State on Serum Ethanolamine Phospholipid Levels in Males Post Mortem Ctl, Male Post Mortem SDAT Male SDAT vs Control Metabolite Code Mean SEM Mean SEM Ratio ttest M01 0.127 0.017 0.089 0.013 0.702 0.091 M02 0.046 0.006 0.026 0.005 0.568 0.022 M03 0.059 0.006 0.036 0.006 0.610 0.014 M04 0.017 0.004 0.007 0.002 0.420 0.024 M05 0.006 0.001 0.004 0.000 0.479 0.019 M06 0.009 0.001 0.006 0.001 0.475 0.005 M07 0.012 0.003 0.009 0.001 0.451 0.033 M08 0.003 0.001 0.002 0.000 0.410 0.015 M09 0.006 0.002 0.003 0.001 0.269 0.048 M10 0.041 0.005 0.036 0.006 0.608 0.019 M11 0.052 0.006 0.041 0.006 0.474 0.001 M12 0.094 0.013 0.084 0.012 0.587 0.024 M13 0.009 0.001 0.008 0.001 0.576 0.008 M14 0.025 0.005 0.021 0.007 0.429 0.009 M15 0.045 0.005 0.029 0.004 0.648 0.026 M16 0.092 0.012 0.053 0.007 0.570 0.012 M17 0.097 0.021 0.047 0.007 0.489 0.036 M18 0.010 0.001 0.005 0.001 0.521 0.004 M19 0.032 0.006 0.014 0.002 0.452 0.011 M20 0.031 0.004 0.017 0.002 0.542 0.006 M21 0.072 0.011 0.033 0.006 0.464 0.006 M22 0.217 0.040 0.106 0.017 0.486 0.020 M23 0.009 0.001 0.005 0.001 0.565 0.005 M24 0.029 0.004 0.013 0.003 0.448 0.007 M25 0.238 0.023 0.180 0.026 0.757 0.114 M26 0.073 0.008 0.050 0.006 0.684 0.034 -
Table 31. Effect of Pathology State on Serum Ethanolamine Phospholipid Levels in Females Post Mortem Ctl, Female Post Mortem SDAT Female Autopsy AD vs. Control, Female Metabolite Code Mean SEM Mean SEM Ratio ttest M01 0.179 0.050 0.124 0.016 0.697 0.300 M02 0.062 0.022 0.048 0.011 0.773 0.557 M03 0.070 0.019 0.043 0.005 0.619 0.178 M04 0.016 0.005 0.012 0.004 0.775 0.563 M05 0.007 0.002 0.003 0.001 0.508 0.095 M06 0.011 0.003 0.004 0.001 0.531 0.060 M07 0.016 0.003 0.005 0.001 0.530 0.037 M08 0.003 0.001 0.001 0.000 0.684 0.258 M09 0.005 0.001 0.002 0.000 0.566 0.047 M10 0.053 0.015 0.025 0.004 0.672 0.293 M11 0.064 0.013 0.025 0.004 0.650 0.132 M12 0.114 0.021 0.055 0.008 0.742 0.241 M13 0.010 0.002 0.005 0.001 0.865 0.537 M14 0.023 0.004 0.011 0.002 0.904 0.792 M15 0.060 0.017 0.034 0.004 0.577 0.151 M16 0.107 0.021 0.064 0.008 0.594 0.061 M17 0.113 0.024 0.067 0.009 0.592 0.079 M18 0.014 0.004 0.008 0.001 0.579 0.186 M19 0.035 0.007 0.022 0.004 0.635 0.132 M20 0.050 0.014 0.021 0.002 0.410 0.042 M21 0.100 0.020 0.041 0.007 0.414 0.010 M22 0.283 0.058 0.168 0.024 0.593 0.071 M23 0.012 0.003 0.007 0.001 0.560 0.112 M24 0.035 0.007 0.018 0.002 0.496 0.025 M25 0.189 0.015 0.198 0.022 1.051 0.727 M26 0.054 0.008 0.061 0.006 1.123 0.496 -
Table 32. Effect of Age on Ethanolamine Phospholipid Ratios to M01 in Males Age Ctl, 30-39, Male Age Ctl, 40-49, Male Age Ctl, 50-59, Male Age Ctl, 60-69, Male Age Ctl, 70+ Male Metabolite Code Mean SEM Mean SEM Mean SEM Mean SEM Mean SEM M01 1.000 0.000 1.000 0.000 1.000 0.000 1.000 0.000 1.000 0.000 M02 0.476 0.042 0.477 0.034 0.517 0.027 0.431 0.031 0.420 0.028 M03 0.863 0.063 0.751 0.049 0.864 0.030 0.792 0.051 0.848 0.071 M04 0.224 0.025 0.229 0.026 0.235 0.013 0.203 0.019 0.204 0.017 M05 0.113 0.008 0.102 0.007 0.101 0.004 0.091 0.005 0.088 0.005 M06 0.263 0.029 0.234 0.021 0.243 0.012 0.199 0.016 0.210 0.012 M07 0.683 0.136 0.493 0.070 0.581 0.041 0.479 0.052 0.457 0.039 M08 0.079 0.010 0.064 0.007 0.067 0.004 0.054 0.005 0.049 0.004 M09 0.161 0.025 0.124 0.017 0.173 0.013 0.154 0.018 0.172 0.024 M10 0.464 0.025 0.454 0.022 0.445 0.012 0.419 0.018 0.407 0.016 M11 1.063 0.111 0.899 0.069 0.908 0.037 0.789 0.052 0.811 0.038 M12 2.068 0.251 1.728 0.168 1.942 0.099 1.664 0.111 1.552 0.087 M13 0.126 0.009 0.117 0.009 0.121 0.005 0.102 0.006 0.092 0.005 M14 0.294 0.033 0.242 0.029 0.332 0.020 0.316 0.029 0.363 0.041 M15 0.699 0.034 0.658 0.041 0.675 0.023 0.567 0.031 0.590 0.029 M16 2.429 0.285 2.020 0.175 2.284 0.118 1.778 0.145 1.922 0.112 M17 4.127 0.757 3.164 0.418 3.980 0.257 3.167 0.320 3.178 0.294 M18 0.258 0.025 0.229 0.025 0.244 0.014 0.195 0.021 0.174 0.014 M19 0.725 0.101 0.607 0.094 0.865 0.063 0.769 0.085 0.881 0.131 M20 0.691 0.049 0.616 0.043 0.619 0.030 0.529 0.034 0.553 0.034 M21 2.395 0.215 2.163 0.189 2.287 0.122 1.773 0.148 1.840 0.108 M22 8.811 1.529 7.346 0.883 8.537 0.549 7.124 0.644 6.920 0.635 M23 0.189 0.019 0.175 0.016 0.178 0.009 0.150 0.016 0.133 0.008 M24 0.649 0.086 0.606 0.098 0.787 0.057 0.700 0.072 0.799 0.122 M25 2.182 0.444 1.975 0.265 2.747 0.211 2.608 0.251 3.066 0.284 -
Table 33. Ratio and T-test values of Ethanolamine Phospholipid Ratios to M01 between males of different ages 50-59 vs. 40-49, Male 60-69 vs. 40-49, Male 70+ vs. 40-49, Male Metabolite Code Ratio ttest Ratio ttest Ratio ttest M01 1.000 #DIV/0! 1.000 #DIV/0! 1.000 #DIV/0! M02 1.082 3.9E-01 0.903 3.2E-01 0.879 1.9E-01 M03 1.149 4.5E-02 1.054 5.8E-01 1.128 3.0E-01 M04 1.023 8.4E-01 0.883 4.0E-01 0.889 3.9E-01 M05 0.984 8.3E-01 0.884 1.6E-01 0.863 8.5E-02 M06 1.041 6.8E-01 0.851 1.9E-01 0.898 3.1E-01 M07 1.177 2.6E-01 0.970 8.6E-01 0.927 6.4E-01 M08 1.053 6.7E-01 0.847 2.6E-01 0.765 5.4E-02 M09 1.404 2.5E-02 1.243 2.4E-01 1.391 1.3E-01 M10 0.981 7.1E-01 0.924 2.3E-01 0.896 7.6E-02 M11 1.010 9.0E-01 0.878 2.0E-01 0.903 2.5E-01 M12 1.124 2.5E-01 0.963 7.4E-01 0.898 3.3E-01 M13 1.035 6.7E-01 0.873 1.7E-01 0.787 1.3E-02 M14 1.372 1.2E-02 1.306 7.7E-02 1.500 2.7E-02 M15 1.026 7.0E-01 0.862 7.8E-02 0.896 1.7E-01 M16 1.131 2.1E-01 0.880 2.9E-01 0.951 6.2E-01 M17 1.258 8.8E-02 1.001 1.0E+00 1.004 9.8E-01 M18 1.067 5.6E-01 0.851 3.0E-01 0.761 4.9E-02 M19 1.426 2.4E-02 1.266 2.1E-01 1.451 1.1E-01 M20 1.004 9.6E-01 0.858 1.1E-01 0.898 2.5E-01 M21 1.057 5.8E-01 0.820 1.0E-01 0.851 1.2E-01 M22 1.162 2.4E-01 0.970 8.4E-01 0.942 6.9E-01 M23 1.016 8.7E-01 0.858 2.8E-01 0.759 1.5E-02 M24 1.300 9.4E-02 1.156 4.3E-01 1.319 2.4E-01 M25 1.391 3.5E-02 1.321 9.0E-02 1.553 8.2E-03 -
Table 34. Effect of Age on Ethanolamine Phospholipid Ratios to M01 in Females Age Ctl, 30-39, Female Age Ctl, 40-49, Female Age Ctl, 50-59, Female Age Ctl, 60-69, Female Age Ctl, 70+ Female Metabolite Code Mean SEM Mean SEM Mean SEM Mean SEM Mean SEM M01 1.000 0.000 1.000 0.000 1.000 0.000 1.000 0.000 1.000 0.000 M02 0.474 0.037 0.597 0.028 0.551 0.020 0.460 0.018 0.455 0.023 M03 0.931 0.089 0.911 0.043 0.926 0.030 0.750 0.034 0.838 0.048 M04 0.279 0.036 0.283 0.017 0.241 0.011 0.184 0.010 0.221 0.020 M05 0.112 0.009 0.118 0.006 0.105 0.003 0.085 0.005 0.089 0.006 M06 0.311 0.044 0.291 0.019 0.261 0.010 0.193 0.012 0.213 0.017 M07 0.618 0.090 0.667 0.056 0.582 0.030 0.435 0.039 0.430 0.041 M08 0.079 0.008 0.089 0.007 0.070 0.003 0.047 0.004 0.052 0.007 M09 0.204 0.036 0.194 0.017 0.197 0.011 0.139 0.012 0.163 0.015 M10 0.491 0.027 0.535 0.024 0.490 0.010 0.424 0.015 0.422 0.022 M11 1.220 0.159 1.092 0.060 1.021 0.031 0.823 0.037 0.840 0.058 M12 1.979 0.150 2.044 0.117 1.952 0.063 1.534 0.086 1.564 0.100 M13 0.129 0.008 0.136 0.007 0.122 0.004 0.092 0.005 0.104 0.010 M14 0.379 0.047 0.381 0.024 0.414 0.018 0.333 0.021 0.412 0.033 M15 0.706 0.044 0.720 0.034 0.699 0.019 0.560 0.024 0.578 0.033 M16 2.739 0.333 2.483 0.161 2.345 0.091 1.783 0.096 1.964 0.136 M17 4.055 0.499 4.149 0.401 3.987 0.209 2.963 0.275 3.010 0.268 M18 0.282 0.022 0.289 0.022 0.245 0.010 0.160 0.012 0.191 0.024 M19 1.009 0.175 0.902 0.085 0.974 0.056 0.716 0.061 0.877 0.077 M20 0.708 0.059 0.682 0.045 0.637 0.021 0.524 0.029 0.565 0.039 M21 2.885 0.411 2.537 0.187 2.331 0.092 1.757 0.105 1.935 0.158 M22 8.971 0.932 9.244 0.790 8.625 0.450 6.263 0.484 6.923 0.683 M23 0.198 0.011 0.202 0.014 0.177 0.006 0.124 0.008 0.140 0.014 M24 0.955 0.174 0.834 0.078 0.882 0.049 0.661 0.054 0.814 0.071 M25 2.505 0.217 2.286 0.164 3.219 0.181 2.995 0.239 3.280 0.248 -
Table 35. Ratio and T-test values of Ethanolamine Phospholipid Ratios to M01 between females of different ages 50-59 vs. 40-49, Female 60-69 vs. 40-49, Female 70+ vs. 40-49, Female Metabolite Code Ratio ttest Ratio ttest Ratio ttest M01 1.000 #DIV/0! 1.000 #DIV/0! 1.000 #DIV/0! M02 0.923 2.1E-01 0.771 5.7E-05 0.763 8.4E-04 M03 1.017 7.8E-01 0.823 3.7E-03 0.920 2.8E-01 M04 0.850 3.5E-02 0.652 1.1E-06 0.782 2.3E-02 M05 0.892 4.7E-02 0.721 5.0E-05 0.758 3.7E-03 M06 0.896 1.3E-01 0.662 1.3E-05 0.733 6.5E-03 M07 0.873 1.5E-01 0.652 7.2E-04 0.644 3.5E-03 M08 0.783 4.7E-03 0.533 6.9E-07 0.583 9.9E-04 M09 1.016 8.8E-01 0.717 7.8E-03 0.841 2.2E-01 M10 0.917 4.8E-02 0.792 7.9E-05 0.789 2.0E-03 M11 0.935 2.5E-01 0.754 1.3E-04 0.770 5.9E-03 M12 0.955 4.6E-01 0.751 5.1E-04 0.765 5.8E-03 M13 0.900 7.0E-02 0.680 4.8E-06 0.764 9.1E-03 M14 1.088 3.1E-01 0.876 1.4E-01 1.083 4.3E-01 M15 0.970 5.6E-01 0.778 1.8E-04 0.802 6.7E-03 M16 0.944 4.3E-01 0.718 1.8E-04 0.791 2.8E-02 M17 0.961 7.0E-01 0.714 1.4E-02 0.726 4.4E-02 M18 0.847 4.1E-02 0.552 6.0E-07 0.660 5.6E-03 M19 1.079 4.9E-01 0.794 7.2E-02 0.972 8.4E-01 M20 0.935 3.1E-01 0.769 2.9E-03 0.828 7.5E-02 M21 0.919 2.7E-01 0.693 2.4E-04 0.763 2.9E-02 M22 0.933 4.8E-01 0.678 1.2E-03 0.749 4.6E-02 M23 0.876 5.5E-02 0.614 1.3E-06 0.696 3.9E-03 M24 1.058 6.0E-01 0.793 6.5E-02 0.976 8.6E-01 M25 1.408 2.4E-03 1.310 2.2E-02 1.435 8.6E-04 -
Table 36. Average Serum Ethanolamine Phospholipid Ratios to M01 in Males of Different Levels of Dementia Severity Cognitive Normal, Male SDAT all, Male SDAT, ADAS 5-19, Male SDAT, ADAS 20-39, Male SDAT, ADAS 40-70, Male Metabolite Code Mean SEM Mean SEM Mean SEM Mean SEM Mean SEM M01 1.000 0.000 1.000 0.000 1.000 0.000 1.000 0.000 1.000 0.000 M02 0.564 0.031 0.453 0.015 0.475 0.032 0.455 0.017 0.383 0.022 M03 0.960 0.050 0.712 0.018 0.779 0.037 0.694 0.024 0.617 0.027 M04 0.262 0.015 0.210 0.009 0.203 0.017 0.219 0.013 0.183 0.014 M05 0.106 0.006 0.089 0.002 0.091 0.004 0.089 0.003 0.085 0.004 M06 0.255 0.014 0.213 0.007 0.211 0.012 0.214 0.010 0.211 0.012 M07 0.554 0.041 0.373 0.014 0.396 0.025 0.375 0.020 0.321 0.028 M08 0.062 0.005 0.044 0.002 0.047 0.004 0.045 0.003 0.038 0.003 M09 0.195 0.015 0.126 0.006 0.139 0.012 0.127 0.009 0.093 0.008 M10 0.483 0.021 0.440 0.009 0.450 0.016 0.441 0.013 0.408 0.016 M11 0.985 0.043 0.817 0.025 0.828 0.051 0.824 0.035 0.761 0.036 M12 1.843 0.088 1.399 0.036 1.460 0.059 1.406 0.053 1.252 0.090 M13 0.114 0.006 0.092 0.002 0.096 0.004 0.091 0.003 0.088 0.006 M14 0.442 0.023 0.310 0.013 0.348 0.028 0.301 0.015 0.255 0.025 M15 0.682 0.031 0.548 0.012 0.571 0.022 0.541 0.016 0.520 0.024 M16 2.398 0.128 1.790 0.057 1.856 0.105 1.777 0.082 1.687 0.115 M17 4.203 0.304 2.569 0.105 2.853 0.205 2.501 0.135 2.187 0.243 M18 0.232 0.017 0.156 0.006 0.166 0.012 0.155 0.009 0.140 0.010 M19 1.103 0.092 0.663 0.032 0.740 0.066 0.660 0.041 0.503 0.045 M20 0.692 0.037 0.548 0.016 0.593 0.030 0.532 0.021 0.509 0.034 M21 2.377 0.126 1.857 0.066 1.951 0.128 1.829 0.090 1.754 0.143 M22 9.309 0.674 6.230 0.231 6.651 0.434 6.157 0.305 5.616 0.592 M23 0.164 0.009 0.125 0.004 0.133 0.008 0.124 0.006 0.114 0.008 M24 1.010 0.088 0.672 0.034 0.770 0.076 0.647 0.039 0.539 0.053 M25 2.160 0.133 2.085 0.115 2.215 0.145 2.102 0.197 1.811 0.222 -
Table 37. Ratio and T-test Values of Ethanolamine Phospholipid Ratios to M01 between Males of Various Levels of Dementia AD, All to CN, Male ADAS 5-19 to CN, Male ADAS 20-39 to CN, Male ADAS 40-70 to CN, Male Metabolite Code Ratio ttest Ratio ttest Ratio ttest Ratio ttest M01 1.000 #DIV/0! 1.000 #DIV/0! 1.000 #DIV/0! 1.000 #DIV/0! M02 0.803 7.2E-04 0.842 5.2E-02 0.807 1.2E-03 0.680 1.8E-04 M03 0.742 6.4E-08 0.812 3.8E-03 0.724 4.5E-07 0.643 9.8E-06 M04 0.802 8.4E-03 0.774 1.6E-02 0.836 4.1E-02 0.700 1.3E-03 M05 0.840 9.2E-04 0.858 2.9E-02 0.841 5.5E-03 0.798 1.2E-02 M06 0.833 5.0E-03 0.827 2.0E-02 0.840 2.2E-02 0.828 4.7E-02 M07 0.673 4.7E-07 0.715 1.1E-03 0.676 3.1E-05 0.580 2.4E-04 M08 0.713 1.1E-04 0.747 1.3E-02 0.727 1.5E-03 0.602 8.4E-04 M09 0.645 2.8E-06 0.713 4.4E-03 0.654 7.5E-05 0.476 1.6E-05 M10 0.910 3.4E-02 0.932 2.1E-01 0.913 8.0E-02 0.843 1.8E-02 M11 0.830 1.9E-03 0.841 2.5E-02 0.837 5.8E-03 0.773 9.3E-04 M12 0.759 3.4E-07 0.792 3.9E-04 0.763 1.9E-05 0.679 7.0E-05 M13 0.811 1.0E-04 0.846 1.2E-02 0.802 4.0E-04 0.772 4.7E-03 M14 0.701 4.1E-06 0.787 1.4E-02 0.680 1.1E-06 0.576 4.9E-06 M15 0.803 2.7E-06 0.837 3.8E-03 0.792 2.4E-05 0.762 8.6E-04 M16 0.747 4.3E-06 0.774 1.5E-03 0.741 4.8E-05 0.704 5.4E-04 M17 0.611 2.1E-09 0.679 3.1E-04 0.595 7.2E-08 0.520 4.0E-05 M18 0.672 9.8E-07 0.714 1.7E-03 0.666 2.3E-05 0.603 3.3E-04 M19 0.601 6.5E-08 0.672 1.7E-03 0.599 2.1E-06 0.456 2.2E-05 M20 0.793 9.1E-05 0.858 3.8E-02 0.769 1.0E-04 0.736 1.8E-03 M21 0.782 3.7E-04 0.821 2.2E-02 0.770 5.6E-04 0.738 3.0E-03 M22 0.669 2.0E-07 0.714 9.9E-04 0.661 4.8E-06 0.603 6.0E-04 M23 0.763 1.2E-04 0.810 1.5E-02 0.754 4.8E-04 0.696 6.5E-04 M24 0.665 3.5E-05 0.763 4.2E-02 0.641 3.5E-05 0.533 4.0E-04 M25 0.965 7.5E-01 1.025 7.9E-01 0.973 8.4E-01 0.838 1.6E-01 -
Table 38. Ratio and T-test Values of Ethanolamine Phospholipid Ratios to M01 Between Males of Various Levels of Dementia ADAS 20-39 to 5-19, Male ADAS 40-70 to 5-19, Male ADAS 40-70 to 20-39, Male Metabolite Code Ratio ttest Ratio ttest Ratio ttest M01 1.000 #DIV/0! 1.000 #DIV/0! 1.000 #DIV/0! M02 0.958 5.5E-01 0.807 7.1 E-02 0.843 3.5E-02 M03 0.891 4.6E-02 0.792 6.9E-03 0.888 9.3E-02 M04 1.080 4.5E-01 0.903 4.8E-01 0.837 1.4E-01 M05 0.980 7.2E-01 0.930 3.2E-01 0.948 4.4E-01 M06 1.016 8.4E-01 1.002 9.8E-01 0.987 8.9E-01 M07 0.946 5.1E-01 0.811 8.4E-02 0.857 1.8E-01 M08 0.973 7.8E-01 0.806 1.3E-01 0.828 1.3E-01 M09 0.917 4.2E-01 0.668 1.5E-02 0.728 3.5E-02 M10 0.980 6.6E-01 0.905 1.1E-01 0.923 1.9E-01 M11 0.995 9.4E-01 0.919 4.0E-01 0.924 3.5E-01 M12 0.964 5.1E-01 0.858 5.8E-02 0.890 1.6E-01 M13 0.948 3.5E-01 0.913 2.6E-01 0.963 6.3E-01 M14 0.864 1.1E-01 0.732 4.1E-02 0.847 1.4E-01 M15 0.947 2.6E-01 0.911 1.7E-01 0.962 5.2E-01 M16 0.957 5.5E-01 0.909 3.4E-01 0.950 5.8E-01 M17 0.877 1.4E-01 0.767 6.0E-02 0.875 2.6E-01 M18 0.932 4.5E-01 0.844 1.9E-01 0.905 3.9E-01 M19 0.891 2.8E-01 0.679 2.6E-02 0.762 4.5E-02 M20 0.896 8.6E-02 0.858 9.6E-02 0.957 5.9E-01 M21 0.937 4.2E-01 0.899 3.6E-01 0.959 6.8E-01 M22 0.926 3.4E-01 0.844 1.8E-01 0.912 4.0E-01 M23 0.931 3.9E-01 0.860 1.8E-01 0.923 4.5E-01 M24 0.840 1.2E-01 0.699 5.7E-02 0.832 1.5E-01 M25 0.949 6.7E-01 0.818 1.3E-01 0.862 4.4E-01 -
Table 39. Effect of Dementia State on Ethanolamine Phospholipid Ratios to M01 in Females Cognitive Normal, Female SDAT all, Female SDAT, ADAS 5-19, Female SDAT, ADAS 20-39, Female SDAT, ADAS 40-70, Female Metabolite Code Mean SEM Mean SEM Mean SEM Mean SEM Mean SEM M01 1.000 0.000 1.000 0.000 1.000 0.000 1.000 0.000 1.000 0.000 M02 0.520 0.029 0.463 0.012 0.454 0.021 0.499 0 023 0.431 0.018 M03 0.852 0.034 0.687 0.017 0.742 0.030 0.704 0.031 0.624 0.022 M04 0.222 0.013 0.219 0.010 0.215 0.013 0.241 0.021 0.197 0.015 M05 0.092 0.004 0.086 0.003 0.091 0.004 0.088 0.005 0.081 0.004 M06 0.234 0.012 0.207 0.007 0.226 0.011 0.217 0.013 0.180 0.009 M07 0.474 0.034 0.368 0.018 0.422 0.039 0.377 0.028 0.314 0.025 M08 0.054 0.004 0.047 0.002 0.050 0.003 0.051 0.004 0.039 0.002 M09 0.167 0.013 0.121 0.005 0.140 0.010 0.123 0.009 0.103 0.008 M10 0.469 0.016 0.431 0.010 0.451 0.016 0.428 0.018 0.418 0.016 M11 0.929 0.039 0.807 0.023 0.886 0.041 0.839 0.044 0.708 0.030 M12 1.682 0.078 1.384 0.042 1.568 0.090 1.384 0.067 1.239 0.062 M13 0.111 0.005 0.095 0.003 0.101 0.005 0.095 0.005 0.089 0.004 M14 0.392 0.023 0.315 0.013 0.367 0.029 0.309 0.019 0.279 0.019 M15 0.627 0.024 0.539 0.014 0.564 0.021 0.563 0.030 0.493 0.016 M16 2.214 0.114 1.780 0.064 1.994 0.107 1.906 0.127 1.470 0.069 M17 3.497 0.247 2.593 0.127 2.976 0.266 2.750 0.226 2.115 0.146 M18 0.202 0.014 0.161 0.007 0.178 0.011 0.170 0.014 0.138 0.008 M19 0.895 0.061 0.634 0.030 0.728 0.057 0.656 0.055 0.537 0.041 M20 0.669 0.035 0.535 0.018 0.587 0.032 0.553 0.036 0.474 0.022 M21 2.318 0.118 1.798 0.076 2.039 0.132 1.922 0.147 1.467 0.086 M22 8.068 0.596 6.310 0.304 7.041 0.600 6.681 0.568 5.313 0.360 M23 0.158 0.009 0.127 0.005 0.139 0.009 0.131 0.010 0.112 0.006 M24 0.893 0.068 0.651 0.034 0.724 0.063 0.669 0.059 0.573 0.053 M25 2.145 0.127 2.031 0.086 2.072 0.129 2.109 0.162 1.910 0.139 -
Table 40. Ratio and T-test values of Ethanolamine Phospholipid Ratios to M01 Between females of various levels of dementia AD, All to CN, Female ADAS 5-19 to CN, Female ADAS 20-39 to CN, Female ADAS 40-70 to CN, Female Metabolite Code Ratio ttest Ratio ttest Ratio ttest Ratio ttest M01 1.000 #DIV/0! 1.000 #DIV/0! 1.000 #DIV/0! 1.000 #DIV/0! M02 0.891 4.7E-02 0.872 6.4E-02 0.960 5.7E-01 0.828 7.0E-03 M03 0.806 1.3E-05 0.871 1.6E-02 0.826 2.1E-03 0.732 6.8E-08 M04 0.986 8.8E-01 0.968 7.0E-01 1.086 4.9E-01 0.887 2.3E-01 M05 0.941 3.5E-01 0.989 8.7E-01 0.962 6.4E-01 0.879 5.5E-02 M06 0.885 6.6E-02 0.966 6.3E-01 0.928 3.7E-01 0.771 2.8E-04 M07 0.776 6.7E-03 0.890 3.2E-01 0.796 3.2E-02 0.663 2.3E-04 M08 0.869 1.3E-01 0.934 4.9E-01 0.943 6.2E-01 0.735 1.5E-03 M09 0.724 3.1E-04 0.837 1.0E-01 0.740 5.4E-03 0.618 4.2E-05 M10 0.919 7.3E-02 0.963 4.4E-01 0.913 1.1E-01 0.892 3.1E-02 M11 0.868 1.6E-02 0.953 4.4E-01 0.902 1.5E-01 0.762 2.0E-05 M12 0.823 1.5E-03 0.932 3.4E-01 0.823 5.0E-03 0.736 2.0E-05 M13 0.854 6.6E-03 0.914 1.8E-01 0.854 3.1E-02 0.806 9.4E-04 M14 0.802 5.5E-03 0.935 4.9E-01 0.789 6.6E-03 0.711 2.4E-04 M15 0.860 4.8E-03 0.900 5.1E-02 0.897 1.3E-01 0.786 9.1E-06 M16 0.804 2.1E-03 0.901 1.6E-01 0.861 9.3E-02 0.664 8.8E-08 M17 0.742 1.5E-03 0.851 1.6E-01 0.786 3.2E-02 0.605 2.3E-06 M18 0.798 9.5E-03 0.879 1.8E-01 0.844 1.4E-01 0.683 6.3E-05 M19 0.709 1.6E-04 0.813 5.1E-02 0.733 5.3E-03 0.600 3.2E-06 M20 0.800 1.0E-03 0.878 8.7E-02 0.826 2.8E-02 0.709 3.4E-06 M21 0.776 1.4E-03 0.879 1.2E-01 0.829 5.6E-02 0.633 5.4E-08 M22 0.782 9.6E-03 0.873 2.3E-01 0.828 1.1E-01 0.659 7.8E-05 M23 0.801 5.3E-03 0.877 1.3E-01 0.831 6.8E-02 0.707 4.5E-05 M24 0.729 1.6E-03 0.811 7.2E-02 0.750 1.7E-02 0.642 3.3E-04 M25 0.947 5.3E-01 0.966 6.9E-01 0.983 8.7E-01 0.890 2.3E-01 -
Table 41. Ratio and T-test values of Ethanolamine Phospholipid Ratios to M01 between females of various levels of dementia ADAS 20-39 to 5-19, Female ADAS 40-70 to 5-19, Female ADAS 40-70 to 20-39, Female Metabolite Code Ratio ttest Ratio ttest Ratio ttest M01 1.000 #DIV/0! 1.000 #DIV/0! 1.000 #DIV/0! M02 1.101 1.6E-01 0.949 4.1E-01 0.862 2.2E-02 M03 0.949 4.0E-01 0.841 1.5E-03 0.887 4.2E-02 M04 1.122 3.3E-01 0.917 3.8E-01 0.817 9.2E-02 M05 0.972 7.3E-01 0.889 7.6E-02 0.914 2.6E-01 M06 0.961 6.3E-01 0.797 1.3E-03 0.830 2.4E-02 M07 0.895 3.4E-01 0.745 1.7E-02 0.833 9.8E-02 M08 1.010 9.4E-01 0.787 1.1E-02 0.780 3.5E-02 M09 0.884 2.4E-01 0.738 6.7E-03 0.835 1.0E-01 M10 0.948 3.5E-01 0.926 1.5E-01 0.977 6.8E-01 M11 0.947 4.6E-01 0.799 6.4E-04 0.844 1.9E-02 M12 0.883 9.7E-02 0.790 2.5E-03 0.895 1.2E-01 M13 0.934 3.6E-01 0.882 5.3E-02 0.944 4.1E-01 M14 0.844 8.6E-02 0.761 9.9E-03 0.902 2.6E-01 M15 0.998 9.7E-01 0.874 7.7E-03 0.876 5.3E-02 M16 0.956 6.2E-01 0.737 5.0E-05 0.771 4.2E-03 M17 0.924 5.2E-01 0.711 3.6E-03 0.769 2.4E-02 M18 0.960 7.2E-01 0.777 4.1E-03 0.809 5.7E-02 M19 0.901 3.8E-01 0.738 7.1E-03 0.819 9.2E-02 M20 0.941 4.9E-01 0.808 3.7E-03 0.858 7.3E-02 M21 0.943 5.8E-01 0.720 3.1E-04 0.763 1.1E-02 M22 0.949 6.7E-01 0.755 1.2E-02 0.795 5.1E-02 M23 0.948 6.1E-01 0.806 1.4E-02 0.851 1.1E-01 M24 0.925 5.4E-01 0.791 6.9E-02 0.856 2.3E-01 M25 1.018 8.7E-01 0.922 4.0E-01 0.906 3.6E-01 -
Table 42. Effect of Pathology State on Ethanolamine Phospholipid Ratios to M01 in Males Post Mortem Ctl, Male Post Mortem SDAT Male SDAT vs Control Metabolite Code Mean SEM Mean SEM Ratio ttest M01 1.000 0.000 1.000 0.000 1.000 #DIV/0! M02 0.367 0.029 0.290 0.029 0.791 0.076 M03 0.482 0.042 0.391 0.013 0.811 0.054 M04 0.143 0.031 0.076 0.009 0.529 0.052 M05 0.048 0.009 0.029 0.002 0.607 0.052 M06 0.080 0.014 0.046 0.003 0.581 0.033 M07 0.107 0.025 0.059 0.005 0.549 0.074 M08 0.024 0.005 0.012 0.001 0.511 0.037 M09 0.052 0.018 0.018 0.002 0.341 0.074 M10 0.337 0.038 0.269 0.013 0.798 0.107 M11 0.452 0.066 0.272 0.017 0.602 0.016 M12 0.819 0.130 0.616 0.024 0.753 0.143 M13 0.079 0.009 0.060 0.005 0.759 0.085 M14 0.212 0.039 0.115 0.010 0.542 0.026 M15 0.375 0.035 0.344 0.025 0.918 0.483 M16 0.792 0.128 0.627 0.047 0.791 0.240 M17 0.849 0.191 0.561 0.040 0.660 0.156 M18 0.085 0.011 0.056 0.004 0.656 0.018 M19 0.273 0.051 0.164 0.015 0.601 0.056 M20 0.254 0.027 0.187 0.009 0.737 0.028 M21 0.613 0.109 0.371 0.021 0.605 0.042 M22 1.890 0.379 1.199 0.083 0.634 0.092 M23 0.074 0.008 0.055 0.004 0.750 0.061 M24 0.241 0.039 0.142 0.011 0.588 0.025 M25 2.066 0.225 2.384 0.388 1.154 0.487 -
Table 43. Effect of Pathology State on Ethanolamine Phospholipid Ratios to M01 in Females Post Mortem Ctl, Female Post Mortem SDAT Female Autopsy AD vs. Control, Female Metabolite Code Mean SEM Mean SEM Ratio ttest M01 1.000 0.000 1.000 0.000 1.000 #DIV/0! M02 0.322 0.028 0.367 0.047 1.140 0.440 M03 0.400 0.022 0.361 0.023 0.902 0.237 M04 0.086 0.012 0.092 0.019 1.069 0.798 M05 0.040 0.003 0.032 0.005 0.809 0.225 M06 0.069 0.008 0.059 0.017 0.855 0.605 M07 0.102 0.016 0.077 0.013 0.752 0.242 M08 0.017 0.002 0.017 0.002 0.981 0.922 M09 0.033 0.005 0.024 0.003 0.725 0.133 M10 0.290 0.025 0.291 0.027 1.003 0.981 M11 0.384 0.044 0.364 0.057 0.950 0.797 M12 0.731 0.096 0.699 0.059 0.957 0.777 M13 0.061 0.008 0.069 0.007 1.122 0.489 M14 0.144 0.015 0.155 0.033 1.071 0.791 M15 0.339 0.021 0.301 0.027 0.889 0.297 M16 0.670 0.066 0.599 0.112 0.895 0.605 M17 0.697 0.063 0.591 0.082 0.848 0.329 M18 0.081 0.014 0.069 0.008 0.854 0.462 M19 0.211 0.017 0.180 0.018 0.853 0.230 M20 0.283 0.025 0.193 0.032 0.680 0.042 M21 0.624 0.079 0.421 0.127 0.674 0.203 M22 1.782 0.251 1.480 0.225 0.831 0.382 M23 0.073 0.011 0.060 0.006 0.816 0.275 M24 0.214 0.018 0.149 0.016 0.697 0.016 M25 1.382 0.214 1.767 0.221 1.279 0.229 -
Table 44. Effect of Dementia State on White and Gray Matter Scores in Males White Matter Score Gray Matter Score Cohort Mean SEM Mean SEM Cognitive Normal, Male -0.25 0.08 -0.44 0.11 SDAT_all, Male -0.63 0.06 -1.11 0.08 SDAT ADAS 5-19, Male -0.56 0.09 -1.00 0.13 SDAT, ADAS 20-39, Male -0.67 0.08 -1.11 0.10 SDAT, ADAS 40-70, Male -0.71 0.14 -1.45 0.16 Post Mortem Ctl, Male -0.44 0.13 -0.41 0.21 Post Mortem SDAT Male -1.62 0.19 -1.28 0.23 Comparison White Matter Score Gray Matter Score AD, All to CN, Male Delta -0.37 Delta -0.67 ttest 1.9E-03 ttest 2.4E-05 ADAS 5-19 to CN, Male Delta -0.31 Delta -0.56 ttest 1.8E-02 ttest 2.5E-03 ADAS 20-39 to CN, Male Delta -0.41 Delta -0.67 ttest 1.5E-03 ttest 7.8E-05 ADAS 40-70 to CN, Male Delta -0.46 Delta -1.01 ttest 3.7E-03 ttest 1.8E-06 ADAS 20-39 to 5-19, Male Delta -0.10 Delta -0.11 ttest 4.2E-01 ttest 5.0E-01 ADAS 40-70 to 5-19, Male Delta -0.15 Delta -0.45 ttest 3.9E-01 ttest 5.2E-02 ADAS 40-70 to 20-39, Male Delta -0.04 Delta -0.34 ttest 8.0E-01 ttest 1.1E-01 Autopsy AD vs. Control, Mal Delta -0.89 Delta -1.13 ttest 8.9E-03 ttest 2.8E-03 -
Table 45. Effect of Dementia State on White and Gray Matter Scores in Females White Matter Score Gray Matter Score Cohort Mean SEM Mean SEM Cognitive Normal, Female -0.27 0.09 -0.42 0.13 SDAT_all, Female -0.73 0.05 -1.01 0.07 SDAT, ADAS 5-19, Female -0.55 0.08 -0.85 0.11 SDAT, ADAS 20-39, Female -0.69 0.09 -0.94 0.11 SDAT, ADAS 40-70, Female -0.91 0.08 -1.21 0.12 Post Mortem Ctl, Female -0.50 0.29 -0.53 0.26 Post Mortem SDAT Female -1.34 0.27 -1.54 0.25 Comparison White Matter Score Gray Matter Score AD, All to CN, Female Delta -0.46 Delta -0.59 ttest 4.6E-05 ttest 1.1E-04 ADAS 5-19 to CN, Female Delta -0.29 Delta -0.43 ttest 1.7E-02 ttest 1.3E-02 ADAS 20-39 to CN, Female Delta -0.43 Delta -0.52 ttest 1.9E-03 ttest 3.6E-03 ADAS 40-70 to CN, Female Delta -0.64 Delta -0.79 ttest 9.5E-07 ttest 2.2E-05 ADAS 20-39 to 5-19, Female Delta -0.14 Delta -0.09 ttest 2.7E-01 ttest 5.8E-01 ADAS 40-70 to 5-19, Female Delta -0.36 Delta -0.37 ttest 2.9E-03 ttest 3.1E-02 ADAS 40-70 to 20-39, Female Delta -0.21 Delta -0.27 ttest 9.4E-02 ttest 1.0E-01 Autopsy AD vs. Control, Female Delta -1.17 Delta -0.81 ttest 2.0E-03 ttest 2.5E-02 -
Table 46. Distribution of White and Gray Matter Scores in Males (Mean Normalized to CN Male) White Matter Distribution MMSE ≥ 28 ADAS-cog 8-19 ADAS-cog 20-39 ADAS-cog 40-70 Autopsy Control Autopsy AD Bin Frequency Frequency Frequency Frequency Frequency Frequency -2 0 1 1 0 0 2 -1.75 0 0 0 0 0 0 -1.5 0 0 3 1 0 0 -1.25 0 2 4 0 0 1 -1 1 2 3 1 0 2 -0.75 1 3 3 4 0 2 -0.5 3 2 6 4 2 0 -0.25 3 8 13 4 3 1 0 7 13 12 0 2 1 0.25 9 6 5 1 2 1 0.5 5 1 5 2 0 0 0.75 1 0 1 0 1 0 1 2 0 2 1 0 0 More 0 2 0 0 0 0 Gray Matter distribution MMSE ≥ 28 ADAS-cog 8-19 ADAS-cog 20-39 ADAS-cog 40-70 Autopsy Control Autopsy AD Bin Frequency Frequency Frequency Frequency Frequency Frequency -2 0 1 4 2 0 2 -1.75 0 2 2 1 0 0 -1.5 0 1 3 0 0 0 -1.25 1 4 2 2 0 1 -1 0 6 7 4 0 2 -0.75 1 4 9 2 1 3 -0.5 7 3 5 4 1 1 -0.25 3 5 9 1 2 0 0 3 2 7 1 1 0 0.25 5 4 2 1 3 0 0.5 7 3 4 0 1 1 0.75 3 1 2 0 0 0 1 0 3 2 0 0 0 More 2 1 0 0 1 0 -
Table 47. Distribution of White and Gray Matter Scores in Females (Mean Normalized to CN Female) White Matter Distribution MMSE ≥ 28 ADAS-cog 8-19 ADAS-cog 20-39 ADAS-cog 40-70 Autopsy Control Autopsy AD Bin Frequency Frequency Frequency Frequency Frequency Frequency -2 0 0 0 1 0 1 -1.75 0 0 0 0 0 1 -1.5 0 0 3 4 1 3 -1.25 1 0 2 1 0 0 -1 1 2 8 4 0 3 -0.75 1 5 6 11 1 0 -0.5 2 6 6 10 1 1 -0.25 4 8 6 3 2 1 0 9 5 8 9 1 0 0.25 8 6 5 3 2 0 0.5 3 3 6 1 0 0 0.75 4 3 1 1 0 0 1 3 0 2 0 0 0 More 0 0 1 0 1 0 Gray Matter distribution MMSE ≥ 28 ADAS-cog 8-19 ADAS-cog 20-39 ADAS-cog 40-70 Autopsy Control Autopsy AD Bin Frequency Frequency Frequency Frequency Frequency Frequency -2 0 0 1 4 0 1 -1.75 0 1 2 1 0 1 -1.5 1 1 3 6 0 0 -1.25 2 2 4 6 0 0 -1 2 3 8 4 1 2 -0.75 1 5 6 5 0 1 -0.5 1 6 4 6 1 2 -0.25 5 6 7 3 2 0 0 4 5 4 3 2 2 0.25 6 3 6 6 2 1 0.5 5 2 2 1 0 0 0.75 3 1 2 2 0 0 1 3 2 2 0 0 0 More 3 1 3 1 1 0 -
Table 48. Effect of Age on White and Gray Matter Scores in Males White Matter Score Gray Matter Score Cohort Mean SEM Mean SEM Age Ctl, 30-39, Male -0.25 0.29 -0.92 0.28 Age Ctl, 40-49, Male -0.48 0.10 -1.28 0.14 Age Ctl, 50-59, Male -0.47 0.08 -0.90 0.11 Age Ctl, 60-69, Male -0.53 0.10 -0.84 0.14 Age Ctl, 70+ Male -0.43 0.09 -0.78 0.14 Comparison White Matter Score Gray Matter Score 50-59 vs. 40-49, Male Delta 0.01 Delta 0.38 ttest 9.4E-01 ttest 4.2E-02 60-69 vs. 40-49, Male Delta -0.05 Delta 0.45 ttest 7.4E-01 ttest 3.2E-02 70+ vs. 40-49, Male Delta 0.05 Delta 0.50 ttest 7.2E-01 ttest 1.4E-02 -
Table 49. Effect of Age on White and Gray Matter Scores in Females White Matter Score Gray Matter Score Cohort Mean SEM Mean SEM Age Ctl, 30-39, Female -0.36 0.18 -0.56 0.27 Age Ctl, 40-49, Female -0.33 0.10 -0.61 0.13 Age Ctl, 50-59, Female -0.55 0.06 -0.71 0.09 Age Ctl, 60-69, Female -0.62 0.09 -0.90 0.12 Age Ctl, 70+_Female -0.47 0.11 -0.58 0.14 Comparison White Matter Score Gray Matter Score 50-59 vs. 40-49, Female Delta -0.22 Delta -0.10 ttest 6.9E-02 ttest 5.4E-01 60-69 vs. 40-49, Female Delta -0.29 Delta -0.30 ttest 3.6E-02 ttest 1.1E-01 70+ vs. 40-49, Female Delta -0.14 Delta 0.03 ttest 3.7E-01 ttest 8.8E-01 -
Table 50. Risk prediction in Males Stats CN White Matter Score Control Normalized Low White Matter Score Control Normalized Moderate White Matter Score Control Normalized Severe White Matter Score Control Normalized PM Ctl White Matter Score Control Normalized PM SDAT White Matter Score Control Normalized Total N 32 40 58 18 10 10 Total L 27 30 38 8 8 3 Total H 5 10 20 10 2 7 L% 84.4 75.0 65.5 44.4 80.0 30.0 Gray Matter Score Control Normalized Gray Matter Score Control Normalized Gray Matter Score Control Normalized Gray Matter Score Control Normalized Gray Matter Score Control Normalized Gray Matter Score Control Normalized Total N 32 40 58 18 10 10 Total L 23 19 26 3 8 1 Total H 9 21 32 15 2 9 L% 71.9 47.5 44.8 16.7 80.0 10.0 Low risk LL 22 19 25 3 7 1 % LL 68.8 47.5 43.1 16.7 70.0 10.0 Intermediate risk IM 6 11 14 5 2 2 % IM 18.8 27.5 24.1 27.8 20.0 20.0 High risk HH 4 10 19 10 1 7 % HH 12.5 25.0 32.8 55.6 10.0 70.0 -
Table 51. Risk Prediction in Females Stats CN White Matter Score Control Normalized Low White Matter Score Control Normalized Moderate White Matter Score Control Normalized Severe White Matter Score Control Normalized PM Ctl White Matter Score Control Normalized PM SDAT White Matter Score Control Normalized Total N 36 38 54 48 9 10 Total L 31 25 29 17 6 1 Total H 5 13 25 31 3 9 L% 86.1 65.8 53.7 35.4 66.7 10.0 Gray Matter Score Control Normalized Gray Matter Score Control Normalized Gray Matter Score Control Normalized Gray Matter Score Control Normalized Gray Matter Score Control Normalized Gray Matter Score Control Normalized Total N 36 38 54 48 9 10 Total L 29 20 26 16 7 3 Total H 7 18 28 32 2 7 L% 80.6 52.6 48.1 33.3 77.8 30.0 Low risk LL 29 17 24 11 5 0 % LL 80.6 44.7 44.4 22.9 55.6 0.0 Intermediate risk IM 2 11 7 11 3 4 % IM 5.6 28.9 13.0 22.9 33.3 40.0 High risk HH 5 10 23 26 1 6 % HH 13.9 26.3 42.6 54.2 11.1 60.0 -
Table 52. Summary of key ratio and p-value statistics for EtnP1s 16:0/22:6 (M19) to PtdEt 16:0/18:0 (M01) serum ratio for males and females combined. Comparison Ratio T-test 60-69 to 50-59 0.75 1.2E-02 70-95 to 50-59 0.95 6.4E-01 CN to 50-59 1.07 4.8E-01 SDAT to 50-59 0.70 4.7E-07 70-95 to 60-69 1.26 6.9E-02 CN to 60-69 1.42 3.8E-04 SDAT to 70-95 0.74 1.3E-04 SDAT to CN 0.65 7.6E-11 ADAS 5-19 to CN 0.74 3.0E-04 ADAS 20-39 to CN 0.66 1.3E-07 ADAS 40-70 to CN 0.53 3.9E-11 ADAS 20-39 to ADAS 5-19 0.90 1.6E-01 ADAS 40-70 to ADAS 5-19 0.72 3.4E-04 ADAS 40-70 to ADAS 20-39 0.80 1.0E-02 Post-Mortem SDAT to Control* 0.55 4.7E-03 *ratio and p-value of EtnPls 16:0/22:6 alone. - 1. American Psychiatric Association. Diagnostic and Statistical Manual of Mental Disorders - Fourth Edition. Washington D.C.: American Psychiatric Association; 1994.
- 2. Canadian Study of Health and Aging Working Group. Canadian Study of Health and Aging: study methods and prevalence of dementia. CMAJ, 1994. 150: p. 899-913.
- 3. Cummings, J.L., and Benson, D.F. Dementia: a clinical approach. Stoneham MA: Butterworth, 1992.
- 4. Duguè, M., et al. Review of Dementia. Mt Sinai J Med, 2003. 72: p. 45-53.
- 5. McKhann, G., et al. Clinical diagnosis of Alzheimer's disease: report of the NINCDS-ADRDA Work Group under the auspices of Department of Health and Human Services Task Force on Alzheimer's Disease. Neurology, 1984. 34: p. 939-44.
- 6. McKeith, I.G., et al. Consensus guidelines for the clinical and pathologic diagnosis of dementia with Lewy bodies (DLB): report of the consortium on DLB internal workshop. Neurology, 1996. 47: p. 1113-24.
- 7. Neary, D., et al. Frontotemporal lobar degeneration: a consensus on clinical diagnostic criteria. Neurology, 1998. 51: p. 1546-54.
- 8. Polvikoski, T., et al. Prevalence of Alzheimer's disease in very elderly people: a prospective neuropathological study. Neurology, 2001. 56: p. 1690-6.
- 9. Lee, V.M.Y., et al. Neurodengerative tauopathies. Annu Rev Neurosci, 2001. 24: p. 1121-59.
- 10. Morishima-Kawashima, M. and Ihara, Y. Alzheimer's disease: β-Amyloid protein and tau. J Neurosci Res, 2002. 70: p. 392-410
- 11. Morris, J.C., et al. Very mild Alzheimer's disease: informant-based clinical, psychometric, and pathological distinction from normal aging. Neurology, 1991. 41: p. 469-78.
- 12. Price, J.L. et al. The distribution of tangles, plaques and related immunohistochemical markers in healthy aging and Alzheimer's disease. Neurobiol Aging, 1991. 12: p. 295-312.
- 13. Price, J.L., and Morris, J.C. Tangles and plaques in nondemented aging and "preclinical" Alzheimer's disease. Ann Neurol, 1999. 45: p. 358-68.
- 14. Price, J.L., et al. Neuron number in the entorhinal cortex and CA1 in preclinical Alzheimer disease. Arch Neurol, 2001. 58: p. 1395-402.
- 15. Petersen, R.C., et al. Mild cognitive impairment: clinical characterization and outcome. Arch Neurol, 1999. 56: p. 303-8.
- 16. Bennett, D.A., et al. Natural history of mild cognitive impairment in older persons. Neurology, 2002. 59: p. 198-205.
- 17. Growdon, J.H., et al. Application of the National Institute on Aging (NIA)-Reagan Institute criteria for the neuropathological diagnosis of Alzheimer disease. J Neuropathol Exp Neurol, 1999. 58: p. 1147-55.
- 18. Reo, N.V., NMR-based metabolomics. Drug Chem Toxicol, 2002. 25(4): p. 375-82.
- 19. Fiehn, O., et al. Metabolite profiling for plant functional genomics. Nat Biotechnol, 2000. 18(11): p. 1157-61.
- 20. Viani, P., et al., Effect of endothelin-1 induced ischemia on peroxidative damge and membrane properties in rat striatum synaptosomes. Neurochem Res, 1995. 20: p. 689-95.
- 21. Zhang, J.-P., Sun, G.Y. Free fatty acids, neutral glycerides, and phosphoglycerides in transient focal cerebral ischemia. J Neurochem, 1995. 64: p. 1688095.
- 22. Demediuk, P., et al. Membrane lipd changes in laminectomized and traumatized cat spinal cord. Proc Natl Acad Sci U S A, 1985. 82: p. 7071-5.
- 23. Wells, K., et al., Neural membrane phospholipids in Alzheimer disease. Neurochem Res, 1995. 20: p. 1329-33.
- 24. Ginsberg, L., et al., Disease and anatomic specificity of ethanolamine plasmalogen deficiency in Alzheimer's disease brain. Brain Res, 1995. 698: 223-6.
- 25. Ginsberg, L., Xuereb, J.H. Gershfeld, N.L. Membrane instability, plasmalogen content, and Alzheimer's disease. J Neurochem, 1998. 70: p. 2533-8.
- 26. Guan, Z., et al. Decrease and structural modifications of phosphatidylethanolamine plasmalogen in the brain with Alzheimer disease. J Neuropathol Exp Neurol, 1999. 58: 740-7.
- 27. Pettegrew, J.W., et al., Brain membrane phospholipid alterations in Alzheimer's disease. Neurochem Res, 2001. 26: p. 771-82.
- 28. Graham, D.P., et al. The alzheimer's disease assessment scale - cognitive subscale: normative date for older adult controls. Alzheimer Dis Assoc Disord, 2004. 18: p. 236-40.
- 29. Emre, M., Dementia associated with Parkinson's disease. Lancet Neurol, 2003. 2(4): p. 229-37.
- 30. Hager, J.W., et al., High-performance liquid chromatography-tandem mass spectrometry with a new quadrupole/linear ion trap instrument. J Chromatogr A, 2003. 1020(1): p. 3-9.
- 31. Hopfgartner, G., et al., Triple quadrupole linear ion trap mass spectrometer for the analysis of small molecules and macromolecules. J Mass Spectrom, 2004. 39(8): p. 845-55.
- 32. Xia, Y.Q., et al., Use of a quadrupole linear ion trap mass spectrometer in metabolite identification and bioanalysis. Rapid Commun Mass Spectrom, 2003. 17(11): p. 1137-45.
- 33. Zhang, M.Y., et al., Hybrid triple quadrupole-linear ion trap mass spectrometry in fragmentation mechanism studies: application to structure elucidation of buspirone and one of its metabolites. J Mass Spectrom, 2005. 40(8): p. 1017-1029.
- 34. Cummings, J.L., Kaufer, D. Neuropsychiatric aspects of Alzheimer's disease: the cholinergic hypothesis revisited. Neurology, 1996. 47(4): p. 876-83.
Claims (19)
- A method for diagnosing dementia or the risk of dementia in a patient, the method comprising the steps of:a) analyzing a blood sample from said patient to obtain quantifying data for one or more than one metabolite marker;b) comparing the quantifying data for said one or more than one metabolite marker to corresponding data obtained for one or more than one reference sample to identify an increase or decrease in the level of said one or more than one metabolite marker in said blood sample; andc) using said increase or decrease in the level of said one or more than one metabolite marker in said blood sample to diagnose dementia or the risk of dementia in said patient,wherein the one or more than one metabolite marker comprises one or more molecule selected from the group consisting of: plasmenylethanolamine, plasmanylethanolamine, and combinations thereof.
- The method of claim 1, wherein the plasmanylethanolamine is selected from the group consisting of: plasmanyl 16:0/18:1, plasmanyl 16:0/18:2, plasmanyl 16:0/20:4, plasmanyl 16:0/22:4, plasmanyl 16:0/22:6, plasmanyl 18:0/18:1, plasmanyl 18:0/18:2, plasmanyl 18:0/20:4, plasmanyl 18:0/22:4, plasmanyl 18:0/22:6, and combinations thereof.
- The method of claim 1, wherein the plasmenylethanolamine is selected from the group consisting of: plasmenyl 16:0/18:1, plasmenyl 16:0/18:2, plasmenyl 16:0/20:4, plasmenyl 16:0/22:4, plasmenyl 16:0/22:6, plasmenyl 18:0/18:1, plasmenyl 18:0/18:2, plasmenyl 18:0/20:4, plasmenyl 18:0/22:4, plasmenyl 18:0/22:6, and combinations thereof.
- The method of any one of claims 1 to 3, wherein diagnosing dementia or the risk of dementia in a patient comprises diagnosing a patient's Alzheimer's disease health state or change in health state, Alzheimer's disease, non-Alzheimer's disease dementia, cognitive impairment, the risk of Alzheimer's disease, the risk of cognitive impairment, or the risk of non-Alzheimer's disease dementia in a patient
- The method of any one of claims 1 to 4, wherein step a) comprises analyzing the blood sample by mass spectrometry to obtain the quantifying data using a Fourier transform ion cyclotron resonance, time of flight, orbitrap, quadrupole or triple quadrupole mass spectrometer.
- The method of claim 5, wherein the mass spectrometer is equipped with a chromatographic system.
- The method any one of claims 1 to 6, wherein the blood sample is a blood serum sample.
- The method of any one of claims 1 to 7, wherein a liquid/liquid extraction is performed on the blood sample whereby non-polar metabolites are dissolved in an organic solvent and polar metabolites are dissolved in an aqueous solvent.
- The method of claim 8, wherein the extracted samples are analyzed by positive or negative electrospray ionization (ESI) or positive or negative atmospheric pressure chemical ionization (APCI).
- The method of claim 8 or 9, wherein the extracted samples are analyzed by MS/MS transition.
- The method of claim 8 or 9, wherein the extracted samples are analyzed by extracted ion chromatography and MS/MS transition.
- The method of any one of claims I to 11, wherein said one or more than one reference sample isa) one or more than one reference sample obtained from a non-demented control individual;b) one or more than one reference sample obtained from a demented subject;c) one or more than one reference sample obtained from a subject pathologically diagnosed as having Alzheimer's Disease;d) one or more than one reference sample obtained from a subject clinically diagnosed as having Alzheimer's Disease;e) one or more than one reference sample obtained from a patient with cognitive impairment as measured by the Alzheimer's Disease Assessment Scale-cognitive subset (ADAS-cog);f) one or more than one reference sample obtained from a patient with cognitive impairment as measured by the Folstein's Mini-Mental State Exam (MMSE); org) any combination of a) to f) thereof.
- The method of any one of claims 1 to 12, further comprising:analyzing a blood sample to obtain quantifying data for one or more than one internal control metabolite; andobtaining a ratio for each of the levels of said one or more than one metabolite marker to the level obtained for the one or more than one internal control metabolite;wherein the comparing step (b) comprises comparing each ratio to one or more corresponding ratios obtained for the one or more than one reference sample.
- The method of claim 13, wherein the one or more than one internal control metabolite includes a phosphatidylethanolamine 16:0/18:0.
- The method of any one of claims 1 to 14, wherein a decrease in the level of said one or more than one metabolite marker in said blood sample is identified in the comparing step (b).
- The method of claim 2 or 3, wherein a liquid/liquid extraction is performed on the blood sample whereby non-polar metabolites are dissolved in an organic solvent and polar metabolites are dissolved in an aqueous solvent, and the extracted samples are analyzed by MS/MS transition, whereby:the MS/MS transitions for the phosphatidylethanolamines are 718.0 / 255.0, 716.0 / 255.0, 746.0 / 283.0 and 744.0 / 283.0, respectively;the MS/MS transitions for the plasmanylethanolamines are 702.0 / 281.0, 700.0 / 279.0, 724.0 / 303.0, 752.0 / 331.0, 748.0 / 327.0, 730.0 / 281.0, 728.0 / 279.0, 752.0 / 303.0, 780.0 / 331.0 and 776.0 / 327.0, respectively; andthe MS/MS transitions for the plasmenylethanolamines are 700.0 / 281.0, 698.0 / 279.0, 722.0 / 303.0, 750.0 / 331.0, 746.0 / 327.0, 728.0 / 281.0, 726.0 / 279.0, 750.6 / 303.2, 778.0 / 331.0 and 774.0 / 327.0, respectively.
- The method of any one of claims 1 to 16, wherein said diagnosing of the patient's Alzheimer's disease health state or change in health state further comprises evaluating the efficacy of a therapy for treating Alzheimer's disease, dementia or cognitive impairment in a patient.
- The method of claim 17, wherein at least one of said one or more than one reference sample defined in step b) is one or more than one pre-therapy baseline sample obtained from the patient.
- The method of claim 17 or 18, wherein evaluating the efficacy of the therapy includes determining whether the therapy is improving the demented state of the patient.
Priority Applications (2)
| Application Number | Priority Date | Filing Date | Title |
|---|---|---|---|
| EP14187832.2A EP2851369A3 (en) | 2006-02-28 | 2007-02-28 | Methods for the diagnosis of dementia and other neurological disorders |
| EP10195818A EP2322531A3 (en) | 2006-02-28 | 2007-02-28 | Methods for the diagnosis of dementia and other neurological disorders |
Applications Claiming Priority (4)
| Application Number | Priority Date | Filing Date | Title |
|---|---|---|---|
| US77729006P | 2006-02-28 | 2006-02-28 | |
| US80477906P | 2006-06-14 | 2006-06-14 | |
| US88888307P | 2007-02-08 | 2007-02-08 | |
| PCT/CA2007/000313 WO2007098585A1 (en) | 2006-02-28 | 2007-02-28 | Methods for the diagnosis of dementia and other neurological disorders |
Related Child Applications (2)
| Application Number | Title | Priority Date | Filing Date |
|---|---|---|---|
| EP14187832.2A Division EP2851369A3 (en) | 2006-02-28 | 2007-02-28 | Methods for the diagnosis of dementia and other neurological disorders |
| EP10195818.9 Division-Into | 2010-12-17 |
Publications (3)
| Publication Number | Publication Date |
|---|---|
| EP1922325A1 EP1922325A1 (en) | 2008-05-21 |
| EP1922325A4 EP1922325A4 (en) | 2009-05-27 |
| EP1922325B1 true EP1922325B1 (en) | 2011-11-30 |
Family
ID=38458611
Family Applications (3)
| Application Number | Title | Priority Date | Filing Date |
|---|---|---|---|
| EP10195818A Ceased EP2322531A3 (en) | 2006-02-28 | 2007-02-28 | Methods for the diagnosis of dementia and other neurological disorders |
| EP14187832.2A Withdrawn EP2851369A3 (en) | 2006-02-28 | 2007-02-28 | Methods for the diagnosis of dementia and other neurological disorders |
| EP07710657A Active EP1922325B1 (en) | 2006-02-28 | 2007-02-28 | Methods for the diagnosis of dementia and other neurological disorders |
Family Applications Before (2)
| Application Number | Title | Priority Date | Filing Date |
|---|---|---|---|
| EP10195818A Ceased EP2322531A3 (en) | 2006-02-28 | 2007-02-28 | Methods for the diagnosis of dementia and other neurological disorders |
| EP14187832.2A Withdrawn EP2851369A3 (en) | 2006-02-28 | 2007-02-28 | Methods for the diagnosis of dementia and other neurological disorders |
Country Status (11)
| Country | Link |
|---|---|
| US (2) | US8304246B2 (en) |
| EP (3) | EP2322531A3 (en) |
| JP (3) | JP5496513B2 (en) |
| KR (1) | KR20080104350A (en) |
| AT (1) | ATE535535T1 (en) |
| AU (1) | AU2007219666A1 (en) |
| CA (2) | CA2640748C (en) |
| HK (1) | HK1208467A1 (en) |
| IL (1) | IL193426A0 (en) |
| NZ (1) | NZ570413A (en) |
| WO (1) | WO2007098585A1 (en) |
Families Citing this family (39)
| Publication number | Priority date | Publication date | Assignee | Title |
|---|---|---|---|---|
| EP2620147B1 (en) | 2007-02-08 | 2020-06-03 | Med-Life Discoveries LP | Compounds for lowering cholesterol |
| CA2680748C (en) * | 2007-04-13 | 2012-08-28 | Phenomenome Discoveries Inc. | Methods for the diagnosis and risk assessment of plasmalogen deficiency mediated diseases of aging |
| JP5306345B2 (en) * | 2007-07-26 | 2013-10-02 | フェノメノーム ディスカバリーズ インク | Methods for diagnosing, assessing risk and monitoring autism spectrum disorders |
| EP3358354B1 (en) | 2008-01-18 | 2020-07-15 | President and Fellows of Harvard College | Methods of detecting signatures of disease or conditions in bodily fluids |
| US9965035B2 (en) | 2008-05-13 | 2018-05-08 | Apple Inc. | Device, method, and graphical user interface for synchronizing two or more displays |
| US9121844B1 (en) * | 2008-09-09 | 2015-09-01 | Sociedad Europea de Analisis Diferencial de Movilidad | Method to analyze and classify persons and organisms based on odor patterns from released vapors |
| TWI475989B (en) | 2008-12-22 | 2015-03-11 | Phenomenome Discoveries Inc | Plasmalogen compounds, pharmaceutical compositions containing the same and methods for treating diseases of the aging |
| EP3124980A1 (en) | 2009-10-01 | 2017-02-01 | Phenomenome Discoveries Inc. | Mass spectrophotometric method to diagnose pancreatic cancer |
| US20130203624A1 (en) | 2010-07-23 | 2013-08-08 | President And Fellows Of Harvard College | Methods of Detecting Prenatal or Pregnancy-Related Diseases or Conditions |
| MX382244B (en) | 2010-07-23 | 2025-03-13 | Harvard College | Methods for detecting signatures of disease or conditions in bodily fluids |
| CA2806293A1 (en) | 2010-07-23 | 2012-01-26 | President And Fellows Of Harvard College | Methods of detecting autoimmune or immune-related diseases or conditions |
| SG10201505724SA (en) | 2010-07-23 | 2015-09-29 | Harvard College | Methods of detecting diseases or conditions using phagocytic cells |
| JP6025568B2 (en) * | 2010-12-28 | 2016-11-16 | 株式会社藤野ブレインリサーチ | Test method to determine dementia by blood sample |
| WO2013071412A1 (en) * | 2011-11-17 | 2013-05-23 | Phenomenome Discoveries Inc. | Methods for the synthesis of 13c labeled plasmalogen |
| WO2013119651A1 (en) * | 2012-02-08 | 2013-08-15 | Nestec Sa | Methods for diagnosing cognitive impairment |
| US20150031572A1 (en) * | 2012-02-15 | 2015-01-29 | Basf Se | Means and methods for assessing neuronal toxicity |
| CN104246781B (en) * | 2012-03-29 | 2019-06-14 | 皇家飞利浦有限公司 | Systems and methods for improving neurologists' workflow regarding Alzheimer's disease |
| CN104603289A (en) | 2012-06-15 | 2015-05-06 | 哈里·斯泰利 | Methods of detecting a disease or condition |
| SG11201408383SA (en) | 2012-06-15 | 2015-01-29 | Harry Stylli | Methods of detecting diseases or conditions using circulating diseased cells |
| WO2014164362A1 (en) | 2013-03-09 | 2014-10-09 | Harry Stylli | Methods of detecting prostate cancer |
| EP4202441A3 (en) | 2013-03-09 | 2023-07-26 | Immunis.AI, Inc. | Gene expression profile in macrophages for the diagnosis of cancer |
| WO2014197339A1 (en) | 2013-06-08 | 2014-12-11 | Apple Inc. | Device, method, and graphical user interface for synchronizing two or more displays |
| CN105723223B (en) * | 2013-11-14 | 2019-04-09 | 雀巢产品技术援助有限公司 | Lipid biomarkers predicting healthy aging |
| US20160235778A1 (en) * | 2014-03-13 | 2016-08-18 | Massachusetts Institute Of Technology | Compositions containing pufa, uridine and choline and methods of use thereof |
| US10626464B2 (en) | 2014-09-11 | 2020-04-21 | Cell Mdx, Llc | Methods of detecting prostate cancer |
| US10006925B2 (en) | 2016-05-30 | 2018-06-26 | Universal Diagnostics, S. L. | Methods and systems for metabolite and/or lipid-based detection of colorectal cancer and/or adenomatous polyps |
| GB201611596D0 (en) * | 2016-07-04 | 2016-08-17 | British American Tobacco Investments Ltd | Apparatus and method for classifying a tobacco sample into one of a predefined set of taste categories |
| WO2018157013A1 (en) * | 2017-02-24 | 2018-08-30 | Duke University | Compositions and methods related to sex-specific metabolic drivers in alzheimer's disease |
| WO2019060298A1 (en) | 2017-09-19 | 2019-03-28 | Neuroenhancement Lab, LLC | Method and apparatus for neuroenhancement |
| US11717686B2 (en) | 2017-12-04 | 2023-08-08 | Neuroenhancement Lab, LLC | Method and apparatus for neuroenhancement to facilitate learning and performance |
| US12280219B2 (en) | 2017-12-31 | 2025-04-22 | NeuroLight, Inc. | Method and apparatus for neuroenhancement to enhance emotional response |
| US11318277B2 (en) | 2017-12-31 | 2022-05-03 | Neuroenhancement Lab, LLC | Method and apparatus for neuroenhancement to enhance emotional response |
| US11364361B2 (en) | 2018-04-20 | 2022-06-21 | Neuroenhancement Lab, LLC | System and method for inducing sleep by transplanting mental states |
| WO2019246239A1 (en) | 2018-06-19 | 2019-12-26 | Ellipsis Health, Inc. | Systems and methods for mental health assessment |
| US20190385711A1 (en) | 2018-06-19 | 2019-12-19 | Ellipsis Health, Inc. | Systems and methods for mental health assessment |
| SG11202100147VA (en) * | 2018-07-13 | 2021-02-25 | Pst Inc | Apparatus for estimating mental/neurological disease |
| CN113382683A (en) | 2018-09-14 | 2021-09-10 | 纽罗因恒思蒙特实验有限责任公司 | System and method for improving sleep |
| US11786694B2 (en) | 2019-05-24 | 2023-10-17 | NeuroLight, Inc. | Device, method, and app for facilitating sleep |
| WO2022263927A2 (en) * | 2021-06-17 | 2022-12-22 | Phoska Biopharma Pte. Ltd. | Plasmalogen derivatives and uses thereof |
Family Cites Families (14)
| Publication number | Priority date | Publication date | Assignee | Title |
|---|---|---|---|---|
| WO1994009371A1 (en) * | 1992-10-09 | 1994-04-28 | Massachusetts Institute Of Technology | Antemortem diagnostic test for alzheimer's disease |
| US5731354A (en) | 1996-05-06 | 1998-03-24 | Clarion Pharmaceuticals Inc. | Treatment for the inhibition of neuro-degenerative disease states |
| US6177476B1 (en) | 1998-08-27 | 2001-01-23 | Clarion Pharmaceuticals Inc. | Nutritional supplements for replenishing plasmalogens |
| CA2298181C (en) | 2000-02-02 | 2006-09-19 | Dayan Burke Goodnough | Non-targeted complex sample analysis |
| JP2003530130A (en) | 2000-04-14 | 2003-10-14 | メタボロン インコーポレイテッド | Methods for drug discovery, disease treatment and diagnosis using metabolomics |
| EP1317765A2 (en) | 2000-09-08 | 2003-06-11 | Oxford GlycoSciences (UK) Limited | Automated identification of peptides |
| DE10291524D2 (en) * | 2001-04-06 | 2004-07-01 | Anker Thorsten | Methods for the detection of chronic dementia diseases, associated peptides and detection reagents |
| EP1389306A2 (en) | 2001-05-09 | 2004-02-18 | BioVisioN AG | Method for detecting progredient chronic dementia, and corresponding peptides and detection reagents |
| DE60333608D1 (en) | 2002-08-23 | 2010-09-09 | Bayer Schering Pharma Ag | Biomarker for the diagnosis of Alzheimer's |
| EP2369348A1 (en) * | 2003-11-07 | 2011-09-28 | Ciphergen Biosystems, Inc. | Biomarkers for Alzheimer's disease |
| WO2005085838A2 (en) * | 2004-03-02 | 2005-09-15 | Vanderbilt University | Computational analysis of mass spectroscopic lipid data |
| WO2005116659A2 (en) | 2004-05-18 | 2005-12-08 | Neurodx, Llc | Compositions and methods relating to alzheimer’s disease |
| JP4176749B2 (en) * | 2005-07-29 | 2008-11-05 | 学校法人帝京大学 | Disease testing method |
| US8026099B2 (en) * | 2007-07-26 | 2011-09-27 | Washington University | Lipid profile as a biomarker for early detection of neurological disorders |
-
2007
- 2007-02-28 EP EP10195818A patent/EP2322531A3/en not_active Ceased
- 2007-02-28 CA CA2640748A patent/CA2640748C/en active Active
- 2007-02-28 AU AU2007219666A patent/AU2007219666A1/en not_active Abandoned
- 2007-02-28 WO PCT/CA2007/000313 patent/WO2007098585A1/en not_active Ceased
- 2007-02-28 AT AT07710657T patent/ATE535535T1/en active
- 2007-02-28 US US12/280,920 patent/US8304246B2/en active Active
- 2007-02-28 KR KR1020087023687A patent/KR20080104350A/en not_active Withdrawn
- 2007-02-28 EP EP14187832.2A patent/EP2851369A3/en not_active Withdrawn
- 2007-02-28 EP EP07710657A patent/EP1922325B1/en active Active
- 2007-02-28 CA CA2689848A patent/CA2689848A1/en not_active Abandoned
- 2007-02-28 NZ NZ570413A patent/NZ570413A/en unknown
- 2007-02-28 JP JP2008556622A patent/JP5496513B2/en active Active
-
2008
- 2008-08-08 HK HK15109254.5A patent/HK1208467A1/en unknown
- 2008-08-13 IL IL193426A patent/IL193426A0/en unknown
-
2012
- 2012-07-31 JP JP2012169181A patent/JP2012255793A/en active Pending
- 2012-09-25 US US13/626,703 patent/US20130110408A1/en not_active Abandoned
-
2014
- 2014-06-26 JP JP2014131876A patent/JP2014197018A/en active Pending
Also Published As
| Publication number | Publication date |
|---|---|
| HK1208467A1 (en) | 2016-03-04 |
| EP1922325A1 (en) | 2008-05-21 |
| EP2322531A3 (en) | 2011-09-07 |
| CA2640748A1 (en) | 2007-09-07 |
| NZ570413A (en) | 2011-07-29 |
| EP2322531A2 (en) | 2011-05-18 |
| IL193426A0 (en) | 2009-05-04 |
| US20130110408A1 (en) | 2013-05-02 |
| JP5496513B2 (en) | 2014-05-21 |
| US8304246B2 (en) | 2012-11-06 |
| US20100003761A1 (en) | 2010-01-07 |
| EP2851369A3 (en) | 2015-06-17 |
| CA2689848A1 (en) | 2007-09-07 |
| JP2009528517A (en) | 2009-08-06 |
| CA2640748C (en) | 2010-04-20 |
| EP1922325A4 (en) | 2009-05-27 |
| EP2851369A2 (en) | 2015-03-25 |
| WO2007098585A1 (en) | 2007-09-07 |
| AU2007219666A1 (en) | 2007-09-07 |
| KR20080104350A (en) | 2008-12-02 |
| HK1113160A1 (en) | 2008-09-26 |
| JP2014197018A (en) | 2014-10-16 |
| JP2012255793A (en) | 2012-12-27 |
| ATE535535T1 (en) | 2011-12-15 |
Similar Documents
| Publication | Publication Date | Title |
|---|---|---|
| US8304246B2 (en) | Methods for the diagnosis of dementia and other neurological disorders | |
| US8026099B2 (en) | Lipid profile as a biomarker for early detection of neurological disorders | |
| González-Domínguez et al. | Using direct infusion mass spectrometry for serum metabolomics in Alzheimer’s disease | |
| Burgess et al. | Metabolome-wide association study of primary open angle glaucoma | |
| JP5977795B2 (en) | Biomarker and method for diagnosing multiple sclerosis | |
| EP3028049B1 (en) | Diagnostic tools for alzheimer's disease | |
| JP2022534288A (en) | Quantification of antidepressants by mass spectrometry | |
| US8273575B2 (en) | Methods for the diagnosis, risk assessment, and monitoring of autism spectrum disorders | |
| JP2013525801A (en) | Metabolic biomarkers of autism | |
| Xu et al. | Spatially and temporally probing distinctive glycerophospholipid alterations in Alzheimer’s disease mouse brain via high-resolution ion mobility-enabled sn-position resolved lipidomics | |
| Iriondo et al. | Isopropanol extraction for cerebrospinal fluid lipidomic profiling analysis | |
| Mill et al. | Recent advances in understanding of Alzheimer’s disease progression through mass spectrometry-based metabolomics | |
| EP3267200A1 (en) | Biomarker of dementia with lewy bodies | |
| CN101395163A (en) | Methods of diagnosing dementia and other neurological disorders | |
| AU2016206360B2 (en) | Methods for the diagnosis of dementia and other neurological disorders | |
| HK1113160B (en) | Methods for the diagnosis of dementia and other neurological disorders | |
| HK1154013A (en) | Methods for the diagnosis of dementia and other neurological disorders | |
| EP4370931B1 (en) | Biomarkers for alzheimer's disease | |
| US20200191804A1 (en) | Diagnosing and treating alzheimer's disease | |
| Huang | Mass Spectrometry-Based Metabolomics: Platform Development and Application to Neurodegenerative Disease | |
| Ramezani | Liquid Chromatography Coupled To Mass Spectrometry Reveals That Aging Affects Lipid Droplet Composition | |
| HK1184435A (en) | Biomarkers for diagnosing multiple sclerosis, and methods thereof |
Legal Events
| Date | Code | Title | Description |
|---|---|---|---|
| PUAI | Public reference made under article 153(3) epc to a published international application that has entered the european phase |
Free format text: ORIGINAL CODE: 0009012 |
|
| 17P | Request for examination filed |
Effective date: 20080328 |
|
| AK | Designated contracting states |
Kind code of ref document: A1 Designated state(s): AT BE BG CH CY CZ DE DK EE ES FI FR GB GR HU IE IS IT LI LT LU LV MC NL PL PT RO SE SI SK TR |
|
| REG | Reference to a national code |
Ref country code: HK Ref legal event code: DE Ref document number: 1113160 Country of ref document: HK |
|
| A4 | Supplementary search report drawn up and despatched |
Effective date: 20090429 |
|
| RIC1 | Information provided on ipc code assigned before grant |
Ipc: G01N 33/483 20060101ALI20090423BHEP Ipc: G01N 33/68 20060101ALI20090423BHEP Ipc: C07F 9/09 20060101AFI20070927BHEP Ipc: G01N 27/00 20060101ALI20090423BHEP Ipc: G01N 37/00 20060101ALI20090423BHEP |
|
| 17Q | First examination report despatched |
Effective date: 20090717 |
|
| GRAP | Despatch of communication of intention to grant a patent |
Free format text: ORIGINAL CODE: EPIDOSNIGR1 |
|
| DAX | Request for extension of the european patent (deleted) | ||
| GRAS | Grant fee paid |
Free format text: ORIGINAL CODE: EPIDOSNIGR3 |
|
| GRAA | (expected) grant |
Free format text: ORIGINAL CODE: 0009210 |
|
| AK | Designated contracting states |
Kind code of ref document: B1 Designated state(s): AT BE BG CH CY CZ DE DK EE ES FI FR GB GR HU IE IS IT LI LT LU LV MC NL PL PT RO SE SI SK TR |
|
| REG | Reference to a national code |
Ref country code: GB Ref legal event code: FG4D Ref country code: CH Ref legal event code: EP |
|
| RIN1 | Information on inventor provided before grant (corrected) |
Inventor name: GOODENOWE, DAYAN Inventor name: COOK, LISA |
|
| REG | Reference to a national code |
Ref country code: IE Ref legal event code: FG4D |
|
| REG | Reference to a national code |
Ref country code: DE Ref legal event code: R082 Ref document number: 602007019067 Country of ref document: DE |
|
| REG | Reference to a national code |
Ref country code: NL Ref legal event code: T3 Ref country code: CH Ref legal event code: NV Representative=s name: VOSSIUS & PARTNER |
|
| REG | Reference to a national code |
Ref country code: DE Ref legal event code: R096 Ref document number: 602007019067 Country of ref document: DE Effective date: 20120308 |
|
| REG | Reference to a national code |
Ref country code: SE Ref legal event code: TRGR |
|
| REG | Reference to a national code |
Ref country code: HK Ref legal event code: GR Ref document number: 1113160 Country of ref document: HK |
|
| LTIE | Lt: invalidation of european patent or patent extension |
Effective date: 20111130 |
|
| PG25 | Lapsed in a contracting state [announced via postgrant information from national office to epo] |
Ref country code: LT Free format text: LAPSE BECAUSE OF FAILURE TO SUBMIT A TRANSLATION OF THE DESCRIPTION OR TO PAY THE FEE WITHIN THE PRESCRIBED TIME-LIMIT Effective date: 20111130 Ref country code: IS Free format text: LAPSE BECAUSE OF FAILURE TO SUBMIT A TRANSLATION OF THE DESCRIPTION OR TO PAY THE FEE WITHIN THE PRESCRIBED TIME-LIMIT Effective date: 20120330 |
|
| PG25 | Lapsed in a contracting state [announced via postgrant information from national office to epo] |
Ref country code: LV Free format text: LAPSE BECAUSE OF FAILURE TO SUBMIT A TRANSLATION OF THE DESCRIPTION OR TO PAY THE FEE WITHIN THE PRESCRIBED TIME-LIMIT Effective date: 20111130 Ref country code: BE Free format text: LAPSE BECAUSE OF FAILURE TO SUBMIT A TRANSLATION OF THE DESCRIPTION OR TO PAY THE FEE WITHIN THE PRESCRIBED TIME-LIMIT Effective date: 20111130 Ref country code: GR Free format text: LAPSE BECAUSE OF FAILURE TO SUBMIT A TRANSLATION OF THE DESCRIPTION OR TO PAY THE FEE WITHIN THE PRESCRIBED TIME-LIMIT Effective date: 20120301 Ref country code: PT Free format text: LAPSE BECAUSE OF FAILURE TO SUBMIT A TRANSLATION OF THE DESCRIPTION OR TO PAY THE FEE WITHIN THE PRESCRIBED TIME-LIMIT Effective date: 20120330 Ref country code: SI Free format text: LAPSE BECAUSE OF FAILURE TO SUBMIT A TRANSLATION OF THE DESCRIPTION OR TO PAY THE FEE WITHIN THE PRESCRIBED TIME-LIMIT Effective date: 20111130 |
|
| PG25 | Lapsed in a contracting state [announced via postgrant information from national office to epo] |
Ref country code: CY Free format text: LAPSE BECAUSE OF FAILURE TO SUBMIT A TRANSLATION OF THE DESCRIPTION OR TO PAY THE FEE WITHIN THE PRESCRIBED TIME-LIMIT Effective date: 20111130 |
|
| PG25 | Lapsed in a contracting state [announced via postgrant information from national office to epo] |
Ref country code: CZ Free format text: LAPSE BECAUSE OF FAILURE TO SUBMIT A TRANSLATION OF THE DESCRIPTION OR TO PAY THE FEE WITHIN THE PRESCRIBED TIME-LIMIT Effective date: 20111130 Ref country code: SK Free format text: LAPSE BECAUSE OF FAILURE TO SUBMIT A TRANSLATION OF THE DESCRIPTION OR TO PAY THE FEE WITHIN THE PRESCRIBED TIME-LIMIT Effective date: 20111130 Ref country code: DK Free format text: LAPSE BECAUSE OF FAILURE TO SUBMIT A TRANSLATION OF THE DESCRIPTION OR TO PAY THE FEE WITHIN THE PRESCRIBED TIME-LIMIT Effective date: 20111130 Ref country code: EE Free format text: LAPSE BECAUSE OF FAILURE TO SUBMIT A TRANSLATION OF THE DESCRIPTION OR TO PAY THE FEE WITHIN THE PRESCRIBED TIME-LIMIT Effective date: 20111130 Ref country code: BG Free format text: LAPSE BECAUSE OF FAILURE TO SUBMIT A TRANSLATION OF THE DESCRIPTION OR TO PAY THE FEE WITHIN THE PRESCRIBED TIME-LIMIT Effective date: 20120229 |
|
| PG25 | Lapsed in a contracting state [announced via postgrant information from national office to epo] |
Ref country code: RO Free format text: LAPSE BECAUSE OF FAILURE TO SUBMIT A TRANSLATION OF THE DESCRIPTION OR TO PAY THE FEE WITHIN THE PRESCRIBED TIME-LIMIT Effective date: 20111130 Ref country code: IT Free format text: LAPSE BECAUSE OF FAILURE TO SUBMIT A TRANSLATION OF THE DESCRIPTION OR TO PAY THE FEE WITHIN THE PRESCRIBED TIME-LIMIT Effective date: 20111130 Ref country code: PL Free format text: LAPSE BECAUSE OF FAILURE TO SUBMIT A TRANSLATION OF THE DESCRIPTION OR TO PAY THE FEE WITHIN THE PRESCRIBED TIME-LIMIT Effective date: 20111130 |
|
| REG | Reference to a national code |
Ref country code: AT Ref legal event code: MK05 Ref document number: 535535 Country of ref document: AT Kind code of ref document: T Effective date: 20111130 |
|
| PG25 | Lapsed in a contracting state [announced via postgrant information from national office to epo] |
Ref country code: MC Free format text: LAPSE BECAUSE OF NON-PAYMENT OF DUE FEES Effective date: 20120229 |
|
| PLBE | No opposition filed within time limit |
Free format text: ORIGINAL CODE: 0009261 |
|
| STAA | Information on the status of an ep patent application or granted ep patent |
Free format text: STATUS: NO OPPOSITION FILED WITHIN TIME LIMIT |
|
| 26N | No opposition filed |
Effective date: 20120831 |
|
| REG | Reference to a national code |
Ref country code: IE Ref legal event code: MM4A |
|
| REG | Reference to a national code |
Ref country code: DE Ref legal event code: R097 Ref document number: 602007019067 Country of ref document: DE Effective date: 20120831 |
|
| PG25 | Lapsed in a contracting state [announced via postgrant information from national office to epo] |
Ref country code: IE Free format text: LAPSE BECAUSE OF NON-PAYMENT OF DUE FEES Effective date: 20120228 Ref country code: AT Free format text: LAPSE BECAUSE OF FAILURE TO SUBMIT A TRANSLATION OF THE DESCRIPTION OR TO PAY THE FEE WITHIN THE PRESCRIBED TIME-LIMIT Effective date: 20111130 |
|
| PG25 | Lapsed in a contracting state [announced via postgrant information from national office to epo] |
Ref country code: ES Free format text: LAPSE BECAUSE OF FAILURE TO SUBMIT A TRANSLATION OF THE DESCRIPTION OR TO PAY THE FEE WITHIN THE PRESCRIBED TIME-LIMIT Effective date: 20120311 |
|
| PG25 | Lapsed in a contracting state [announced via postgrant information from national office to epo] |
Ref country code: FI Free format text: LAPSE BECAUSE OF FAILURE TO SUBMIT A TRANSLATION OF THE DESCRIPTION OR TO PAY THE FEE WITHIN THE PRESCRIBED TIME-LIMIT Effective date: 20111130 |
|
| PG25 | Lapsed in a contracting state [announced via postgrant information from national office to epo] |
Ref country code: TR Free format text: LAPSE BECAUSE OF FAILURE TO SUBMIT A TRANSLATION OF THE DESCRIPTION OR TO PAY THE FEE WITHIN THE PRESCRIBED TIME-LIMIT Effective date: 20111130 |
|
| PG25 | Lapsed in a contracting state [announced via postgrant information from national office to epo] |
Ref country code: LU Free format text: LAPSE BECAUSE OF NON-PAYMENT OF DUE FEES Effective date: 20120228 |
|
| PG25 | Lapsed in a contracting state [announced via postgrant information from national office to epo] |
Ref country code: HU Free format text: LAPSE BECAUSE OF FAILURE TO SUBMIT A TRANSLATION OF THE DESCRIPTION OR TO PAY THE FEE WITHIN THE PRESCRIBED TIME-LIMIT Effective date: 20070228 |
|
| REG | Reference to a national code |
Ref country code: FR Ref legal event code: PLFP Year of fee payment: 10 |
|
| REG | Reference to a national code |
Ref country code: CH Ref legal event code: PFA Owner name: PHENOMENOME DISCOVERIES INC., CA Free format text: FORMER OWNER: PHENOMENOME DISCOVERIES INC., CA |
|
| REG | Reference to a national code |
Ref country code: FR Ref legal event code: PLFP Year of fee payment: 11 |
|
| REG | Reference to a national code |
Ref country code: FR Ref legal event code: PLFP Year of fee payment: 12 |
|
| P01 | Opt-out of the competence of the unified patent court (upc) registered |
Effective date: 20230515 |
|
| PGFP | Annual fee paid to national office [announced via postgrant information from national office to epo] |
Ref country code: FR Payment date: 20251231 Year of fee payment: 20 |
|
| PGFP | Annual fee paid to national office [announced via postgrant information from national office to epo] |
Ref country code: NL Payment date: 20260106 Year of fee payment: 20 |
|
| REG | Reference to a national code |
Ref country code: CH Ref legal event code: U11 Free format text: ST27 STATUS EVENT CODE: U-0-0-U10-U11 (AS PROVIDED BY THE NATIONAL OFFICE) Effective date: 20260301 |
|
| PGFP | Annual fee paid to national office [announced via postgrant information from national office to epo] |
Ref country code: SE Payment date: 20260105 Year of fee payment: 20 |
|
| PGFP | Annual fee paid to national office [announced via postgrant information from national office to epo] |
Ref country code: GB Payment date: 20260106 Year of fee payment: 20 |
|
| PGFP | Annual fee paid to national office [announced via postgrant information from national office to epo] |
Ref country code: DE Payment date: 20260102 Year of fee payment: 20 |
|
| PGFP | Annual fee paid to national office [announced via postgrant information from national office to epo] |
Ref country code: CH Payment date: 20260301 Year of fee payment: 20 |