EP1918838A2 - Estimation of dynamic range of microarray DNA spike-in data by use of parametric curve-fitting - Google Patents
Estimation of dynamic range of microarray DNA spike-in data by use of parametric curve-fitting Download PDFInfo
- Publication number
- EP1918838A2 EP1918838A2 EP07253895A EP07253895A EP1918838A2 EP 1918838 A2 EP1918838 A2 EP 1918838A2 EP 07253895 A EP07253895 A EP 07253895A EP 07253895 A EP07253895 A EP 07253895A EP 1918838 A2 EP1918838 A2 EP 1918838A2
- Authority
- EP
- European Patent Office
- Prior art keywords
- spike
- data
- parameters
- microarray
- positive control
- Prior art date
- Legal status (The legal status is an assumption and is not a legal conclusion. Google has not performed a legal analysis and makes no representation as to the accuracy of the status listed.)
- Withdrawn
Links
- 238000002493 microarray Methods 0.000 title claims abstract description 93
- 238000000034 method Methods 0.000 claims abstract description 66
- 239000000523 sample Substances 0.000 claims description 69
- 238000002474 experimental method Methods 0.000 claims description 27
- 239000013641 positive control Substances 0.000 claims description 23
- 238000004458 analytical method Methods 0.000 claims description 4
- 238000002372 labelling Methods 0.000 claims description 4
- 238000012360 testing method Methods 0.000 claims description 4
- 238000006243 chemical reaction Methods 0.000 claims description 2
- 150000007523 nucleic acids Chemical class 0.000 description 30
- 102000039446 nucleic acids Human genes 0.000 description 29
- 108020004707 nucleic acids Proteins 0.000 description 29
- 238000009396 hybridization Methods 0.000 description 27
- 239000000203 mixture Substances 0.000 description 20
- 239000002773 nucleotide Substances 0.000 description 19
- 125000003729 nucleotide group Chemical group 0.000 description 19
- 238000003491 array Methods 0.000 description 14
- 108091033319 polynucleotide Proteins 0.000 description 14
- 102000040430 polynucleotide Human genes 0.000 description 14
- 239000002157 polynucleotide Substances 0.000 description 14
- 238000003860 storage Methods 0.000 description 14
- 238000001514 detection method Methods 0.000 description 13
- 210000000349 chromosome Anatomy 0.000 description 11
- 239000013642 negative control Substances 0.000 description 11
- DBMJMQXJHONAFJ-UHFFFAOYSA-M Sodium laurylsulphate Chemical compound [Na+].CCCCCCCCCCCCOS([O-])(=O)=O DBMJMQXJHONAFJ-UHFFFAOYSA-M 0.000 description 10
- 239000000758 substrate Substances 0.000 description 10
- 108091034117 Oligonucleotide Proteins 0.000 description 9
- 108020004414 DNA Proteins 0.000 description 8
- FAPWRFPIFSIZLT-UHFFFAOYSA-M Sodium chloride Chemical compound [Na+].[Cl-] FAPWRFPIFSIZLT-UHFFFAOYSA-M 0.000 description 8
- 239000000463 material Substances 0.000 description 8
- 238000009472 formulation Methods 0.000 description 7
- 230000006870 function Effects 0.000 description 7
- ZHNUHDYFZUAESO-UHFFFAOYSA-N Formamide Chemical compound NC=O ZHNUHDYFZUAESO-UHFFFAOYSA-N 0.000 description 6
- 230000027455 binding Effects 0.000 description 6
- 229920000642 polymer Polymers 0.000 description 6
- 239000000872 buffer Substances 0.000 description 5
- 238000005457 optimization Methods 0.000 description 5
- 230000004044 response Effects 0.000 description 5
- 108091032973 (ribonucleotides)n+m Proteins 0.000 description 4
- 238000003556 assay Methods 0.000 description 4
- 238000000151 deposition Methods 0.000 description 4
- 238000004519 manufacturing process Methods 0.000 description 4
- 238000012986 modification Methods 0.000 description 4
- 230000004048 modification Effects 0.000 description 4
- 229920001184 polypeptide Polymers 0.000 description 4
- 108090000765 processed proteins & peptides Proteins 0.000 description 4
- 102000004196 processed proteins & peptides Human genes 0.000 description 4
- 150000003839 salts Chemical class 0.000 description 4
- 239000011780 sodium chloride Substances 0.000 description 4
- 239000000126 substance Substances 0.000 description 4
- KDCGOANMDULRCW-UHFFFAOYSA-N Purine Natural products N1=CNC2=NC=NC2=C1 KDCGOANMDULRCW-UHFFFAOYSA-N 0.000 description 3
- 238000004364 calculation method Methods 0.000 description 3
- 239000003153 chemical reaction reagent Substances 0.000 description 3
- -1 e.g. Chemical group 0.000 description 3
- 238000000605 extraction Methods 0.000 description 3
- 230000008569 process Effects 0.000 description 3
- 238000012545 processing Methods 0.000 description 3
- 108090000623 proteins and genes Proteins 0.000 description 3
- 239000007787 solid Substances 0.000 description 3
- 239000000243 solution Substances 0.000 description 3
- 235000000346 sugar Nutrition 0.000 description 3
- 238000005406 washing Methods 0.000 description 3
- 238000012897 Levenberg–Marquardt algorithm Methods 0.000 description 2
- 108020004711 Nucleic Acid Probes Proteins 0.000 description 2
- CZPWVGJYEJSRLH-UHFFFAOYSA-N Pyrimidine Chemical compound C1=CN=CN=C1 CZPWVGJYEJSRLH-UHFFFAOYSA-N 0.000 description 2
- 108091028664 Ribonucleotide Proteins 0.000 description 2
- JLCPHMBAVCMARE-UHFFFAOYSA-N [3-[[3-[[3-[[3-[[3-[[3-[[3-[[3-[[3-[[3-[[3-[[5-(2-amino-6-oxo-1H-purin-9-yl)-3-[[3-[[3-[[3-[[3-[[3-[[5-(2-amino-6-oxo-1H-purin-9-yl)-3-[[5-(2-amino-6-oxo-1H-purin-9-yl)-3-hydroxyoxolan-2-yl]methoxy-hydroxyphosphoryl]oxyoxolan-2-yl]methoxy-hydroxyphosphoryl]oxy-5-(5-methyl-2,4-dioxopyrimidin-1-yl)oxolan-2-yl]methoxy-hydroxyphosphoryl]oxy-5-(6-aminopurin-9-yl)oxolan-2-yl]methoxy-hydroxyphosphoryl]oxy-5-(6-aminopurin-9-yl)oxolan-2-yl]methoxy-hydroxyphosphoryl]oxy-5-(6-aminopurin-9-yl)oxolan-2-yl]methoxy-hydroxyphosphoryl]oxy-5-(6-aminopurin-9-yl)oxolan-2-yl]methoxy-hydroxyphosphoryl]oxyoxolan-2-yl]methoxy-hydroxyphosphoryl]oxy-5-(5-methyl-2,4-dioxopyrimidin-1-yl)oxolan-2-yl]methoxy-hydroxyphosphoryl]oxy-5-(4-amino-2-oxopyrimidin-1-yl)oxolan-2-yl]methoxy-hydroxyphosphoryl]oxy-5-(5-methyl-2,4-dioxopyrimidin-1-yl)oxolan-2-yl]methoxy-hydroxyphosphoryl]oxy-5-(5-methyl-2,4-dioxopyrimidin-1-yl)oxolan-2-yl]methoxy-hydroxyphosphoryl]oxy-5-(6-aminopurin-9-yl)oxolan-2-yl]methoxy-hydroxyphosphoryl]oxy-5-(6-aminopurin-9-yl)oxolan-2-yl]methoxy-hydroxyphosphoryl]oxy-5-(4-amino-2-oxopyrimidin-1-yl)oxolan-2-yl]methoxy-hydroxyphosphoryl]oxy-5-(4-amino-2-oxopyrimidin-1-yl)oxolan-2-yl]methoxy-hydroxyphosphoryl]oxy-5-(4-amino-2-oxopyrimidin-1-yl)oxolan-2-yl]methoxy-hydroxyphosphoryl]oxy-5-(6-aminopurin-9-yl)oxolan-2-yl]methoxy-hydroxyphosphoryl]oxy-5-(4-amino-2-oxopyrimidin-1-yl)oxolan-2-yl]methyl [5-(6-aminopurin-9-yl)-2-(hydroxymethyl)oxolan-3-yl] hydrogen phosphate Polymers Cc1cn(C2CC(OP(O)(=O)OCC3OC(CC3OP(O)(=O)OCC3OC(CC3O)n3cnc4c3nc(N)[nH]c4=O)n3cnc4c3nc(N)[nH]c4=O)C(COP(O)(=O)OC3CC(OC3COP(O)(=O)OC3CC(OC3COP(O)(=O)OC3CC(OC3COP(O)(=O)OC3CC(OC3COP(O)(=O)OC3CC(OC3COP(O)(=O)OC3CC(OC3COP(O)(=O)OC3CC(OC3COP(O)(=O)OC3CC(OC3COP(O)(=O)OC3CC(OC3COP(O)(=O)OC3CC(OC3COP(O)(=O)OC3CC(OC3COP(O)(=O)OC3CC(OC3COP(O)(=O)OC3CC(OC3COP(O)(=O)OC3CC(OC3COP(O)(=O)OC3CC(OC3COP(O)(=O)OC3CC(OC3COP(O)(=O)OC3CC(OC3CO)n3cnc4c(N)ncnc34)n3ccc(N)nc3=O)n3cnc4c(N)ncnc34)n3ccc(N)nc3=O)n3ccc(N)nc3=O)n3ccc(N)nc3=O)n3cnc4c(N)ncnc34)n3cnc4c(N)ncnc34)n3cc(C)c(=O)[nH]c3=O)n3cc(C)c(=O)[nH]c3=O)n3ccc(N)nc3=O)n3cc(C)c(=O)[nH]c3=O)n3cnc4c3nc(N)[nH]c4=O)n3cnc4c(N)ncnc34)n3cnc4c(N)ncnc34)n3cnc4c(N)ncnc34)n3cnc4c(N)ncnc34)O2)c(=O)[nH]c1=O JLCPHMBAVCMARE-UHFFFAOYSA-N 0.000 description 2
- 238000004422 calculation algorithm Methods 0.000 description 2
- 150000005829 chemical entities Chemical class 0.000 description 2
- 150000001875 compounds Chemical class 0.000 description 2
- 239000005547 deoxyribonucleotide Substances 0.000 description 2
- 125000002637 deoxyribonucleotide group Chemical group 0.000 description 2
- 230000001419 dependent effect Effects 0.000 description 2
- 230000008021 deposition Effects 0.000 description 2
- 125000000623 heterocyclic group Chemical group 0.000 description 2
- 239000000178 monomer Substances 0.000 description 2
- 239000002853 nucleic acid probe Substances 0.000 description 2
- 239000002777 nucleoside Substances 0.000 description 2
- 150000003833 nucleoside derivatives Chemical class 0.000 description 2
- 238000003752 polymerase chain reaction Methods 0.000 description 2
- 102000004169 proteins and genes Human genes 0.000 description 2
- 150000003212 purines Chemical class 0.000 description 2
- 150000003230 pyrimidines Chemical class 0.000 description 2
- 238000003908 quality control method Methods 0.000 description 2
- 239000002336 ribonucleotide Substances 0.000 description 2
- 125000002652 ribonucleotide group Chemical group 0.000 description 2
- FSYKKLYZXJSNPZ-UHFFFAOYSA-N sarcosine Chemical compound C[NH2+]CC([O-])=O FSYKKLYZXJSNPZ-UHFFFAOYSA-N 0.000 description 2
- 238000012546 transfer Methods 0.000 description 2
- HHXYJYBYNZMZKX-UHFFFAOYSA-N 3,4:15,16-diepoxy-7-oxo-13(16),14-clerodadien-20,12-olide-(3alpha,4alpha)-form Natural products C12CCC3C4(C)CCCC(C)(C)C4CCC3(C)C1(C)CCC1C2(C)CCC1C(=C)C HHXYJYBYNZMZKX-UHFFFAOYSA-N 0.000 description 1
- 229930182476 C-glycoside Natural products 0.000 description 1
- 150000000700 C-glycosides Chemical class 0.000 description 1
- HMFHBZSHGGEWLO-SOOFDHNKSA-N D-ribofuranose Chemical compound OC[C@H]1OC(O)[C@H](O)[C@@H]1O HMFHBZSHGGEWLO-SOOFDHNKSA-N 0.000 description 1
- 102000053602 DNA Human genes 0.000 description 1
- KCXVZYZYPLLWCC-UHFFFAOYSA-N EDTA Chemical compound OC(=O)CN(CC(O)=O)CCN(CC(O)=O)CC(O)=O KCXVZYZYPLLWCC-UHFFFAOYSA-N 0.000 description 1
- 102000020897 Formins Human genes 0.000 description 1
- 108091022623 Formins Proteins 0.000 description 1
- DGAQECJNVWCQMB-PUAWFVPOSA-M Ilexoside XXIX Chemical compound C[C@@H]1CC[C@@]2(CC[C@@]3(C(=CC[C@H]4[C@]3(CC[C@@H]5[C@@]4(CC[C@@H](C5(C)C)OS(=O)(=O)[O-])C)C)[C@@H]2[C@]1(C)O)C)C(=O)O[C@H]6[C@@H]([C@H]([C@@H]([C@H](O6)CO)O)O)O.[Na+] DGAQECJNVWCQMB-PUAWFVPOSA-M 0.000 description 1
- 241000699670 Mus sp. Species 0.000 description 1
- 101100384865 Neurospora crassa (strain ATCC 24698 / 74-OR23-1A / CBS 708.71 / DSM 1257 / FGSC 987) cot-1 gene Proteins 0.000 description 1
- 108091028043 Nucleic acid sequence Proteins 0.000 description 1
- 108020005187 Oligonucleotide Probes Proteins 0.000 description 1
- PYMYPHUHKUWMLA-LMVFSUKVSA-N Ribose Natural products OC[C@@H](O)[C@@H](O)[C@@H](O)C=O PYMYPHUHKUWMLA-LMVFSUKVSA-N 0.000 description 1
- 108010077895 Sarcosine Proteins 0.000 description 1
- 108091027568 Single-stranded nucleotide Proteins 0.000 description 1
- 229920002472 Starch Polymers 0.000 description 1
- 238000000692 Student's t-test Methods 0.000 description 1
- 238000010521 absorption reaction Methods 0.000 description 1
- 238000001042 affinity chromatography Methods 0.000 description 1
- 125000001931 aliphatic group Chemical group 0.000 description 1
- HMFHBZSHGGEWLO-UHFFFAOYSA-N alpha-D-Furanose-Ribose Natural products OCC1OC(O)C(O)C1O HMFHBZSHGGEWLO-UHFFFAOYSA-N 0.000 description 1
- 150000001412 amines Chemical class 0.000 description 1
- 239000008346 aqueous phase Substances 0.000 description 1
- 239000007864 aqueous solution Substances 0.000 description 1
- 239000011324 bead Substances 0.000 description 1
- 230000006399 behavior Effects 0.000 description 1
- 239000012472 biological sample Substances 0.000 description 1
- 229920001222 biopolymer Polymers 0.000 description 1
- 230000015572 biosynthetic process Effects 0.000 description 1
- 210000004027 cell Anatomy 0.000 description 1
- 238000001311 chemical methods and process Methods 0.000 description 1
- 239000003795 chemical substances by application Substances 0.000 description 1
- 230000000295 complement effect Effects 0.000 description 1
- 239000002299 complementary DNA Substances 0.000 description 1
- 238000004590 computer program Methods 0.000 description 1
- 239000000470 constituent Substances 0.000 description 1
- 238000013500 data storage Methods 0.000 description 1
- 238000013461 design Methods 0.000 description 1
- 238000010586 diagram Methods 0.000 description 1
- 230000000694 effects Effects 0.000 description 1
- 238000005516 engineering process Methods 0.000 description 1
- 230000007613 environmental effect Effects 0.000 description 1
- 150000002170 ethers Chemical class 0.000 description 1
- 230000005284 excitation Effects 0.000 description 1
- 239000012530 fluid Substances 0.000 description 1
- 150000004676 glycans Chemical class 0.000 description 1
- 125000005843 halogen group Chemical group 0.000 description 1
- 238000010438 heat treatment Methods 0.000 description 1
- 125000002887 hydroxy group Chemical group [H]O* 0.000 description 1
- 238000005286 illumination Methods 0.000 description 1
- 238000011065 in-situ storage Methods 0.000 description 1
- 238000011534 incubation Methods 0.000 description 1
- 230000003993 interaction Effects 0.000 description 1
- 230000002452 interceptive effect Effects 0.000 description 1
- 238000004255 ion exchange chromatography Methods 0.000 description 1
- 238000002955 isolation Methods 0.000 description 1
- 238000005259 measurement Methods 0.000 description 1
- 230000009871 nonspecific binding Effects 0.000 description 1
- 238000007899 nucleic acid hybridization Methods 0.000 description 1
- 125000003835 nucleoside group Chemical group 0.000 description 1
- 239000002751 oligonucleotide probe Substances 0.000 description 1
- 230000003287 optical effect Effects 0.000 description 1
- 229920001282 polysaccharide Polymers 0.000 description 1
- 239000005017 polysaccharide Substances 0.000 description 1
- 239000002243 precursor Substances 0.000 description 1
- IGFXRKMLLMBKSA-UHFFFAOYSA-N purine Chemical compound N1=C[N]C2=NC=NC2=C1 IGFXRKMLLMBKSA-UHFFFAOYSA-N 0.000 description 1
- 238000004445 quantitative analysis Methods 0.000 description 1
- 230000035484 reaction time Effects 0.000 description 1
- 230000003252 repetitive effect Effects 0.000 description 1
- 230000000717 retained effect Effects 0.000 description 1
- 150000003291 riboses Chemical class 0.000 description 1
- 229920002477 rna polymer Polymers 0.000 description 1
- 229940043230 sarcosine Drugs 0.000 description 1
- 229920006395 saturated elastomer Polymers 0.000 description 1
- 238000009738 saturating Methods 0.000 description 1
- 238000004062 sedimentation Methods 0.000 description 1
- 229910052708 sodium Inorganic materials 0.000 description 1
- 239000011734 sodium Substances 0.000 description 1
- NLJMYIDDQXHKNR-UHFFFAOYSA-K sodium citrate Chemical compound O.O.[Na+].[Na+].[Na+].[O-]C(=O)CC(O)(CC([O-])=O)C([O-])=O NLJMYIDDQXHKNR-UHFFFAOYSA-K 0.000 description 1
- 239000001509 sodium citrate Substances 0.000 description 1
- FQENQNTWSFEDLI-UHFFFAOYSA-J sodium diphosphate Chemical compound [Na+].[Na+].[Na+].[Na+].[O-]P([O-])(=O)OP([O-])([O-])=O FQENQNTWSFEDLI-UHFFFAOYSA-J 0.000 description 1
- 229940048086 sodium pyrophosphate Drugs 0.000 description 1
- 241000894007 species Species 0.000 description 1
- 238000001228 spectrum Methods 0.000 description 1
- 235000019698 starch Nutrition 0.000 description 1
- 150000008163 sugars Chemical class 0.000 description 1
- 238000012353 t test Methods 0.000 description 1
- 235000019818 tetrasodium diphosphate Nutrition 0.000 description 1
- 239000001577 tetrasodium phosphonato phosphate Substances 0.000 description 1
- 238000013024 troubleshooting Methods 0.000 description 1
Images


Classifications
-
- G—PHYSICS
- G16—INFORMATION AND COMMUNICATION TECHNOLOGY [ICT] SPECIALLY ADAPTED FOR SPECIFIC APPLICATION FIELDS
- G16B—BIOINFORMATICS, i.e. INFORMATION AND COMMUNICATION TECHNOLOGY [ICT] SPECIALLY ADAPTED FOR GENETIC OR PROTEIN-RELATED DATA PROCESSING IN COMPUTATIONAL MOLECULAR BIOLOGY
- G16B25/00—ICT specially adapted for hybridisation; ICT specially adapted for gene or protein expression
-
- G—PHYSICS
- G16—INFORMATION AND COMMUNICATION TECHNOLOGY [ICT] SPECIALLY ADAPTED FOR SPECIFIC APPLICATION FIELDS
- G16B—BIOINFORMATICS, i.e. INFORMATION AND COMMUNICATION TECHNOLOGY [ICT] SPECIALLY ADAPTED FOR GENETIC OR PROTEIN-RELATED DATA PROCESSING IN COMPUTATIONAL MOLECULAR BIOLOGY
- G16B40/00—ICT specially adapted for biostatistics; ICT specially adapted for bioinformatics-related machine learning or data mining, e.g. knowledge discovery or pattern finding
Definitions
- Microarray experiments involve multi-step procedures where small differences among samples, techniques, or user-induced variations may alter the microarray data.
- the microarray community has realized that more quality control is needed in evaluating microarray data.
- the microarray data can be normalized from one experiment to the next, and hybridization specificity, user-induced variations as well as overall data quality can be addressed for each microarray.
- Spike-in controls often comprise a plurality of different transcripts or cDNA in predetermined ratio-generating concentrations that serve as positive microarray controls.
- the spike-ins may be provided as a two-color RNA mixture or a one-color spike-in mixture.
- the transcripts or nucleotides in a spike-in cocktail have sequences which are designed to hybridize specifically to the control probes of a microarray with minimal self- or cross-hybridization.
- the spike-in control probes on the microarray are designed to avoid known complementary sequences to biological samples used on most microarrays.
- a method for dynamic range analysis of positive control data for microarrays comprising providing positive control data (Spike-in data) from a microarray experiment, identifying a plurality of parameters from the positive control data, applying the plurality of parameters to a curve fitting equation, determining a linear range of the positive control data, and applying the linear range of the positive control data to the microarray experiment.
- the curve fitting equation of the above method is a sigmoidal curve fitting equation.
- the plurality of parameters comprise a min, max, x0, and w parameters.
- the methods may further comprise, identifying the plurality of parameters by optimizing the plurality of parameters with a Levenberg-Marquardt technique. In most methods parameters x 0 , and w are utilized to determine the linear range of the microarray data.
- Some embodiments also comprise determining the low threshold signal of the spike-in data, and in most instances the low threshold signal error value is determined as well as estimating a signal level for background noise of the spike-in data.
- the methods further comprise estimating a signal for at least one probe which does not bind to a specific target of the microarray experiment.
- the Spike-in nucleotide sequences are designed so they will not interfere with the hybridization of the sample of interest to the microarray.
- the methods of the invention are applicable to both 2-color and 1-color microarray experiments, but in particular 1-color microarrays.
- the methods of the invention may comprise converting the Spike-in data in terms of concentration of a given nucleotide (i.e. fmols/micro-liter) to determine the dynamic and linear range of the data.
- the invention also provides a computer readable medium carrying one or more sequences of instructions for identifying and selecting a plurality of parameters for analyzing Spike-in data of a microarray, wherein execution of one or more sequences of instructions by one or more processors causes the one or more processors to perform the steps of estimating said plurality of parameters, optimizing the plurality of parameters using a Levenberg-Marquart equation; and using the plurality of optimized parameters in a sigmoidal function to identify the linear range of the Spike-in data.
- the computer readable medium further comprises identifying at least one of the plurality of parameters as a minimum signal value for the Spike-in data; and calculating a low threshold error value for the Spike-in data with the minimum signal value.
- the Spike-in data also tests the labeling efficiency and reaction efficiency of a microarray experiment. For example if the Spike-in data does give a saturation point at the top of the Spike-in curve, this suggests that maybe the hybridization reaction time might be too short or the concentration of the Spike-in's needs to be increased. Or if the majority of the Spike-ins do not give a good signal, this may suggest that the dye labeling of the sample may not have been sufficient.
- the methods of the invention also enable the Spike-ins to give another population of data in which to calculate replicate statistics of a microarray.
- SAM S-in control set
- the present invention provides methods and systems which overcome the difficulties in determining the dynamic range of spike-in controls of microarrays mentioned above as well as providing advantages in determining the linear range of spike-ins over current methods.
- Figs. 1A and 1B are illustrations of Intensity vs. Concentration plots of spike-ins of a microarray
- Fig. 2 is a flow chart illustrating one embodiment of the method of the invention
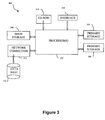
- Fig. 3 is a block diagram illustrating an example of a computer system which may be used in implementing the present invention
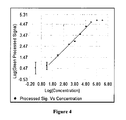
- Fig. 4 is a graphical illustration comparing actual data of spike-ins to the fitted data of spike-ins obtained by the methods in accordance with the present invention.
- nucleic acid and “polynucleotide” are used interchangeably herein to describe a polymer of any length, e.g., greater than about 10 bases, greater than about 100 bases, greater than about 500 bases, greater than 1000 bases, usually up to about 10,000 or more bases composed of nucleotides, e.g., deoxyribonucleotides or ribonucleotides, or compounds produced synthetically (e.g., PNA as described in U.S. Patent No. 5,948,902 and the references cited therein) which can hybridize with naturally occurring nucleic acids in a sequence specific manner analogous to that of two naturally occurring nucleic acids, e.g., can participate in Watson-Crick base pairing interactions.
- nucleotides e.g., deoxyribonucleotides or ribonucleotides
- compounds produced synthetically e.g., PNA as described in U.S. Patent No. 5,948,902 and the references cited therein
- ribonucleic acid and "RNA” as used herein mean a polymer composed of ribonucleotides.
- deoxyribonucleic acid and "DNA” as used herein mean a polymer composed of deoxyribonucleotides.
- oligonucleotide denotes single stranded nucleotide multimers of from about 10 to 100 nucleotides and up to 200 nucleotides in length. Oligonucleotides are usually synthetic and, in many embodiments, are under 60 nucleotides in length.
- oligomer is used herein to indicate a chemical entity that contains a plurality of monomers.
- the terms “oligomer” and “polymer” are used interchangeably, as it is generally, although not necessarily, smaller “polymers” that are prepared using the functionalized substrates of the invention, particularly in conjunction with combinatorial chemistry techniques.
- examples of oligomers and polymers include polydeoxyribonucleotides (DNA), polyribonucleotides (RNA), other nucleic acids that are C-glycosides of a purine or pyrimidine base, polypeptides (proteins), polysaccharides (starches, or polysugars), and other chemical entities that contain repeating units of like chemical structure.
- sample as used herein relates to a material or mixture of materials, typically, although not necessarily, in fluid form, containing one or more components of interest.
- nucleoside and nucleotide are intended to include those moieties that contain not only the known purine and pyrimidine bases, but also other heterocyclic bases that have been modified. Such modifications include methylated purines or pyrimidines, acylated purines or pyrimidines, alkylated riboses or other heterocycles.
- nucleoside and nucleotide include those moieties that contain not only conventional ribose and deoxyribose sugars, but other sugars as well.
- Modified nucleosides or nucleotides also include modifications on the sugar moiety, e.g., wherein one or more of the hydroxyl groups are replaced with halogen atoms or aliphatic groups, or are functionalized as ethers, amines, or the like.
- surface-bound polynucleotide refers to a polynucleotide "probe” that is immobilized on a surface of a solid substrate, where the substrate can have a variety of configurations, e.g., a sheet, bead, or other structure.
- the collections of oligonucleotide probe elements employed herein are present on a surface of the same planar support, e.g., in the form of an array.
- a “labeled population of nucleic acids” refers to mixture of nucleic acids that are detectably labeled, e.g., fluorescently labeled, such that the presence of the nucleic acids can be detected by assessing the presence of the label.
- a labeled population of nucleic acids is "made from” a chromosome sample, and the chromosome sample is usually employed as template for making the population of nucleic acids.
- array encompasses the term “microarray” and refers to an ordered array presented for binding to nucleic acids and the like.
- An “array,” includes any two-dimensional or substantially two-dimensional (as well as a three-dimensional) arrangement of spatially addressable regions bearing nucleic acid probes, particularly oligonucleotides or synthetic mimetics thereof, and the like. Where the arrays are arrays of nucleic acids, the nucleic acid probes may be adsorbed, physisorbed, chemisorbed, or covalently attached to the arrays at any point or points along the nucleic acid chain.
- Any given substrate may carry one, two, four or more arrays disposed on a front surface of the substrate.
- any or all of the arrays may be the same or different from one another and each may contain multiple spots or features.
- a typical array may contain one or more, including more than two, more than ten, more than one hundred, more than one thousand, more ten thousand features, or even more than one hundred thousand features, in an area of less than 20 cm 2 or even less than 10 cm 2 , e.g., less than about 5cm 2 , including less than about 1 cm 2 , less than about 1 mm 2 , e.g., 100 ⁇ m 2 , or even smaller.
- features may have widths (that is, diameter, for a round spot) in the range from a 10 ⁇ m to 1.0 cm.
- each feature may have a width in the range of 1.0 ⁇ m to 1.0 mm, usually 5.0 ⁇ m to 500 ⁇ m, and more usually 10 ⁇ m to 200 ⁇ m.
- Non-round features may have area ranges equivalent to that of circular features with the foregoing width (diameter) ranges.
- At least some, or all, of the features are of different compositions (for example, when any repeats of each feature composition are excluded the remaining features may account for at least 5%, 10%, 20%, 50%, 95%, 99% or 100% of the total number of features).
- Inter-feature areas will typically (but not essentially) be present which do not carry any nucleic acids (or other biopolymer or chemical moiety of a type of which the features are composed). Such inter-feature areas typically will be present where the arrays are formed by processes involving drop deposition of reagents but may not be present when, for example, photolithographic array fabrication processes are used. It will be appreciated though, that the inter-feature areas, when present, could be of various sizes and configurations.
- Each array may cover an area of less than 200 cm 2 , or even less than 50 cm 2 , 5 cm 2 , 1 cm 2 , 0.5 cm 2 , or 0.1 cm 2 .
- the substrate carrying the one or more arrays will be shaped generally as a rectangular solid (although other shapes are possible), having a length of more than 4 mm and less than 150 mm, usually more than 4 mm and less than 80 mm, more usually less than 20 mm; a width of more than 4 mm and less than 150 mm, usually less than 80 mm and more usually less than 20 mm; and a thickness of more than 0.01 mm and less than 5.0 mm, usually more than 0.1 mm and less than 2 mm and more usually more than 0.2 and less than 1.5 mm, such as more than about 0.8 mm and less than about 1.2 mm.
- the substrate may be of a material that emits low fluorescence upon illumination with the excitation light. Additionally in this situation, the substrate may be relatively transparent to reduce the absorption of the incident illuminating laser light and subsequent heating if the focused laser beam travels too slowly over a region. For example, the substrate may transmit at least 20%, or 50% (or even at least 70%, 90%, or 95%), of the illuminating light incident on the front as may be measured across the entire integrated spectrum of such illuminating light or alternatively at 532 nm or 633 nm.
- Arrays can be fabricated using drop deposition from pulse-jets of either nucleic acid precursor units (such as monomers) in the case of in situ fabrication, or the previously obtained nucleic acid.
- nucleic acid precursor units such as monomers
- Such methods are described in detail in, for example, the previously cited references including US6242266 , US6232072 , US6180351 , US6171797 , US6323043 , U.S. Patent Application Serial No. 09/302,898 filed April 30, 1999 by Caren et al., and the references cited therein. These references are incorporated herein by reference.
- Other drop deposition methods can be used for fabrication, as previously described herein.
- photolithographic array fabrication methods may be used. Inter-feature areas need not be present particularly when the arrays are made by photolithographic methods as described in those patents.
- An array is "addressable” when it has multiple regions of different probes (e.g., different oligonucleotide sequences) such that a region (i.e., a "feature” or “spot” of the array) at a particular predetermined location (i.e., an "address") on the array will detect a particular target sequence.
- Array features are typically, but need not be, separated by intervening spaces. It should be noted that the terms “target” and “probe” are sometimes used differently in certain publications.
- a “scan region” refers to a contiguous (preferably, rectangular) area in which the array spots, probes or features of interest are found or detected. Where fluorescent labels are employed, the scan region is that portion of the total area illuminated from which the resulting fluorescence is detected and recorded. Where other detection protocols are employed, the scan region is that portion of the total area queried from which resulting signal is detected and recorded. For the purposes of this invention and with respect to fluorescent detection embodiments, the scan region includes the entire area of the slide scanned in each pass of the lens, between the first feature of interest, and the last feature of interest, even if there exist intervening areas that lack features of interest.
- array layout refers to one or more characteristics of the features, such as feature positioning on the substrate, one or more feature dimensions, and an indication of a moiety at a given location.
- “Hybridizing” and “binding”, with respect to nucleic acids, are used interchangeably.
- stringent assay conditions refers to conditions that are compatible to produce binding pairs of nucleic acids, e.g., probes and targets, of sufficient complementarity to provide for the desired level of specificity in the assay while being incompatible to the formation of binding pairs between binding members of insufficient complementarity to provide for the desired specificity.
- stringent assay conditions refers to the combination of hybridization and wash conditions.
- a “stringent hybridization” and “stringent hybridization wash conditions” in the context of nucleic acid hybridization are sequence dependent, and are different under different environmental parameters.
- Stringent hybridization conditions that can be used to identify nucleic acids within the scope of the invention can include, e.g., hybridization in a buffer comprising 50% formamide, 5xSSC, and 1% SDS at 42°C, or hybridization in a buffer comprising 5 ⁇ SSC and 1% SDS at 65°C, both with a wash of 0.2xSSC and 0.1% SDS at 65°C.
- Exemplary stringent hybridization conditions can also include a hybridization in a buffer of 40% formamide, 1 M NaCl, and 1% SDS at 37°C, and a wash in 1 ⁇ SSC at 45°C.
- hybridization to filter-bound DNA in 0.5 M NaHPO 4 , 7% sodium dodecyl sulfate (SDS), 1 mnM EDTA at 65°C, and washing in 0.1 ⁇ SSC/0.1% SDS at 68°C can be employed.
- Additional stringent hybridization conditions include hybridization at 60°C or higher and 3 ⁇ SSC (450 mM sodium chloride/45 mM sodium citrate) or incubation at 42°C in a solution containing 30% formamide, 1M NaCl, 0.5% sodium sarcosine, 50 mM MES, pH 6.5.
- SSC 450 mM sodium chloride/45 mM sodium citrate
- incubation at 42°C in a solution containing 30% formamide, 1M NaCl, 0.5% sodium sarcosine, 50 mM MES, pH 6.5 can be utilized to provide conditions of similar stringency.
- the stringency of the wash conditions determine whether a nucleic acid is specifically hybridized to a probe.
- Wash conditions used to identify nucleic acids may include, e.g.: a salt concentration of about 0.02 molar at pH 7 and a temperature of at least about 50 °C or about 55°C to about 60°C; or, a salt concentration of about 0.15 M NaCl at 72°C for about 15 minutes; or, a salt concentration of about 0.2xSSC at a temperature of at least about 50°C or about 55 °C to about 60°C for about 15 to about 20 minutes; or, the hybridization complex is washed twice with a solution with a salt concentration of about 2 ⁇ SSC containing 0.1% SDS at room temperature for 15 minutes and then washed twice by 0.1 ⁇ SSC containing 0.1% SDS at 68°C for 15 minutes; or, equivalent conditions.
- Stringent conditions for washing can also be, e.g., 0.2 ⁇ SSC/0.1% SDS at 42°C.
- stringent conditions can include washing in 6xSSC/0.05% sodium pyrophosphate at 37 °C (for 14-base oligos), 48 °C (for 17-base oligos), 55°C (for 20-base oligos), and 60°C (for 23-base oligos). See Sambrook, Ausubel, or Tijssen (cited below) for detailed descriptions of equivalent hybridization and wash conditions and for reagents and buffers, e.g., SSC buffers and equivalent reagents and conditions.
- Stringent hybridization conditions may also include a "prehybridization" of aqueous phase nucleic acids with complexity-reducing nucleic acids to suppress repetitive sequences.
- certain stringent hybridization conditions include, prior to any hybridization to surface-bound polynucleotides, hybridization with Cot-1 DNA, or the like.
- Stringent assay conditions are hybridization conditions that are at least as stringent as the above representative conditions, where a given set of conditions are considered to be at least as stringent if substantially no additional binding complexes that lack sufficient complementarity to provide for the desired specificity are produced in the given set of conditions as compared to the above specific conditions, where by "substantially no more” is meant less than about 5-fold more, typically less than about 3-fold more.
- Other stringent hybridization conditions are known in the art and may also be employed, as appropriate.
- mixture refers to a combination of elements, that are interspersed and not in any particular order.
- a mixture is heterogeneous and not spatially separable into its different constituents.
- examples of mixtures of elements include a number of different elements that are dissolved in the same aqueous solution, or a number of different elements attached to a solid support at random or in no particular order in which the different elements are not specially distinct. In other words, a mixture is not addressable.
- an array of surface-bound polynucleotides as is commonly known in the art and described below, is not a mixture of capture agents because the species of surface-bound polynucleotides are spatially distinct and the array is addressable.
- Isolated or purified generally refers to isolation of a substance (compound, polynucleotide, protein, polypeptide, polypeptide, chromosome, etc.) such that the substance comprises the majority percent of the sample in which it resides.
- a substantially purified component comprises 50%, preferably 80%-85%, more preferably 90-95% of the sample.
- Techniques for purifying polynucleotides, polypeptides and intact chromosomes of interest are well-known in the art and include, for example, ion-exchange chromatography, affinity chromatography, sorting, and sedimentation according to density.
- assessing and “evaluating” are used interchangeably to refer to any form of measurement, and include determining if an element is present or not.
- determining means determining if an element is present or not.
- assessing means determining if an element is present or not.
- determining means determining if an element is present or not.
- assessing means determining if an element is present or not.
- assessing means determining if an element is present or not.
- determining means determining determining”
- assessing and “assaying” are used interchangeably and include both quantitative and qualitative determinations. Assessing may be relative or absolute. "Assessing the presence of' includes determining the amount of something present, as well as determining whether it is present or absent.
- a surface-bound polynucleotide "corresponds to" a chromosome
- the polynucleotide usually contains a sequence of nucleic acids that is unique to that chromosome. Accordingly, a surface-bound polynucleotide that corresponds to a particular chromosome usually specifically hybridizes to a labeled nucleic acid made from that chromosome, relative to labeled nucleic acids made from other chromosomes.
- Array features because they usually contain surface-bound polynucleotides, can also correspond to a chromosome.
- MultErrorGreen or multiplicative error in the green channel of a typical microarray scanner is the noise that is proportional to the signal which has been determined to be about 8%, for example, a 100 count signal has 8 counts of multiplicative noise, and a 10,000 count signal has 800 counts of multiplicative noise.
- the term "dynamic range” refers to a portion of microarray data in which the lower limit is at the limit of detection above the noise of the background (e.g.. the signal is statistically significantly different from zero.
- the signal is a multiple (3x) of the background noise or the p-value of a t-test comparison between signal and background is below a threshold, e.g. 0.01.
- the upper limit of the dynamic range is the signal level where the signal saturates (e.g. additional concentration of the target does not increase the signal).
- the dynamic range comprises the range of signals between these extremes.
- linear range refers to a portion of microarray data where the data is linear within the dynamic range of the data.
- Linear range means that a fit of the measured signal intensity versus known spike-in concentrations can be fit with a line when the data is better than a specified measure of linearity (e.g. R 2 ).
- R-Squared is the statistical measure of how well a regression line approximates the real data. For example, an r-squared of 1.0 (100%) indicates the line fits through the data perfectly.
- the slope of the data can also measure how linear the data is, since the fitting and the plotting of the data are both completed in log space. Optimally, the data will generate a slope near 1 and a r-squared value near 1.
- Spike-in refers to a positive control nucleic acid which is added to the sample to be analyzed by a microarray experiment.
- a “Spike-in” is composed of two parts, a probe and a target (positive control) sequence.
- the target is 'Spiked In' to the sample mixture and placed on the microarray.
- the probe refers to the strand of DNA attached to the microarray that the target specifically hybridizes to.
- a "Spike-in kit” comprises a plurality of different nucleic acids, at varying concentrations, allowing a range of signal intensities for these positive controls to be utilized in analyzing the microarray data.
- a Spike-In kit may comprise 10 unique target (positive control) sequences, and for each of the 10 different Spike-ins there maybe 30 replicated probes on the microarray for a total of 300 probes randomly placed around the microarray that the Spike-ins can hybridize with.
- concentration and the quantity of Spike-In nucleic acid added to the sample is known, allowing quantitative analysis of the microarray experiment.
- the methods of the invention are described in terms of use with data derived from arrays or microarrays. It should be understood, however, that the invention may be used with any data that carries spike-in control data, including data derived from arrays, polymerase chain reaction (PCR) experiments, cell sorting, or other techniques.
- PCR polymerase chain reaction
- the invention is also described in terms of use with DNA-based arrays, and it is contemplated that the invention may be used with data generated from RNA-based arrays as well.
- One of the features of many microarray platforms is the ability to "Spike-in” a cocktail of known quantities of specific nucleotides that hybridize against known probes in the microarray, in order to perform a quality check of the array and/or the experiment.
- the so called “spike ins” give the user data which is useful in identifying possible problems or issues with the hybridization, labeling, array design, sample concentration, etc.
- Spike-in samples are designed so that the various nucleotides in the Spike-in sample provide a range of signal intensities to compare to the microarray results.
- Spike-in probes are replicated across the microarray to evaluate reproducibility of both the signals and the log ratios of microarray data for quality control of microarray experiments.
- a microarray Spike-in kit may have 10 different Spike-in sequences or probes, with 30 replicates of each hybridizing probe positioned across a microarray.
- the Spike-in concentration-response of a microarray experiment is represented graphically by a plot of the Log of the Processed Signal (LogProcSig) of the Spike-in nucleic acids vs. the Log of the concentration of each Spike-In utilized in the experiment.
- the plot is usually sigmoidal, having two asymptotes: one at the scanner saturation point; and one at the level of signal for sequences with no specifically bound target or not enough specifically bound target to generate signal greater than the background noise.
- Such a plot is shown in Fig. 1A.
- Other microarrays may produce concentration-response plots which are missing one of the asymptotes, as illustrated in Fig. 1B.
- the Spike-In sample data shown in Fig. 1A and 1B comprises ten different nucleotides with varying concentrations.
- Fig. 1A shows the dose/response curve of the spike-ins from the detection limit 10, 12, 14, to the saturation point 16, 18.
- Five nucleotides have signal intensity within a linear range 20, 22, 24, 26, 28, while two spike-in nucleotides have intensities 16, 18 which exceed the scanner saturation point, and three of the spike-in nucleotides have signal intensity 10, 12, 14, which is not detectable above noise of the background.
- the error bars 16, 18, are small since the scanner reaches saturation at this point. Both the signals and standard deviations are underestimated because the saturated data is not excluded from the calculation.
- the error bars 10, 12, 14, are visible because the signal is dropping into the background noise, also the size of error bars will expand as the signal lowers towards the background noise in a log representation.
- the signal level at the top of the error bars of the features with lowest signal provides a rough estimate of the lower limit of detection. Signals at this level can be slightly overestimated and the error slightly underestimated because the signals below zero are excluded from the calculation (because they are undefined on a log plot). The most reliable data is found in the signal range where the signal increases linearly 20, 22, 24, 26, 28 with the concentration values of the spike-Ins.
- the method of the invention comprises providing a plurality of unique Spike-ins sequences (for example, 10 different Spike-in controls), and a plurality of probe replicates for each Spike-in (for example, 30 replicate probes specific for each Spike-in control) across a microarray.
- the method further comprises hybridizing the microarray, scanning and processing to obtain signals from the probes on the microarray and calculating the signal average (Ave) of the Spike-in replicates for each Spike-in sequence as well as the standard deviation(SD) in linear space (representation), followed by converting the data into log space to avoid the undesirable effect of signals below zero being excluded from the data.
- the log space representation is still affected when the average value of the replicated Spike-in is below zero, but the signal averages and standard deviation are very accurate when the average signal (Ave) is above zero.
- variable x in most embodiments, is 1 and the values for AVE (average spike-in probe signals of replicates) and SD (standard deviation of probe signals of replicates) are determined in linear space. If ( AVE - 1SD ) is below zero, the data is censored from the log space plot and ( AVE + 1SD ) is used as the size of the error bar for both the upper and lower error bar of that particular Spike-in signal in log space.
- Fig. 1B illustrates a concentration-response plot which has only one asymptote.
- three of the Spike-in nucleotides have low signal levels where the signal is dropping into the background noise 30, 32, 34.
- Seven Spike-ins appear to be within a linear range 36, 38, 40, 42, 44, 46, 48 while no spike-in nucleotides have signals reaching the scanner saturation point.
- the curves displayed in the graphs of Figs. 1A and 1B are non-linear, but have a linear behavior within the dynamic range.
- the line fit shown on the x-axis identifies the linear range of the data. While the Spike-in data shown in Figs. 1A and 1B may appear different in a concentration-response plot, the present invention allows for the dynamic range of the various spike-in data to be determined by modeling the data with certain parameters.
- the parametric curve fitting method 100 comprises providing spike-in data from a microarray at event 110.
- this provision of spike-in data comprises signals obtained from scanning and processing a microarray containing spike-in probes and inputting the spike-in signal data to a system, e.g., such as described with regard to Fig. 3 below, for example.
- Event 110 comprises, applying feature extraction software (e.g., Agilent Feature Extraction Software, Agilent Technologies, Inc., Palo Alto, California) which has a list of probes used for Spike-ins.
- the software comprises multiple spike-in sets and the user can indicate which spike-in set they are using (e.g. 1-color or 2-color or CGH or another), such as by selection via an interactive user interface on a computer display, for example.
- the feature extraction software identifies which data comes from the specified probes for the selected spike-ins and this data is utilized in downstream events of the methods of the invention.
- the sets of probes used for spike-ins are included in the common controls table in the feature extraction software.
- estimated values are calculated for selected data parameters from the Spike In data which are useful in estimating the dynamic range. Initially, some statistics are calculated, such as the signal average, Standard Deviation, Percent CV (coefficient of variation) for a plurality of Spike-in replicates. Event 120 may also include estimating the line that fits the linear range of the microarray data.
- the specific sigmoidal curve fitting parameters identified from the data in event 120 may include but are not limited to, estimates for "Min”, “Max”, "x 0 " and "w” parameters.
- the value "Max” is generally the value for the saturation point of the scanner or the upper limit of detection. Most microarray scanners include this information on the image of the data, i.e. the header of a tiff image of the data.
- the “Min” value in general, is the noise background value or the level of signal for sequences with no specifically bound target.
- the "x 0 " value is the center of the data (i.e. for x 0 the associated signal in signal space is halfway between Min and Max) and is close to the center of the linear range of the data, and "w” is the width of the curve on either side of x 0 (in concentration space).
- the signal saturation point is assumed to be fixed at or close to the scanner detection limit.
- the value of 4.82 derives from the saturation value of the scanner, which in this embodiment is approximately 2 16 represented in log space.
- the saturation value is dependent on many factors, including but limited to the type of scanner, or the range of the scan (normal or extended dynamic range).
- the asymptotes for the maximum and the minimum signals are not necessarily symmetric, e.g., the upper asymptote may be a function of the scanner offset, while the lower asymptote may be a function of the background noise.
- Estimating a starting point for the "Min” value in most embodiments may be completed by calculating the signal average of spike-in replicates for each spike-in sequence on a microarray. For example, the number of Spike-in probes on an array will total 300 when there are 10 different Spike-ins, each with 30 replicate probes spread out randomly across the array.
- Negative controls are probes on the microarray which are designed not to bind to any sequence known in the genome or sample being tested, allowing the identification of signal intensities related to nonspecific binding and/or background noise from the equipment. There may be many replicates of these negative controls across the microarray and their population has an average and a standard deviation. The signals associated with the negative controls are considered to be not biological signals. In an optimal noiseless system, the actual value of a probe with nothing bound to it should be zero. Therefore signals close to (within one standard deviation of the negative controls, e.g., within one standard deviation of zero) are considered to be in the noise or not distinguishable from zero.
- Estimating x 0 and W at event 120 is completed by starting with the y axis value of (max+min)/2, where "max” is the saturation value, "min” is the noise floor, followed by finding the two closest median log processed signals (MedianLogProcSig), one log processed signal above and one log processed signal below the y-value point, (max+min)/2.
- the log concentrations (conc.) for these two points are utilized for determining the slope and intercept for the data.
- the two data points nearest to (max+min)/2 are utilized to define a line through the spike in data in log space. The calculations for the slope and intercept of the spike-in data allow for the determination of parameters x 0 and W.
- the Min value after the sigmoidal fit a plurality of Spike-in replicates are averaged for each unique Spike-in sequence to be analyzed on the microarray.
- the Spike-in replicate averages from the probes discussed above are used as the starting Min Value for the curve fitting technique, while the final Min Value is gathered after the fitting of the Spike-in data values from the plurality of Spike-in's is complete, and represents the Low Threshold value for the microarray data.
- the estimated parameters may be adjusted or optimized using the Levenberg-Marquardt technique, allowing the optimization of the parameters from the sigmoidal curve fitting equation to best fit the data.
- Levenberg-Marquardt algorithm provides a numerical solution to the mathematical problem of minimizing a sum of squares of several, generally nonlinear functions that depend on a common set of parameters. This minimization problem arises especially in least squares curve fitting.
- the Levenberg-Marquardt algorithm interpolates between the Gauss-Newton algorithm and gradient descent. While the Levenberg-Marquardt technique is preferred in most embodiments, any algorithm which allows optimization of a curve fit using multiple parameters could be utilized.
- the parameters are used in a linear fitting equation, such as a least square fit, to calculate estimates of the dynamic range and the linear portion of the data in event 144.
- Estimating the linear range of the data involves using the linear equation and performing a linear fit on the data that has been determined to be 'close to linear'.
- the model chosen is based upon a sigmoidal function to determine certain parameters and then fitting the data in a linear fashion. While a sigmoidal curve fitting model is preferred in most embodiments, other curve fitting models such as a 4 th order polynomial can also be implemented to estimate parameters useful in determining the dynamic range of spike-in data.
- the low Threshold error in this embodiment can be defined by the following:
- the low threshold error is the sum average of the standard deviations squared, of the log processed Spike-in signals of Spike-ins whose AverageSignals* multiplicative Noise are below the standard deviation of the negative controls. For each Spike-in whose replicate average is close to the background noise, i.e.
- the Low Threshold Error could also be calculated using all data points with values below (x-2.3w). For each spike-in signal value below this threshold, the standard deviation of the data in linear space can be calculated and then and average of these SD values can be calculated.
- the "Max" value may be assumed to be approximately the same as the scanner saturation value when the chemistry of the microarray experiment is known to be carried out under non-saturating conditions.
- the Min value is determined as described above.
- the data points in the dynamic range of the Spike-in data are determined or estimated in event 150, by determining the low and high signal, low and high relative concentrations, the slope and the R-squared value derived from the parameterized curve fitting results. These data points can then be used to identify those spike-in probes that are optimized for use on the array and identification of these spike-in probes that provide optimization can be outputted for use by a user.
- x 0 as the center of the data, even when the data does not fit a symmetric sigmoidal model, the parameterized curve fitting routine is able to measure the dynamic range of the Spike-in data.
- the upper range of the data is (x 0 + c 1 w) and the lower range is (x 0 - c 2 w) where c 1 c 2 , c 1 and c 2 are multiples of w and are empirically determined to be 2.2 and 2.3, respectively.
- the values for c 1 and c 2 are determined to be within a certain percentage of "true linear", e.g. 15-16%. If the spike-in data is analyzed by c 1 w or c 2 w values away from x 0 , these data points are considered at the edge of what is identified as linear.
- c 1 and c 2 are chosen to provide a multiple of w, which is a distance away from x 0 , where w is non-linear enough to be identified as not in the linear region.
- the optimization of parameters for Spike-in microarray data at event 140 and also performed using the parametric curve fitting operation of event 130 will usually be embodied in logic that resides in a computer-readable medium associated with a computer system such as system 200 shown in Fig. 3.
- the computer system 200 includes any number of processors 202 (also referred to as central processing units, or CPUs) that are coupled to storage devices including primary storage 204 (typically a random access memory, or RAM), primary storage 206 (typically a read only memory, or ROM).
- primary storage 204 typically a random access memory, or RAM
- primary storage 206 typically a read only memory, or ROM
- primary storage 204 acts to transfer data and instructions uni-directionally to the CPU
- primary storage 206 is used typically to transfer data and instructions in a bi-directional manner
- Both of these primary storage devices may include any suitable computer-readable media containing program elements capable of performing parametric curve fitting operations described above.
- a mass storage device 208 is also coupled bi-directionally to CPU 202 and provides additional data storage capacity and may include any of the computer-readable media described above.
- Mass storage device 208 may be used to store programs, data and the like and is typically a secondary storage medium such as a hard disk that is slower than primary storage. It will be appreciated that the information retained within the mass storage device 208, may, in appropriate cases, be incorporated in standard fashion as part of primary storage 206 as virtual memory.
- a specific mass storage device such as a CD-ROM 214 may also pass data uni-directionally to the CPU 202.
- CPU 202 is also coupled to an interface 210 that includes one or more input/output devices such as such as video monitors, track balls, mice, keyboards, microphones, touch-sensitive displays, transducer card readers, magnetic or paper tape readers, tablets, styluses, voice or handwriting recognizers, or other well-known input devices such as, of course, other computers. Further, data received from a scanner and/or feature extraction system may be inputted to the system 200 via interface 210.
- CPU 202 optionally may be coupled to a computer or telecommunications network using a network connection as shown generally at 212. With such a network connection, it is contemplated that the CPU 202 might receive information from the network, or might output information to the network in the course of performing the above-described method steps.
- the above-described devices and materials will be familiar to those of skill in the computer hardware and software arts.
- the hardware elements described above may implement the instructions of multiple software modules for estimating the dynamic range of microarray Spike-in data by performing parametric curve fitting operations of this invention.
- instructions for estimating specific parameters to raw or normalized array data, for determining the dynamic range of Spike-in microarray data using sigmoidal curve fitting functions, and for generating graphical representations of the analyzed Spike-in data may be stored on mass storage device 208 or 214 and executed on CPU 202 in conjunction with primary memory 206.
- embodiments of the present invention further relate to computer readable media or computer program products that include program instructions and/or data (including data structures) for performing various computer-implemented operations.
- the media and program instructions may be those specially designed and constructed for the purposes of the present invention, or they may be of the kind well known and available to those having skill in the computer software arts.
- Examples of computer-readable media include, but are not limited to, magnetic media such as hard disks, floppy disks, and magnetic tape; optical media such as CD-ROM, CDRW, DVD-ROM, or DVD-RW disks; magneto-optical media such as "floptical” disks; and hardware devices that are specially configured to store and perform program instructions, such as read-only memory devices (ROM) and random access memory (RAM).
- Examples of program instructions include both machine code, such as produced by a compiler, and files containing higher level code that may be executed by the computer using an interpreter.
- This example demonstrates one embodiment of the methods for analyzing Spike-in controls for determining the dynamic and linear range of a microarray experiment.
- Ten Spike-in nucleotides of varying concentrations were added to a microarray sample. There were 30 replicate hybridization probes on the microarray for each of the ten Spike-in controls.
- Table 1 is a summary of the 300 replicates, 30 replicates for each Spike-in control (probes 1 through 10) tested on the microarray.
- Table 1 shows the integer ID of each probe tested which is a natural number that is a unique key or identifier in the feature extraction database.
- the log of the relative concentration, median processed signal, standard deviation of the processed signal, the %CV ((standard deviation/Average signal of a Spike-in) 100), and the signal to noise ratio (signal SNR, which is Average/standard deviation) for Spike-in is also shown in Table 1.
- the absolute concentrations of the Spike-ins can be difficult to precisely measure, but a Spike-in's relative concentration to the other Spike-ins is easily determined and was used in the method of determining the linear range of the microarray data.
- the standard deviation of the Negative Controls (SDNegCtls) in this example was 2.71, the Multiplicative Error Green was 0.1 and the Formulation Id for all probes was 2. In the feature extraction database the formulations were tracked.
- a formulation references the concentration and expected result of each Spike-in that has been determined previously. Depending on the type of application, the same Spike-in's can be reused but with a different formulation.
- the formulation ID identifies which formulation a given Spike-in's concentration result belongs to.
- the feature extraction software will know based upon the application (OneColor, TwoColor, or CGH) which formulation to use.
- Table 2 shows how the "Average” referred to in obtaining the %CV and signal SNR was calculated.
- gBgSubSigAve is a Spike-in's background subtracted signal(the signal produced by the feature extraction software after all of the "background” is removed) and then an average of this adjusted signal was computed for the Spike-in's replicates.
- Table 2 shows the gBgSubSigAve for eight of the ten Spike-ins in this example to demonstrate how the gBgSubSigAve value was utilized to identify which Spike-ins were utilized for estimating the initial minimum starting value.
- the estimation for Max, the saturation value, was log(65502) 4.81442.
- the signal detection limit statistics of the data were determined as the following; saturation point was 4.81, low threshold was 0.44, low threshold error was 0.64 and Spike-in detection limit was 0.94.
- the Spike-in signal detection limit statistic was calculated as follows; for all of the spike-ins with median log signal less than the low linear signal, calculate in bGSubSignal space the average and standard deviation of each spike-in sequence individually. For each one of these spike-ins, calculate (ave. + 1sd). In summary, determine the median value of the each Spike-in, take the log of that value, and determine the Spike-in detection limit.
Landscapes
- Physics & Mathematics (AREA)
- Health & Medical Sciences (AREA)
- Life Sciences & Earth Sciences (AREA)
- Medical Informatics (AREA)
- Engineering & Computer Science (AREA)
- Theoretical Computer Science (AREA)
- Spectroscopy & Molecular Physics (AREA)
- Bioinformatics & Cheminformatics (AREA)
- Bioinformatics & Computational Biology (AREA)
- Biotechnology (AREA)
- Evolutionary Biology (AREA)
- General Health & Medical Sciences (AREA)
- Biophysics (AREA)
- Bioethics (AREA)
- Genetics & Genomics (AREA)
- Molecular Biology (AREA)
- Computer Vision & Pattern Recognition (AREA)
- Artificial Intelligence (AREA)
- Data Mining & Analysis (AREA)
- Databases & Information Systems (AREA)
- Epidemiology (AREA)
- Evolutionary Computation (AREA)
- Public Health (AREA)
- Software Systems (AREA)
- Measuring Or Testing Involving Enzymes Or Micro-Organisms (AREA)
- Apparatus Associated With Microorganisms And Enzymes (AREA)
Abstract
Description
- Microarray experiments involve multi-step procedures where small differences among samples, techniques, or user-induced variations may alter the microarray data. The microarray community has realized that more quality control is needed in evaluating microarray data. By adding spike-in positive controls, the microarray data can be normalized from one experiment to the next, and hybridization specificity, user-induced variations as well as overall data quality can be addressed for each microarray.
- Spike-in controls often comprise a plurality of different transcripts or cDNA in predetermined ratio-generating concentrations that serve as positive microarray controls. Depending on the specific microarray, the spike-ins may be provided as a two-color RNA mixture or a one-color spike-in mixture. The transcripts or nucleotides in a spike-in cocktail have sequences which are designed to hybridize specifically to the control probes of a microarray with minimal self- or cross-hybridization. The spike-in control probes on the microarray are designed to avoid known complementary sequences to biological samples used on most microarrays.
- Presently, the most widely used methods for determining the dynamic range and linear region of spike-in microarray data involves basic analysis of signal level to background noise, t-statistic or significance analysis of microarray (SAM) test statistics. There is currently a need in the microarray industry for improved spike-in systems and methods of more efficiently overcoming the difficulties in determining the dynamic range of spike-in controls for microarrays.
- Methods for determining the dynamic and linear range of microarray data are provided. Specifically, a method for dynamic range analysis of positive control data for microarrays, comprising providing positive control data (Spike-in data) from a microarray experiment, identifying a plurality of parameters from the positive control data, applying the plurality of parameters to a curve fitting equation, determining a linear range of the positive control data, and applying the linear range of the positive control data to the microarray experiment.
- In some embodiments the curve fitting equation of the above method is a sigmoidal curve fitting equation. In particular, embodiments where the sigmoidal curve fitting equation is the following equation.

- In some embodiments, the plurality of parameters comprise a min, max, x0, and w parameters. The methods may further comprise, identifying the plurality of parameters by optimizing the plurality of parameters with a Levenberg-Marquardt technique. In most methods parameters x0, and w are utilized to determine the linear range of the microarray data.
- Some embodiments, also comprise determining the low threshold signal of the spike-in data, and in most instances the low threshold signal error value is determined as well as estimating a signal level for background noise of the spike-in data.
- In most embodiments, the methods further comprise estimating a signal for at least one probe which does not bind to a specific target of the microarray experiment. Thus the Spike-in nucleotide sequences are designed so they will not interfere with the hybridization of the sample of interest to the microarray.
- The methods of the invention are applicable to both 2-color and 1-color microarray experiments, but in particular 1-color microarrays.
- The methods of the invention may comprise converting the Spike-in data in terms of concentration of a given nucleotide (i.e. fmols/micro-liter) to determine the dynamic and linear range of the data.
- The invention also provides a computer readable medium carrying one or more sequences of instructions for identifying and selecting a plurality of parameters for analyzing Spike-in data of a microarray, wherein execution of one or more sequences of instructions by one or more processors causes the one or more processors to perform the steps of estimating said plurality of parameters, optimizing the plurality of parameters using a Levenberg-Marquart equation; and using the plurality of optimized parameters in a sigmoidal function to identify the linear range of the Spike-in data. In some embodiments, the computer readable medium further comprises identifying at least one of the plurality of parameters as a minimum signal value for the Spike-in data; and calculating a low threshold error value for the Spike-in data with the minimum signal value.
- Other features of the methods of the invention include providing an accurate way to determine the true saturation and noise of the microarray experiment as well as enabling troubleshooting and calibration of a plurality of microarray experiments. The Spike-in data also tests the labeling efficiency and reaction efficiency of a microarray experiment. For example if the Spike-in data does give a saturation point at the top of the Spike-in curve, this suggests that maybe the hybridization reaction time might be too short or the concentration of the Spike-in's needs to be increased. Or if the majority of the Spike-ins do not give a good signal, this may suggest that the dye labeling of the sample may not have been sufficient. The methods of the invention also enable the Spike-ins to give another population of data in which to calculate replicate statistics of a microarray.
- An alternative to SAM, the present invention, fills a need in the microarray industry for spike-in systems and methods which require only a single array with a spike-in control set.
- The present invention provides methods and systems which overcome the difficulties in determining the dynamic range of spike-in controls of microarrays mentioned above as well as providing advantages in determining the linear range of spike-ins over current methods.
- These and other features of the invention will become apparent to those persons skilled in the art upon reading the details of the methods, systems and computer readable media for the estimation of the dynamic range of spike-in microarray data as more fully described below.
- Embodiments of the present invention will now be described in detail, with reference to the accompanying drawings in which:
- Figs. 1A and 1B are illustrations of Intensity vs. Concentration plots of spike-ins of a microarray;
- Fig. 2 is a flow chart illustrating one embodiment of the method of the invention;
- Fig. 3 is a block diagram illustrating an example of a computer system which may be used in implementing the present invention;
- Fig. 4 is a graphical illustration comparing actual data of spike-ins to the fitted data of spike-ins obtained by the methods in accordance with the present invention.
- Before the present methods for determining the dynamic range of spike-ins for microarrays are described, it is to be understood that this invention is not limited to particular genes or chromosomes described, as such may, of course, vary. It is also to be understood that the terminology used herein is for the purpose of describing particular embodiments only, and is not intended to be limiting, since the scope of the present invention will be limited only by the appended claims.
- Where a range of values is provided, it is understood that each intervening value, to the tenth of the unit of the lower limit unless the context clearly dictates otherwise, between the upper and lower limits of that range is also specifically disclosed. Each smaller range between any stated value or intervening value in a stated range and any other stated or intervening value in that stated range is encompassed within the invention. The upper and lower limits of these smaller ranges may independently be included or excluded in the range, and each range where either, neither or both limits are included in the smaller ranges is also encompassed within the invention, subject to any specifically excluded limit in the stated range. Where the stated range includes one or both of the limits, ranges excluding either or both of those included limits are also included in the invention.
- Unless defined otherwise, all technical and scientific terms used herein have the same meaning as commonly understood by one of ordinary skill in the art to which this invention belongs. Although any methods and materials similar or equivalent to those described herein can be used in the practice or testing of the present invention, the preferred methods and materials are now described. All publications mentioned herein are incorporated herein by reference to disclose and describe the methods and/or materials in connection with which the publications are cited.
- It should be noted that as used herein and in the appended claims, the singular forms "a", "an", and "the" include plural referents unless the context clearly dictates otherwise. Thus, for example, reference to "a polynucleotide" includes a plurality of such polynucleotides and reference to "the probe" includes reference to one or more probes and equivalents thereof known to those skilled in the art, and so forth.
- The publications discussed herein are provided solely for their disclosure prior to the filing date of the present application. Nothing herein is to be construed as an admission that the present invention is not entitled to antedate such publication by virtue of prior invention. Further, the dates of publication provided may be different from the actual publication dates which may need to be independently confirmed.
- The term "nucleic acid" and "polynucleotide" are used interchangeably herein to describe a polymer of any length, e.g., greater than about 10 bases, greater than about 100 bases, greater than about 500 bases, greater than 1000 bases, usually up to about 10,000 or more bases composed of nucleotides, e.g., deoxyribonucleotides or ribonucleotides, or compounds produced synthetically (e.g., PNA as described in
U.S. Patent No. 5,948,902 and the references cited therein) which can hybridize with naturally occurring nucleic acids in a sequence specific manner analogous to that of two naturally occurring nucleic acids, e.g., can participate in Watson-Crick base pairing interactions. - The terms "ribonucleic acid" and "RNA" as used herein mean a polymer composed of ribonucleotides.
- The terms "deoxyribonucleic acid" and "DNA" as used herein mean a polymer composed of deoxyribonucleotides.
- The term "oligonucleotide" as used herein denotes single stranded nucleotide multimers of from about 10 to 100 nucleotides and up to 200 nucleotides in length. Oligonucleotides are usually synthetic and, in many embodiments, are under 60 nucleotides in length.
- The term "oligomer" is used herein to indicate a chemical entity that contains a plurality of monomers. As used herein, the terms "oligomer" and "polymer" are used interchangeably, as it is generally, although not necessarily, smaller "polymers" that are prepared using the functionalized substrates of the invention, particularly in conjunction with combinatorial chemistry techniques. Examples of oligomers and polymers include polydeoxyribonucleotides (DNA), polyribonucleotides (RNA), other nucleic acids that are C-glycosides of a purine or pyrimidine base, polypeptides (proteins), polysaccharides (starches, or polysugars), and other chemical entities that contain repeating units of like chemical structure.
- The term "sample" as used herein relates to a material or mixture of materials, typically, although not necessarily, in fluid form, containing one or more components of interest.
- The terms "nucleoside" and "nucleotide" are intended to include those moieties that contain not only the known purine and pyrimidine bases, but also other heterocyclic bases that have been modified. Such modifications include methylated purines or pyrimidines, acylated purines or pyrimidines, alkylated riboses or other heterocycles. In addition, the terms "nucleoside" and "nucleotide" include those moieties that contain not only conventional ribose and deoxyribose sugars, but other sugars as well. Modified nucleosides or nucleotides also include modifications on the sugar moiety, e.g., wherein one or more of the hydroxyl groups are replaced with halogen atoms or aliphatic groups, or are functionalized as ethers, amines, or the like.
- The phrase "surface-bound polynucleotide" refers to a polynucleotide "probe" that is immobilized on a surface of a solid substrate, where the substrate can have a variety of configurations, e.g., a sheet, bead, or other structure. In certain embodiments, the collections of oligonucleotide probe elements employed herein are present on a surface of the same planar support, e.g., in the form of an array.
- A "labeled population of nucleic acids" refers to mixture of nucleic acids that are detectably labeled, e.g., fluorescently labeled, such that the presence of the nucleic acids can be detected by assessing the presence of the label. A labeled population of nucleic acids is "made from" a chromosome sample, and the chromosome sample is usually employed as template for making the population of nucleic acids.
- The term "array" encompasses the term "microarray" and refers to an ordered array presented for binding to nucleic acids and the like.
- An "array," includes any two-dimensional or substantially two-dimensional (as well as a three-dimensional) arrangement of spatially addressable regions bearing nucleic acid probes, particularly oligonucleotides or synthetic mimetics thereof, and the like. Where the arrays are arrays of nucleic acids, the nucleic acid probes may be adsorbed, physisorbed, chemisorbed, or covalently attached to the arrays at any point or points along the nucleic acid chain.
- Any given substrate may carry one, two, four or more arrays disposed on a front surface of the substrate. Depending upon the use, any or all of the arrays may be the same or different from one another and each may contain multiple spots or features. A typical array may contain one or more, including more than two, more than ten, more than one hundred, more than one thousand, more ten thousand features, or even more than one hundred thousand features, in an area of less than 20 cm2 or even less than 10 cm2, e.g., less than about 5cm2, including less than about 1 cm2, less than about 1 mm2, e.g., 100 µm2, or even smaller. For example, features may have widths (that is, diameter, for a round spot) in the range from a 10 µm to 1.0 cm. In other embodiments each feature may have a width in the range of 1.0 µm to 1.0 mm, usually 5.0 µm to 500 µm, and more usually 10 µm to 200 µm. Non-round features may have area ranges equivalent to that of circular features with the foregoing width (diameter) ranges. At least some, or all, of the features are of different compositions (for example, when any repeats of each feature composition are excluded the remaining features may account for at least 5%, 10%, 20%, 50%, 95%, 99% or 100% of the total number of features). Inter-feature areas will typically (but not essentially) be present which do not carry any nucleic acids (or other biopolymer or chemical moiety of a type of which the features are composed). Such inter-feature areas typically will be present where the arrays are formed by processes involving drop deposition of reagents but may not be present when, for example, photolithographic array fabrication processes are used. It will be appreciated though, that the inter-feature areas, when present, could be of various sizes and configurations.
- Each array may cover an area of less than 200 cm2, or even less than 50 cm2, 5 cm2, 1 cm2, 0.5 cm2, or 0.1 cm2. In certain embodiments, the substrate carrying the one or more arrays will be shaped generally as a rectangular solid (although other shapes are possible), having a length of more than 4 mm and less than 150 mm, usually more than 4 mm and less than 80 mm, more usually less than 20 mm; a width of more than 4 mm and less than 150 mm, usually less than 80 mm and more usually less than 20 mm; and a thickness of more than 0.01 mm and less than 5.0 mm, usually more than 0.1 mm and less than 2 mm and more usually more than 0.2 and less than 1.5 mm, such as more than about 0.8 mm and less than about 1.2 mm. With arrays that are read by detecting fluorescence, the substrate may be of a material that emits low fluorescence upon illumination with the excitation light. Additionally in this situation, the substrate may be relatively transparent to reduce the absorption of the incident illuminating laser light and subsequent heating if the focused laser beam travels too slowly over a region. For example, the substrate may transmit at least 20%, or 50% (or even at least 70%, 90%, or 95%), of the illuminating light incident on the front as may be measured across the entire integrated spectrum of such illuminating light or alternatively at 532 nm or 633 nm.
- Arrays can be fabricated using drop deposition from pulse-jets of either nucleic acid precursor units (such as monomers) in the case of in situ fabrication, or the previously obtained nucleic acid. Such methods are described in detail in, for example, the previously cited references including
US6242266 ,US6232072 ,US6180351 ,US6171797 ,US6323043 ,U.S. Patent Application Serial No. 09/302,898 filed April 30, 1999 - An array is "addressable" when it has multiple regions of different probes (e.g., different oligonucleotide sequences) such that a region (i.e., a "feature" or "spot" of the array) at a particular predetermined location (i.e., an "address") on the array will detect a particular target sequence. Array features are typically, but need not be, separated by intervening spaces. It should be noted that the terms "target" and "probe" are sometimes used differently in certain publications.
- A "scan region" refers to a contiguous (preferably, rectangular) area in which the array spots, probes or features of interest are found or detected. Where fluorescent labels are employed, the scan region is that portion of the total area illuminated from which the resulting fluorescence is detected and recorded. Where other detection protocols are employed, the scan region is that portion of the total area queried from which resulting signal is detected and recorded. For the purposes of this invention and with respect to fluorescent detection embodiments, the scan region includes the entire area of the slide scanned in each pass of the lens, between the first feature of interest, and the last feature of interest, even if there exist intervening areas that lack features of interest.
- An "array layout" refers to one or more characteristics of the features, such as feature positioning on the substrate, one or more feature dimensions, and an indication of a moiety at a given location. "Hybridizing" and "binding", with respect to nucleic acids, are used interchangeably.
- . The term "stringent assay conditions" as used herein refers to conditions that are compatible to produce binding pairs of nucleic acids, e.g., probes and targets, of sufficient complementarity to provide for the desired level of specificity in the assay while being incompatible to the formation of binding pairs between binding members of insufficient complementarity to provide for the desired specificity. The term "stringent assay conditions" refers to the combination of hybridization and wash conditions.
- A "stringent hybridization" and "stringent hybridization wash conditions" in the context of nucleic acid hybridization (e.g., as in array, Southern or Northern hybridizations) are sequence dependent, and are different under different environmental parameters. Stringent hybridization conditions that can be used to identify nucleic acids within the scope of the invention can include, e.g., hybridization in a buffer comprising 50% formamide, 5xSSC, and 1% SDS at 42°C, or hybridization in a buffer comprising 5×SSC and 1% SDS at 65°C, both with a wash of 0.2xSSC and 0.1% SDS at 65°C. Exemplary stringent hybridization conditions can also include a hybridization in a buffer of 40% formamide, 1 M NaCl, and 1% SDS at 37°C, and a wash in 1×SSC at 45°C. Alternatively, hybridization to filter-bound DNA in 0.5 M NaHPO4, 7% sodium dodecyl sulfate (SDS), 1 mnM EDTA at 65°C, and washing in 0.1×SSC/0.1% SDS at 68°C can be employed. Yet additional stringent hybridization conditions include hybridization at 60°C or higher and 3 × SSC (450 mM sodium chloride/45 mM sodium citrate) or incubation at 42°C in a solution containing 30% formamide, 1M NaCl, 0.5% sodium sarcosine, 50 mM MES, pH 6.5. Those of ordinary skill will readily recognize that alternative but comparable hybridization and wash conditions can be utilized to provide conditions of similar stringency.
- In certain embodiments, the stringency of the wash conditions determine whether a nucleic acid is specifically hybridized to a probe. Wash conditions used to identify nucleic acids may include, e.g.: a salt concentration of about 0.02 molar at pH 7 and a temperature of at least about 50 °C or about 55°C to about 60°C; or, a salt concentration of about 0.15 M NaCl at 72°C for about 15 minutes; or, a salt concentration of about 0.2xSSC at a temperature of at least about 50°C or about 55 °C to about 60°C for about 15 to about 20 minutes; or, the hybridization complex is washed twice with a solution with a salt concentration of about 2×SSC containing 0.1% SDS at room temperature for 15 minutes and then washed twice by 0.1×SSC containing 0.1% SDS at 68°C for 15 minutes; or, equivalent conditions. Stringent conditions for washing can also be, e.g., 0.2×SSC/0.1% SDS at 42°C. In instances wherein the nucleic acid molecules are deoxyoligonucleotides ("oligos"), stringent conditions can include washing in 6xSSC/0.05% sodium pyrophosphate at 37 °C (for 14-base oligos), 48 °C (for 17-base oligos), 55°C (for 20-base oligos), and 60°C (for 23-base oligos). See Sambrook, Ausubel, or Tijssen (cited below) for detailed descriptions of equivalent hybridization and wash conditions and for reagents and buffers, e.g., SSC buffers and equivalent reagents and conditions.
- Stringent hybridization conditions may also include a "prehybridization" of aqueous phase nucleic acids with complexity-reducing nucleic acids to suppress repetitive sequences. For example, certain stringent hybridization conditions include, prior to any hybridization to surface-bound polynucleotides, hybridization with Cot-1 DNA, or the like.
- Stringent assay conditions are hybridization conditions that are at least as stringent as the above representative conditions, where a given set of conditions are considered to be at least as stringent if substantially no additional binding complexes that lack sufficient complementarity to provide for the desired specificity are produced in the given set of conditions as compared to the above specific conditions, where by "substantially no more" is meant less than about 5-fold more, typically less than about 3-fold more. Other stringent hybridization conditions are known in the art and may also be employed, as appropriate.
- The term "mixture", as used herein, refers to a combination of elements, that are interspersed and not in any particular order. A mixture is heterogeneous and not spatially separable into its different constituents. Examples of mixtures of elements include a number of different elements that are dissolved in the same aqueous solution, or a number of different elements attached to a solid support at random or in no particular order in which the different elements are not specially distinct. In other words, a mixture is not addressable. To be specific, an array of surface-bound polynucleotides, as is commonly known in the art and described below, is not a mixture of capture agents because the species of surface-bound polynucleotides are spatially distinct and the array is addressable.
- "Isolated" or "purified" generally refers to isolation of a substance (compound, polynucleotide, protein, polypeptide, polypeptide, chromosome, etc.) such that the substance comprises the majority percent of the sample in which it resides. Typically in a sample a substantially purified component comprises 50%, preferably 80%-85%, more preferably 90-95% of the sample. Techniques for purifying polynucleotides, polypeptides and intact chromosomes of interest are well-known in the art and include, for example, ion-exchange chromatography, affinity chromatography, sorting, and sedimentation according to density.
- The terms "assessing" and "evaluating" are used interchangeably to refer to any form of measurement, and include determining if an element is present or not. The terms "determining," "measuring," and "assessing," and "assaying" are used interchangeably and include both quantitative and qualitative determinations. Assessing may be relative or absolute. "Assessing the presence of' includes determining the amount of something present, as well as determining whether it is present or absent.
- If a surface-bound polynucleotide "corresponds to" a chromosome, the polynucleotide usually contains a sequence of nucleic acids that is unique to that chromosome. Accordingly, a surface-bound polynucleotide that corresponds to a particular chromosome usually specifically hybridizes to a labeled nucleic acid made from that chromosome, relative to labeled nucleic acids made from other chromosomes. Array features, because they usually contain surface-bound polynucleotides, can also correspond to a chromosome.
- The term "MultErrorGreen" or multiplicative error in the green channel of a typical microarray scanner is the noise that is proportional to the signal which has been determined to be about 8%, for example, a 100 count signal has 8 counts of multiplicative noise, and a 10,000 count signal has 800 counts of multiplicative noise.
- The term "dynamic range" refers to a portion of microarray data in which the lower limit is at the limit of detection above the noise of the background (e.g.. the signal is statistically significantly different from zero. In general, the signal is a multiple (3x) of the background noise or the p-value of a t-test comparison between signal and background is below a threshold, e.g. 0.01. The upper limit of the dynamic range is the signal level where the signal saturates (e.g. additional concentration of the target does not increase the signal). The dynamic range comprises the range of signals between these extremes.
- The term "linear range" refers to a portion of microarray data where the data is linear within the dynamic range of the data. "Linear range" means that a fit of the measured signal intensity versus known spike-in concentrations can be fit with a line when the data is better than a specified measure of linearity (e.g. R2). R-Squared is the statistical measure of how well a regression line approximates the real data. For example, an r-squared of 1.0 (100%) indicates the line fits through the data perfectly. The slope of the data can also measure how linear the data is, since the fitting and the plotting of the data are both completed in log space. Optimally, the data will generate a slope near 1 and a r-squared value near 1.
- The term "Spike-in" refers to a positive control nucleic acid which is added to the sample to be analyzed by a microarray experiment. In general, a "Spike-in" is composed of two parts, a probe and a target (positive control) sequence. The target is 'Spiked In' to the sample mixture and placed on the microarray. The probe refers to the strand of DNA attached to the microarray that the target specifically hybridizes to. A "Spike-in kit" comprises a plurality of different nucleic acids, at varying concentrations, allowing a range of signal intensities for these positive controls to be utilized in analyzing the microarray data. For example, a Spike-In kit may comprise 10 unique target (positive control) sequences, and for each of the 10 different Spike-ins there maybe 30 replicated probes on the microarray for a total of 300 probes randomly placed around the microarray that the Spike-ins can hybridize with. The concentration and the quantity of Spike-In nucleic acid added to the sample is known, allowing quantitative analysis of the microarray experiment.
- The methods of the invention are described in terms of use with data derived from arrays or microarrays. It should be understood, however, that the invention may be used with any data that carries spike-in control data, including data derived from arrays, polymerase chain reaction (PCR) experiments, cell sorting, or other techniques. The invention is also described in terms of use with DNA-based arrays, and it is contemplated that the invention may be used with data generated from RNA-based arrays as well.
- One of the features of many microarray platforms is the ability to "Spike-in" a cocktail of known quantities of specific nucleotides that hybridize against known probes in the microarray, in order to perform a quality check of the array and/or the experiment. The so called "spike ins" give the user data which is useful in identifying possible problems or issues with the hybridization, labeling, array design, sample concentration, etc.
- Spike-in samples are designed so that the various nucleotides in the Spike-in sample provide a range of signal intensities to compare to the microarray results. Spike-in probes are replicated across the microarray to evaluate reproducibility of both the signals and the log ratios of microarray data for quality control of microarray experiments. For example, a microarray Spike-in kit, may have 10 different Spike-in sequences or probes, with 30 replicates of each hybridizing probe positioned across a microarray.
- In general, the Spike-in concentration-response of a microarray experiment is represented graphically by a plot of the Log of the Processed Signal (LogProcSig) of the Spike-in nucleic acids vs. the Log of the concentration of each Spike-In utilized in the experiment. The plot is usually sigmoidal, having two asymptotes: one at the scanner saturation point; and one at the level of signal for sequences with no specifically bound target or not enough specifically bound target to generate signal greater than the background noise. Such a plot is shown in Fig. 1A. Other microarrays may produce concentration-response plots which are missing one of the asymptotes, as illustrated in Fig. 1B. The Spike-In sample data shown in Fig. 1A and 1B comprises ten different nucleotides with varying concentrations.
- Fig. 1A shows the dose/response curve of the spike-ins from the
detection limit saturation point linear range intensities signal intensity - In one embodiment, the method of the invention comprises providing a plurality of unique Spike-ins sequences (for example, 10 different Spike-in controls), and a plurality of probe replicates for each Spike-in (for example, 30 replicate probes specific for each Spike-in control) across a microarray. The method further comprises hybridizing the microarray, scanning and processing to obtain signals from the probes on the microarray and calculating the signal average (Ave) of the Spike-in replicates for each Spike-in sequence as well as the standard deviation(SD) in linear space (representation), followed by converting the data into log space to avoid the undesirable effect of signals below zero being excluded from the data. In this embodiment, the log space representation is still affected when the average value of the replicated Spike-in is below zero, but the signal averages and standard deviation are very accurate when the average signal (Ave) is above zero. The SD in log space may be calculated by:

- where variable x, in most embodiments, is 1 and the values for AVE (average spike-in probe signals of replicates) and SD (standard deviation of probe signals of replicates) are determined in linear space. If (AVE - 1SD) is below zero, the data is censored from the log space plot and (AVE + 1SD) is used as the size of the error bar for both the upper and lower error bar of that particular Spike-in signal in log space.
- Fig. 1B illustrates a concentration-response plot which has only one asymptote. In this plot, three of the Spike-in nucleotides have low signal levels where the signal is dropping into the
background noise linear range - Referring to Fig. 2, there is shown is a flow chart of one embodiment of the subject methods for estimating the dynamic range of microarray DNA Spike-in data utilizing a parametric curve fitting technique. The parametric curve
fitting method 100 comprises providing spike-in data from a microarray atevent 110. In at least one embodiment, this provision of spike-in data comprises signals obtained from scanning and processing a microarray containing spike-in probes and inputting the spike-in signal data to a system, e.g., such as described with regard to Fig. 3 below, for example. -
Event 110 comprises, applying feature extraction software (e.g., Agilent Feature Extraction Software, Agilent Technologies, Inc., Palo Alto, California) which has a list of probes used for Spike-ins. The software comprises multiple spike-in sets and the user can indicate which spike-in set they are using (e.g. 1-color or 2-color or CGH or another), such as by selection via an interactive user interface on a computer display, for example. After extracting the microarray data, the feature extraction software identifies which data comes from the specified probes for the selected spike-ins and this data is utilized in downstream events of the methods of the invention. In most embodiments, the sets of probes used for spike-ins are included in the common controls table in the feature extraction software. - At
event 120, estimated values are calculated for selected data parameters from the Spike In data which are useful in estimating the dynamic range. Initially, some statistics are calculated, such as the signal average, Standard Deviation, Percent CV (coefficient of variation) for a plurality of Spike-in replicates.Event 120 may also include estimating the line that fits the linear range of the microarray data. The specific sigmoidal curve fitting parameters identified from the data inevent 120, may include but are not limited to, estimates for "Min", "Max", "x0" and "w" parameters. The value "Max" is generally the value for the saturation point of the scanner or the upper limit of detection. Most microarray scanners include this information on the image of the data, i.e. the header of a tiff image of the data. The "Min" value, in general, is the noise background value or the level of signal for sequences with no specifically bound target. The "x0" value is the center of the data (i.e. for x0 the associated signal in signal space is halfway between Min and Max) and is close to the center of the linear range of the data, and "w" is the width of the curve on either side of x0 (in concentration space). - To estimate the parameters in
event 120, the following assumptions may be made with regard to the Spike-in data. First, the signal saturation point is assumed to be fixed at or close to the scanner detection limit. For the embodiment shown in Fig. 1, this value is Log(Scanner saturation value) = 4.82. The value of 4.82 derives from the saturation value of the scanner, which in this embodiment is approximately 216 represented in log space. The saturation value is dependent on many factors, including but limited to the type of scanner, or the range of the scan (normal or extended dynamic range). In most embodiments, the asymptotes for the maximum and the minimum signals are not necessarily symmetric, e.g., the upper asymptote may be a function of the scanner offset, while the lower asymptote may be a function of the background noise. - Estimating a starting point for the "Min" value in most embodiments may be completed by calculating the signal average of spike-in replicates for each spike-in sequence on a microarray. For example, the number of Spike-in probes on an array will total 300 when there are 10 different Spike-ins, each with 30 replicate probes spread out randomly across the array. If the value of the average signal of the replicate data points of a Spike-in nucleotide, multiplied by the value of the multiplicative error in the green channel (MultErrorGreen) of a typical scanner is less than the standard deviation of the negative controls (NegCtrls) on the microarray, then a minimum value for the microarray data is obtained and that particular Spike-in is considered part of the minimum value data set.
- Negative controls are probes on the microarray which are designed not to bind to any sequence known in the genome or sample being tested, allowing the identification of signal intensities related to nonspecific binding and/or background noise from the equipment. There may be many replicates of these negative controls across the microarray and their population has an average and a standard deviation. The signals associated with the negative controls are considered to be not biological signals. In an optimal noiseless system, the actual value of a probe with nothing bound to it should be zero. Therefore signals close to (within one standard deviation of the negative controls, e.g., within one standard deviation of zero) are considered to be in the noise or not distinguishable from zero. All Spike-in probes have been "spiked in" to generate a real signal, but given multiplicative noise, any Spike-in whose signal average multiplied by the multiplicative noise is less than one standard deviation of the negative controls, is hard to detect given the noise of the system and therefore makes a good candidate probe for use in the determination of the Min value.
- Estimating x0 and W at
event 120 is completed by starting with the y axis value of (max+min)/2, where "max" is the saturation value, "min" is the noise floor, followed by finding the two closest median log processed signals (MedianLogProcSig), one log processed signal above and one log processed signal below the y-value point, (max+min)/2. The log concentrations (conc.) for these two points are utilized for determining the slope and intercept for the data. The two data points nearest to (max+min)/2 are utilized to define a line through the spike in data in log space. The calculations for the slope and intercept of the spike-in data allow for the determination of parameters x0 and W. - The slope of the line for a log signal vs. log concentration plot of the spike-in data is generally considered to be the following:


where the slope and the intercept are derived from the linear fit, and HighSignal and LowSignal refer to the log processed signals above and below the y-value, (max+min)/2, data point of the Spike-in data, respectively. - After determining the slope and intercept of the line connecting the two Spike-in data points nearest (max+min)/2, the width of the data "w" is determined by applying the following equation:


- The curve fitting equation of
event 130, was chosen based upon looking at the Spike-In data as a sigmoidal function described by:
- In most embodiments, to determine the Low Threshold value of the data, the Min value after the sigmoidal fit, a plurality of Spike-in replicates are averaged for each unique Spike-in sequence to be analyzed on the microarray. The Spike-in replicate averages from the probes discussed above (candidate probes for Min value determination) are used as the starting Min Value for the curve fitting technique, while the final Min Value is gathered after the fitting of the Spike-in data values from the plurality of Spike-in's is complete, and represents the Low Threshold value for the microarray data.
- After the estimates of the parameters Min, Max, x0, w are completed in
event 120, and subjected to the curve fitting equation inevent 130, the data is fit and the parameters (Min, Max, x0, w) are optimized inevent 140. In one embodiment the estimated parameters may be adjusted or optimized using the Levenberg-Marquardt technique, allowing the optimization of the parameters from the sigmoidal curve fitting equation to best fit the data. Levenberg- Marquardt algorithm provides a numerical solution to the mathematical problem of minimizing a sum of squares of several, generally nonlinear functions that depend on a common set of parameters. This minimization problem arises especially in least squares curve fitting. The Levenberg-Marquardt algorithm interpolates between the Gauss-Newton algorithm and gradient descent. While the Levenberg-Marquardt technique is preferred in most embodiments, any algorithm which allows optimization of a curve fit using multiple parameters could be utilized. - Once the parameters have been adjusted in
event 140, the parameters are used in a linear fitting equation, such as a least square fit, to calculate estimates of the dynamic range and the linear portion of the data inevent 144. Estimating the linear range of the data involves using the linear equation and performing a linear fit on the data that has been determined to be 'close to linear'. In the examples shown in Figs. 1 and 2, the model chosen is based upon a sigmoidal function to determine certain parameters and then fitting the data in a linear fashion. While a sigmoidal curve fitting model is preferred in most embodiments, other curve fitting models such as a 4th order polynomial can also be implemented to estimate parameters useful in determining the dynamic range of spike-in data. - Calculating the statistics of the data (High and Low signal; High and Low Concentration, Saturation value, Low Threshold and Low Threshold error) is completed using the data fitting performed above. The Low Relative Concentration is calculated as x0 - 2.2(w) and the High relative Concentration is calculated as x0 + 2.3(w). All the points falling between x0- 2.2(w) and x0 + 2.3(w) are fit or modeled through a line with the Slope and R-Squared value reported and are considered to be in the dynamic range of the Spike-in data. The High and Low Signals are calculated from the Sigmoid fit and are considered to be the ends of the linear dynamic range.
- The low Threshold error in this embodiment, can be defined by the following:
-

- The low threshold error is the sum average of the standard deviations squared, of the log processed Spike-in signals of Spike-ins whose AverageSignals* multiplicative Noise are below the standard deviation of the negative controls. For each Spike-in whose replicate average is close to the background noise, i.e. Average(Spike-in(x))(MultErrorGreen) < SD(NegCtrls)), where variable x is the number of replicate probes on a microarray for a particular Spike-in, the standard deviation (SD) of the Log of their processed signals is determined and then the square root of the sum of the squares of the processed signals of these Spike-in's with values close to the background noise are considered to be the Low Threshold Error.
- The Low Threshold Error could also be calculated using all data points with values below (x-2.3w). For each spike-in signal value below this threshold, the standard deviation of the data in linear space can be calculated and then and average of these SD values can be calculated.
- The "Max" value may be assumed to be approximately the same as the scanner saturation value when the chemistry of the microarray experiment is known to be carried out under non-saturating conditions. The Min value is determined as described above.
- After the parameterized curve fitting routine is completed in
event 130 and optimization of the parameters by the Levenberg Marquart technique in 140, the data points in the dynamic range of the Spike-in data are determined or estimated inevent 150, by determining the low and high signal, low and high relative concentrations, the slope and the R-squared value derived from the parameterized curve fitting results. These data points can then be used to identify those spike-in probes that are optimized for use on the array and identification of these spike-in probes that provide optimization can be outputted for use by a user. By using x0 as the center of the data, even when the data does not fit a symmetric sigmoidal model, the parameterized curve fitting routine is able to measure the dynamic range of the Spike-in data. With x0 being the center of the data and w is the width of the data, then the upper range of the data is (x0 + c1w) and the lower range is (x0 - c2w) where c1c2, c1 and c2 are multiples of w and are empirically determined to be 2.2 and 2.3, respectively. The values for c1 and c2 are determined to be within a certain percentage of "true linear", e.g. 15-16%. If the spike-in data is analyzed by c1w or c2w values away from x0, these data points are considered at the edge of what is identified as linear. In actuality, the Spike-in data is usually never perfectly linear, but the further away from x0 a data point is, in general, the less linear the data is. Thus c1 and c2 are chosen to provide a multiple of w, which is a distance away from x0, where w is non-linear enough to be identified as not in the linear region.
- The optimization of parameters for Spike-in microarray data at
event 140 and also performed using the parametric curve fitting operation ofevent 130 will usually be embodied in logic that resides in a computer-readable medium associated with a computer system such assystem 200 shown in Fig. 3. Thecomputer system 200 includes any number of processors 202 (also referred to as central processing units, or CPUs) that are coupled to storage devices including primary storage 204 (typically a random access memory, or RAM), primary storage 206 (typically a read only memory, or ROM). As is well known in the art,primary storage 204 acts to transfer data and instructions uni-directionally to the CPU, andprimary storage 206 is used typically to transfer data and instructions in a bi-directional manner Both of these primary storage devices may include any suitable computer-readable media containing program elements capable of performing parametric curve fitting operations described above. - A
mass storage device 208 is also coupled bi-directionally toCPU 202 and provides additional data storage capacity and may include any of the computer-readable media described above.Mass storage device 208 may be used to store programs, data and the like and is typically a secondary storage medium such as a hard disk that is slower than primary storage. It will be appreciated that the information retained within themass storage device 208, may, in appropriate cases, be incorporated in standard fashion as part ofprimary storage 206 as virtual memory. A specific mass storage device such as a CD-ROM 214 may also pass data uni-directionally to theCPU 202. -
CPU 202 is also coupled to aninterface 210 that includes one or more input/output devices such as such as video monitors, track balls, mice, keyboards, microphones, touch-sensitive displays, transducer card readers, magnetic or paper tape readers, tablets, styluses, voice or handwriting recognizers, or other well-known input devices such as, of course, other computers. Further, data received from a scanner and/or feature extraction system may be inputted to thesystem 200 viainterface 210.CPU 202 optionally may be coupled to a computer or telecommunications network using a network connection as shown generally at 212. With such a network connection, it is contemplated that theCPU 202 might receive information from the network, or might output information to the network in the course of performing the above-described method steps. The above-described devices and materials will be familiar to those of skill in the computer hardware and software arts. - The hardware elements described above may implement the instructions of multiple software modules for estimating the dynamic range of microarray Spike-in data by performing parametric curve fitting operations of this invention. For example, instructions for estimating specific parameters to raw or normalized array data, for determining the dynamic range of Spike-in microarray data using sigmoidal curve fitting functions, and for generating graphical representations of the analyzed Spike-in data, may be stored on
mass storage device CPU 202 in conjunction withprimary memory 206. - In addition, embodiments of the present invention further relate to computer readable media or computer program products that include program instructions and/or data (including data structures) for performing various computer-implemented operations. The media and program instructions may be those specially designed and constructed for the purposes of the present invention, or they may be of the kind well known and available to those having skill in the computer software arts. Examples of computer-readable media include, but are not limited to, magnetic media such as hard disks, floppy disks, and magnetic tape; optical media such as CD-ROM, CDRW, DVD-ROM, or DVD-RW disks; magneto-optical media such as "floptical" disks; and hardware devices that are specially configured to store and perform program instructions, such as read-only memory devices (ROM) and random access memory (RAM). Examples of program instructions include both machine code, such as produced by a compiler, and files containing higher level code that may be executed by the computer using an interpreter.
- The following example is put forth so as to provide those of ordinary skill in the art with a complete disclosure and description of how to make and use the present invention, and is not intended to limit the scope of what the inventors regard as their invention nor is it intended to represent that the experiment below is the only experiment performed. Efforts have been made to ensure accuracy with respect to numbers used (e.g. signal values, averages, etc.) but some experimental errors and deviations should be accounted for.
- This example demonstrates one embodiment of the methods for analyzing Spike-in controls for determining the dynamic and linear range of a microarray experiment. Ten Spike-in nucleotides of varying concentrations were added to a microarray sample. There were 30 replicate hybridization probes on the microarray for each of the ten Spike-in controls. Table 1 is a summary of the 300 replicates, 30 replicates for each Spike-in control (probes 1 through 10) tested on the microarray. Table 1 shows the integer ID of each probe tested which is a natural number that is a unique key or identifier in the feature extraction database. The log of the relative concentration, median processed signal, standard deviation of the processed signal, the %CV ((standard deviation/Average signal of a Spike-in) 100), and the signal to noise ratio (signal SNR, which is Average/standard deviation) for Spike-in is also shown in Table 1. The absolute concentrations of the Spike-ins can be difficult to precisely measure, but a Spike-in's relative concentration to the other Spike-ins is easily determined and was used in the method of determining the linear range of the microarray data. The standard deviation of the Negative Controls (SDNegCtls) in this example was 2.71, the Multiplicative Error Green was 0.1 and the Formulation Id for all probes was 2. In the feature extraction database the formulations were tracked. A formulation references the concentration and expected result of each Spike-in that has been determined previously. Depending on the type of application, the same Spike-in's can be reused but with a different formulation. The formulation ID identifies which formulation a given Spike-in's concentration result belongs to. The feature extraction software will know based upon the application (OneColor, TwoColor, or CGH) which formulation to use.
TABLE 1 Integer Id Probe LogRelConc Median Log ProcSignal Standard Deviation ProcSignal % CV ProcSignal Signal SNR 22 1 0.30103 0.509787 0.537449 98.8104 0.994801 24 2 1.30103 0.703307 0.338339 57.9526 1.89277 26 3 2.30103 1.66856 0.066142 14.5468 24.7572 28 4 3.30103 2.66239 0.019894 4.6449 134.242 30 5 3.82607 2.94502 0.028298 6.66392 104.1 32 6 4.30103 3.58682 0.028713 6.71352 125.063 34 7 4.82413 4.2658 0.024955 5.86718 170.981 36 8 5.30103 4.66276 0.026417 6.17865 176.571 38 9 5.82393 4.81442 1.25E-05 0.002889 383702 40 10 6.30103 4.81442 1.39E-05 0.003202 346260 - Table 2 shows how the "Average" referred to in obtaining the %CV and signal SNR was calculated. gBgSubSigAve is a Spike-in's background subtracted signal( the signal produced by the feature extraction software after all of the "background" is removed) and then an average of this adjusted signal was computed for the Spike-in's replicates. Table 2 shows the gBgSubSigAve for eight of the ten Spike-ins in this example to demonstrate how the gBgSubSigAve value was utilized to identify which Spike-ins were utilized for estimating the initial minimum starting value. If the gBgSubSigAve value of a Spike-in multiplied by the Multiplicative Error Green value, 0.1 was less than the standard deviation of the negative controls, that particular Spike-in was utilized to determine the initial Minimum value estimation, i.e. the Low Threshold value. In this example, probes 1 and 2 were considered to the minimum value estimation but probe 3 was not. 70(.1) < 2.71 so probe 1 was considered for the Minimum point estimation, 5.49(.1) < 2.71 so probe 2 was considered for the min but, 43.87(.1) > 2.71 so probe 3 as well as the rest of the probes were not utilized for the minimum initial estimation.
TABLE 2 Probe Number gBgSubSigAve 1 0.708232 2 5.4946 3 43.8735 4 468.909 5 884.569 6 3907.59 7 18516 8 46268.1 - Taking the Median Processed Signals of the two considered probes (probes 1 and 2), the Minimum value or Low threshold value was calculated to be:


- The estimation for Max, the saturation value, was log(65502) = 4.81442. The Spike-ins with the lowest and highest Log relative concentration were utilized for the estimation of X0, i.e. X0 = (6.30103 + 0.30103) / 2 = 3.30103, and giving an estimation for w, w = 1. The signal detection limit statistics of the data were determined as the following; saturation point was 4.81, low threshold was 0.44, low threshold error was 0.64 and Spike-in detection limit was 0.94. After inputting the parameters into the Levenberg-Marquart equation, the parameters were optimized to the following values; Min = .44, Max = 4.81, W = .8418, X0 = 3.427.
- After determining the above parameters, the parameters were utilized in the curve fitting equation and the results relating to the dynamic and linear range of the Spike-in data are shown in Table 3 below.
TABLE 3 Linear Range Statistics of Log Plot Low Signal 0.80 High Signal 4.59 Low Relative Concentration 1.49 High Relative Concentration 5.28 Slope 1.00 R2 Value 0.98 Detection Limit Statistics Saturation Point 4.81 Low Threshold 0.44 Low Threshold Error 0.64 Spike-in detection limit 0.98 - The Spike-in signal detection limit statistic was calculated as follows; for all of the spike-ins with median log signal less than the low linear signal, calculate in bGSubSignal space the average and standard deviation of each spike-in sequence individually. For each one of these spike-ins, calculate (ave. + 1sd). In summary, determine the median value of the each Spike-in, take the log of that value, and determine the Spike-in detection limit.
- While the present invention has been described with reference to the specific embodiments thereof, it should be understood by those skilled in the art that various changes may be made and equivalents may be substituted without departing from the true spirit and scope of the invention. In addition, many modifications may be made to adapt a particular situation, material, composition of matter, process, process step or steps, to the objective, scope of the present claims. All such modifications are intended to be within the scope of the claims appended hereto.
- "The disclosures in
United States patent application no. 11/544851
Claims (15)
- A method for dynamic range analysis of positive control data for microarrays, the method comprising:providing positive control data from a microarray experiment (110);identifying a plurality of parameters from the positive control data (120);applying the plurality of parameters to a curve fitting equation (130);determining a linear range of the positive control data (144);applying the linear range of the positive control data to select positive control data to be used in the microarray experiment (150); andoutputting the linear range of the positive control data for use by a user.
- The method of claim 1, wherein the curve fitting equation is a sigmoidal curve fitting equation (130).
- The method of any of claim 2, wherein the sigmoidal curve fitting equation is

- The method of any of claims 1-3, wherein the plurality of parameters comprise min, max, x0, and w parameters (120).
- The method of any of claims 1-4, wherein identifying a plurality of parameters comprises optimizing the plurality of parameters with a Levenberg-Marquardt technique (140).
- The method of any preceding claim, wherein the positive control data is Spike-In data (110).
- The method of any claim 6, further comprising determining the low threshold signal of the spike-in data.
- The method of claim 6 or 7, further comprising determining a low threshold error value of the spike-in data.
- The method of any of claims 6-8, further comprising estimating a signal for background noise of the spike-in data.
- The method of any of claims 6 to 9, wherein the Spike-in data tests the labeling efficiency and reaction efficiency of the microarray experiment.
- The method of any preceding claim, further comprising estimating a signal for at least one probe which does not bind to a specific target of the microarray experiment.
- The method of any preceding claim, wherein the microarray experiment is a 1-color experiment.
- A computer readable medium carrying one or more sequences of instructions for identifying and selecting a plurality of parameters for analyzing Spike-in data of a microarray, wherein execution of one or more sequences of instructions by one or more processors causes the one or more processors to perform the steps of:estimating said plurality of parameters (120);adjusting said plurality of parameters in a sigmoidal function; (130)optimizing said plurality of parameters derived from said sigmoidal function using a Levenberg-Marquart equation (140);using a linear best fit equation to identify the linear range of the Spike-in data (144); andoutputting the linear range to a user.
- The computer readable medium of claim 13, further comprising the steps of;identifying at least one of the plurality of parameters as a minimum signal value for the Spike-in data; andcalculating a low threshold error value for the Spike-in data with the minimum signal value.
- A system for identifying and selecting a plurality of parameters for analyzing Spike-in data of a microarray, said system comprising:a processor (202);means for identifying a plurality of parameters from positive control data inputted to said processor (120);means for applying the plurality of parameters to a curve fitting equation (130);means for determining a linear range of the positive control data (144);means for applying the linear range of the positive control data to select positive control data to be used in a microarray experiment (150); anda user interface (210) configured to output the linear range of the positive control data for use by a user.
Applications Claiming Priority (1)
| Application Number | Priority Date | Filing Date | Title |
|---|---|---|---|
| US54485106A | 2006-10-05 | 2006-10-05 |
Publications (2)
| Publication Number | Publication Date |
|---|---|
| EP1918838A2 true EP1918838A2 (en) | 2008-05-07 |
| EP1918838A3 EP1918838A3 (en) | 2009-07-08 |
Family
ID=38988429
Family Applications (1)
| Application Number | Title | Priority Date | Filing Date |
|---|---|---|---|
| EP07253895A Withdrawn EP1918838A3 (en) | 2006-10-05 | 2007-10-02 | Estimation of dynamic range of microarray DNA spike-in data by use of parametric curve-fitting |
Country Status (1)
| Country | Link |
|---|---|
| EP (1) | EP1918838A3 (en) |
Cited By (1)
| Publication number | Priority date | Publication date | Assignee | Title |
|---|---|---|---|---|
| CN102474273A (en) * | 2009-08-12 | 2012-05-23 | 日本电气株式会社 | Data summary system, method for summarizing data, and recording medium |
Citations (6)
| Publication number | Priority date | Publication date | Assignee | Title |
|---|---|---|---|---|
| US5948902A (en) | 1997-11-20 | 1999-09-07 | South Alabama Medical Science Foundation | Antisense oligonucleotides to human serine/threonine protein phosphatase genes |
| US6171797B1 (en) | 1999-10-20 | 2001-01-09 | Agilent Technologies Inc. | Methods of making polymeric arrays |
| US6180351B1 (en) | 1999-07-22 | 2001-01-30 | Agilent Technologies Inc. | Chemical array fabrication with identifier |
| US6232072B1 (en) | 1999-10-15 | 2001-05-15 | Agilent Technologies, Inc. | Biopolymer array inspection |
| US6242266B1 (en) | 1999-04-30 | 2001-06-05 | Agilent Technologies Inc. | Preparation of biopolymer arrays |
| US6323043B1 (en) | 1999-04-30 | 2001-11-27 | Agilent Technologies, Inc. | Fabricating biopolymer arrays |
Family Cites Families (1)
| Publication number | Priority date | Publication date | Assignee | Title |
|---|---|---|---|---|
| US20070092869A1 (en) * | 2005-10-24 | 2007-04-26 | Fulmer-Smentek Stephanie B | Spike-in controls and methods for using the same |
-
2007
- 2007-10-02 EP EP07253895A patent/EP1918838A3/en not_active Withdrawn
Patent Citations (6)
| Publication number | Priority date | Publication date | Assignee | Title |
|---|---|---|---|---|
| US5948902A (en) | 1997-11-20 | 1999-09-07 | South Alabama Medical Science Foundation | Antisense oligonucleotides to human serine/threonine protein phosphatase genes |
| US6242266B1 (en) | 1999-04-30 | 2001-06-05 | Agilent Technologies Inc. | Preparation of biopolymer arrays |
| US6323043B1 (en) | 1999-04-30 | 2001-11-27 | Agilent Technologies, Inc. | Fabricating biopolymer arrays |
| US6180351B1 (en) | 1999-07-22 | 2001-01-30 | Agilent Technologies Inc. | Chemical array fabrication with identifier |
| US6232072B1 (en) | 1999-10-15 | 2001-05-15 | Agilent Technologies, Inc. | Biopolymer array inspection |
| US6171797B1 (en) | 1999-10-20 | 2001-01-09 | Agilent Technologies Inc. | Methods of making polymeric arrays |
Cited By (1)
| Publication number | Priority date | Publication date | Assignee | Title |
|---|---|---|---|---|
| CN102474273A (en) * | 2009-08-12 | 2012-05-23 | 日本电气株式会社 | Data summary system, method for summarizing data, and recording medium |
Also Published As
| Publication number | Publication date |
|---|---|
| EP1918838A3 (en) | 2009-07-08 |
Similar Documents
| Publication | Publication Date | Title |
|---|---|---|
| EP2850211B1 (en) | Method for increasing accuracy in quantitative detection of polynucleotides | |
| US8036835B2 (en) | Probe design methods and microarrays for comparative genomic hybridization and location analysis | |
| US11773429B2 (en) | Reduction of bias in genomic coverage measurements | |
| US9223929B2 (en) | Method and apparatus for detection, identification and quantification of single-and multi-analytes in affinity-based sensor arrays | |
| US20030124539A1 (en) | High throughput resequencing and variation detection using high density microarrays | |
| US20070259346A1 (en) | Analysis of arrays | |
| US12493965B2 (en) | Methods and systems for image processing | |
| US10844424B2 (en) | Reduction of bias in genomic coverage measurements | |
| JP2008533558A (en) | Normalization method for genotype analysis | |
| Chudin et al. | A model of technical variation of microarray signals | |
| US20170039317A1 (en) | Methods and systems for analysing hybridisation | |
| US20240301492A1 (en) | Methods of preparing assays, systems, and compositions for determining fetal fraction | |
| EP1918838A2 (en) | Estimation of dynamic range of microarray DNA spike-in data by use of parametric curve-fitting | |
| JP6055200B2 (en) | Method for identifying abnormal microarray features and readable medium thereof | |
| US20070099227A1 (en) | Significance analysis using data smoothing with shaped response functions | |
| JP2006506605A (en) | Method and system for measuring absolute amount of mRNA | |
| JP4535266B2 (en) | Nucleic acid quantitative detection method by DNA computer technology | |
| US20060073486A1 (en) | Multiple array substrates and methods for using the same | |
| US20060080043A1 (en) | Comparative genomic hybridization significance analysis using data smoothing with shaped response functions | |
| US20060040287A1 (en) | Method and system for quantifying random errors and any spatial-intensity trends present in microarray data sets | |
| US20060004527A1 (en) | Methods, systems and computer readable media for identifying dye-normalization probes | |
| WO2008073607A2 (en) | A method for estimating error from a small number of expression samples | |
| US20070111219A1 (en) | Label integrity verification of chemical array data | |
| US20070092903A1 (en) | One-color microarray analysis methods, reagents and kits | |
| US20050095598A1 (en) | Nucleic acid arrays comprising depurination probe features and methods for using the same |
Legal Events
| Date | Code | Title | Description |
|---|---|---|---|
| PUAI | Public reference made under article 153(3) epc to a published international application that has entered the european phase |
Free format text: ORIGINAL CODE: 0009012 |
|
| AK | Designated contracting states |
Kind code of ref document: A2 Designated state(s): AT BE BG CH CY CZ DE DK EE ES FI FR GB GR HU IE IS IT LI LT LU LV MC MT NL PL PT RO SE SI SK TR |
|
| AX | Request for extension of the european patent |
Extension state: AL BA HR MK RS |
|
| PUAL | Search report despatched |
Free format text: ORIGINAL CODE: 0009013 |
|
| AK | Designated contracting states |
Kind code of ref document: A3 Designated state(s): AT BE BG CH CY CZ DE DK EE ES FI FR GB GR HU IE IS IT LI LT LU LV MC MT NL PL PT RO SE SI SK TR |
|
| AX | Request for extension of the european patent |
Extension state: AL BA HR MK RS |
|
| RAP1 | Party data changed (applicant data changed or rights of an application transferred) |
Owner name: AGILENT TECHNOLOGIES, INC. |
|
| AKX | Designation fees paid | ||
| REG | Reference to a national code |
Ref country code: DE Ref legal event code: 8566 |
|
| STAA | Information on the status of an ep patent application or granted ep patent |
Free format text: STATUS: THE APPLICATION IS DEEMED TO BE WITHDRAWN |
|
| 18D | Application deemed to be withdrawn |
Effective date: 20100109 |