EP1877877B1 - Diagnostic device for a process control system - Google Patents
Diagnostic device for a process control system Download PDFInfo
- Publication number
- EP1877877B1 EP1877877B1 EP05706510A EP05706510A EP1877877B1 EP 1877877 B1 EP1877877 B1 EP 1877877B1 EP 05706510 A EP05706510 A EP 05706510A EP 05706510 A EP05706510 A EP 05706510A EP 1877877 B1 EP1877877 B1 EP 1877877B1
- Authority
- EP
- European Patent Office
- Prior art keywords
- training
- distribution
- statistics data
- process variable
- measurement
- Prior art date
- Legal status (The legal status is an assumption and is not a legal conclusion. Google has not performed a legal analysis and makes no representation as to the accuracy of the status listed.)
- Active
Links
Images


Classifications
-
- G—PHYSICS
- G05—CONTROLLING; REGULATING
- G05B—CONTROL OR REGULATING SYSTEMS IN GENERAL; FUNCTIONAL ELEMENTS OF SUCH SYSTEMS; MONITORING OR TESTING ARRANGEMENTS FOR SUCH SYSTEMS OR ELEMENTS
- G05B23/00—Testing or monitoring of control systems or parts thereof
- G05B23/02—Electric testing or monitoring
- G05B23/0205—Electric testing or monitoring by means of a monitoring system capable of detecting and responding to faults
- G05B23/0218—Electric testing or monitoring by means of a monitoring system capable of detecting and responding to faults characterised by the fault detection method dealing with either existing or incipient faults
- G05B23/0221—Preprocessing measurements, e.g. data collection rate adjustment; Standardization of measurements; Time series or signal analysis, e.g. frequency analysis or wavelets; Trustworthiness of measurements; Indexes therefor; Measurements using easily measured parameters to estimate parameters difficult to measure; Virtual sensor creation; De-noising; Sensor fusion; Unconventional preprocessing inherently present in specific fault detection methods like PCA-based methods
-
- G—PHYSICS
- G05—CONTROLLING; REGULATING
- G05B—CONTROL OR REGULATING SYSTEMS IN GENERAL; FUNCTIONAL ELEMENTS OF SUCH SYSTEMS; MONITORING OR TESTING ARRANGEMENTS FOR SUCH SYSTEMS OR ELEMENTS
- G05B23/00—Testing or monitoring of control systems or parts thereof
- G05B23/02—Electric testing or monitoring
- G05B23/0205—Electric testing or monitoring by means of a monitoring system capable of detecting and responding to faults
- G05B23/0218—Electric testing or monitoring by means of a monitoring system capable of detecting and responding to faults characterised by the fault detection method dealing with either existing or incipient faults
- G05B23/0224—Process history based detection method, e.g. whereby history implies the availability of large amounts of data
- G05B23/024—Quantitative history assessment, e.g. mathematical relationships between available data; Functions therefor; Principal component analysis [PCA]; Partial least square [PLS]; Statistical classifiers, e.g. Bayesian networks, linear regression or correlation analysis; Neural networks
Definitions
- the invention relates to the field of diagnostics of process devices, such as they are used in industrial or scientific processes, and in particular to the field of process device diagnostics using a sensed process variable of the process. It relates to methods and apparatuses according to the opening clause of the claims.
- Such a diagnostic device and diagnostic method is known from the patent publication US 6 601 005 .
- the device senses process variable values like, e.g., pressure or flow values, and processes them so as to extract from them vibration noise signals carried in a process medium (e.g., liquid, gas) of the process.
- a process medium e.g., liquid, gas
- Such a vibration-related processed signal is then evaluated, with the evaluation ending in an output indicating that some control device (e.g., a pump or valve) of the process has a failure.
- some control device e.g., a pump or valve
- the evaluation of the processed signal it is suggested to compare the processed signal or signals to a choosable limit value or a set of limit values. For example, if a wavelet transform has been used for obtaining the processed signal, it will be checked for each calculated wavelet coefficient, if it has exceeded a corresponding limit value. If at least one wavelet coefficient has exceeded its corresponding limit value, a failure (of some control device or devices, to which the wavelet coefficient relates) will be indicated.
- These base "plane" normal operation data sets are employed as modeled data sets, from which, e.g., a neural network can choose the appropriate one, which then is substracted from data gathered during operation so as to let only abnormal signals remain.
- the models and the data gathered during operation are both wavelet transformed data, so that corresponding wavelet coefficients are subtracted from each other in order to remove the known process variations and yield values to be compared to prescribable limit values.
- the choice of the limit values to which a processed signal is compared is very important for the reliability of the output of the diagnostic device ("failure” / "no failure"). It is desirable to provide for reliable grounds for the diagnostic output of the diagnostic device.
- a goal of the invention is to create a diagnostic device and a diagnostic method that provide for reliable grounds for a diagnostic output of the diagnostic device. It is furthermore a goal of the invention to create further devices and systems that incorporate this diagnostic device or diagnostic method.
- the diagnostic device comprises
- the diagnostic device can be any device or combination of devices, which is capable of receiving process variable values and processing them in a depicted way. It can be a transmitter, a process monitoring device or process monitoring system, a controller or process control system, a personal computer or the like. The diagnostic device is preferably suitable for use in a process control system. It can be implemented in a control system. The diagnostic device can be integrated in a transmitter, in a process monitoring device, in a controller or the like. The diagnostic device can, e.g., be realized in a flowmeter, a pressure transmitter or differential pressure transmitter.
- the diagnostic device comprises a sensing means for measurement of the process variable and for generating the process variable values.
- the generated process variable values can then be output to the receiving means. Due to the sensing means the diagnostic device can simultaneously have the function of a transmitter and/or process monitor.
- the diagnostic device can be used as a stand-alone process device.
- the receiving means receives process variable values and can, e.g., be an interface or port, realized in hardware and/or software.
- Possible process variables include flow, pressure, differential pressure, level, temperature or the like.
- Process variable values are values of a process variable or values of a measure related to the process variable, e.g., there can be a some functional (e.g., linear) relation between the process variable values and the respective values of the process variable in a given unit.
- the process medium typically is a fluid.
- it can be a gas or a liquid or a mixture of those or a mixture of those plus solid components, e.g., an emulsion.
- the measurement processing means is a means (realized in hardware and/or software) for processing process variable values measured (captured) during a measuring phase, in such a way that measurement statistics data are generated from the process variable values.
- the processing can include various types of calculations, e.g., arithmetics and transforms like Fourier or wavelet transform.
- the measurement statistics data are recorded (stored) for further output or processing.
- a span of time and/or a mode of the diagnostic device is denoted, in which the diagnostic device does its "normal” function, i.e., diagnose. This is the normal operating status of the diagnostic device, in which the diagnostic device is usually used.
- the diagnostic device can diagnose the process and, in particular, detect a failure in the process, e.g., a failure of a process device or even a failure of a transmitter or other process device in which the diagnostic device is integrated.
- a span of time and/or a mode of the diagnostic device is denoted, in which the diagnostic device receives process variable values, which are expected to be representative of a normal (typically failure-free) operation of the process. This is to receive statistical information about the process, which later on can be compared to statistical information about the process captured during a measuring phase.
- Measurement statistics data are statistical information derived from process variable values that are captured or measured during a measuring phase.
- the measurement statistics data can be an item or a group of items selected from a group comprising mean value (e.g., arithmetic mean), root mean square, standard deviation, variance, statistical distribution. It can also be a value or set of values derived from one or more members of that group.
- the statistical distribution can be an empirical distribution, or it can be an analytical (theoretical) distribution, typically a fitted distribution.
- a fitted distribution or fitted curve preferably means a best fit with respect to some criterion, e.g., a least square fit.
- Training statistics data are statistical information derived from process variable values that are captured or measured during a training phase.
- the training statistics data can be an item or a group of items selected from a group comprising mean value (e.g., arithmetic mean), root mean square, standard deviation, variance, statistical distribution. It can also be a value or set of values (e.g., limit values) derived from one or more members of that group.
- the statistical distribution can be an empirical distribution or a fitted (theoretical) distribution.
- the training processing means is a means (realized in hardware and/or software) for processing process variable values measured (captured) during a training phase, in such a way that training statistics data are generated from the process variable values.
- the processing can include various types of calculations, e.g., arithmetics or transforms like Fourier or wavelet transform.
- the training statistics data are recorded (stored) for further output or processing.
- the comparison means (realized in hardware and/or software) compares measurement statistics data with training statistics data. From an output of the comparison means it can be deduced that some failure is likely to have occurred in the process. Due to the comparison of statistics data, a sound and reliable basis for a diagnostic output, since a considerable number of process variable values has been evaluated for generating the statistics data. Furthermore, due to the comparison of statistics data, it is possible to estimate or to prescribe the likelihood of the correctness of a diagnostic output.
- an output failure (or no-failure) indication can be provided with an indication of a confidence level associated with the failure (or no-failure) indication, or an output failure (or no-failure) indication is given only if the indication has at least a prescribable confidence level (indication of degree of certainty). According, a diagnostic output output from a diagnostic device has a considerable added value if based on the comparison of the measurement statistics data with the training statistics data as realized in the comparison means.
- the comparison means has a condition output related to a condition of the process, wherein the condition of the process is different from a measure for the process variable.
- a diagnostic output of the diagnostic device is preferably not a magnitude that would indicate values of the process variable. If, e.g., the process variable is the flow velocity of the process medium, the condition of the process can, e.g., be a condition of a pump, for example indicated by its pumping speed, or a condition of another process device, in particular process control device.
- the condition output can be related to the condition of the sensing means. Accordingly, in that case the condition output is related to the condition of the diagnostic device, so that the diagnostic device provides for a self-diagnostic feature.
- the measurement statistics data and the training statistics data relate to noise carried in the process medium.
- noise can, e.g., be vibration noise.
- the noise can stem from a process device.
- the training processing means calculates a training empirical statistical distribution.
- the training empirical statistical distribution is a distribution related to process variable values measured during a training phase. In one embodiment, it can be a distribution of process variable values or, more general, of a function of process variable values, e.g. the square of the process variable values or the sum of the squares of the process variable values. In another embodiment, it can be a distribution of values derived from a transform of process variable values.
- the measurement processing means calculates a transform of process variable values, which are measured during a measuring phase, into coefficients X m (k) of a set of orthogonal functions
- the training processing means calculates a transform (of the same type) of process variable values, which are measured during a training phase, into coefficients X t (k) of the same set of orthogonal functions
- the training empirical statistical distribution is a distribution of a function of the coefficients X t (k).
- the training empirical statistical distribution can, e.g., be a distribution of the coefficients X t (k) or of the coefficients X t (k) squared; other, preferably arithmetic functions are also possible.
- the orthogonal functions are orthonormal functions.
- the transform can preferably be one of the group of Fourier transform and wavelet transform.
- the training processing means calculates a training analytical distribution function approximating the training empirical statistical distribution. I.e., a prescribable function with one, two or more parameters is fitted to the training empirical statistical distribution. In this way, a maximum of information of high precision is gathered from the measured data, and the influence of statistical deviations during the training phase are reduced.
- the Gamma distribution function provides for a particularly accurate fit to typical training empirical statistical distributions, at least as far as training empirical statistical distributions of values ferived from Fourier coefficients are concerned.
- the measurement statistics data comprise a mean value Mp of a function of process variable values, which are measured during a measuring phase: E.g., the mean value M p can be taken of the process variable values themselves or of the square of the process variable values.
- the training processing means calculates, as training statistics data or as part thereof, a lower limit value L t,p and an upper limit value U t,p from the training analytical distribution function.
- the comparison means outputs a failure indication in case that the mean value Mp is smaller than the lower limit value L t,p or greater than the upper limit value U t,p .
- This embodiment has the advantage that the lower limit value L t,p and the upper limit value U t,p can be chosen such that a prescribable (minimum) confidence level of the diagnostic output is achieved, since these limit values are derived from a statistical distribution. Moreover, the precision, with which the limit values, that correspond to a desired (minimum) confidence level, can be determined, is very high, because the limit values are derived from the (fitted) training analytical distribution function. Another advantage of this embodiment is that the processing effort needed for deriving the diagnostic output is relatively low with respect to the quality, in particular the reliability and soundness, of the diagnostic output.
- the measurement statistics data comprise a mean value M c of a function of the coefficients X m (k)
- the training processing means calculates, as training statistics data or as part thereof, a lower limit value L t,c and an upper limit value U t,c from the training analytical distribution function, and, preferably, the comparison means outputs a failure indication in case that the mean value M c is smaller than the lower limit value L t,c or greater than the upper limit value U t,c .
- the mean value M c can, e.g., refer to the coefficients X m (k) directly or to the coefficients X m (k) squared or another; preferably arithmetic function of the coefficients X m (k).
- the measurement statistics data comprise a measurement empirical statistical distribution, which is a distribution of a function of of such process variable values, which are measured during a measuring phase
- the training statistics data comprise the training analytical distribution function.
- the comparison means compares the measurement empirical statistical distribution with the training analytical distribution function.
- the comparison means can output a failure indication dependending on the result of a comparison of the measurement empirical statistical distribution with the training analytical distribution function.
- the comparison means outputs a failure indication in case that the confidence level derived from of a statistical test of the consistency of the measurement empirical statistical distribution with the training analytical distribution function is below a prescribable threshold value.
- a distribution of currently measured values is calculated and compared, preferably in a statistical test, to an analytical distribution that has been fit to a distribution measured during the training phase.
- a desired confidence level of the diagnostic output can be chosen through the threshold value.
- the measurement statistics data comprise a measurement empirical statistical distribution, which is a distribution of a function of the coefficients X m (k) (e.g. a distribution of the coefficients X m (k) themselves or of the square of the coefficients X m (k) or ...)
- the training statistics data comprise the training analytical distribution function.
- the comparison means can output a failure indication depending on the result of a comparison of the measurement empirical statistical distribution with the training analytical distribution function.
- the comparison means outputs a failure indication in case that the confidence level derived from of a statistical test of the consistency of the measurement empirical statistical distribution with the training analytical distribution function is below a prescribable threshold value.
- a distribution of coefficients derived from currently measured values is calculated and compared, preferably in a statistical test, to an analytical distribution that has been fit to a distribution derived during the training phase.
- a desired confidence level of the diagnostic output can be chosen through the threshold value.
- Another embodiment comprises not only diagnostic devices of the above-mentioned kind, but as well transmitters, process control devices, process monitoring devices, and process control systems that comprise such a diagnostic device:
- the invention also comprises diagnostic methods as claimed in claims 21 and 24, in particular comprises the steps of:
- the diagnostic method preferably is a method performed in a process control environment.
- diagnostic methods according to the invention can be derived from the diagnostic devices according to the invention.
- the advantages of the methods correspond to the advantages of the diagnostic devices.
- Another embodiment comprises furthermore transmitters, process control devices, process monitoring devices, and process control systems, which implement a diagnostic device according to the invention.
- Fig. 1 schematically illustrates a typical process control environment 1 with a diagnostic device 10.
- the diagnostic device 10 is comprised in a differential pressure transmitter 20, which has two impulse lines 21, through which it is coupled to a process medium 2 of the process control environment 1.
- the differential pressure transmitter 20 can also be understood as a process monitoring device 20, which monitors a differential pressure in the process medium 2.
- the process medium 2 can be, e.g., a liquid like water or oil, which is contained in a tube 3.
- Process control devices like a pump 50 (including a pump control 51) and a valve 60 (including a valve control 61) are provided in the process control environment 1.
- the process control devices 10,20,50,60 are connected to a typically computer-based process control system 5.
- the process control system 5 can also be understood as a process control device 5, which (through the connection with the diagnostic device 10) incorporates (comprises) the diagnostic device 10.
- noise is generated in the process medium 2.
- Such noise can be sensed by means of the diagnostic device 10 in the differential pressure sensor 20.
- a change in the process conditions e.g., a malfunction or failure of a process device 20,50,60, may be reflected in the sensed differential pressure signal.
- Fig. 2 schematically shows the differential pressure transmitter, which is an example of a diagnostic device 10 with a sensing means 25.
- the sensing means 25 comprises the two impluse lines 21, which are filled with process medium 2, and a sensing system (sensing element) 26.
- One process membrane 22 and one pressure transmission arm 23 are provided for each impulse line 21.
- the pressure transmission arms 23 (oil circuits 23) are filled with oil 24 as a sensing medium 24.
- the process membranes 22 are an interface between the impulse lines 21 (containing process medium 2) and the oil circuits 23 (containing sensing medium 24). Through the pressure transmission arm 23 the pressures from the process (in the impulse lines 21) is transferred to the sensing system 26.
- the sensing system 26 may be based on one or more of the following principles, which allow to derive an electrically measureable signal from the differential pressure:
- the signal derived that way is then digitized in a analogue-to-digital converter 27.
- a microprocessor 15 of the diagnostic device 10 can then derive diagnostic information from the digitized differential pressure signal.
- the diagnostic device 10 can diagnose the condition and failures of various process devices, like 50 and 60. On the other hand (additionally or alternatively), the diagnostic device 10 can also diagnose the condition and failures of the sensing means 25. In particular, the following failures may occur and can be detected by the diagnostic device 10:
- diagnostic information on the condition of the sensing means 25 (and the diagnostic device 10 or transmitter 20) itself. In particular, if the diagnostic information can distinguish between (some of) the above-mentioned failure modes.
- a diagnostic device which uses at least two impulse lines (e.g., for a device using a pressure or differential pressure signal derived from these at least two impulse lines), to measures the pressure at two points, which are arranged close to each other. I.e., it is advantageous, when the locations at which the at least two impulse lines are coupled to the rest of the process medium, are in close proximity.
- the advantage is, that measured absolute values are small, fluctuations in the process fluid are mostly cancelled.
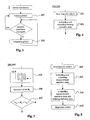
- a preferred basic algorithm for the functioning of a diagnostic device 10 according to the invention is sketched in the block diagram in Fig. 3 .
- the diagnostic device installed, i.e., mainly the diagnostic device is coupled to the process.
- a training phase 200 in which training statistics data are generated. If then the nominal conditions in the process are unchanged, a measuring phase 300 is entered. If, at any time, the nominal conditions in the process are changed, e.g., through installation of a new process device, another training phase 200 is to be absolved before entering measurement mode 300 again.
- Fig. 4 shows a block diagram including a training phase 200 of a diagnostic device.
- process variable values x(t) like differential pressure values, are received, e.g., referring to Fig. 2 , from the A/D-converter 27.
- training statistics data are extracted from the process variable values x(t) and recorded.
- the training processing means 200 (like other involved means) may be realized through the microprocessor 15.
- Fig. 5 shows a block diagram including a measuring phase 300 of a diagnostic device.
- a (or the) receiving means 100 process variable values x(t) are received, e.g., referring ro Fig. 2 , from the A/D-converter 27.
- a measurement processing means 300 measurement statistics data are extracted from the process variable values x(t) and recorded.
- the measurement processing means 300 may be realized through the microprocessor 15.
- the measurement statistics data are compared to the training statistics data. The comparison results in a diagnostic output 500, e.g., indicating a (general) failure of the process or a specific failure.
- steps performed in an exemplary training processing means 200 are schematically depicted.
- process variable values x(t) are recorded(step 210).
- a training empirical statistical distribution is calculated.
- a training analytical distribution function is fitted to the training empirical statistical distribution. This optional fitting of a training analytical distribution function allows to receive very precise data in a minimized time ⁇ t.
- limit values L t,p , U t,p may be derived with high precision.
- the choice of a prescribable level K allows to choose these limit values L t , p , U t,p such that both, the probability of the existence of a value below L t,p and the probability of the existence of a value above U t,p , each have a defined value.
- the limit values L t,p , U t,p shall be chosen such that the probability of the existence of a value below L t,p is equal to the probability of the existence of a value above U t,p , usually one prescribable level K will be chosen for finding the lower limit value L t,p , and another (different) prescribable level K will be chosen for finding the upper limit value U t,p (not shown in Fig. 6 ).
- Such limit values L t,p , U t,p can also be derived from the training empirical statistical distribution itself (directly, without fitting). But the precision is less good and/or the time ⁇ t required to record the process variable values x(t) must be chosen longer.
- step 290 or even also step 270 can be omitted.
- Fig. 7 shows steps that can be performed in a measuring processing means 300 and a comparison means 400.
- process variable values x(t) are recorded during a time window ⁇ t (step 310).
- the duration ⁇ t in the training phase (compare Fig. 6 , step 210) is typically of the order of 10 times to 50 times longer than the duration ⁇ t during a measuring phase.
- the mean value M P of the recorded process variable values is calculated.
- step 420 measuring statistics data are compared to training statistic data:
- the mean value M P is compared to the two limit values L t,p , U t,p derived from the training phase ( Fig. 6 , step 290). If Mp lies within the range given by L t,p , U t,p , the condition of the process is expected to be in good order. Otherwise, the diagnostic output will be set to "failure".
- a moving average in step 390. This means that after the calculation of one mean value Mp, the next mean value Mp is calculated from process variable values measured in a time interval ⁇ t, which overlaps with the time interval ⁇ t, in which the process variable values were measured that lead to the former mean value Mp. Typically, a large overlap is chosen, in particular such that only the first x(t) value is discarded and a newly measured x(t) value is added, when a next mean value M P is calculated.
- Working with a moving average has the advantage that more data and more diagnostic outputs are generated per time, and the data are smoothed, i.e., the effect that singular spikes have is reduced.
- there is no overlap between the time intervals ⁇ t in which the process variable values are measured that lead to consecutive mean values Mp.
- a distribution of process variable values x(t) as measurement statistics data is compared to a training statistical distribution function derived in the training ( Fig. 6 , step 270) as training statistics data.
- a training statistical distribution function derived in the training Fig. 6 , step 270
- training statistics data a training statistical distribution function derived in the training ( Fig. 6 , step 270) as training statistics data.
- process variable values x(t) are recorded during a time window ⁇ t (step 310). From the x(t) values a measurement statistical distribution is calculated (step 350).
- the comparison means the measurement empirical statistical distribution (as measurement statistical data) is compared to the training statistical distribution function (step 450). This comparison is done in a statistical test, e.g., in a Chi 2 test. As result of the statistical test a confidence level is derived, which indicates the probability of an agreement between the compared distributions. In case of the Chi 2 test, some function scaling inversely with Chi 2 , like, e.g., 1/Chi 2 , is a possible value indicative of the confidence level. In step 480 the derived confidence level (indicated as 1/Chi 2 ) is compared to a prescribable threshold value K'. If the confidence level is below the threshold value K' , the diagnostic output will be set to "failure". Otherwise the condition of the process is expected to be in good order.
- Fig. 8 it is also possible to use the training empirical statistical distribution derived in step 250 ( Fig. 6 ) as training statistical data. In that case, the measurement empirical statistical distribution and the training empirical statistical distribution would be subject to a statistical test in step 450.
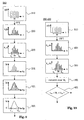
- the Figs. 9-12 involve a transform of process variable values or a function of those.
- a Fourier transform in particular, an FFT (fast Fourier transform), has been chosen in the Figures, but other transforms, like wavelet transforms are possible as well.
- Fig. 9 shows a block diagram of steps that can be performed in a training processing means involving an FFT.
- process variable values x(t) are taken during a time interval ⁇ t.
- an FFT is calculated from the x(t) values, yielding a spectrum of coefficients X t (k) (the index t shall indicate that these coefficients are derived from values taken during a training phase).
- Step 230 is optional, but very advantageous.
- an interval of the transformed variable an interval ⁇ k of frequencies k in case of a Fourier transform
- This selection allows to confine further analysis to only those frequencies k, which are of particular interest.
- An advantageous possible way to automatically find a suitable interval ⁇ k is, after leaving out very low frequencies, to calculate a prescribable fraction (e.g., 10%) of the largest coefficient X t (k) and find the lowest frequency k L and the largest frequency k U , which have a coefficient (X t (k L ); X t (-k U )) at least as large as that fraction.
- the desired interval ⁇ k ranges then from k L to k U .
- a training empirical statistical distribution is calculated from the spectrum X t (k).
- One possibility is to sum up all X t (k) values or their absolute values, possibly only within the interval ⁇ k of interest, to derive a signal power Sp, of which the training empirical statistical distribution is calculated. Accordingly, one spectrum X t (k) results in one Sp value. It is also possible to do further or other calculations with the coefficients X t (k) of interest in order to derive a signal power value Sp.
- x(t) is a process variable value taken at time t
- k is a frequency
- X(k) denotes a coefficient of the spectum
- Sp is a signal power value.
- e denotes the base of the natural logarithm
- j denotes the square root of -1
- N is the number of measured process variable values within the interval ⁇ t.
- P(k) is an intermediate value for calculating the signal power.
- Sp(k 1 ,k 2 ) is the signal power value derived from a frequency range from k 1 to k 2 .
- k 1 and k 2 correspond to the lower and upper limit frequencies k L and k U discussed above.
- Equation (1) is the formula for a discrete Fourier transform.
- a number ( ⁇ 2) of intervals ⁇ k can be chosen which each comprise frequencies of interest, so that the signal power Sp is derived from those frequencies that are in located in one of those intervals.
- a training analytical distribution function is fitted to the so-derived training empirical statistical distribution of step 251. This is in analogy to step 270 ( Fig. 6 ).
- lower and upper limit values L t,c , U t,c may be derived with high precision from the training analytical distribution function, in analogy to step 290 ( Fig. 6 ).
- the limit values L t,c , U t,c may be derived directly from the training empirical statistical distribution (220 or 230), without fitting.
- training staticstics data can, accordingly, serve one or more of the group of training empirical statistical distribution, training analytical distribution function and limit values L t,c , U t,c .
- the mean value of the training empirical statistical distribution or of the training analytical distribution function and/or the variance (or standard deviation) of those may also contribute to the training staticstics data, which are, in a measurement phase, compared to measurement staticstics data.
- Fig. 10 shows steps that can be performed in a measuring processing means 300 and a comparison means 400.
- process variable values x(t) are recorded during a time window ⁇ t (step 310).
- This time window ⁇ t is as large as the time window used during the training phase ( Fig. 9 , step 210).
- step 320 a Fourier transform is calculated from the x(t) values, yielding a spectrum of coefficients X m (k) (the index m shall indicate that these coefficients are derived from values taken during a measuing phase).
- step 330 the spectum X m (k) is reduced to the interval ⁇ k (or intervals), known from the training ( Fig. 9 , step 230), if done so in the training phase.
- step 391 signal power values are calculated in the way they were calculated during the training ( Fig. 9 , step 251), and from the Sp values, a mean value M c is calculated (approximately analogue to step 390 in Fig. 7 ).
- the mean value M c can the, in step 421, be compared to the limit values derived during the training ( Fig. 9 , step 291). If M c lies within the range given by L t,c , U t,c , the condition of the process is expected to be in good order. Otherwise, the diagnostic output will be set to "failure".
- More advanced comparison means 400 can receive from the measurement processing means 300 a measurement empirical statistical distribution (from step 320 or better from step 330) and compare this to the training analytical distribution function (derived in step 271, Fig. 9 ) or to the training empirical statistical distribution itself (derived in step 220 or better 230 in Fig. 9 ) (in analogy to Fig. 8 , step 450).
- this comparison is a statistical test, like the Chi 2 test. According to the result of the comparison, a failure will be diagnosed or not (in analogy to Fig. 8 , step 480).
- an analytical distribution function to a distribution derived from data derived during a measurement phase and compare this analytical function with a training analytical distribution function (or even the training empirical statistical distribution). This holds for training and measuring phases involving a transform as well as for such not involving a transform.
- comparison means 400 preferably firstly, a mean value is compared to each limit value found during the training and (then) a measurement-derived distribution is compared to a training-derived distribution (or distribution function). If any of these comparisons indicate a failure condition in the process, the diagnostic output is set to "failure".
- This comparison means can be employed in case of distributions (or distribution functions) derived with or without a transform.
- Fig. 1 1 shows a block diagram of steps that can be performed in an advanced measuring processing means, including a (Fourier) transform.
- steps 310 and 320 (compare Fig. 10 )
- a plurality (here: three) of frequency bands ⁇ k 1 , ⁇ k 2 , ⁇ k 3 is chosen in step 330, which bands are then analyzed separately.
- a corresponding training phase must have made the same frequency band separation.
- a measurement empirical statistical distribution of spectral power values from one or more of the frequency bands, as is shown in Fig. 11 , step 351 for all three bands.
- Each of these measurement empirical statistical distributions can, e.g., be compared to a corresponding training-derived distribution (or fitted distribution function).
- a "failure" output can be made, if any of the comparisons of the bands is negative, or if a prescribable number of them is negative.
- the division into singly analyzed bands can even be extended to such depth that the full spectrum (each transform-derived coefficient) is separately analyzed, or that certain single frequencies are separately analyzed.
- Fig. 12 is an illustration of data taking for creating moving "average” values during a measuring phase, including a Fourier transform. Similar to the comments given above in conjunction with Fig. 7 (and 8 ), it is advantageous to use moving values (the term “average” does not always apply here correctly) also in conjunction with transformed data.
- Fig. 12 from data taken within a time interval ⁇ t one set of process variable values and, accordingly, one spectrum X m (k) is derived, which results in one signal power value Sp (or in a number of separately analyzed Sp values) From a number n (typically 50 to 200) of such spectra or signal power values Sp, one measurement empirical statistical distribution is derived.
- An advantage of the comparison of measurement statistics data with training statistics data is, that a prescribable level of confidence for the diagnostic output can be chosen and/or a level (K, K', 1 /Chi 2 , ...) relating to the confidence level can be part of the diagnostic output and thus indicate a to a user how trustful the failure or no failure indication is.
Abstract
Description
- The invention relates to the field of diagnostics of process devices, such as they are used in industrial or scientific processes, and in particular to the field of process device diagnostics using a sensed process variable of the process. It relates to methods and apparatuses according to the opening clause of the claims.
- Such a diagnostic device and diagnostic method is known from the patent publication
US 6 601 005 . The device senses process variable values like, e.g., pressure or flow values, and processes them so as to extract from them vibration noise signals carried in a process medium (e.g., liquid, gas) of the process. Such a vibration-related processed signal is then evaluated, with the evaluation ending in an output indicating that some control device (e.g., a pump or valve) of the process has a failure. In the method disclosed in the afore-mentionedUS 6 601 005 it is suggested to use wavelet or Fourier transform or a neural network or statistical analysis, or other signal evaluation techniques for obtaining the processed signal. As far as the evaluation of the processed signal is concerned, it is suggested to compare the processed signal or signals to a choosable limit value or a set of limit values. For example, if a wavelet transform has been used for obtaining the processed signal, it will be checked for each calculated wavelet coefficient, if it has exceeded a corresponding limit value. If at least one wavelet coefficient has exceeded its corresponding limit value, a failure (of some control device or devices, to which the wavelet coefficient relates) will be indicated. - Furthermore, it is disclosed in the afore-mentioned
US 6 601 005 to remove known process variations, which can be due to certain process activities, from the process variable values. This is done by subtracting modeled data from data (process variable values) gathered during operation. It is expected that after the subtraction only abnormalities remain and are evaluated. If, e.g., the known process variations are due to environmental temperature changes, which occur during the day and which influence the process variable values, a number of data sets can be taken at different times during the day when the process works failure-free. These base "plane" normal operation data sets are employed as modeled data sets, from which, e.g., a neural network can choose the appropriate one, which then is substracted from data gathered during operation so as to let only abnormal signals remain. The models and the data gathered during operation are both wavelet transformed data, so that corresponding wavelet coefficients are subtracted from each other in order to remove the known process variations and yield values to be compared to prescribable limit values.
The choice of the limit values to which a processed signal is compared, is very important for the reliability of the output of the diagnostic device ("failure" / "no failure"). It is desirable to provide for reliable grounds for the diagnostic output of the diagnostic device. - Therefore, a goal of the invention is to create a diagnostic device and a diagnostic method that provide for reliable grounds for a diagnostic output of the diagnostic device. It is furthermore a goal of the invention to create further devices and systems that incorporate this diagnostic device or diagnostic method.
- The problem is solved by apparatusses and the methods with the characteristics of the independant claims.
- According to the invention, the diagnostic device comprises
- a receiving means for receiving process variable values of a process variable of a process medium of a process,
- a measurement processing means for extracting and recording measurement statistics data from such process variable values, which are measured during a measuring phase,
- a training processing means for extracting and recording training statistics data from such process variable values, which are measured during a training phase, and
- a comparison means for comparing the measurement statistics data with training statistics data recorded before the measurement statistics data.
- Through this, it is possible to provide for reliable grounds for the diagnostic output of the diagnostic device. In particular, it is possible to provide for a prescribable reliability of the diagnostic output of the dignostic device and/or it is possible to provide for a confidence level of the output (indication of certainty of the output "failure" / "no failure").
- The diagnostic device can be any device or combination of devices, which is capable of receiving process variable values and processing them in a depicted way. It can be a transmitter, a process monitoring device or process monitoring system, a controller or process control system, a personal computer or the like. The diagnostic device is preferably suitable for use in a process control system. It can be implemented in a control system.
The diagnostic device can be integrated in a transmitter, in a process monitoring device, in a controller or the like. The diagnostic device can, e.g., be realized in a flowmeter, a pressure transmitter or differential pressure transmitter. - In a preferred embodiment the diagnostic device comprises a sensing means for measurement of the process variable and for generating the process variable values. The generated process variable values can then be output to the receiving means. Due to the sensing means the diagnostic device can simultaneously have the function of a transmitter and/or process monitor. The diagnostic device can be used as a stand-alone process device.
- The receiving means receives process variable values and can, e.g., be an interface or port, realized in hardware and/or software. Possible process variables include flow, pressure, differential pressure, level, temperature or the like. Process variable values are values of a process variable or values of a measure related to the process variable, e.g., there can be a some functional (e.g., linear) relation between the process variable values and the respective values of the process variable in a given unit.
- The process medium typically is a fluid. In particular, it can be a gas or a liquid or a mixture of those or a mixture of those plus solid components, e.g., an emulsion.
- The measurement processing means is a means (realized in hardware and/or software) for processing process variable values measured (captured) during a measuring phase, in such a way that measurement statistics data are generated from the process variable values. The processing can include various types of calculations, e.g., arithmetics and transforms like Fourier or wavelet transform. The measurement statistics data are recorded (stored) for further output or processing.
- With "measuring phase" a span of time and/or a mode of the diagnostic device is denoted, in which the diagnostic device does its "normal" function, i.e., diagnose. This is the normal operating status of the diagnostic device, in which the diagnostic device is usually used. During the measuring phase, the diagnostic device can diagnose the process and, in particular, detect a failure in the process, e.g., a failure of a process device or even a failure of a transmitter or other process device in which the diagnostic device is integrated.
- With "training phase" a span of time and/or a mode of the diagnostic device is denoted, in which the diagnostic device receives process variable values, which are expected to be representative of a normal (typically failure-free) operation of the process. This is to receive statistical information about the process, which later on can be compared to statistical information about the process captured during a measuring phase.
- Measurement statistics data are statistical information derived from process variable values that are captured or measured during a measuring phase. The measurement statistics data can be an item or a group of items selected from a group comprising mean value (e.g., arithmetic mean), root mean square, standard deviation, variance, statistical distribution. It can also be a value or set of values derived from one or more members of that group. The statistical distribution can be an empirical distribution, or it can be an analytical (theoretical) distribution, typically a fitted distribution. A fitted distribution or fitted curve preferably means a best fit with respect to some criterion, e.g., a least square fit.
- Training statistics data are statistical information derived from process variable values that are captured or measured during a training phase. The training statistics data can be an item or a group of items selected from a group comprising mean value (e.g., arithmetic mean), root mean square, standard deviation, variance, statistical distribution. It can also be a value or set of values (e.g., limit values) derived from one or more members of that group. The statistical distribution can be an empirical distribution or a fitted (theoretical) distribution.
- The training processing means is a means (realized in hardware and/or software) for processing process variable values measured (captured) during a training phase, in such a way that training statistics data are generated from the process variable values. The processing can include various types of calculations, e.g., arithmetics or transforms like Fourier or wavelet transform. The training statistics data are recorded (stored) for further output or processing.
- The comparison means (realized in hardware and/or software) compares measurement statistics data with training statistics data. From an output of the comparison means it can be deduced that some failure is likely to have occurred in the process. Due to the comparison of statistics data, a sound and reliable basis for a diagnostic output, since a considerable number of process variable values has been evaluated for generating the statistics data. Furthermore, due to the comparison of statistics data, it is possible to estimate or to prescribe the likelihood of the correctness of a diagnostic output. I.e., an output failure (or no-failure) indication can be provided with an indication of a confidence level associated with the failure (or no-failure) indication, or an output failure (or no-failure) indication is given only if the indication has at least a prescribable confidence level (indication of degree of certainty). According, a diagnostic output output from a diagnostic device has a considerable added value if based on the comparison of the measurement statistics data with the training statistics data as realized in the comparison means.
- The above-mentioned "means" (receiving means, measurement processing means, training processing means, comparison means, sensing means) could also be referred to as "units". These means, in particular the receiving means, measurement processing means, training processing means and comparison means, can be partially or fully identical, in particular if they are realized in form of software and/or hardware.
- In a preferred embodiment the comparison means has a condition output related to a condition of the process, wherein the condition of the process is different from a measure for the process variable. A diagnostic output of the diagnostic device, accordingly, is preferably not a magnitude that would indicate values of the process variable. If, e.g., the process variable is the flow velocity of the process medium, the condition of the process can, e.g., be a condition of a pump, for example indicated by its pumping speed, or a condition of another process device, in particular process control device.
- In particular, if the diagnostic device comprises a sensing means, the condition output can be related to the condition of the sensing means.
Accordingly, in that case the condition output is related to the condition of the diagnostic device, so that the diagnostic device provides for a self-diagnostic feature. - In another preferred embodiment the measurement statistics data and the training statistics data relate to noise carried in the process medium. Such noise can, e.g., be vibration noise. The noise can stem from a process device.
- According to the invention the training processing means calculates a training empirical statistical distribution. The training empirical statistical distribution is a distribution related to process variable values measured during a training phase. In one embodiment, it can be a distribution of process variable values or, more general, of a function of process variable values, e.g. the square of the process variable values or the sum of the squares of the process variable values. In another embodiment, it can be a distribution of values derived from a transform of process variable values.
- In the latter embodiment, preferably the measurement processing means calculates a transform of process variable values, which are measured during a measuring phase, into coefficients Xm(k) of a set of orthogonal functions, and the training processing means calculates a transform (of the same type) of process variable values, which are measured during a training phase, into coefficients Xt(k) of the same set of orthogonal functions, and the training empirical statistical distribution is a distribution of a function of the coefficients Xt(k). The training empirical statistical distribution can, e.g., be a distribution of the coefficients Xt(k) or of the coefficients Xt(k) squared; other, preferably arithmetic functions are also possible. Preferably, the orthogonal functions are orthonormal functions.
- The transform can preferably be one of the group of Fourier transform and wavelet transform.
- According to the invention, the training processing means calculates a training analytical distribution function approximating the training empirical statistical distribution. I.e., a prescribable function with one, two or more parameters is fitted to the training empirical statistical distribution. In this way, a maximum of information of high precision is gathered from the measured data, and the influence of statistical deviations during the training phase are reduced.
- It has been found that the Gamma distribution function provides for a particularly accurate fit to typical training empirical statistical distributions, at least as far as training empirical statistical distributions of values ferived from Fourier coefficients are concerned.
- In a preferred embodiment the measurement statistics data comprise a mean value Mp of a function of process variable values, which are measured during a measuring phase: E.g., the mean value Mp can be taken of the process variable values themselves or of the square of the process variable values. The training processing means calculates, as training statistics data or as part thereof, a lower limit value Lt,p and an upper limit value Ut,p from the training analytical distribution function. And, preferably, the comparison means outputs a failure indication in case that the mean value Mp is smaller than the lower limit value Lt,p or greater than the upper limit value Ut,p. This embodiment has the advantage that the lower limit value Lt,p and the upper limit value Ut,p can be chosen such that a prescribable (minimum) confidence level of the diagnostic output is achieved, since these limit values are derived from a statistical distribution. Moreover, the precision, with which the limit values, that correspond to a desired (minimum) confidence level, can be determined, is very high, because the limit values are derived from the (fitted) training analytical distribution function. Another advantage of this embodiment is that the processing effort needed for deriving the diagnostic output is relatively low with respect to the quality, in particular the reliability and soundness, of the diagnostic output.
- Another preferred embodiment works similarly, but with transformed process variable values, and has corresponding advantages: In that embodiment the measurement statistics data comprise a mean value Mc of a function of the coefficients Xm(k), and the training processing means calculates, as training statistics data or as part thereof, a lower limit value Lt,c and an upper limit value Ut,c from the training analytical distribution function, and, preferably, the comparison means outputs a failure indication in case that the mean value Mc is smaller than the lower limit value Lt,c or greater than the upper limit value Ut,c. The mean value Mc can, e.g., refer to the coefficients Xm(k) directly or to the coefficients Xm(k) squared or another; preferably arithmetic function of the coefficients Xm(k).
- Instead of the mean value, or in addition to it, it is possible to use the variance or the standard deviation in the before-mentioned preferred embodiments.
- According to the invention the measurement statistics data comprise a measurement empirical statistical distribution, which is a distribution of a function of of such process variable values, which are measured during a measuring phase, and the training statistics data comprise the training analytical distribution function. The comparison means compares the measurement empirical statistical distribution with the training analytical distribution function. The comparison means can output a failure indication dependending on the result of a comparison of the measurement empirical statistical distribution with the training analytical distribution function. Preferably, the comparison means outputs a failure indication in case that the confidence level derived from of a statistical test of the consistency of the measurement empirical statistical distribution with the training analytical distribution function is below a prescribable threshold value. In this embodiment a distribution of currently measured values is calculated and compared, preferably in a statistical test, to an analytical distribution that has been fit to a distribution measured during the training phase. A desired confidence level of the diagnostic output can be chosen through the threshold value.
- It is possible, in such an embodiment to compare the measurement empirical statistical distribution with the training empirical statistical distribution instead of with the training analytical distribution function.
- Similar to this embodiment, another aspect of the invention has corresponding advantages, but deals with statistical distributions derived from transformed process variable values: In that embodiment the measurement statistics data comprise a measurement empirical statistical distribution, which is a distribution of a function of the coefficients Xm(k) (e.g. a distribution of the coefficients Xm(k) themselves or of the square of the coefficients Xm(k) or ...), and the training statistics data comprise the training analytical distribution function. The comparison means can output a failure indication depending on the result of a comparison of the measurement empirical statistical distribution with the training analytical distribution function. Preferably, the comparison means outputs a failure indication in case that the confidence level derived from of a statistical test of the consistency of the measurement empirical statistical distribution with the training analytical distribution function is below a prescribable threshold value. In this embodiment a distribution of coefficients derived from currently measured values is calculated and compared, preferably in a statistical test, to an analytical distribution that has been fit to a distribution derived during the training phase. A desired confidence level of the diagnostic output can be chosen through the threshold value.
- It is possible, in such an embodiment to compare the measurement empirical statistical distribution with the training empirical statistical distribution instead of with the training analytical distribution function.
- Statistical tests that have been found particularly useful for comparison of distributions in these embodiments are fitting tests, in particular, the Chi2-test and the Kolmogorov-Smirnov-test.
- Another embodiment comprises not only diagnostic devices of the above-mentioned kind, but as well transmitters, process control devices, process monitoring devices, and process control systems that comprise such a diagnostic device:
- The advantages of these correspond to the advantages of the diagnostic devices.
- The invention also comprises diagnostic methods as claimed in
claims - obtaining process variable values, which are derived from measuring a process variable of a process medium of a process,
- extracting and recording measurement statistics data from such process variable values, which are measured during a measuring phase,
- extracting and recording training statistics data from such process variable values, which are measured during a training phase, and
- comparing the measurement statistics data with training statistics data recorded before the measurement statistics data.
- The diagnostic method preferably is a method performed in a process control environment.
- Further diagnostic methods according to the invention can be derived from the diagnostic devices according to the invention. The advantages of the methods correspond to the advantages of the diagnostic devices.
- Another embodiment comprises furthermore transmitters, process control devices, process monitoring devices, and process control systems, which implement a diagnostic device according to the invention.
- Further preferred embodiments and advantages emerge from the dependent claims and the figures.
- Below, the invention is illustrated in more detail by means of preferred embodiments, which are shown in the included drawings: The figures show:
- Fig. 1
- a schematic illustration of a process control environment including a diagnostic device;
- Fig. 2
- schematically a diagnostic device with a sensing means, embodying a differential pressure transmitter;
- Fig. 3
- a block diagram of a basic algorithm of a diagnostic device;
- Fig. 4
- a block diagram including a training phase of a diagnostic device;
- Fig. 5
- a block diagram including a measuring phase of a diagnostic device;
- Fig. 6
- a block diagram of steps performed in a training processing means;
- Fig. 7
- a block diagram of steps performed in a measuring processing means and a comparison means;
- Fig. 8
- a block diagram of steps performed in a measuring processing means;
- Fig. 9
- a block diagram of steps performed in a training processing means, including a Fourier transform;
- Fig. 10 a
- block diagram of steps performed in a measuring processing means, including a Fourier transform;
- Fig. 11
- a block diagram of steps performed in a measuring processing means, including a Fourier transform, using a plurality of frequency bands;
- Fig. 12
- an illustration of data taking for creating moving "average" values during a measuring phase, including a Fourier transform.
- The reference symbols used in the figures and their meaning are summarized in the list of reference symbols. Generally, alike or alike-functioning parts are given the same reference symbols. The described embodiments are meant as examples and shall not confine the invention.
-
Fig. 1 schematically illustrates a typicalprocess control environment 1 with adiagnostic device 10. Thediagnostic device 10 is comprised in a differential pressure transmitter 20, which has twoimpulse lines 21, through which it is coupled to aprocess medium 2 of theprocess control environment 1. The differential pressure transmitter 20 can also be understood as a process monitoring device 20, which monitors a differential pressure in theprocess medium 2. Theprocess medium 2 can be, e.g., a liquid like water or oil, which is contained in atube 3. Process control devices like a pump 50 (including a pump control 51) and a valve 60 (including a valve control 61) are provided in theprocess control environment 1. Theprocess control devices diagnostic device 10. - Through the flow of the process medium 2 (indicated by arrows) and, in addition, through the
process control devices 50,60, noise is generated in theprocess medium 2. Such noise can be sensed by means of thediagnostic device 10 in the differential pressure sensor 20. A change in the process conditions, e.g., a malfunction or failure of aprocess device 20,50,60, may be reflected in the sensed differential pressure signal. -
Fig. 2 schematically shows the differential pressure transmitter, which is an example of adiagnostic device 10 with a sensing means 25. The sensing means 25 comprises the twoimpluse lines 21, which are filled withprocess medium 2, and a sensing system (sensing element) 26. Oneprocess membrane 22 and onepressure transmission arm 23 are provided for eachimpulse line 21. The pressure transmission arms 23 (oil circuits 23) are filled withoil 24 as asensing medium 24. The process membranes 22 are an interface between the impulse lines 21 (containing process medium 2) and the oil circuits 23 (containing sensing medium 24). Through thepressure transmission arm 23 the pressures from the process (in the impulse lines 21) is transferred to thesensing system 26. - Among others, the
sensing system 26 may be based on one or more of the following principles, which allow to derive an electrically measureable signal from the differential pressure: - Induction (the differential pressure modulates the inductance of a magnetic circuit)
- Piezoresistivity (the differential pressure modulates an output voltage of a piezoresistive element)
- Capacitance (the differential pressure modulates the capacity of an electric circuit)
- The signal derived that way is then digitized in a analogue-to-
digital converter 27. Amicroprocessor 15 of thediagnostic device 10 can then derive diagnostic information from the digitized differential pressure signal. - On the one hand, the
diagnostic device 10 can diagnose the condition and failures of various process devices, like 50 and 60. On the other hand (additionally or alternatively), thediagnostic device 10 can also diagnose the condition and failures of the sensing means 25. In particular, the following failures may occur and can be detected by the diagnostic device 10: - - 1. At least one of the
oil circuits 23 has a leak. - - 2. The interface between the two oil circuits23 (usually another membrane) is damaged, so that the sensing medium24 can flow between the two
circuits 23. - - 3. At least one of the process membranes 22 are broken, so that the
process medium 2 can flow into at least one of the pressure transmission arm. - - 4. At least one of the impulse lines 21 are partially or completely plugged.
- Frequent reasons for a plugged impulse line (failure 4.) are:
- Solid material is present in the
process medium 2 and blocks theimpulse line 21. - Some sedimentary process takes place in the
impluse line 21 and progressively plugs the impulse line (e.g., limestone). - The process medium in the
impulse line 21 solidifies, typically because of low temperatures. (This can happen even if theprocess medium 2 in the rest of the process does not solidify, because theprocess medium 2 in the impulse lines 21 is mainly still, whereas theprocess medium 2 in the process is usually flowing and therefore not still.) - It is of considerable to have diagnostic information on the condition of the sensing means 25 (and the
diagnostic device 10 or transmitter 20) itself. In particular, if the diagnostic information can distinguish between (some of) the above-mentioned failure modes. - During normal operating, when no device defect (failure) is present, it is advantageous for a diagnostic device, which uses at least two impulse lines (e.g., for a device using a pressure or differential pressure signal derived from these at least two impulse lines), to measures the pressure at two points, which are arranged close to each other. I.e., it is advantageous, when the locations at which the at least two impulse lines are coupled to the rest of the process medium, are in close proximity. The advantage is, that measured absolute values are small, fluctuations in the process fluid are mostly cancelled.
- When then a failure like type 1., 3. or 4. (see above) is present, with only one impulse line (or not all impulse lines) being concerned, the pressure at one side cannot be sensed properly. The consequent asymmetry in the measuring system implies that the pressure fluctuations are not cancelled anymore and are therefore present in the differential pressure signal. This implies that an overall increased signal occurs, in particular with higher frequency components being present, and therefore, the device defect can be diagnosed. If, on the other hand, a failure of
type 2, or of type 1., 3. or 4. with both impulse lines being concerned, occurs, the measured signal intensity is strongly decreased, thus allowing to detect such a failure. - Through a further analysis of the process variable data and/or the measurement statistics data more detailed information can be derived, which can allows to more clearly specify the type of occuring failure.
- A preferred basic algorithm for the functioning of a
diagnostic device 10 according to the invention is sketched in the block diagram inFig. 3 . First, the diagnostic device installed, i.e., mainly the diagnostic device is coupled to the process. Then follows atraining phase 200, in which training statistics data are generated. If then the nominal conditions in the process are unchanged, ameasuring phase 300 is entered. If, at any time, the nominal conditions in the process are changed, e.g., through installation of a new process device, anothertraining phase 200 is to be absolved before enteringmeasurement mode 300 again. -
Fig. 4 shows a block diagram including atraining phase 200 of a diagnostic device. In a receiving means 100 process variable values x(t), like differential pressure values, are received, e.g., referring toFig. 2 , from the A/D-converter 27. In a training processing means 200, training statistics data are extracted from the process variable values x(t) and recorded. Referring toFig. 2 , the training processing means 200 (like other involved means) may be realized through themicroprocessor 15. -
Fig. 5 shows a block diagram including ameasuring phase 300 of a diagnostic device. In a (or the) receiving means 100 process variable values x(t) are received, e.g., referring roFig. 2 , from the A/D-converter 27. In a measurement processing means 300, measurement statistics data are extracted from the process variable values x(t) and recorded. Referring toFig. 2 , the measurement processing means 300 may be realized through themicroprocessor 15. In a comparison means 400, which also may be realized through themicroprocessor 15, the measurement statistics data are compared to the training statistics data. The comparison results in adiagnostic output 500, e.g., indicating a (general) failure of the process or a specific failure. - In the block diagram of
Fig. 6 , steps performed in an exemplary training processing means 200 are schematically depicted. During a duration δt process variable values x(t) are recorded(step 210). From those process variable values, instep 250, a training empirical statistical distribution is calculated. Instep 270, a training analytical distribution function is fitted to the training empirical statistical distribution. This optional fitting of a training analytical distribution function allows to receive very precise data in a minimized time δt. - As shown in
step 290, from the training analytical distribution function limit values Lt,p, Ut,p may be derived with high precision. The choice of a prescribable level K allows to choose these limit values Lt,p, Ut,p such that both, the probability of the existence of a value below Lt,p and the probability of the existence of a value above Ut,p, each have a defined value. If the limit values Lt,p, Ut,p shall be chosen such that the probability of the existence of a value below Lt,p is equal to the probability of the existence of a value above Ut,p, usually one prescribable level K will be chosen for finding the lower limit value Lt,p, and another (different) prescribable level K will be chosen for finding the upper limit value Ut,p (not shown inFig. 6 ). - Such limit values Lt,p, Ut,p can also be derived from the training empirical statistical distribution itself (directly, without fitting). But the precision is less good and/or the time δt required to record the process variable values x(t) must be chosen longer.
- If only the training analytical distribution function or even only the training empirical statistical distribution is used as training statistical data during further steps in a measuring phase, step 290 or even also step 270 can be omitted.
- The block diagram of
Fig. 7 shows steps that can be performed in a measuring processing means 300 and a comparison means 400. In this embodiment, which can be used in conjunction with the training phase depicted inFig. 6 , firstly, process variable values x(t) are recorded during a time window δt (step 310). The duration δt in the training phase (compareFig. 6 , step 210) is typically of the order of 10 times to 50 times longer than the duration δt during a measuring phase. Instep 390, the mean value MP of the recorded process variable values is calculated. In the comparison means, step 420, measuring statistics data are compared to training statistic data: The mean value MP is compared to the two limit values Lt,p, Ut,p derived from the training phase (Fig. 6 , step 290). If Mp lies within the range given by Lt,p, Ut,p, the condition of the process is expected to be in good order. Otherwise, the diagnostic output will be set to "failure". - It is, advantageously, possible to calculate a moving average in
step 390. This means that after the calculation of one mean value Mp, the next mean value Mp is calculated from process variable values measured in a time interval δt, which overlaps with the time interval δt, in which the process variable values were measured that lead to the former mean value Mp. Typically, a large overlap is chosen, in particular such that only the first x(t) value is discarded and a newly measured x(t) value is added, when a next mean value MP is calculated. Working with a moving average has the advantage that more data and more diagnostic outputs are generated per time, and the data are smoothed, i.e., the effect that singular spikes have is reduced. Alternatively, there is no overlap between the time intervals δt, in which the process variable values are measured that lead to consecutive mean values Mp. - In the block diagram of
Fig. 8 another possible set of steps that can be performed in a measuring processing means 300 and a comparison means 400 is depicted. In this case a distribution of process variable values x(t) as measurement statistics data is compared to a training statistical distribution function derived in the training (Fig. 6 , step 270) as training statistics data. In this embodiment, which can be used in conjunction with the training phase depicted inFig. 6 (whereinstep 290 can be left out), firstly, process variable values x(t) are recorded during a time window δt (step 310). From the x(t) values a measurement statistical distribution is calculated (step 350). In the comparison means the measurement empirical statistical distribution (as measurement statistical data) is compared to the training statistical distribution function (step 450). This comparison is done in a statistical test, e.g., in a Chi2 test. As result of the statistical test a confidence level is derived, which indicates the probability of an agreement between the compared distributions. In case of the Chi2 test, some function scaling inversely with Chi2, like, e.g., 1/Chi2, is a possible value indicative of the confidence level. Instep 480 the derived confidence level (indicated as 1/Chi2) is compared to a prescribable threshold value K'. If the confidence level is below the threshold value K' , the diagnostic output will be set to "failure". Otherwise the condition of the process is expected to be in good order. - In this embodiment of
Fig. 8 , it is also possible to use the training empirical statistical distribution derived in step 250 (Fig. 6 ) as training statistical data. In that case, the measurement empirical statistical distribution and the training empirical statistical distribution would be subject to a statistical test instep 450. - In analogy to the use of a moving average in conjunction with
Fig. 7 , it is possible in the embodiment ofFig. 8 to derive consecutive measurement empirical statistical distributions from process variable values measured in overlapping time intervals δt. - In conjunction with the
Figs. 6-8 the mean values and distributions have been described to be such of the process variable values x(t) directly. It can nevertheless be advantageous to calculate the mean values and distributions from a function f(x(t)) of the process variable values. This function f(x) may be f(x) = X2 or subtraction of a constant or another, preferably arithmetic function. Of course, the same function has to be applied during a measuring phase as during a training phase. - The
Figs. 9-12 involve a transform of process variable values or a function of those. A Fourier transform, in particular, an FFT (fast Fourier transform), has been chosen in the Figures, but other transforms, like wavelet transforms are possible as well. -
Fig. 9 shows a block diagram of steps that can be performed in a training processing means involving an FFT. Instep 210, process variable values x(t) are taken during a time interval δt. Instep 220 an FFT is calculated from the x(t) values, yielding a spectrum of coefficients Xt(k) (the index t shall indicate that these coefficients are derived from values taken during a training phase). Step 230 is optional, but very advantageous. Instep 230 an interval of the transformed variable (an interval δk of frequencies k in case of a Fourier transform) is selected. This selection allows to confine further analysis to only those frequencies k, which are of particular interest. In case of many process variables, e.g., in case of differential pressures (compareFigs. 1-2 ), the process variable values are rather constant, with only small fluctuations. Accordingly, an FFT of such a signal typically has large value at very low frequencies (at and near 0 Hz), which are not of interest and can be left out by choosing the interval δk accordingly. - An advantageous possible way to automatically find a suitable interval δk is, after leaving out very low frequencies, to calculate a prescribable fraction (e.g., 10%) of the largest coefficient Xt(k) and find the lowest frequency kL and the largest frequency kU, which have a coefficient (Xt(kL); Xt(-kU)) at least as large as that fraction. The desired interval δk ranges then from kL to kU.
- In step 251 a training empirical statistical distribution is calculated from the spectrum Xt(k). One possibility is to sum up all Xt(k) values or their absolute values, possibly only within the interval δk of interest, to derive a signal power Sp, of which the training empirical statistical distribution is calculated. Accordingly, one spectrum Xt(k) results in one Sp value. It is also possible to do further or other calculations with the coefficients Xt(k) of interest in order to derive a signal power value Sp. The following formulae (in particular equations (2) and (3)) indicate possible calculations:


- As as described before, x(t) is a process variable value taken at time t, k is a frequency, X(k) denotes a coefficient of the spectum, and Sp is a signal power value. Furthermore, e denotes the base of the natural logarithm, j denotes the square root of -1, and N is the number of measured process variable values within the interval δt. P(k) is an intermediate value for calculating the signal power. Sp(k1,k2) is the signal power value derived from a frequency range from k1 to k2. k1 and k2 correspond to the lower and upper limit frequencies kL and kU discussed above. Equation (1) is the formula for a discrete Fourier transform.
- More general, a number (≥ 2) of intervals δk can be chosen which each comprise frequencies of interest, so that the signal power Sp is derived from those frequencies that are in located in one of those intervals.
- In the
optional step 271, a training analytical distribution function is fitted to the so-derived training empirical statistical distribution ofstep 251. This is in analogy to step 270 (Fig. 6 ). In theoptional step 291, lower and upper limit values Lt,c, Ut,c may be derived with high precision from the training analytical distribution function, in analogy to step 290 (Fig. 6 ). Optionally, the limit values Lt,c, Ut,c may be derived directly from the training empirical statistical distribution (220 or 230), without fitting. As training staticstics data can, accordingly, serve one or more of the group of training empirical statistical distribution, training analytical distribution function and limit values Lt,c, Ut,c. The mean value of the training empirical statistical distribution or of the training analytical distribution function and/or the variance (or standard deviation) of those may also contribute to the training staticstics data, which are, in a measurement phase, compared to measurement staticstics data. - The block diagram of
Fig. 10 shows steps that can be performed in a measuring processing means 300 and a comparison means 400. In this embodiment, which can be used in conjunction with the training phase depicted inFig. 9 , firstly, process variable values x(t) are recorded during a time window δt (step 310). This time window δt is as large as the time window used during the training phase (Fig. 9 , step 210). Then, in step 320 a Fourier transform is calculated from the x(t) values, yielding a spectrum of coefficients Xm(k) (the index m shall indicate that these coefficients are derived from values taken during a measuing phase). Then, instep 330 the spectum Xm(k) is reduced to the interval δk (or intervals), known from the training (Fig. 9 , step 230), if done so in the training phase. - In
step 391 signal power values are calculated in the way they were calculated during the training (Fig. 9 , step 251), and from the Sp values, a mean value Mc is calculated (approximately analogue to step 390 inFig. 7 ). In the comparison means 400, the mean value Mc can the, instep 421, be compared to the limit values derived during the training (Fig. 9 , step 291). If Mc lies within the range given by Lt,c, Ut,c, the condition of the process is expected to be in good order. Otherwise, the diagnostic output will be set to "failure". - More advanced comparison means 400 can receive from the measurement processing means 300 a measurement empirical statistical distribution (from
step 320 or better from step 330) and compare this to the training analytical distribution function (derived instep 271,Fig. 9 ) or to the training empirical statistical distribution itself (derived instep 220 or better 230 inFig. 9 ) (in analogy toFig. 8 , step 450). Preferably, this comparison is a statistical test, like the Chi2 test. According to the result of the comparison, a failure will be diagnosed or not (in analogy toFig. 8 , step 480). - Certainly, it is also possible to fit an analytical distribution function to a distribution derived from data derived during a measurement phase and compare this analytical function with a training analytical distribution function (or even the training empirical statistical distribution). This holds for training and measuring phases involving a transform as well as for such not involving a transform.
- In an advanced and preferred comparison means 400 (not illustrated), preferably firstly, a mean value is compared to each limit value found during the training and (then) a measurement-derived distribution is compared to a training-derived distribution (or distribution function). If any of these comparisons indicate a failure condition in the process, the diagnostic output is set to "failure". This comparison means can be employed in case of distributions (or distribution functions) derived with or without a transform.
-
Fig. 1 1 shows a block diagram of steps that can be performed in an advanced measuring processing means, including a (Fourier) transform. Aftersteps 310 and 320 (compareFig. 10 ), a plurality (here: three) of frequency bands δk1, δk2, δk3 is chosen instep 330, which bands are then analyzed separately. Certainly, a corresponding training phase must have made the same frequency band separation. For each frequency band δk1, δk2, δk3 a separate processing takes place. From one or more of the bands a mean value can be calculated and then compared to limit values derived from the training phase. It is also possible to derive a measurement empirical statistical distribution of spectral power values from one or more of the frequency bands, as is shown inFig. 11 ,step 351 for all three bands. Each of these measurement empirical statistical distributions can, e.g., be compared to a corresponding training-derived distribution (or fitted distribution function). A "failure" output can be made, if any of the comparisons of the bands is negative, or if a prescribable number of them is negative. - The division into singly analyzed bands can even be extended to such depth that the full spectrum (each transform-derived coefficient) is separately analyzed, or that certain single frequencies are separately analyzed.
-
Fig. 12 is an illustration of data taking for creating moving "average" values during a measuring phase, including a Fourier transform. Similar to the comments given above in conjunction withFig. 7 (and8 ), it is advantageous to use moving values (the term "average" does not always apply here correctly) also in conjunction with transformed data. As shown inFig. 12 , from data taken within a time interval δt one set of process variable values and, accordingly, one spectrum Xm(k) is derived, which results in one signal power value Sp (or in a number of separately analyzed Sp values) From a number n (typically 50 to 200) of such spectra or signal power values Sp, one measurement empirical statistical distribution is derived. Accordingly, for one measurement empirical statistical distribution, data have to be acquired during a time interval of a length of δT = nxδt. In order to have "moving values", the next interval δT' will overlap with the former interval (δT), perferably with a shift of 1×δt. In analogy, this is also done when deriving mean values instead of measurement empirical statistical distributions. - In the cases discussed above, in which a mean value is calculated, it is alternatively or additionally possible to calculate a variance or another statistical magnitude and continue with this in the comparison means.
- An advantage of the comparison of measurement statistics data with training statistics data is, that a prescribable level of confidence for the diagnostic output can be chosen and/or a level (K, K', 1 /Chi2, ...) relating to the confidence level can be part of the diagnostic output and thus indicate a to a user how trustful the failure or no failure indication is.
-
- 1
- process control environment
- 2
- process medium, process fluid
- 3
- tube
- 5
- process control system
- 10
- diagnostic device
- 15
- microprocessor
- 20
- differential pressure transmitter
- 21
- impulse line
- 22
- process membrane
- 23
- pressure transmission arm, oil circuit
- 24
- sensing medium, oil
- 25
- sensing means
- 26
- sensing element, sensing system
- 27
- A/D converter
- 50
- pump
- 51
- pump control
- 60
- valve
- 61
- valve control
- 100
- receiving means; process variable value reception
- 200
- training processing means; training phase; training mode
- 210
- recording of process variable values
- 220
- transform, Fourier transform, FFT
- 230
- calculation of range in transform space, calculation of frequency range
- 250,251
- calculation of training statistics data; calculation of training empirical statistical distribution; training empirical statistical distribution
- 270,271
- fitting of training analytical distribution function to training empirical statistical distribution; training analytical distribution function
- 290,291
- calculation of training statistics data; calculation of limit values
- 300
- measurement processing means; measuring phase; measuring mode
- 310
- recording of process variable values
- 320
- transform, Fourier transform, FFT
- 330
- calculation of range-confined measurement empirical statistical distribution (in transform space)
- 350,351
- calculation of measurement statistics data; calculation of measurement empirical statistical distribution; measurement empirical statistical distribution
- 390
- calculation of measurement statistics data; calculation of mean value Mp
- 391
- calculation of measurement statistics data; calculation of mean value Mc
- 400
- comparison means; comparison of measurement statistics data with training statistics data
- 420
- comparison of mean value Mp with training statistics data
- 421
- comparison of mean value Mc with training statistics data
- 450
- statistical test, test of consistency of measurement empirical statistical distribution with training analytical distribution function
- 480
- comparison of confidence level with prescribed level
- 500
- diagnostic output, condition output, output means, display
- δk,δk1,δk2,δk3
- range in transform space, frequency range
- δt
- duration of recording of one set of process variable values, time window, duration
- K,K'
- prescribable level
- k
- transform variable, frequency
- kL,kU,k1,k2
- limit values in transform space, frequency limits
- Lt,p,Lt,c
- lower limit value
- Mc
- mean value of transform coefficients, mean value of a function of transform coefficients
- Mp
- mean value of process variable values, mean value of a function of process variable values
- Sp,Sp1,Sp2,Sp3
- signal, function of transformed process variable values, signal power
- t
- time
- Ut,p,Ut,c
- upper limit value,
- W
- statistical distribution, distribution function
- X(k),Xm(k),Xt(k)
- transform, discrete transform, discrete Fourier transform, coefficient
- x(t)
- process variable value (taken at various times)
Claims (12)
- A diagnostic device (10) comprising- a receiving means (100) for receiving process variable values (x(t)) of a process variable of a process medium (2) of a process,- a measurement processing means (300) for extracting and recording measurement statistics data from such process variable values, which are measured during a measuring phase (300),- a training processing means (200) for extracting and recording training statistics data from such process variable values which are measured during a training phase (200), for calculating a training empirical statistical distribution (250;251) whereby the distribution (250;251) is a distribution of a function of process variable values (x(t)) which are measured during a training phase (200) and for calculating a training analytical distribution function (270;271) approximating the training empirical statistical distribution (250) and comprising- a comparison means (400) for comparing the measurement statistics data with training statistics data recorded before the measurement statistics data,characterized in that the measurement statistics data comprise a measurement empirical statistical distribution (350), which is a distribution of a function of such process variable values (x(t)), which are measured during a measuring phase (300), and that the training statistics data comprise the training analytical distribution function (270), and that the comparison means (400) outputs a failure indication in case that the confidence level (1/Chi2) derived from a statistical test (450) of the consistency of the measurement empirical statistical distribution (350) with the training analytical distribution function (250) is below a prescribable threshold value (K').
- A diagnostic device (10) comprising- a receiving means (100) for receiving process variable values (x(t)) of a process variable of a process medium (2) of a process,- a measurement processing means (300) for extracting and recording measurement statistics data from such process variable values, which are measured during a measuring phase (300) and for calculating a transform of process variable values (x(t)), which are measured during a measuring phase (300), into coefficients Xm(k) of a set of orthogonal functions, and comprising- a training processing means (200) for extracting and recording training statistics data from such process variable values which are measured during a training phase (200). for calculating a training empirical statistical distribution (250;251) , for calculating a transform of process variable values (x(t)), which are measured during a measuring phase (300), into coefficients Xm(k) of a set of orthogonal functions, whereby the training empirical statistical distribution (250) is a distribution of a function of the coefficients Xt(k) and for calculating a training analytical distribution function (270;271) approximating the training empirical statistical distribution (250), and comprising- a comparison means (400) for comparing the measurement statistics data with training statistics data recorded before the measurement statistics datacharacterized in that the measurement statistics data comprise a measurement empirical statistical distribution (351), which is a distribution of the function of the coefficients Xm(k), and that the training statistics data comprise the training analytical distribution function (271), and that the comparison means (400) outputs a failure indication in case that the confidence level (1 /Chi2) of a statistical test of the consistency of the measurement empirical statistical distribution (351) with the training analytical distribution function (271) is below a prescribable threshold value.
- The diagnostic device (10) according to claim 1 or 2, characterized in that it comprises a sensing means (25) for measurement of the process variable and for generating the process variable values (x(t)).
- The diagnostic device (10) according to anyone of the claims 1 to 3,
characterized in that the comparison means (400) has a condition output (500) related to a condition of the process, wherein the condition of the process is different from a measure for the process variable. - The diagnostic device (10) according to claim of the preceding claims,
characterized in that the condition output (500) is related to the condition of the sensing means (25). - The diagnostic device (10) according to one of the preceding claims,
characterized in that the measurement statistics data and the training statistics data relate to noise carried in the process medium (2). - The diagnostic device (10) according to claim 6, characterized in that the transform is one of the group of Fourier transform and wavelet transform.
- The diagnostic device (10) according to claim 7, characterized in that the training analytical distribution function (270;271) is a Gamma distribution function.
- The diagnostic device (10) according to claim 1 or 2, characterized in that the statistical test is one of the group of Chi2-test and Kolmogorov-Smirnov-test.
- A process control system (1) comprising a diagnostic device (10) according to one of the preceding claims.
- A diagnostic method comprising the steps of- obtaining process variable values (210;310), which are derived from measuring a process variable of a process medium (2) of a process,- extracting and recording measurement statistics data from such process variable values (x(t)), which are measured during a measuring phase (300),- extracting and recording training statistics data from such process variable values (x(t)), which are measured during a training phase (200),- calculating a training empirical statistical distribution (250;251) whereby the distribution (250;251) is a distribution of a function of process variable values (x(t)) which are measured during a training phase (200),- calculating a training analytical distribution function (270;271) approximating the training empirical statistical distribution (250) and- comparing (400) the measurement statistics data with training statistics data recorded before the measurement statistics data,characterized in the steps of the measurement statistics data comprise a measurement empirical statistical distribution (350), which is a distribution of a function of such process variable values (x(t)), which are measured during a measuring phase (300), the training statistics data comprise the training analytical distribution function (270), and the comparison means (400) outputting a failure indication in case that the confidence level (1/Chi2) derived from a statistical test (450) of the consistency of the measurement empirical statistical distribution (350) with the training analytical distribution function (250) is below a prescribable threshold value (K').
- A diagnostic method comprising the steps of- obtaining process variable values (210;310), which are derived from measuring a process variable of a process medium (2) of a process,- extracting and recording measurement statistics data from such process variable values (x(t)), which are measured during a measuring phase (300),- calculating a transform of process variable values (x(t)), which are measured during a measuring phase (300), into coefficients Xm(k) of a set of orthogonal functions,- extracting and recording training statistics data from such process variable values (x(t)), which are measured during a training phase (200),- calculating a training empirical statistical distribution (250;251), calculating a transform of process variable values (x(t)), which are measured during a measuring phase (300), into coefficients Xm(k) of a set of orthogonal functions, whereby the training empirical statistical distribution (250) is a distribution of a function of the coefficients Xt(k),- calculating a training analytical distribution function (270;271) approximating the training empirical statistical distribution (250),- comparing (400) the measurement statistics data with training statistics data recorded before the measurement statistics data,characterized in the steps of the measurement statistics data comprise a measurement empirical statistical distribution (351), which is a distribution of the function of the coefficients Xm(k), the training statistics data comprise the training analytical distribution function (271), and the comparison means (400) outputting a failure indication in case that the confidence level (1/Chi2) of a statistical test of the consistency of the measurement empirical statistical distribution (351) with the training analytical distribution function (271) is below a prescribable threshold value.
Applications Claiming Priority (1)
| Application Number | Priority Date | Filing Date | Title |
|---|---|---|---|
| PCT/CH2005/000084 WO2006086894A1 (en) | 2005-02-15 | 2005-02-15 | Diagnostic device for a process control system |
Publications (2)
| Publication Number | Publication Date |
|---|---|
| EP1877877A1 EP1877877A1 (en) | 2008-01-16 |
| EP1877877B1 true EP1877877B1 (en) | 2009-08-26 |
Family
ID=35044617
Family Applications (1)
| Application Number | Title | Priority Date | Filing Date |
|---|---|---|---|
| EP05706510A Active EP1877877B1 (en) | 2005-02-15 | 2005-02-15 | Diagnostic device for a process control system |
Country Status (7)
| Country | Link |
|---|---|
| US (1) | US7634382B2 (en) |
| EP (1) | EP1877877B1 (en) |
| CN (1) | CN100573381C (en) |
| AT (1) | ATE441140T1 (en) |
| DE (1) | DE602005016310D1 (en) |
| ES (1) | ES2331576T3 (en) |
| WO (1) | WO2006086894A1 (en) |
Families Citing this family (29)
| Publication number | Priority date | Publication date | Assignee | Title |
|---|---|---|---|---|
| US7577543B2 (en) * | 2005-03-11 | 2009-08-18 | Honeywell International Inc. | Plugged impulse line detection |
| WO2006136036A1 (en) * | 2005-06-21 | 2006-12-28 | Abb Research Ltd | Diagnostic device for use in process control system |
| US8898036B2 (en) * | 2007-08-06 | 2014-11-25 | Rosemount Inc. | Process variable transmitter with acceleration sensor |
| US8285514B2 (en) * | 2008-03-21 | 2012-10-09 | Rochester Institute Of Technology | Sensor fault detection systems and methods thereof |
| US20090295559A1 (en) * | 2008-06-02 | 2009-12-03 | Gm Global Technology Operations, Inc. | Integrated hierarchical process for fault detection and isolation |
| FI125797B (en) * | 2009-01-09 | 2016-02-29 | Metso Flow Control Oy | Method and equipment for valve condition monitoring |
| EP2372962B1 (en) * | 2010-03-31 | 2017-08-16 | Alcatel Lucent | Method and system for reducing energy consumption in packet processing linecards |
| US9207670B2 (en) | 2011-03-21 | 2015-12-08 | Rosemount Inc. | Degrading sensor detection implemented within a transmitter |
| US9078629B2 (en) * | 2011-09-19 | 2015-07-14 | Hewlett-Packard Development Company, L.P. | Detecting regime change in streaming data |
| CN103064340B (en) * | 2011-10-21 | 2014-12-03 | 沈阳高精数控技术有限公司 | Failure prediction method facing to numerically-controlled machine tool |
| US9052240B2 (en) | 2012-06-29 | 2015-06-09 | Rosemount Inc. | Industrial process temperature transmitter with sensor stress diagnostics |
| US9602122B2 (en) | 2012-09-28 | 2017-03-21 | Rosemount Inc. | Process variable measurement noise diagnostic |
| ES2541277T3 (en) * | 2012-12-24 | 2015-07-17 | Air Products And Chemicals, Inc. | Apparatus and methods for monitoring and controlling cyclic process units in a stable plant environment |
| CN103353752B (en) * | 2013-04-12 | 2015-10-28 | 北京航空航天大学 | Based on the aircraft environmental control system Control Component method for diagnosing faults of level Four RBF neural |
| CN103753400B (en) * | 2014-01-22 | 2015-12-30 | 杭州电子科技大学 | A kind of failure predication for numerically control grinder control system and self-recovery method |
| WO2016081928A1 (en) | 2014-11-21 | 2016-05-26 | Picarro, Inc. | Gas detection systems and methods using measurement position uncertainty representations |
| CN104503435B (en) * | 2014-12-03 | 2017-03-22 | 中国人民解放军国防科学技术大学 | Integrated decision-making method used for spaceflight power system real-time fault detection |
| US9836069B1 (en) | 2015-03-31 | 2017-12-05 | Google Inc. | Devices and methods for protecting unattended children in the home |
| US10386258B1 (en) * | 2015-04-30 | 2019-08-20 | Picarro Inc. | Systems and methods for detecting changes in emission rates of gas leaks in ensembles |
| US10367612B2 (en) * | 2015-09-30 | 2019-07-30 | Rosemount Inc. | Process variable transmitter with self-learning loop diagnostics |
| JP6444851B2 (en) * | 2015-12-24 | 2018-12-26 | ファナック株式会社 | Control device having learning function for detecting cause of noise generation |
| US20170261406A1 (en) * | 2016-03-10 | 2017-09-14 | Simmonds Precision Products, Inc. | Physical component fault diagnostics |
| US10948471B1 (en) | 2017-06-01 | 2021-03-16 | Picarro, Inc. | Leak detection event aggregation and ranking systems and methods |
| US10962437B1 (en) | 2017-06-27 | 2021-03-30 | Picarro, Inc. | Aggregate leak indicator display systems and methods |
| US10753965B2 (en) * | 2018-03-16 | 2020-08-25 | Music Tribe Brands Dk A/S | Spectral-dynamics of an audio signal |
| GB2576309A (en) * | 2018-08-10 | 2020-02-19 | Green Running Ltd | Systems and methods for condition monitoring |
| WO2020217155A1 (en) * | 2019-04-25 | 2020-10-29 | Abb Schweiz Ag | Method and system for production accounting in process industries using artificial intelligence |
| EP3764179A1 (en) * | 2019-07-08 | 2021-01-13 | ABB Schweiz AG | Assessing conditions of instustrial equipment and processes |
| US11801758B2 (en) * | 2021-11-27 | 2023-10-31 | Xidong Tang | Method and apparatus for controlling distributed propulsion systems |
Family Cites Families (4)
| Publication number | Priority date | Publication date | Assignee | Title |
|---|---|---|---|---|
| US6907383B2 (en) * | 1996-03-28 | 2005-06-14 | Rosemount Inc. | Flow diagnostic system |
| US6601005B1 (en) * | 1996-11-07 | 2003-07-29 | Rosemount Inc. | Process device diagnostics using process variable sensor signal |
| US5987398A (en) * | 1998-04-30 | 1999-11-16 | Sony Corporation | Method and apparatus for statistical process control of machines and processes having non-constant mean of a response variable |
| JP2002372440A (en) * | 2001-06-14 | 2002-12-26 | Ho Jinyama | Signal recording device having state judging method, device, and function |
-
2005
- 2005-02-15 EP EP05706510A patent/EP1877877B1/en active Active
- 2005-02-15 ES ES05706510T patent/ES2331576T3/en active Active
- 2005-02-15 AT AT05706510T patent/ATE441140T1/en not_active IP Right Cessation
- 2005-02-15 DE DE602005016310T patent/DE602005016310D1/en active Active
- 2005-02-15 CN CNB2005800483504A patent/CN100573381C/en not_active Expired - Fee Related
- 2005-02-15 WO PCT/CH2005/000084 patent/WO2006086894A1/en active Application Filing
-
2007
- 2007-07-26 US US11/878,738 patent/US7634382B2/en active Active
Also Published As
| Publication number | Publication date |
|---|---|
| US7634382B2 (en) | 2009-12-15 |
| ES2331576T3 (en) | 2010-01-08 |
| CN100573381C (en) | 2009-12-23 |
| EP1877877A1 (en) | 2008-01-16 |
| WO2006086894A1 (en) | 2006-08-24 |
| DE602005016310D1 (en) | 2009-10-08 |
| US20080033693A1 (en) | 2008-02-07 |
| ATE441140T1 (en) | 2009-09-15 |
| CN101124523A (en) | 2008-02-13 |
Similar Documents
| Publication | Publication Date | Title |
|---|---|---|
| EP1877877B1 (en) | Diagnostic device for a process control system | |
| US7729876B2 (en) | Diagnostic device for use in process control system | |
| JP4422412B2 (en) | Flow diagnostic system | |
| US9797808B2 (en) | Diagnosis of gear condition by comparing data from coupled gears | |
| US5586066A (en) | Surveillance of industrial processes with correlated parameters | |
| US7013223B1 (en) | Method and apparatus for analyzing performance of a hydraulic pump | |
| US6792360B2 (en) | Harmonic activity locator | |
| EP1915660B1 (en) | Process variable transmitter with diagnostics | |
| US6915237B2 (en) | Integrated system for verifying the performance and health of instruments and processes | |
| EP2857917A1 (en) | State diagnosing method and state diagnosing apparatus | |
| US11408270B2 (en) | Well testing and monitoring | |
| EP3580623B1 (en) | Method for detection and isolation of faulty sensors | |
| CN109469896B (en) | Industrial boiler fault diagnosis method and system based on time series analysis | |
| EP2746885A1 (en) | Method of monitoring the condition of a wind turbine | |
| CN105651325A (en) | Degrading sensor detection implemented within a transmitter | |
| US6904386B2 (en) | Control system and method for detecting plugging in differential pressure cells | |
| JP2002090267A (en) | Failure diagnosis method | |
| JP2016053308A (en) | Fault diagnosis equipment for hydraulic pump | |
| EP3950966A1 (en) | Blast furnace abnormality assessment device, blast furnace abnormality assessment method, and blast furnace operation method | |
| US20160334248A1 (en) | Technique for robust detection of plugged impulse lines |
Legal Events
| Date | Code | Title | Description |
|---|---|---|---|
| PUAI | Public reference made under article 153(3) epc to a published international application that has entered the european phase |
Free format text: ORIGINAL CODE: 0009012 |
|
| 17P | Request for examination filed |
Effective date: 20071108 |
|
| AK | Designated contracting states |
Kind code of ref document: A1 Designated state(s): AT BE BG CH CY CZ DE DK EE ES FI FR GB GR HU IE IS IT LI LT LU MC NL PL PT RO SE SI SK TR |
|
| RIN1 | Information on inventor provided before grant (corrected) |
Inventor name: MORONI, ANDREA Inventor name: ANDENNA, ANDREA Inventor name: INVERNIZZI, GIOVANNI |
|
| DAX | Request for extension of the european patent (deleted) | ||
| GRAP | Despatch of communication of intention to grant a patent |
Free format text: ORIGINAL CODE: EPIDOSNIGR1 |
|
| GRAS | Grant fee paid |
Free format text: ORIGINAL CODE: EPIDOSNIGR3 |
|
| GRAA | (expected) grant |
Free format text: ORIGINAL CODE: 0009210 |
|
| AK | Designated contracting states |
Kind code of ref document: B1 Designated state(s): AT BE BG CH CY CZ DE DK EE ES FI FR GB GR HU IE IS IT LI LT LU MC NL PL PT RO SE SI SK TR |
|
| REG | Reference to a national code |
Ref country code: GB Ref legal event code: FG4D |
|
| REG | Reference to a national code |
Ref country code: CH Ref legal event code: EP |
|
| REG | Reference to a national code |
Ref country code: IE Ref legal event code: FG4D |
|
| REF | Corresponds to: |
Ref document number: 602005016310 Country of ref document: DE Date of ref document: 20091008 Kind code of ref document: P |
|
| REG | Reference to a national code |
Ref country code: ES Ref legal event code: FG2A Ref document number: 2331576 Country of ref document: ES Kind code of ref document: T3 |
|
| LTIE | Lt: invalidation of european patent or patent extension |
Effective date: 20090826 |
|
| PG25 | Lapsed in a contracting state [announced via postgrant information from national office to epo] |
Ref country code: SE Free format text: LAPSE BECAUSE OF FAILURE TO SUBMIT A TRANSLATION OF THE DESCRIPTION OR TO PAY THE FEE WITHIN THE PRESCRIBED TIME-LIMIT Effective date: 20090826 Ref country code: FI Free format text: LAPSE BECAUSE OF FAILURE TO SUBMIT A TRANSLATION OF THE DESCRIPTION OR TO PAY THE FEE WITHIN THE PRESCRIBED TIME-LIMIT Effective date: 20090826 Ref country code: AT Free format text: LAPSE BECAUSE OF FAILURE TO SUBMIT A TRANSLATION OF THE DESCRIPTION OR TO PAY THE FEE WITHIN THE PRESCRIBED TIME-LIMIT Effective date: 20090826 Ref country code: LT Free format text: LAPSE BECAUSE OF FAILURE TO SUBMIT A TRANSLATION OF THE DESCRIPTION OR TO PAY THE FEE WITHIN THE PRESCRIBED TIME-LIMIT Effective date: 20090826 Ref country code: IS Free format text: LAPSE BECAUSE OF FAILURE TO SUBMIT A TRANSLATION OF THE DESCRIPTION OR TO PAY THE FEE WITHIN THE PRESCRIBED TIME-LIMIT Effective date: 20091226 |
|
| NLV1 | Nl: lapsed or annulled due to failure to fulfill the requirements of art. 29p and 29m of the patents act | ||
| PG25 | Lapsed in a contracting state [announced via postgrant information from national office to epo] |
Ref country code: PL Free format text: LAPSE BECAUSE OF FAILURE TO SUBMIT A TRANSLATION OF THE DESCRIPTION OR TO PAY THE FEE WITHIN THE PRESCRIBED TIME-LIMIT Effective date: 20090826 Ref country code: NL Free format text: LAPSE BECAUSE OF FAILURE TO SUBMIT A TRANSLATION OF THE DESCRIPTION OR TO PAY THE FEE WITHIN THE PRESCRIBED TIME-LIMIT Effective date: 20090826 Ref country code: SI Free format text: LAPSE BECAUSE OF FAILURE TO SUBMIT A TRANSLATION OF THE DESCRIPTION OR TO PAY THE FEE WITHIN THE PRESCRIBED TIME-LIMIT Effective date: 20090826 |
|
| PG25 | Lapsed in a contracting state [announced via postgrant information from national office to epo] |
Ref country code: PT Free format text: LAPSE BECAUSE OF FAILURE TO SUBMIT A TRANSLATION OF THE DESCRIPTION OR TO PAY THE FEE WITHIN THE PRESCRIBED TIME-LIMIT Effective date: 20091228 Ref country code: CY Free format text: LAPSE BECAUSE OF FAILURE TO SUBMIT A TRANSLATION OF THE DESCRIPTION OR TO PAY THE FEE WITHIN THE PRESCRIBED TIME-LIMIT Effective date: 20090826 Ref country code: BG Free format text: LAPSE BECAUSE OF FAILURE TO SUBMIT A TRANSLATION OF THE DESCRIPTION OR TO PAY THE FEE WITHIN THE PRESCRIBED TIME-LIMIT Effective date: 20091126 |
|
| PG25 | Lapsed in a contracting state [announced via postgrant information from national office to epo] |
Ref country code: RO Free format text: LAPSE BECAUSE OF FAILURE TO SUBMIT A TRANSLATION OF THE DESCRIPTION OR TO PAY THE FEE WITHIN THE PRESCRIBED TIME-LIMIT Effective date: 20090826 Ref country code: CZ Free format text: LAPSE BECAUSE OF FAILURE TO SUBMIT A TRANSLATION OF THE DESCRIPTION OR TO PAY THE FEE WITHIN THE PRESCRIBED TIME-LIMIT Effective date: 20090826 Ref country code: EE Free format text: LAPSE BECAUSE OF FAILURE TO SUBMIT A TRANSLATION OF THE DESCRIPTION OR TO PAY THE FEE WITHIN THE PRESCRIBED TIME-LIMIT Effective date: 20090826 Ref country code: DK Free format text: LAPSE BECAUSE OF FAILURE TO SUBMIT A TRANSLATION OF THE DESCRIPTION OR TO PAY THE FEE WITHIN THE PRESCRIBED TIME-LIMIT Effective date: 20090826 |
|
| PG25 | Lapsed in a contracting state [announced via postgrant information from national office to epo] |
Ref country code: SK Free format text: LAPSE BECAUSE OF FAILURE TO SUBMIT A TRANSLATION OF THE DESCRIPTION OR TO PAY THE FEE WITHIN THE PRESCRIBED TIME-LIMIT Effective date: 20090826 |
|
| PG25 | Lapsed in a contracting state [announced via postgrant information from national office to epo] |
Ref country code: BE Free format text: LAPSE BECAUSE OF FAILURE TO SUBMIT A TRANSLATION OF THE DESCRIPTION OR TO PAY THE FEE WITHIN THE PRESCRIBED TIME-LIMIT Effective date: 20090826 |
|
| PLBE | No opposition filed within time limit |
Free format text: ORIGINAL CODE: 0009261 |
|
| STAA | Information on the status of an ep patent application or granted ep patent |
Free format text: STATUS: NO OPPOSITION FILED WITHIN TIME LIMIT |
|
| 26N | No opposition filed |
Effective date: 20100527 |
|
| REG | Reference to a national code |
Ref country code: CH Ref legal event code: PL |
|
| PG25 | Lapsed in a contracting state [announced via postgrant information from national office to epo] |
Ref country code: MC Free format text: LAPSE BECAUSE OF NON-PAYMENT OF DUE FEES Effective date: 20100301 Ref country code: LI Free format text: LAPSE BECAUSE OF NON-PAYMENT OF DUE FEES Effective date: 20100228 Ref country code: GR Free format text: LAPSE BECAUSE OF FAILURE TO SUBMIT A TRANSLATION OF THE DESCRIPTION OR TO PAY THE FEE WITHIN THE PRESCRIBED TIME-LIMIT Effective date: 20091127 Ref country code: CH Free format text: LAPSE BECAUSE OF NON-PAYMENT OF DUE FEES Effective date: 20100228 |
|
| PG25 | Lapsed in a contracting state [announced via postgrant information from national office to epo] |
Ref country code: IE Free format text: LAPSE BECAUSE OF NON-PAYMENT OF DUE FEES Effective date: 20100215 |
|
| PG25 | Lapsed in a contracting state [announced via postgrant information from national office to epo] |
Ref country code: LU Free format text: LAPSE BECAUSE OF NON-PAYMENT OF DUE FEES Effective date: 20100215 Ref country code: HU Free format text: LAPSE BECAUSE OF FAILURE TO SUBMIT A TRANSLATION OF THE DESCRIPTION OR TO PAY THE FEE WITHIN THE PRESCRIBED TIME-LIMIT Effective date: 20100227 |
|
| PG25 | Lapsed in a contracting state [announced via postgrant information from national office to epo] |
Ref country code: TR Free format text: LAPSE BECAUSE OF FAILURE TO SUBMIT A TRANSLATION OF THE DESCRIPTION OR TO PAY THE FEE WITHIN THE PRESCRIBED TIME-LIMIT Effective date: 20090826 |
|
| REG | Reference to a national code |
Ref country code: FR Ref legal event code: PLFP Year of fee payment: 12 |
|
| REG | Reference to a national code |
Ref country code: FR Ref legal event code: PLFP Year of fee payment: 13 |
|
| PGFP | Annual fee paid to national office [announced via postgrant information from national office to epo] |
Ref country code: FR Payment date: 20170217 Year of fee payment: 13 |
|
| PGFP | Annual fee paid to national office [announced via postgrant information from national office to epo] |
Ref country code: ES Payment date: 20170213 Year of fee payment: 13 |
|
| REG | Reference to a national code |
Ref country code: FR Ref legal event code: ST Effective date: 20181031 |
|
| PG25 | Lapsed in a contracting state [announced via postgrant information from national office to epo] |
Ref country code: FR Free format text: LAPSE BECAUSE OF NON-PAYMENT OF DUE FEES Effective date: 20180228 |
|
| REG | Reference to a national code |
Ref country code: ES Ref legal event code: FD2A Effective date: 20190801 |
|
| PG25 | Lapsed in a contracting state [announced via postgrant information from national office to epo] |
Ref country code: ES Free format text: LAPSE BECAUSE OF NON-PAYMENT OF DUE FEES Effective date: 20180216 |
|
| REG | Reference to a national code |
Ref country code: DE Ref legal event code: R082 Ref document number: 602005016310 Country of ref document: DE Representative=s name: ZIMMERMANN & PARTNER PATENTANWAELTE MBB, DE Ref country code: DE Ref legal event code: R081 Ref document number: 602005016310 Country of ref document: DE Owner name: ABB SCHWEIZ AG, CH Free format text: FORMER OWNER: ABB RESEARCH LTD., ZUERICH, CH |
|
| REG | Reference to a national code |
Ref country code: GB Ref legal event code: 732E Free format text: REGISTERED BETWEEN 20200206 AND 20200212 |
|
| PGFP | Annual fee paid to national office [announced via postgrant information from national office to epo] |
Ref country code: IT Payment date: 20230223 Year of fee payment: 19 Ref country code: GB Payment date: 20230220 Year of fee payment: 19 Ref country code: DE Payment date: 20230216 Year of fee payment: 19 |