EP1865449A1 - Industry scenario mapping tool - Google Patents
Industry scenario mapping tool Download PDFInfo
- Publication number
- EP1865449A1 EP1865449A1 EP06011783A EP06011783A EP1865449A1 EP 1865449 A1 EP1865449 A1 EP 1865449A1 EP 06011783 A EP06011783 A EP 06011783A EP 06011783 A EP06011783 A EP 06011783A EP 1865449 A1 EP1865449 A1 EP 1865449A1
- Authority
- EP
- European Patent Office
- Prior art keywords
- industry
- market
- scenario
- data
- future
- Prior art date
- Legal status (The legal status is an assumption and is not a legal conclusion. Google has not performed a legal analysis and makes no representation as to the accuracy of the status listed.)
- Ceased
Links
Images












Classifications
-
- G—PHYSICS
- G06—COMPUTING OR CALCULATING; COUNTING
- G06Q—INFORMATION AND COMMUNICATION TECHNOLOGY [ICT] SPECIALLY ADAPTED FOR ADMINISTRATIVE, COMMERCIAL, FINANCIAL, MANAGERIAL OR SUPERVISORY PURPOSES; SYSTEMS OR METHODS SPECIALLY ADAPTED FOR ADMINISTRATIVE, COMMERCIAL, FINANCIAL, MANAGERIAL OR SUPERVISORY PURPOSES, NOT OTHERWISE PROVIDED FOR
- G06Q10/00—Administration; Management
Definitions
- the present invention relates to devices and processes that evaluate industry scenarios in the past and/or generate industry scenarios for the future.
- One aspect of the present invention regards an industry scenario mapping tool that includes a processor and a visual display electrically connected to the processor, wherein the processor prepares an advice screen to be shown on the visual display.
- the advice screen displays a 2 x 2 matrix representing four scenario regions and containing a graph plotting two market factors that can be used to show a market scenario in which an industry fits during a particular time period.
- a second aspect of the present invention regards a method of determining a future market scenario for an industry that includes obtaining subjective data from experts in an industry, combining the subjective data and determining from the combined subjective data which market scenario will apply to the industry in the future.
- a third aspect of the present invention regards an industry scenario mapping tool that includes a processor and a memory in communication with the processor.
- the memory has a structure so as to store and implement a program in conjunction with the processor so as to: 1) combine subjective data stored in the memory that has been obtained from experts in an industry and 2) determine from the combined subjective data which market scenario will apply to the industry in the future.
- a fourth aspect of the present invention regards a method of determining a market scenario for an industry by obtaining at least two types of market data regarding an industry and determining from the at least two types of market data a market scenario from four scenarios: "Paradise Lost,” “Gold Rush,” “Wars of Attrition” and "Gilded Cage”.
- FIG. 1 schematically shows an embodiment of a scenario mapping process in accordance with the present invention
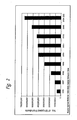
- FIG. 2 shows a graph illustrating the amounts of mobile handsets shipped throughout the world during an eight year period
- FIG. 3 shows a graph illustrating the growth rate of the mobile handset industry during an eight year period
- FIG. 4 shows a graph illustrating the market concentration in the mobile handset industry during an eight year period
- FIG. 5 shows a graph illustrating the change in market concentration in the mobile handset industry during an eight year period
- FIG. 6 shows a graph illustrating the change of shipments of mobile handsets shipped throughout the world and the change in market concentration during an eight year period;
- FIG. 7 shows the graph of FIG. 6 wherein four industry scenarios have been identified
- FIGS. 8A-C show a sample of a questionnaire that is used to pose questions to interviewees
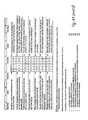
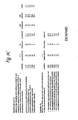
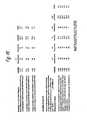
- FIGS. 9A-H shows a summary of answers given to the questions of the questionnaire of FIGS. 8A-C;
- FIGS. 10A-C show a sample of an analysis guide for the questionnaire questions of the questionnaire of FIGS. 8A-C that will be posed to interviewees to generate future market data in accordance with the present invention
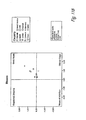
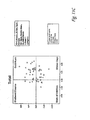
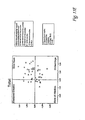
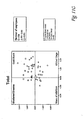
- FIGS. 11A-H show various 2x2 matrices that show various expectations for participants answering the questionnaire of FIGS. 8A-C;
- FIG. 12 shows the graph of FIG. 7 wherein a future industry data point is generated in accordance with the present invention and added to the graph;
- FIG. 13 shows an embodiment of an industry scenario mapping tool in accordance with the present invention
- FIG. 14 shows the graph of FIG. 12 wherein a future market scenario is predicted from the display of the graph of FIG. 12 on a display of the industry scenario mapping tool of FIG. 13;
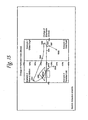
- FIG. 15 shows the graph of FIG. 12 wherein a second future market scenario is predicted from the display of the graph of FIG. 12 on a display of the industry scenario mapping tool of FIG. 13.
- an embodiment of an industry scenario mapping process 100 in accordance with the present invention generally entails three process: 1) analyze past market data from an industry of interest 110, 2) analyze present attitudes and expectations in the industry of interest 120 and 3) combine the data garnered from items 1) and 2) mentioned above so as to generate a visual map of how the industry of interest will look in the future 130.
- raw market data from the industry is analyzed to determine if there is a historical relationship between one market parameter and one or more other market parameters.
- market parameters that can be analyzed are supply, sales, industry concentration, demand behavior and government/industry regulation. Determining what particular parameters to study first depends on understanding the characteristics of the industry. For example, the parameters to be analyzed for a relatively young industry, such as the mobile handset industry, may be totally different than the parameters to be analyzed for a well established industry, such as the automobile industry.
- the analysis of the data preferably is over a range of years, such as eight years, so that statistically significant data can be analyzed.
- the mobile handset industry In the case of the mobile handset industry, it is a relatively young industry. The question at hand is whether it is gravitating to becoming a mature industry and if so when will it achieve that milestone. To approximate the maturity of a young industry, such as the mobile handset industry, growth is a key indicator. If growth can be observed, the industry is likely to be in a developing stage. A slowdown of growth or even stagnation suggests a maturing industry. When an industry shrinks considerably for several periods, it is probably already beyond its maturity phase. Therefore, growth is an indispensable indicator to analyze the mobile handset industry.
- a mobile handset is defined as any portable device that is equipped with a SIM card, such as mobile phones, data cards used for laptops or SIM-equipped wireless PDAs.
- the total number of mobile handsets shipped out worldwide over an eight year period (1996-2003) has gradually grown over time, with a temporary leveling off during the recession that spanned from 2000 to 2002.
- the annual global mobile handset shipments surged from well under 100 million to over half a billion in 2003.
- forecasts for the year 2004 predicted annual global shipments ranging from 600 million handsets up to 650 million handsets.
- the Herfindahl Index is employed.
- the Herfindahl Index equals the sums of the squares of the market shares of all competitors.
- the Herfindahl Index can be any value between 0 and 10,000, moving from a very large number of very small firms to a single monopolistic producer.
- Herfindahl indices between 1,000 and 1,800 are deemed to be moderately concentrated, and indices above 1,800 to be concentrated.
- concentration as measured by the n-firm rule or the Herfindahl Index is a strong proxy for consolidation, it does not necessarily imply strong merger and acquisition-like take-over activities. Organic growth of a few companies paired with the disappearance of other competitors is also possible, although highly unlikely as industries mature.
- a fundamental underlying concept that is employed by the present invention is the product/ industry lifecycle theory on the sales volume of a product over its lifecycle.
- the initial growth phase of an industry is characterized by low volumes of shipments/sales of product but changes in volume over periods of time that are high. Over time, volumes of product sold/shipped per period of time rise but the increase in shipments/sales from period to period decreases. When the market matures, the volumes of product sold/shipped start to decline, i.e. the increase has turned into a decrease. In the end, the product is discontinued when the volume approaches zero.
- the above described demand view can be combined with a supply side view (industry concentration) as will be described later.
- supply side view the observation is that as an industry matures it tends to concentrate, i.e. fewer companies are controlling an increasing market share.
- demand predictions are more reliable than predictions on industry concentration.
- supply side the industry concentration (supply side) is expected to increase and vice versa.
- FIG. 6 wherein the yearly change in the growth rate or shipment of mobile handsets shown in FIG. 3 is plotted versus the yearly change in the Herfindahl Index shown in FIG. 5.
- a number of questions are presented to the market experts or officials. Some questions regard major trends in the industry while other questions regard minor trends.
- the questions can be separated into seven distinct classes: 1) question related to the supply aspect of the market, 2) questions related to the demand aspect of the market and corresponding to the change of shipments/x-axis of the charts of FIGS. 6 and 7, 3) questions related to the structure/competition of the market and corresponding to the change of Herfindahl Index/y-axis of the charts of FIGS. 6 and 7, 4) questions related to infrastructure, 5) questions related to regulatory policies, 6) question regarding the likelihood of the market entering one of the four scenarios in the future and 7) questions regarding attributes of the interviewees.
- the questions are presented to the market experts and officials and they answer them to the best of their knowledge. As shown in FIGS. 8A-B, there are 38 questions asked to resolve the general question "which market structure do you expect in five years in the interviewee's industry?". In addition, there are 22 questions asked to resolve the general question "Which demand behavior do you expect in five years in the interviewee's industry?” The 60 questions are divided into 30 pairs of question, wherein one question in each pair reflects a positive scenario for the industry while the other question reflects a negative scenario for the industry. The answers are assigned a point value ranging from +3 to +1, wherein for both positive and negative scenario questions +3 denotes very likely, +2 denotes likely, +1 denotes could be. However, as described below, a positive question value will affect the future point in one direction while a negative question value will affect the future point in an opposite direction.
- the interviewee is asked to choose which of six market developments is expected to be the primary cause for consolidation in the industry (FIG. 8A).
- the interviewee is asked to choose which of six risk factors is the most significant for the development of demand in the industry (FIG. 8B).
- the interviewee is also asked to grade 12 value added services as to their likelihood that they will be used in more than 10 percent of households in five years time (FIG. 8B). Such grading is from 1 to 6, wherein a grade of "1" represents an answer of "definitely not” and a grade of "6" represents an answer of "very likely.”
- the interview is also asked about what measures need to be taken by the interviewee's company to achieve the "Gold Rush” scenario in five years. Furthermore, the interviewee, is asked to characterize his or her company by size and by type of company. (FIG. 8C).
- W Few (number of) providers
- V Many (number of) providers
- B (Demand for) Basic services
- M (Demand for) Multimedia services.
- W Few (number of) providers
- V Many (number of) providers
- B (Demand for) Basic services
- M (Demand for) Multimedia services.
- W Few (number of) providers
- V Many (number of) providers
- B (Demand for) Basic services
- M (Demand for) Multimedia services.
- W Few (number of) providers
- V Many (number of) providers
- B (Demand for) Basic services
- M (Demand for) Multimedia services.
- An answer that is assigned the directional value B means that the answer causes the future point to move leftward within the 2x2 matrix.
- An answer that is assigned the directional value M means that the answer causes the future point to move rightward within the 2x2 matrix.
- q nxi the value (1, 2, 3, 4, 5, 6) of the ith question given to the nth interviewee, wherein the ith question has been categorized as either a B or M type question
- the data points (X n (t), Y n (t)) associated with the interviewees can be plotted in a 2 x 2 matrix similar to that shown in FIG. 7, except that the scenarios have been reversed in position.
- One possibility for analyzing the results is to plot the point (X(t), Y(t)) in the 2x2 matrix as prediction of a future scenario for the industry.
- Another possibility for analyzing the results is to assign each of the points of the interviewees to the country to which the company of the interviewee is associated. For example, FIG. 11A shows the case where the results are categorized by the Middle Eastern countries in which the companies of the interviewees are based.
- the results can be further simplified by averaging the data points of FIG. 11A associated with each country as shown in FIG. 11B.
- the results can be categorized by geographical regions such as those shown in FIG. 11C.
- the results can be further simplified by averaging the data points of FIG. 11D associated with each region.
- each of the points of the interviewees is assigned to the type of supplier to which the company of the interviewee is associated as shown in FIG. 1 IE.
- the results can be further simplified by averaging the data points of FIG. 11 E as shown in FIG. 11F.
- each of the points of the interviewees is assigned to the number of employees of the company of the interviewee is associated as shown in FIG. 11G.
- the results can be further simplified by averaging the data points of FIG. 11G as shown in FIG. 11H.
- FIGS. 11A-H provide information regarding the future of the mobile handset industry in the year 2008 in the Middle East.
- FIGS. 11B and 11D indicate that the mobile handset market for a majority of Middle Eastern countries will be in the so-called "Gold Rush" scenario mentioned previously. Also, most types of mobile handset suppliers and sizes of handset companies will be in the Gold Rush scenario in the year 2008 per FIGS. 11F and 11H.
- a 2x2 matrix is generated which defines the four scenarios “Paradise Lost,” “Gold Rush,” “Wars of Attrition” and “Gilded Cage” and is applicable for a future point of time.
- the 2x2 matrix of FIGS. 11A-H does not provide any specific predictions regarding values of market parameters, such as industry concentration and number of units sold/made, for an industry.
- the methodology of FIGS. 1-7 does generate a 2x2 matrix with market parameters. While the two methodologies use different data, they still are able to generate a 2x2 matrix that defines the same four scenarios that describes an industry. Therefore, there is a relationship between the two methodologies. For example, a number of the questions listed in FIGS.
- FIGS. 8A-C are related to the industry parameters of industry concentration and number of units sold/made. Reducing the number of questions used in the methodology of FIGS. 8-11 so as to use questions related to the past measured parameters used in the methodology of FIGS. 1-7 can be a way to obtain the future value X(t), Y(t) for the same parameters. Besides reducing the number of questions, the two parameters used in the methodology of FIGS. 1-7 can be increased in number so as to provide better correlation with the methodology of FIGS. 8-11.
- a plurality of future points ((X(t 1 ), Y(t 1 )), (X(t 2 ), Y(t 2 ), .. .) can be generated by performing the questionnaire of FIGS. 8A-C at multiple times in time, such as every five years. For each year that the questionnaire is performed, the corresponding point is determined for the 2x2 matrix of FIG. 7. From the plurality of future points generated from the questionnaire and the corresponding points, a mathematical relationship can be established between the points. With the mathematical relationship determined, the future point (X(t), Y(t)) generated per FIGS. 8-11 can then be converted to a future point that can be added to the 2x2 matrix of FIG.
- FIG. 13 schematically shows an industry scenario mapping tool 200 that includes an industry scenario mapping processor 202 that includes a microprocessor 204 electrically connected to a memory 206.
- the memory 206 has a structure so as to store and implement an industry scenario mapping program which includes several databases.
- One database includes the previously mentioned market data of the past and another database includes the data associated with the interview questions used to generate the future market data.
- the data associated with the interview questions include the questions, the answers, and the values for the answers.
- the microprocessor 204 has a structure so as to contain and run software for the industry scenario mapping program which generates 2x2 matrices like that of FIG.
- the microprocessor 204 may also contain software to conform the matrices of FIGS. 7 and 11A-H by reducing the number of questions used in the methodology of FIGS. 8-11, increasing the parameters used in the methodology of FIGS. 1-7 or determining the relationship between the two methodologies of FIGS. 7-11 by looking a plurality of future points in the manner described previously.
- Data is input indirectly into the microprocessor 204 via an input device 208.
- input devices 208 are a keyboard, a microphone, a touch screen or a mouse that are part of computer hardware system, such as a laptop computer 209.
- a display 210 and a printer 212 can be electrically connected to or form part of the computer hardware system.
- the laptop computer 209 may be connected to the off-site industry scenario mapping processor 202 via the Internet 213.
- the processor 202 receives data from the laptop computer 209, processes the received data via the microprocessor 204 and memory 206.
- the data can be processed at a location different than the location of the laptop computer 209. This allows for flexibility in conducting the evaluation process.
- laptop computer 209 can be taken to an interview by the interviewer. At the interview, the interviewer asks the various questions and enters the answers. The interviewer can evaluate the answers directly on the laptop computer 209 or the results can be sent offsite to the offsite processor 204 via the internet 213 where they can be evaluated.
- the industry scenario mapping program takes the data and places the data in the database in memory 206.
- the contents of the database can be observed via the visual display 210 or can be printed out via the printer 212.
- the visual display 210 can also generate images corresponding to one or both of the 2 x 2 matrices of FIGS. 7 and 12 or their like, wherein the calculated industry wide future data point is displayed. Note that when either 2 x 2 matrix is displayed, the matrix acts as an advice screen in that a user can obtain implicit advice from the image. In the case of displaying a 2x2 matrix similar to that of FIG. 7, the viewer will understand that the matrix provides a graphical illustration of the past data.
- the matrix shows the high volatility of the mobile handset industry, regarding both the changes in demand and supply structures as well as their correlation.
- the matrix suggests that the previously described product/ industry lifecycle theory on the sales volume of a product over its lifecycle holds true. This finding can now be applied by e.g. mobile handset suppliers for their own planning. For instance, if future demand is expected to strongly decline, an increase in market concentration is likely. This has tremendous implications for mobile handset suppliers. In such case, the price for mobile handsets is very likely to decline and the cost pressure to increase. This in turn has further implications on how to set-up the user's mobile handset business for the future.
- the display of a 2 ⁇ 2 matrix similar to that shown in FIG. 12 implicitly provides advice to the user. For example, based on the past and future data points displayed in the FIG. 12, the user can determine if there are any industry wide trends that will occur in the next five years (the year 2008 in FIG. 12). For example, the expectation for the year 2008 per FIG. 12 is that there will be a change (increase) in global demand (x-axis/ global shipments) of around 25 to 30 percent compared to 2003 (20 percent). As a result, the industry concentration is predicted to decrease by about 15 percent in 2008 whereas it had been at below 5 percent in 2003. A more extreme and forward looking piece of implicit advice would be e.g. that the industry concentration will strongly increase (again) if the global increase in the demand for mobile handsets year over-year should decrease towards less than 15 percent or below
- the advice screen shows the data of FIG. 12 and that the year is 2003. What does the information of the 2 x 2 matrix of FIG. 12 tell the user in the year 2003?
- the screen shows that the industry has recently entered into the "Paradise Lost” scenario and that the 2008 prediction (calculated per the questionnaire process of FIGS. 8-11) is that the industry will drive further into the "Paradise Lost” scenario.
- the 2 x 2 matrix can also give the user advice beyond the five year range mentioned above. For example, assume that it is predicted that by the year 2010, device shipments will reach almost one billion units worldwide targeting a global market of more than 2 billion users. Within this time frame, the current emerging markets should begin to mature, with corresponding lower growth rates of handset shipments and lower net subscriber additions. Although global growth rates are expected to slow, the overall market will be enormous. Based on the above knowledge, a brisk "War of Attrition" may be the likely outcome in the year 2010 or so (see FIG. 15), in which slow industry growth and consumer demand lead to concentration and - ultimately - consolidation.
- the system 200 via the advice screen showing the 2 x 2 matrix can show where an industry has been in the past and where it is going in the future. Furthermore, the advice screen implicitly provides suggestions on how an organization can take advantage of the future scenario by knowing of future trends and what type of market that the organization is a member.
- the present invention provides a multidimensional (see FIG. 7), multiindicator (see questions and their measured underlying values with respect to the questionnaire of FIG. 8) and multidirectional (past/future) tool that is highly illustrative for describing industry trends. Based on an extensive set of indicators per the questionnaire methodology of FIGS. 8-11, it provides a holistic view on industry development. By leveraging two research sources (statistical evidence and data obtained through interviews), the tool is powerful in forecasting markets.
- the present invention provides a unique way to define the dimensions that define the four scenarios mentioned previously. Furthermore, the present invention provides a unique way to generate the four scenarios. In general, the present invention provides a unique approach of developing different dimensions to define different scenarios via the use of combinations of different market values.
- an industry specific questionnaire is mostly non quantitative but rather based on the expectations of a selected survey group.
- quantitative demand and supply figures are used - both past data and future predictions.
- the variation in the concentration on the supply side and in the change of demand defines the scenarios in this variant.
- the invention may be embodied in other forms than those specifically disclosed herein without departing from its spirit or essential characteristics.
- the process can be applied to other industries and can be applied to different types of markets, such as regional and national markets.
- market factors such as change in shipping and change in concentration, which can be used to map the four scenarios of FIG. 7.
- the described embodiments are to be considered in all respects only as illustrative and not restrictive, and the scope of the invention is commensurate with the appended claims rather than the foregoing description.
Landscapes
- Business, Economics & Management (AREA)
- Engineering & Computer Science (AREA)
- Economics (AREA)
- Entrepreneurship & Innovation (AREA)
- Human Resources & Organizations (AREA)
- Marketing (AREA)
- Operations Research (AREA)
- Quality & Reliability (AREA)
- Strategic Management (AREA)
- Tourism & Hospitality (AREA)
- Physics & Mathematics (AREA)
- General Business, Economics & Management (AREA)
- General Physics & Mathematics (AREA)
- Theoretical Computer Science (AREA)
- Management, Administration, Business Operations System, And Electronic Commerce (AREA)
Abstract
Description
- The present invention relates to devices and processes that evaluate industry scenarios in the past and/or generate industry scenarios for the future.
- History often presents lessons on how to avoid certain predicaments as well as on how to succeed. This is true in personal matters, governmental matters and in specific industries. In the case of a specific industry, it is often a problem for an observer to grasp what factors in an industry, such as the mobile handset industry, are important enough to affect how the industry operates at different points in time.
- Even when important factors are identified which drive an industry, it is often difficult to forecast how an industry will develop in the future, say in the next 5 to 10 years. Obviously, a company having the ability to predict future trends in its own industry provides that company many advantages on how to prepare for the future in a way that is most advantageous to the company. In the past, market research has described industry structure by data tables or by two dimensional, two indicators based graphs. Scenario analyses are also a common tool to make predictions about future industry trends and developments. Unfortunately, such market research and scenario analyses were not a reliable way to predict future trends in a particular industry.
- One aspect of the present invention regards an industry scenario mapping tool that includes a processor and a visual display electrically connected to the processor, wherein the processor prepares an advice screen to be shown on the visual display. The advice screen displays a 2 x 2 matrix representing four scenario regions and containing a graph plotting two market factors that can be used to show a market scenario in which an industry fits during a particular time period.
- A second aspect of the present invention regards a method of determining a future market scenario for an industry that includes obtaining subjective data from experts in an industry, combining the subjective data and determining from the combined subjective data which market scenario will apply to the industry in the future.
- A third aspect of the present invention regards an industry scenario mapping tool that includes a processor and a memory in communication with the processor. The memory has a structure so as to store and implement a program in conjunction with the processor so as to: 1) combine subjective data stored in the memory that has been obtained from experts in an industry and 2) determine from the combined subjective data which market scenario will apply to the industry in the future.
A fourth aspect of the present invention regards a method of determining a market scenario for an industry by obtaining at least two types of market data regarding an industry and determining from the at least two types of market data a market scenario from four scenarios: "Paradise Lost," "Gold Rush," "Wars of Attrition" and "Gilded Cage". - FIG. 1 schematically shows an embodiment of a scenario mapping process in accordance with the present invention;
- FIG. 2 shows a graph illustrating the amounts of mobile handsets shipped throughout the world during an eight year period;
- FIG. 3 shows a graph illustrating the growth rate of the mobile handset industry during an eight year period;
- FIG. 4 shows a graph illustrating the market concentration in the mobile handset industry during an eight year period;
- FIG. 5 shows a graph illustrating the change in market concentration in the mobile handset industry during an eight year period;
- FIG. 6 shows a graph illustrating the change of shipments of mobile handsets shipped throughout the world and the change in market concentration during an eight year period;
- FIG. 7 shows the graph of FIG. 6 wherein four industry scenarios have been identified;
- FIGS. 8A-C show a sample of a questionnaire that is used to pose questions to interviewees;
- FIGS. 9A-H shows a summary of answers given to the questions of the questionnaire of FIGS. 8A-C;
- FIGS. 10A-C show a sample of an analysis guide for the questionnaire questions of the questionnaire of FIGS. 8A-C that will be posed to interviewees to generate future market data in accordance with the present invention;
- FIGS. 11A-H show various 2x2 matrices that show various expectations for participants answering the questionnaire of FIGS. 8A-C;
- FIG. 12 shows the graph of FIG. 7 wherein a future industry data point is generated in accordance with the present invention and added to the graph;
- FIG. 13 shows an embodiment of an industry scenario mapping tool in accordance with the present invention;
- FIG. 14 shows the graph of FIG. 12 wherein a future market scenario is predicted from the display of the graph of FIG. 12 on a display of the industry scenario mapping tool of FIG. 13; and
- FIG. 15 shows the graph of FIG. 12 wherein a second future market scenario is predicted from the display of the graph of FIG. 12 on a display of the industry scenario mapping tool of FIG. 13.
- As schematically shown in FIG. 1, an embodiment of an industry
scenario mapping process 100 in accordance with the present invention generally entails three process: 1) analyze past market data from an industry ofinterest 110, 2) analyze present attitudes and expectations in the industry ofinterest 120 and 3) combine the data garnered from items 1) and 2) mentioned above so as to generate a visual map of how the industry of interest will look in thefuture 130. - Regarding the
first process 110, raw market data from the industry is analyzed to determine if there is a historical relationship between one market parameter and one or more other market parameters. Examples of market parameters that can be analyzed are supply, sales, industry concentration, demand behavior and government/industry regulation. Determining what particular parameters to study first depends on understanding the characteristics of the industry. For example, the parameters to be analyzed for a relatively young industry, such as the mobile handset industry, may be totally different than the parameters to be analyzed for a well established industry, such as the automobile industry. The analysis of the data preferably is over a range of years, such as eight years, so that statistically significant data can be analyzed. - In the case of the mobile handset industry, it is a relatively young industry. The question at hand is whether it is gravitating to becoming a mature industry and if so when will it achieve that milestone. To approximate the maturity of a young industry, such as the mobile handset industry, growth is a key indicator. If growth can be observed, the industry is likely to be in a developing stage. A slowdown of growth or even stagnation suggests a maturing industry. When an industry shrinks considerably for several periods, it is probably already beyond its maturity phase. Therefore, growth is an indispensable indicator to analyze the mobile handset industry.
- One measure of growth in the mobile handset industry is the amount of mobile handsets shipped from the factory each year, wherein a mobile handset is defined as any portable device that is equipped with a SIM card, such as mobile phones, data cards used for laptops or SIM-equipped wireless PDAs.
- As shown in FIG. 2, the total number of mobile handsets shipped out worldwide over an eight year period (1996-2003) has gradually grown over time, with a temporary leveling off during the recession that spanned from 2000 to 2002. Within the eight year time period, the annual global mobile handset shipments surged from well under 100 million to over half a billion in 2003. During the
year 2003, forecasts for theyear 2004 predicted annual global shipments ranging from 600 million handsets up to 650 million handsets. - As shown in FIG. 3, after several years with growth rates of over 50 percent, the mobile handset industry came to an abrupt halt in 2001 when the market shrank slightly compared to 2000. While growth in the industry continues today, the fact that the rate of growth has declined when compared to the years 1996-1999 (ranging from 58% to 69% year-to-year change) indicates that the industry is maturing.
- Besides growth, another market factor that is of interest when studying the mobile handset industry is market share. Longitudinal studies provide strong evidence that new industries are fragmented, and that they tend toward consolidation as they mature with time. The most important measures of consolidation in an industry are the n-firm market share and the Herfindahl Index. The former represents the combined market share of the n-largest companies within any given market. Although a valuable indicator for the degree of concentration of an industry, it lacks differentiation to reflect the size of the n-largest firms fairly. For instance, in the case where n=3 and the biggest company controls 80 percent and the second and third largest firms each
control 5 percent, the 3-firm indicator will be 90 percent (80 percent + 5 percent + 5 percent). However, when the three largest firms each control 30 percent of the market, the 3-firm indicator has the same value of 90 percent (30 percent + 30 percent + 30 percent). Thus, the n-firm market share does not take into account the different market shares between the n firms. - To take into account the different market shares of the n-largest firms better, the Herfindahl Index is employed. The Herfindahl Index equals the sums of the squares of the market shares of all competitors. Hence, the Herfindahl Index can be any value between 0 and 10,000, moving from a very large number of very small firms to a single monopolistic producer. In general, Herfindahl indices between 1,000 and 1,800 are deemed to be moderately concentrated, and indices above 1,800 to be concentrated. Although concentration as measured by the n-firm rule or the Herfindahl Index is a strong proxy for consolidation, it does not necessarily imply strong merger and acquisition-like take-over activities. Organic growth of a few companies paired with the disappearance of other competitors is also possible, although highly unlikely as industries mature.
- In the case of the mobile handset industry, historic data shows changing concentration levels over the years 1996-2003. As shown in FIG. 4, the Herfindahl Index alternated between about 1,200 and 1,800 between 1996 and 2003. After an initial decline in concentration from 1995 to 1998, the mobile handset industry concentrated from 1999 to 2002, to peak in 2001. From 2003 to 2004, the market again became less concentrated. This range is achieved by strong year-over-year changes of the mobile handset industry concentration as shown in FIG. 5.
- Having identified the parameters of industry concentration and number of shipments as being of interest, there is a pattern between combined growth, in terms of year-over-year change in global shipments, and concentration of market share, in terms of year-over-year change in the Herfindahl Index. In particular, a fundamental underlying concept that is employed by the present invention is the product/ industry lifecycle theory on the sales volume of a product over its lifecycle. In this theory, the initial growth phase of an industry is characterized by low volumes of shipments/sales of product but changes in volume over periods of time that are high. Over time, volumes of product sold/shipped per period of time rise but the increase in shipments/sales from period to period decreases. When the market matures, the volumes of product sold/shipped start to decline, i.e. the increase has turned into a decrease. In the end, the product is discontinued when the volume approaches zero.
- The above described demand view can be combined with a supply side view (industry concentration) as will be described later. In the supply side view, the observation is that as an industry matures it tends to concentrate, i.e. fewer companies are controlling an increasing market share. Typically, demand predictions are more reliable than predictions on industry concentration. Thus, when the demand is expected to decrease, the industry concentration (supply side) is expected to increase and vice versa.
- With the above theories in mind, strong changes in shipment growth seem to be linked to weak changes in concentration of market share and vice versa. This is illustrated in FIG. 6 wherein the yearly change in the growth rate or shipment of mobile handsets shown in FIG. 3 is plotted versus the yearly change in the Herfindahl Index shown in FIG. 5.
- A summarization of the eight year span from 1996 to 2003 is shown in FIG. 6. Starting in 1996, strong shipment growth of over 50 percent went along with a substantial decrease in market concentration, even as the Herfindahl Index declined by over 20 percent. The strong growth continued until about 1999, albeit already paired with a smaller decline of market concentration. After 2000, a year without many changes in terms of shipments and concentration, the mobile handset industry became strongly concentrated in 2001 and 2002, as growth came to a halt as the market shrank slightly. As soon as substantial growth returned to the industry in 2003, concentration declined almost immediately. Based on information as of 2003, using techniques per the present invention the concentration for the
year 2004 was expected to strengthen and it in fact did strengthen. - Four scenarios seem to be theoretically possible for the mobile handset industry. The four scenarios are: 1) "Gilded Cage" where there is very strong market concentration paired with growth - only possible in a regulated environment or short-term transition phase, 2) "Gold Rush" where there is hyper-growth and strong decline of industry concentration, 3) "Paradise Lost" wherein there is steady growth (globally) paired with convergence and 4) "Wars of Attrition" wherein there is little growth or stagnation of demand which results in concentration and, ultimately, industry consolidation. With the above definitions in mind, the plot of FIG. 6 can be divided into four sectors as shown in FIG. 7. The mobile handset industry for a particular year is characterized by the scenario associated with the quadrant that contains the data point for that particular year.
- The "Gilded Cage" and "Gold Rush" scenarios assume a very strong-to hyper-growth environment. Under normal circumstances, a fragmented market should develop very quickly as many new competitors enter the market to participate in the "Gold Rush" and to benefit from extraordinary growth. This could be observed from 1996 onwards, with growth rates exceeding 50 percent annually. A "Gilded Cage" scenario with similar growth rates could only be possible for a very short time period, either as a transition phase or in a monopolistic environment based on strict industry regulations that foster monopolistic competition and serve as a strong barrier to entry.
- If growth is less, excessive, or even limited, the "Paradise Lost" and "Wars of Attrition" scenarios should reflect the overall industry mechanism. Strong concentration and merger endgames are likely to pick up quickly if market demand slows down or even shrinks. After all, one company's substantial market share increase works to the detriment of its competitors. Mergers and acquisitions should result in an industry shake out. This is the long-term scenario that should hold true for any industry. However, over the short- to mid-term period, large incumbent players may find that their former paradise has been lost to plenty of new market entrants. Such a constellation is likely in an environment where innovations change the rules of competition or the industry as a whole.
- The above discussion shows how charting certain market data can lead to the characterization of a market of interest, such as the mobile handset market, for one or more years in the past. Applicants have determined that the market of interest can be characterized in the future as well. This is accomplished by obtaining subjective data from experts in the market or industry in question, such as the mobile handset market, and officials of a representative number of companies that establish the market in question. Such group of experts would be selected like those used in a Delphi type of analysis. The subjective data is then combined so that it can be determined which of the four scenarios "Paradise Lost," "Gold Rush," "Wars of Attrition" and "Gilded Cage" will apply to the market/industry in the future.
- As shown in FIGS. 8A-C, a number of questions are presented to the market experts or officials. Some questions regard major trends in the industry while other questions regard minor trends. The questions can be separated into seven distinct classes: 1) question related to the supply aspect of the market, 2) questions related to the demand aspect of the market and corresponding to the change of shipments/x-axis of the charts of FIGS. 6 and 7, 3) questions related to the structure/competition of the market and corresponding to the change of Herfindahl Index/y-axis of the charts of FIGS. 6 and 7, 4) questions related to infrastructure, 5) questions related to regulatory policies, 6) question regarding the likelihood of the market entering one of the four scenarios in the future and 7) questions regarding attributes of the interviewees.
- The questions are presented to the market experts and officials and they answer them to the best of their knowledge. As shown in FIGS. 8A-B, there are 38 questions asked to resolve the general question "which market structure do you expect in five years in the interviewee's industry?". In addition, there are 22 questions asked to resolve the general question "Which demand behavior do you expect in five years in the interviewee's industry?" The 60 questions are divided into 30 pairs of question, wherein one question in each pair reflects a positive scenario for the industry while the other question reflects a negative scenario for the industry. The answers are assigned a point value ranging from +3 to +1, wherein for both positive and negative scenario questions +3 denotes very likely, +2 denotes likely, +1 denotes could be. However, as described below, a positive question value will affect the future point in one direction while a negative question value will affect the future point in an opposite direction.
- Next, the interviewee is asked to choose which of six market developments is expected to be the primary cause for consolidation in the industry (FIG. 8A). In addition, the interviewee is asked to choose which of six risk factors is the most significant for the development of demand in the industry (FIG. 8B).
- The interviewee is also asked to
grade 12 value added services as to their likelihood that they will be used in more than 10 percent of households in five years time (FIG. 8B). Such grading is from 1 to 6, wherein a grade of "1" represents an answer of "definitely not" and a grade of "6" represents an answer of "very likely." - The interviewee is asked to predict the likelihood for each of the four scenarios shown in FIG. 7 that it will prevail in five year time. The prediction is done on a scale of 1 to 3, wherein "1" represents an answer of "could be" and "3" represents the answer of "very likely." (FIG. 8C)
- The interview is also asked about what measures need to be taken by the interviewee's company to achieve the "Gold Rush" scenario in five years. Furthermore, the interviewee, is asked to characterize his or her company by size and by type of company. (FIG. 8C).
- After the answers are completed, they can be grouped in accordance with the seven distinct classes mentioned previously: 1) question related to the supply aspect of the market (FIG. 9A), 2) questions related to the demand aspect of the market (FIGS. 9B-C), 3) questions related to the structure/competition of the market (FIG. 9D), 4) questions related to infrastructure (FIG. 9E), 5) questions related to regulatory policies (FIG. 9F), 6) question regarding the likelihood of the market entering one of the four scenarios in the future (FIG. 9G) and 7) questions regarding attributes of the interviewees (FIG. H). Such grouping can include the number of interviewees answering a question and the mean value of their answer.
- Note that the 88 questions and answers presented in
items 1a-3a of FIGS. 8A-C and 9A-G can be categorized as to how they move the future data point, either vertically or horizontally, within the 2x2 matrix. This categorization is presented in FIGS. 10A-C wherein for each of the 88 answers a directional value is assigned, such as W = Few (number of) providers, V = Many (number of) providers, B = (Demand for) Basic services and M = (Demand for) Multimedia services. In general, an answer that is assigned the directional value W means that the answer causes the future point to move downward within the 2x2 matrix. An answer that is assigned the directional value V means that the answer causes the future point to move upward within the 2x2 matrix. An answer that is assigned the directional value B means that the answer causes the future point to move leftward within the 2x2 matrix. An answer that is assigned the directional value M means that the answer causes the future point to move rightward within the 2x2 matrix. Thus, forty four of the questions are dedicated to the x-axis of the 2x2 matrix while the other forty four questions are dedicated to the y-axis of the 2x2 matrix. - After the 88 answers for the questions of 1a-3a are completed for each of the interviewees, then the following Xn(t), Yn(t) coordinates of a data point in the 2x2 matrix are determined for each interviewee n = 1, 2, 3, ... NTOT, wherein NTOT is the total number of interviewees:

Wherein qnxi = the value (1, 2, 3, 4, 5, 6) of the ith question given to the nth interviewee, wherein the ith question has been categorized as either a B or M type question;
qnyj = the value (1, 2, 3, 4, 5, 6) of the jth question given to the nth interviewee, wherein the jth question has been categorized as either a W or V type question;
i =1,2,3, ... Nx
j =1,2,3,...Ny
Nx = total number of questions categorized as either a B or M type question;
Ny = total number of questions categorized as either a W or V type question;
N = Nx + Ny = total number of questions categorized as either a B, M, W or V type question.
The data point (X(t), Y(t)) associated with the industry of the experts is then calculated as follows:
- The data points (Xn(t), Yn(t)) associated with the interviewees can be plotted in a 2 x 2 matrix similar to that shown in FIG. 7, except that the scenarios have been reversed in position. One possibility for analyzing the results is to plot the point (X(t), Y(t)) in the 2x2 matrix as prediction of a future scenario for the industry. Another possibility for analyzing the results is to assign each of the points of the interviewees to the country to which the company of the interviewee is associated. For example, FIG. 11A shows the case where the results are categorized by the Middle Eastern countries in which the companies of the interviewees are based. The results can be further simplified by averaging the data points of FIG. 11A associated with each country as shown in FIG. 11B.
- The results can be categorized by geographical regions such as those shown in FIG. 11C. The results can be further simplified by averaging the data points of FIG. 11D associated with each region.
- In another version, each of the points of the interviewees is assigned to the type of supplier to which the company of the interviewee is associated as shown in FIG. 1 IE. The results can be further simplified by averaging the data points of FIG. 11 E as shown in FIG. 11F.
- In another version, each of the points of the interviewees is assigned to the number of employees of the company of the interviewee is associated as shown in FIG. 11G. The results can be further simplified by averaging the data points of FIG. 11G as shown in FIG. 11H.
- As shown by the questions of
items year 2003, then the 2x2 matrices of FIGS. 11A-H provide information regarding the future of the mobile handset industry in theyear 2008 in the Middle East. For example, it appears that FIGS. 11B and 11D indicate that the mobile handset market for a majority of Middle Eastern countries will be in the so-called "Gold Rush" scenario mentioned previously. Also, most types of mobile handset suppliers and sizes of handset companies will be in the Gold Rush scenario in theyear 2008 per FIGS. 11F and 11H. - In the methodology of FIGS. 8-11, a 2x2 matrix is generated which defines the four scenarios "Paradise Lost," "Gold Rush," "Wars of Attrition" and "Gilded Cage" and is applicable for a future point of time. However, the 2x2 matrix of FIGS. 11A-H does not provide any specific predictions regarding values of market parameters, such as industry concentration and number of units sold/made, for an industry. In contrast, the methodology of FIGS. 1-7 does generate a 2x2 matrix with market parameters. While the two methodologies use different data, they still are able to generate a 2x2 matrix that defines the same four scenarios that describes an industry. Therefore, there is a relationship between the two methodologies. For example, a number of the questions listed in FIGS. 8A-C are related to the industry parameters of industry concentration and number of units sold/made. Reducing the number of questions used in the methodology of FIGS. 8-11 so as to use questions related to the past measured parameters used in the methodology of FIGS. 1-7 can be a way to obtain the future value X(t), Y(t) for the same parameters. Besides reducing the number of questions, the two parameters used in the methodology of FIGS. 1-7 can be increased in number so as to provide better correlation with the methodology of FIGS. 8-11.
- The relationship between the two methodologies can be determined in another way. In particular, a plurality of future points ((X(t1), Y(t1)), (X(t2), Y(t2), .. .) can be generated by performing the questionnaire of FIGS. 8A-C at multiple times in time, such as every five years. For each year that the questionnaire is performed, the corresponding point is determined for the 2x2 matrix of FIG. 7. From the plurality of future points generated from the questionnaire and the corresponding points, a mathematical relationship can be established between the points. With the mathematical relationship determined, the future point (X(t), Y(t)) generated per FIGS. 8-11 can then be converted to a future point that can be added to the 2x2 matrix of FIG. 7 and added to the plot shown in FIG. 12. As shown in FIG. 12, there is an expected future decrease in demand (in this case for mobile devices). Following the rationale and assumed underlying correlation as described above, such a decrease in demand is predicted to result in an increased industry concentration (supply side).
- With the above process in mind, there are a number of ways of implementing the process. For example, an embodiment of the present invention is shown in FIG. 13 in which schematically shows an industry
scenario mapping tool 200 that includes an industryscenario mapping processor 202 that includes amicroprocessor 204 electrically connected to amemory 206. Thememory 206 has a structure so as to store and implement an industry scenario mapping program which includes several databases. One database includes the previously mentioned market data of the past and another database includes the data associated with the interview questions used to generate the future market data. The data associated with the interview questions include the questions, the answers, and the values for the answers. Themicroprocessor 204 has a structure so as to contain and run software for the industry scenario mapping program which generates 2x2 matrices like that of FIG. 7 and the individual interviewee/company data points and the single industry wide future data point mentioned previously with respect to FIGS. 8-12. Themicroprocessor 204 may also contain software to conform the matrices of FIGS. 7 and 11A-H by reducing the number of questions used in the methodology of FIGS. 8-11, increasing the parameters used in the methodology of FIGS. 1-7 or determining the relationship between the two methodologies of FIGS. 7-11 by looking a plurality of future points in the manner described previously. - Data is input indirectly into the
microprocessor 204 via aninput device 208. Examples ofpossible input devices 208 are a keyboard, a microphone, a touch screen or a mouse that are part of computer hardware system, such as alaptop computer 209. Adisplay 210 and aprinter 212 can be electrically connected to or form part of the computer hardware system. - As shown in FIG. 13, the
laptop computer 209 may be connected to the off-site industryscenario mapping processor 202 via theInternet 213. In such a scenario, theprocessor 202 receives data from thelaptop computer 209, processes the received data via themicroprocessor 204 andmemory 206. Thus, the data can be processed at a location different than the location of thelaptop computer 209. This allows for flexibility in conducting the evaluation process. - Of course, it is possible to have a microprocessor and memory act of the
laptop computer 209 have the same functionality as themicroprocessor 204 andmemory 206 so as to process the data by itself so that data does not need to be sent to the off-site processor 202. In this embodiment,laptop computer 209 can be taken to an interview by the interviewer. At the interview, the interviewer asks the various questions and enters the answers. The interviewer can evaluate the answers directly on thelaptop computer 209 or the results can be sent offsite to theoffsite processor 204 via theinternet 213 where they can be evaluated. - In general, once data, such as past market data or the answers to the interview questions, is input into the
microprocessor 204, the industry scenario mapping program takes the data and places the data in the database inmemory 206. The contents of the database can be observed via thevisual display 210 or can be printed out via theprinter 212. Thevisual display 210 can also generate images corresponding to one or both of the 2 x 2 matrices of FIGS. 7 and 12 or their like, wherein the calculated industry wide future data point is displayed. Note that when either 2 x 2 matrix is displayed, the matrix acts as an advice screen in that a user can obtain implicit advice from the image. In the case of displaying a 2x2 matrix similar to that of FIG. 7, the viewer will understand that the matrix provides a graphical illustration of the past data. In the case of the mobile handset industry matrix of FIG. 7, the matrix shows the high volatility of the mobile handset industry, regarding both the changes in demand and supply structures as well as their correlation. The matrix suggests that the previously described product/ industry lifecycle theory on the sales volume of a product over its lifecycle holds true. This finding can now be applied by e.g. mobile handset suppliers for their own planning. For instance, if future demand is expected to strongly decline, an increase in market concentration is likely. This has tremendous implications for mobile handset suppliers. In such case, the price for mobile handsets is very likely to decline and the cost pressure to increase. This in turn has further implications on how to set-up the user's mobile handset business for the future. - As mentioned previously, the display of a 2×2 matrix similar to that shown in FIG. 12 implicitly provides advice to the user. For example, based on the past and future data points displayed in the FIG. 12, the user can determine if there are any industry wide trends that will occur in the next five years (the
year 2008 in FIG. 12). For example, the expectation for theyear 2008 per FIG. 12 is that there will be a change (increase) in global demand (x-axis/ global shipments) of around 25 to 30 percent compared to 2003 (20 percent). As a result, the industry concentration is predicted to decrease by about 15 percent in 2008 whereas it had been at below 5 percent in 2003. A more extreme and forward looking piece of implicit advice would be e.g. that the industry concentration will strongly increase (again) if the global increase in the demand for mobile handsets year over-year should decrease towards less than 15 percent or below - Let's assume that the advice screen shows the data of FIG. 12 and that the year is 2003. What does the information of the 2 x 2 matrix of FIG. 12 tell the user in the
year 2003? The screen shows that the industry has recently entered into the "Paradise Lost" scenario and that the 2008 prediction (calculated per the questionnaire process of FIGS. 8-11) is that the industry will drive further into the "Paradise Lost" scenario. As mentioned previously, this means that the industry is encountering steady global growth paired with convergence in concentration in the industry. These are the signs of a maturing industry. - Due to the trend from 2003 to 2008 that the industry is diving deeper into the "Paradise Lost" scenario, the scenario is apt to be in play for the next three to four years as shown in FIG. 14. With different business models and success factors, the strategic direction of a company will need to be realigned with the emerging scenario. A user whose company is based on a consumer electronics-like market will, for instance, require particularly astute customer insight capabilities to ensure adequate understanding of market demand. For a user whose company is based in a mature market like the United States or Western Europe, being on top of design and user interface trends will be key to capturing more market share with consumers.
- Armed with certain knowledge, the 2 x 2 matrix can also give the user advice beyond the five year range mentioned above. For example, assume that it is predicted that by the year 2010, device shipments will reach almost one billion units worldwide targeting a global market of more than 2 billion users. Within this time frame, the current emerging markets should begin to mature, with corresponding lower growth rates of handset shipments and lower net subscriber additions.
Although global growth rates are expected to slow, the overall market will be enormous. Based on the above knowledge, a brisk "War of Attrition" may be the likely outcome in the year 2010 or so (see FIG. 15), in which slow industry growth and consumer demand lead to concentration and - ultimately - consolidation. - Another fact that the user may know is that by the year 2010 the 4G technology may be in place. Such technology could be the start signal for yet another realignment of the market as this new technology may impact market dynamics.
In summary, based on past market information and interview information from market experts, thesystem 200 via the advice screen showing the 2 x 2 matrix can show where an industry has been in the past and where it is going in the future. Furthermore, the advice screen implicitly provides suggestions on how an organization can take advantage of the future scenario by knowing of future trends and what type of market that the organization is a member. - In summary, the present invention provides a multidimensional (see FIG. 7), multiindicator (see questions and their measured underlying values with respect to the questionnaire of FIG. 8) and multidirectional (past/future) tool that is highly illustrative for describing industry trends. Based on an extensive set of indicators per the questionnaire methodology of FIGS. 8-11, it provides a holistic view on industry development. By leveraging two research sources (statistical evidence and data obtained through interviews), the tool is powerful in forecasting markets. The present invention provides a unique way to define the dimensions that define the four scenarios mentioned previously. Furthermore, the present invention provides a unique way to generate the four scenarios. In general, the present invention provides a unique approach of developing different dimensions to define different scenarios via the use of combinations of different market values. In one variation, an industry specific questionnaire is mostly non quantitative but rather based on the expectations of a selected survey group. In the second variation, quantitative demand and supply figures are used - both past data and future predictions. The variation in the concentration on the supply side and in the change of demand defines the scenarios in this variant.
- The invention may be embodied in other forms than those specifically disclosed herein without departing from its spirit or essential characteristics. For example, the process can be applied to other industries and can be applied to different types of markets, such as regional and national markets. In such an application, the user needs to identify market factors, such as change in shipping and change in concentration, which can be used to map the four scenarios of FIG. 7. The described embodiments are to be considered in all respects only as illustrative and not restrictive, and the scope of the invention is commensurate with the appended claims rather than the foregoing description.
Claims (24)
- An industry scenario mapping tool comprising:a processor;a visual display electrically connected to said processor, wherein said processor prepares an advice screen to be shown on said visual display, said advice screen displaying a 2 x 2 matrix representing four scenario regions and containing a graph plotting two market factors that can be used to show a market scenario in which an industry fits during a particular time period.
- The industry scenario mapping tool of claim 1, wherein said advice screen displays a data point representative of said industry at a future point in time.
- The industry scenario mapping tool of claim 1 or 2, wherein said two market factors are a demand factor and a concentration factor.
- The industry scenario mapping tool of claim 3, wherein said demand factor is the change in shipping of a commodity per year.
- The industry scenario mapping tool of claim 3 or 4, wherein said concentration factor is the change in the Herfindahl index for said industry per year.
- The industry scenario mapping tool of claim 3, 4 or 5, wherein said demand factor is the change in shipping of a commodity per year.
- The industry scenario mapping tool of one of the preceding claims 1, wherein said four scenario regions consist of the scenarios: "Paradise Lost," "Gold Rush," "Wars of Attrition" and "Gilded Cage".
- A method of determining a market scenario for an industry, comprising:obtaining at least two types of market data regarding an industry; anddetermining from said at least two types of market data a market scenario from four scenarios: "Paradise Lost," "Gold Rush," "Wars of Attrition" and "Gilded Cage".
- The method of claim 8, further comprising providing advice to a company within said industry based on said market scenario.
- The method of claim 8 or 9, wherein said at least two types of market data comprises growth and market share.
- A method of determining a future market scenario for an industry, comprising:obtaining subjective data from experts in an industry;combining said subjective data;determining from said combined subjective data which market scenario will apply to said industry in the future.
- The method of claim 11, wherein said determining comprises determining a market scenario from four scenarios: "Paradise Lost," "Gold Rush," "Wars of Attrition" and "Gilded Cage".
- The method of claim 11 or 12, wherein said obtaining subjective data comprises asking said experts questions that are separated into two distinct classes of market data.
- The method of claim 11, 12 or 13, wherein said questions in one of said two distinct classes are evaluated so as to generate a first coordinate of a data point that is representative of future data for said industry.
- The method of claim 14, wherein said questions in another of said two distinct classes are evaluated so as to generate a second coordinate of said data point that is representative of future data for said industry.
- The method of claim 15, wherein said first and second coordinates are determined by the following formula:

qnxi = the value (1, 2, 3, 4, S, 6) of the ith question given to the nth interviewee, wherein the ith question has been categorized as either a B or M type question;
qnyj = the value (1, 2, 3, 4, 5, 6) of the jth question given to the nth interviewee, wherein the jth question has been categorized as either a W or V type question;
i = 1,2,3, ... Nx
j =1,2,3,... Ny
Nx = total number of questions categorized as either a B or M type question;
Ny = total number of questions categorized as either a W or V type question;
n = 1, 2, 3, ... NTOT, wherein NTOT is the total number of interviewees. - The method of claim 16, further comprising providing advice to a company within said industry based on said generated single data point.
- An industry scenario mapping tool comprising:a processor;a memory in communication with said processor, wherein said memory having a structure so as to store and implement a program in conjunction with said processor so as to: 1) combine subjective data stored in said memory that has been obtained from experts in an industry and 2) determine from said combined subjective data which market scenario will apply to said industry in the future.
- The industry scenario mapping tool of claim 18, further comprising a visual display in communication with said processor, wherein said processor prepares an advice screen to be shown on said visual display, said advice screen displaying:1) a 2 x 2 matrix representing four scenario regions and containing a graph plotting two market factors that can be used to show a market scenario in which an industry fits during a particular time period; and2) a data point representative of said industry at a future point in time.
- The industry scenario mapping tool of claim 19, wherein said two market factors are a demand factor and a concentration factor.
- The industry scenario mapping tool of claim 20, wherein said demand factor is the change in shipping of a commodity per year.
- The industry scenario mapping tool of claim 20, wherein said concentration factor is the change in the Herfindahl index for said industry per year.
- The industry scenario mapping tool of claim 22, wherein said demand factor is the change in shipping of a commodity per year.
- A computer program product, particularly stored on a computer-readable storage medium, including computer-readable instructions which when run on a suitable computer system perform the steps of a method according to one of the preceding claims 8 to 17.
Priority Applications (1)
| Application Number | Priority Date | Filing Date | Title |
|---|---|---|---|
| EP06011783A EP1865449A1 (en) | 2006-06-07 | 2006-06-07 | Industry scenario mapping tool |
Applications Claiming Priority (1)
| Application Number | Priority Date | Filing Date | Title |
|---|---|---|---|
| EP06011783A EP1865449A1 (en) | 2006-06-07 | 2006-06-07 | Industry scenario mapping tool |
Publications (1)
| Publication Number | Publication Date |
|---|---|
| EP1865449A1 true EP1865449A1 (en) | 2007-12-12 |
Family
ID=36790919
Family Applications (1)
| Application Number | Title | Priority Date | Filing Date |
|---|---|---|---|
| EP06011783A Ceased EP1865449A1 (en) | 2006-06-07 | 2006-06-07 | Industry scenario mapping tool |
Country Status (1)
| Country | Link |
|---|---|
| EP (1) | EP1865449A1 (en) |
-
2006
- 2006-06-07 EP EP06011783A patent/EP1865449A1/en not_active Ceased
Non-Patent Citations (1)
| Title |
|---|
| No Search * |
Similar Documents
| Publication | Publication Date | Title |
|---|---|---|
| Böhm | The price of polarization: Estimating task prices under routine‐biased technical change | |
| Chow et al. | Does VIX truly measure return volatility? | |
| Firer et al. | Testing the relationship between intellectual capital and a company’s performance: Evidence from South Africa | |
| Li | Perceived importance of information system success factors: A meta analysis of group differences | |
| Farris et al. | Evaluating the relative performance of engineering design projects: A case study using data envelopment analysis | |
| EP2273448A1 (en) | Apparatus and method for supporting cause analysis | |
| Hu et al. | Applying the IPA and DEMATEL models to improve the order-winner criteria: A case study of Taiwan’s network communication equipment manufacturing industry | |
| US8311860B2 (en) | Industry scenario mapping tool | |
| WO2013096558A2 (en) | Systems, machines, computer-implemented methods, and computer-readable media to provide decision-making model for outsourcing | |
| CN114139065B (en) | Talent screening and recommending method and system based on big data and readable storage medium | |
| Mardhiana et al. | Implementation of quality function deployment (QFD) for decision making in improving integrated academic information system | |
| Chang et al. | Organisational sustainability modelling for return on investment (ROI): case studies presented by a national health service (NHS) trust UK | |
| CN112163861A (en) | Transaction risk factor feature extraction method and device | |
| JP2008541315A (en) | Method and system for providing interest rate simulation display | |
| Hader et al. | Role of business intelligence data in guest house management in Gauteng | |
| Hutama et al. | Simple Additive Weighting (SAW) Method to Provide Recommendations for Selection of Graphic Processing Unit (GPU) | |
| Manzoni et al. | Corporate social responsibility and organisation behaviour | |
| JP7707458B1 (en) | How to measure cultural matching between users | |
| Miller et al. | Information technology project management: success, failure and risk factors | |
| Bhimani et al. | On an approach to data analysis and visualization in the domain of employee–organization relationships | |
| Ho et al. | Assessing the Listed Property Companies Readiness Towards Environmental Social Governance Implementation in Malaysia | |
| Makhmutov et al. | Methods and models of outsourcing | |
| Harden | Labor Market Analysis of Florida's Aerospace Industry | |
| Mgammal et al. | Exploring the impact of binarized corporate governance attribute scores on firm performance in China: A comprehensive analysis | |
| Lewis | Quantitative approach to technical performance measurement and technical risk analysis utilizing Bayesian methods and Monte Carlo simulation |
Legal Events
| Date | Code | Title | Description |
|---|---|---|---|
| PUAI | Public reference made under article 153(3) epc to a published international application that has entered the european phase |
Free format text: ORIGINAL CODE: 0009012 |
|
| AK | Designated contracting states |
Kind code of ref document: A1 Designated state(s): AT BE BG CH CY CZ DE DK EE ES FI FR GB GR HU IE IS IT LI LT LU LV MC NL PL PT RO SE SI SK TR |
|
| AX | Request for extension of the european patent |
Extension state: AL BA HR MK YU |
|
| 17P | Request for examination filed |
Effective date: 20080612 |
|
| 17Q | First examination report despatched |
Effective date: 20080711 |
|
| AKX | Designation fees paid |
Designated state(s): DE FR GB |
|
| STAA | Information on the status of an ep patent application or granted ep patent |
Free format text: STATUS: THE APPLICATION HAS BEEN REFUSED |
|
| 18R | Application refused |
Effective date: 20090201 |