EP1826742A1 - Plasma display device and driving method - Google Patents
Plasma display device and driving method Download PDFInfo
- Publication number
- EP1826742A1 EP1826742A1 EP06122099A EP06122099A EP1826742A1 EP 1826742 A1 EP1826742 A1 EP 1826742A1 EP 06122099 A EP06122099 A EP 06122099A EP 06122099 A EP06122099 A EP 06122099A EP 1826742 A1 EP1826742 A1 EP 1826742A1
- Authority
- EP
- European Patent Office
- Prior art keywords
- subfield
- load ratio
- line load
- subfields
- weight
- Prior art date
- Legal status (The legal status is an assumption and is not a legal conclusion. Google has not performed a legal analysis and makes no representation as to the accuracy of the status listed.)
- Granted
Links
Images





Classifications
-
- G—PHYSICS
- G09—EDUCATION; CRYPTOGRAPHY; DISPLAY; ADVERTISING; SEALS
- G09G—ARRANGEMENTS OR CIRCUITS FOR CONTROL OF INDICATING DEVICES USING STATIC MEANS TO PRESENT VARIABLE INFORMATION
- G09G3/00—Control arrangements or circuits, of interest only in connection with visual indicators other than cathode-ray tubes
- G09G3/20—Control arrangements or circuits, of interest only in connection with visual indicators other than cathode-ray tubes for presentation of an assembly of a number of characters, e.g. a page, by composing the assembly by combination of individual elements arranged in a matrix no fixed position being assigned to or needed to be assigned to the individual characters or partial characters
- G09G3/22—Control arrangements or circuits, of interest only in connection with visual indicators other than cathode-ray tubes for presentation of an assembly of a number of characters, e.g. a page, by composing the assembly by combination of individual elements arranged in a matrix no fixed position being assigned to or needed to be assigned to the individual characters or partial characters using controlled light sources
- G09G3/28—Control arrangements or circuits, of interest only in connection with visual indicators other than cathode-ray tubes for presentation of an assembly of a number of characters, e.g. a page, by composing the assembly by combination of individual elements arranged in a matrix no fixed position being assigned to or needed to be assigned to the individual characters or partial characters using controlled light sources using luminous gas-discharge panels, e.g. plasma panels
- G09G3/288—Control arrangements or circuits, of interest only in connection with visual indicators other than cathode-ray tubes for presentation of an assembly of a number of characters, e.g. a page, by composing the assembly by combination of individual elements arranged in a matrix no fixed position being assigned to or needed to be assigned to the individual characters or partial characters using controlled light sources using luminous gas-discharge panels, e.g. plasma panels using AC panels
-
- G—PHYSICS
- G09—EDUCATION; CRYPTOGRAPHY; DISPLAY; ADVERTISING; SEALS
- G09G—ARRANGEMENTS OR CIRCUITS FOR CONTROL OF INDICATING DEVICES USING STATIC MEANS TO PRESENT VARIABLE INFORMATION
- G09G3/00—Control arrangements or circuits, of interest only in connection with visual indicators other than cathode-ray tubes
- G09G3/20—Control arrangements or circuits, of interest only in connection with visual indicators other than cathode-ray tubes for presentation of an assembly of a number of characters, e.g. a page, by composing the assembly by combination of individual elements arranged in a matrix no fixed position being assigned to or needed to be assigned to the individual characters or partial characters
- G09G3/22—Control arrangements or circuits, of interest only in connection with visual indicators other than cathode-ray tubes for presentation of an assembly of a number of characters, e.g. a page, by composing the assembly by combination of individual elements arranged in a matrix no fixed position being assigned to or needed to be assigned to the individual characters or partial characters using controlled light sources
- G09G3/28—Control arrangements or circuits, of interest only in connection with visual indicators other than cathode-ray tubes for presentation of an assembly of a number of characters, e.g. a page, by composing the assembly by combination of individual elements arranged in a matrix no fixed position being assigned to or needed to be assigned to the individual characters or partial characters using controlled light sources using luminous gas-discharge panels, e.g. plasma panels
- G09G3/288—Control arrangements or circuits, of interest only in connection with visual indicators other than cathode-ray tubes for presentation of an assembly of a number of characters, e.g. a page, by composing the assembly by combination of individual elements arranged in a matrix no fixed position being assigned to or needed to be assigned to the individual characters or partial characters using controlled light sources using luminous gas-discharge panels, e.g. plasma panels using AC panels
- G09G3/291—Control arrangements or circuits, of interest only in connection with visual indicators other than cathode-ray tubes for presentation of an assembly of a number of characters, e.g. a page, by composing the assembly by combination of individual elements arranged in a matrix no fixed position being assigned to or needed to be assigned to the individual characters or partial characters using controlled light sources using luminous gas-discharge panels, e.g. plasma panels using AC panels controlling the gas discharge to control a cell condition, e.g. by means of specific pulse shapes
-
- G—PHYSICS
- G09—EDUCATION; CRYPTOGRAPHY; DISPLAY; ADVERTISING; SEALS
- G09G—ARRANGEMENTS OR CIRCUITS FOR CONTROL OF INDICATING DEVICES USING STATIC MEANS TO PRESENT VARIABLE INFORMATION
- G09G3/00—Control arrangements or circuits, of interest only in connection with visual indicators other than cathode-ray tubes
- G09G3/20—Control arrangements or circuits, of interest only in connection with visual indicators other than cathode-ray tubes for presentation of an assembly of a number of characters, e.g. a page, by composing the assembly by combination of individual elements arranged in a matrix no fixed position being assigned to or needed to be assigned to the individual characters or partial characters
- G09G3/2007—Display of intermediate tones
- G09G3/2018—Display of intermediate tones by time modulation using two or more time intervals
- G09G3/2022—Display of intermediate tones by time modulation using two or more time intervals using sub-frames
-
- G—PHYSICS
- G09—EDUCATION; CRYPTOGRAPHY; DISPLAY; ADVERTISING; SEALS
- G09G—ARRANGEMENTS OR CIRCUITS FOR CONTROL OF INDICATING DEVICES USING STATIC MEANS TO PRESENT VARIABLE INFORMATION
- G09G3/00—Control arrangements or circuits, of interest only in connection with visual indicators other than cathode-ray tubes
- G09G3/20—Control arrangements or circuits, of interest only in connection with visual indicators other than cathode-ray tubes for presentation of an assembly of a number of characters, e.g. a page, by composing the assembly by combination of individual elements arranged in a matrix no fixed position being assigned to or needed to be assigned to the individual characters or partial characters
- G09G3/22—Control arrangements or circuits, of interest only in connection with visual indicators other than cathode-ray tubes for presentation of an assembly of a number of characters, e.g. a page, by composing the assembly by combination of individual elements arranged in a matrix no fixed position being assigned to or needed to be assigned to the individual characters or partial characters using controlled light sources
- G09G3/28—Control arrangements or circuits, of interest only in connection with visual indicators other than cathode-ray tubes for presentation of an assembly of a number of characters, e.g. a page, by composing the assembly by combination of individual elements arranged in a matrix no fixed position being assigned to or needed to be assigned to the individual characters or partial characters using controlled light sources using luminous gas-discharge panels, e.g. plasma panels
- G09G3/288—Control arrangements or circuits, of interest only in connection with visual indicators other than cathode-ray tubes for presentation of an assembly of a number of characters, e.g. a page, by composing the assembly by combination of individual elements arranged in a matrix no fixed position being assigned to or needed to be assigned to the individual characters or partial characters using controlled light sources using luminous gas-discharge panels, e.g. plasma panels using AC panels
- G09G3/296—Driving circuits for producing the waveforms applied to the driving electrodes
-
- G—PHYSICS
- G09—EDUCATION; CRYPTOGRAPHY; DISPLAY; ADVERTISING; SEALS
- G09G—ARRANGEMENTS OR CIRCUITS FOR CONTROL OF INDICATING DEVICES USING STATIC MEANS TO PRESENT VARIABLE INFORMATION
- G09G2320/00—Control of display operating conditions
- G09G2320/02—Improving the quality of display appearance
- G09G2320/0233—Improving the luminance or brightness uniformity across the screen
-
- G—PHYSICS
- G09—EDUCATION; CRYPTOGRAPHY; DISPLAY; ADVERTISING; SEALS
- G09G—ARRANGEMENTS OR CIRCUITS FOR CONTROL OF INDICATING DEVICES USING STATIC MEANS TO PRESENT VARIABLE INFORMATION
- G09G2320/00—Control of display operating conditions
- G09G2320/02—Improving the quality of display appearance
- G09G2320/0266—Reduction of sub-frame artefacts
-
- G—PHYSICS
- G09—EDUCATION; CRYPTOGRAPHY; DISPLAY; ADVERTISING; SEALS
- G09G—ARRANGEMENTS OR CIRCUITS FOR CONTROL OF INDICATING DEVICES USING STATIC MEANS TO PRESENT VARIABLE INFORMATION
- G09G2320/00—Control of display operating conditions
- G09G2320/06—Adjustment of display parameters
- G09G2320/0626—Adjustment of display parameters for control of overall brightness
-
- G—PHYSICS
- G09—EDUCATION; CRYPTOGRAPHY; DISPLAY; ADVERTISING; SEALS
- G09G—ARRANGEMENTS OR CIRCUITS FOR CONTROL OF INDICATING DEVICES USING STATIC MEANS TO PRESENT VARIABLE INFORMATION
- G09G2360/00—Aspects of the architecture of display systems
- G09G2360/16—Calculation or use of calculated indices related to luminance levels in display data
Definitions
- the present invention relates to a plasma display device and a driving method thereof. More particularly, but not exclusively, the present invention relates to a method for allocating a sustain pulse to a plurality of subfields that form one frame.
- a plasma display device is a flat panel display device that uses plasma generated by a gas discharge process to display characters or images.
- one frame of the plasma display device is divided into a plurality of subfields, each having a corresponding brightness weight, to drive the plasma display device.
- Turn-on/turn-off cells i.e., cells to be turned on or off
- a sustain discharge operation is performed on the turn-on cells to display an image during a sustain period.
- Grayscales are expressed by a combination of weights of the subfields that are used to perform a display operation.
- a plurality of row electrodes and a plurality of column electrodes are formed, and discharge cells are formed where the row electrodes cross the column electrodes. Accordingly, currents flowing to the row electrodes vary according to the number of the turn-on cells along the row electrode, and a voltage drop occurs according to the currents. The voltage drop is reduced as the number of turn-on cells of the row electrode is reduced and luminance in one discharge cell is increased when the voltage drop is reduced. That is, since the luminance expressed by one subfield varies according to the number of turn-on cells of the row electrodes, a luminance deviation at the row electrode may occur for the same gray scale.
- the present invention provides a plasma display device for preventing a luminance deviation caused by a line load ratio, and a driving method thereof.
- subfield data are compensated according to the line load ratio.
- An exemplary embodiment of the present invention provides a plasma display device including a plurality of row electrodes, a plurality of column electrodes, and a plurality of discharge cells defined by the plurality of row electrodes and the plurality of column electrodes, and a driving method thereof.
- the driving method one frame is divided into a plurality of subfields having respective luminance weights, and a first line load ratio in each subfield is determined from a plurality of video signals corresponding to a first row electrode among the plurality of row electrodes.
- a first output estimation weight of each subfield is set based on the first line load ratio of each subfield in the first row electrode.
- a plurality of video signals corresponding to the first row electrode are respectively converted into a plurality of first subfield data based on the first output estimation weight, and a driving signal is applied to the first row electrode and the plurality of column electrodes according to the plurality of first subfield data.
- the first line load ratio in each subfield is determined from a plurality of video signals that are mapped into an initial set of subfield data. Further, each subfield has an initial luminance weight. The initial subfield weights are updated by the above method to produce the output estimation weight. The initial subfield data are updated according to the updated subfield weights to yield the first subfield data. Also, the plurality of video signals corresponding to the first row electrode may be mapped into the plurality of subfields having the respective luminance weights, and are converted into a plurality of second subfield data. The first line load ratio of each subfield may be determined from the plurality of second subfield data.
- At least one model for changes of output luminance depending on changes of the line load ratio may be generated, the at least one model is used, and the first output estimation weight of the plurality of subfields may be calculated from the luminance weight and the plurality of first line load ratios.
- the plurality of video signals corresponding to the first row electrode may be mapped into the plurality of subfields having the respective first output estimation weights, and the video signals may be converted into the plurality of first subfield data.
- the plurality of video signals corresponding to the first row electrode may be mapped into the plurality of subfields having the respective first output estimation weights, and the video signals may be mapped into a plurality of second subfield data.
- the plurality of video signals corresponding to the first row electrode are mapped into the plurality of subfields having the respective first output estimation weights
- the video signals are converted into a plurality of third subfield data
- an error between the luminance weight and the first output estimation weight of each subfield is calculated for the first row electrode
- second subfield data are set as the first subfield data in a subfield having the error that is less than a threshold value among the plurality of subfields
- third subfield data are set as the first subfield data in a subfield having the error that is greater than the threshold value.
- the plurality of video signals corresponding to the first row electrode are mapped into the plurality of subfields having the respective first output estimation weights, the video signals are converted into a plurality of second subfield data, a second line load ratio of each subfield is determined from the plurality of second subfield data. At least some subfields are detected among subfields having an error between the first line load ratio and the second line load ratio that is greater than a threshold value corresponding to the respective subfields, the at least some subfields are set as a basic load, and the second line load ratio is compensated in a subfield group having the basic load.
- a second output estimation weight is set based on the compensated second line load ratio, the plurality of video signals corresponding to the first row electrode are mapped into the plurality of subfields having the respective second output estimation weights, and the video signals are converted to the plurality of first subfield data.
- An exemplary plasma display device includes a row electrode having a plurality of discharge cells, a controller, and a driver.
- the controller divides one frame into a plurality of subfields having respective luminance weights, maps a plurality of video signals respectively corresponding to the plurality of discharge cells into the plurality of subfields, converts the video signals into a plurality of first subfield data, measures a line load ratio of each subfield from the plurality of first subfield data, respectively compensates the plurality of first subfield data according to the line load ratio of each subfield, and generates a plurality of second subfield data.
- the driver discharges a plurality of turn-on cells based on the plurality of second subfield data in the plurality of subfields having the luminance weight.
- the second subfield data When the second subfield data are generated using the subfield data of one frame, they will be used to generate the sustain pulses.
- An exemplary plasma display device includes a plurality of row electrodes respectively having a plurality of discharge cells, a controller, and a driver.
- the controller may divide one frame into a plurality of subfields having respective luminance weights, calculate a screen load ratio from a plurality of video signals corresponding to the one frame, calculate a line load ratio for each subfield of the respective row electrodes from the plurality of video signals corresponding to the respective row electrodes, respectively compensate the plurality of video signals according to the line load ratio of the row electrode in the discharge cell corresponding to the screen load ratio, and generate a plurality of subfield data.
- the controller may convert the video signal of a first grayscale corresponding to a row electrode having a first line load ratio into first subfield data in a first frame having a first screen load ratio, and convert a video signal of a second grayscale that is equal to the first grayscale corresponding to a row electrode having a second line load ratio that is equal to the first line load ratio into second subfield data that are different from the first subfield data in a second frame having a second screen load ratio that is different from the first screen load ratio.
- the controller may convert the video signal of a first grayscale corresponding to a row electrode having a first line load ratio into first subfield data, and convert the video signal of a second grayscale that is equal to the first grayscale corresponding to a row electrode having a second line load ratio that is different from the first line load ratio into second subfield data that are different from the first subfield data.
- An exemplary plasma display device includes a row electrode at least having a plurality of first discharge cells emitting a first color and a plurality of second discharge cells emitting a second color, a controller, and a driver.
- the controller divides one frame into a plurality of subfields having respective luminance weights, calculates a line load ratio for each subfield of the row electrode from a plurality of video signals respectively corresponding to the plurality of first and second discharge cells, respectively compensates the plurality of video signals according to the line load ratio and the first and second colors, and generates a plurality of subfield data.
- the plasma display device includes a plasma display panel (PDP) 100, a controller 200, an address electrode driver 300, a sustain electrode driver 400, and a scan electrode driver 500.
- PDP plasma display panel
- the PDP 100 includes a plurality of address electrodes (hereinafter, referred to as A electrodes) A1 to Am extending in a column direction, and a plurality of sustain and scan electrodes (hereinafter, referred to as X and Y electrodes) X1 to Xn and Y1 to Yn in pairs extending in a row direction.
- a electrodes address electrodes
- X and Y electrodes sustain and scan electrodes
- the Y and X electrodes Y1 to Yn and X1 to Xn are arranged perpendicular to the A electrodes A1 to Am, and a discharge space formed at an area where the address electrodes A1 to Am cross the sustain and scan electrodes X1 to Xn and Y1 to Yn forms a discharge cell 110.
- the electrodes cross over or under and do not intersect. Since phosphor layers of red, green, and blue are alternately formed along a row direction and corresponding to the A electrodes A1 to Am, it is assumed that discharge cells of red, green, and blue are alternately arranged in the PDP 100 along the row direction.
- the PDP 100 is driven during frames of time.
- the controller 200 divides one frame into a plurality of subfields SF1 to SF11 each having a corresponding luminance weight as shown in Figure 2. Further, each subfield includes an address period and a sustain period.
- the controller 200 converts a plurality of video data for the plurality of discharge cells 110 into subfield data indicating respective light emitting/non-light emitting states in the plurality of subfields SF1 to SF11.
- one frame includes 11 subfields SF1 to SF11 respectively having luminance weights of 1, 2, 3, 5, 10, 18, 34, 60, 90, 130, and 158, using which grayscales from 0 to 511 may be expressed.
- the controller 200 may convert video data of 120 grayscale into subfield data of "00110111000".
- "00110111000” sequentially corresponds to the respective subfields SF1 to SF11, 1 indicates that the discharge cell is light-emitted in the corresponding subfield, and 0 indicates that the discharge cell is not light-emitted in the corresponding subfield.
- the same grayscale 120 may also be obtained by a different combination of subfields during which the discharge cell emits light.
- the controller 200 measures line load ratios of the row electrodes from the generated subfield data, and determines output estimation weights, also referred to as estimated output weights, of the respective subfields SF1 to SF11 according to the measured line load ratios.
- the output estimation weights are the updated and newly estimated luminance weights of each subfield.
- the controller 200 converts the video data to the subfield data according to the measured output estimation weights of the respective subfields SF1 to SF11, and applies driving control signals to the A, X, and Y electrode drivers 300, 400, and 500 according to the subfield data.
- the A, X, and Y electrode drivers 300, 400, and 500 respectively apply driving voltages to the A, X, and Y electrodes A1 to Am, X1 to Xn, and Y1 to Yn according to the driving control signals from the controller 200.
- the A, X, and Y electrode drivers 300, 400, and 500 select turn-on cells and turn-off cells from among the plurality of discharge cells 110.
- the X and/or the Y electrode drivers 400 and 500 apply a sustain pulse to the plurality of X electrodes X1 to Xn and/or the plurality of Y electrodes Y1 to Yn a number of times corresponding to the weight of the subfield, and a sustain discharge is repeatedly performed for the turn-on cell.
- Luminance variations caused according to a screen load ratio and a line load ratio when a screen is displayed according to the subfield data determined by an initial subfield weight without compensating the luminance according to the first exemplary embodiment of the present invention is first described with reference to Figure 3A, Figure 3B, Figure 4A, Figure 4B, and Figure 4C.
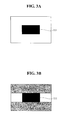
- Figure 3A shows a diagram representing a screen to be displayed
- Figure 3B shows a diagram representing a screen seen and perceived by eye when the screen shown in Figure 3A is actually being displayed.
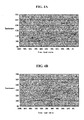
- Figure 4A, Figure 4B, and Figure 4C show graphs representing the luminance variations according to line load ratios.
- Figure 3A when on a screen a quadrangle area 111 is illustrated in black and an area surrounding the quadrangle area is illustrated in white, the line load ratio of a row electrode passing through the quadrangle area 111 is less than the line load ratio of a row electrode that does not pass through the quadrangle area 111.
- the number of turn-on cells on the row electrode having the higher load ratio is greater than the number of turn-on cells on the row electrode having the lower load ratio. Therefore, discharge currents according to the sustain discharge are increased on the row electrode having the higher load ratio, and a significant voltage drop occurs on the row electrode having the higher load ratio.
- white luminance of the row electrodes having the higher load ratio (the row electrodes that do not pass through the quadrangle area 111) is reduced to less than the white luminance of the row electrodes having the lower load ratio. That is, a luminance deviation occurs according to the load ratio for each electrode.
- the luminance deviation may vary according to the screen load ratio shown in Figure 4A, Figure 4B, and Figure 4C, because the discharge currents on the row electrodes vary according to the screen load ratio and the discharge currents affect the luminance.
- Figure 4A, Figure 4B, and Figure 4C show graphs representing relative luminance variations according to the line load ratio when the screen load ratio is respectively 90%, 60%, and 30%.
- the vertical axis varies between 90 and 150 and shows a relative luminance assuming that the luminance is 100 when the line load ratio is 100%.
- the horizontal axis varies from 100% to less than 6%, and shows the value of the line load ratio.
- red”, green”, or blue labels for the relative luminance curves respectively indicate cases that the red, green, or blue discharge cells are emitting light; a label of "white” indicates a relative luminance curve when the red, green, and blue discharge cells are emitting together; and a label “average” indicates an average value of the relative luminance for the red, green, and blue discharge cells.
- the luminance is increased as the line load ratio of the row electrode is decreased, and the increase in luminance is different for the red, green, and blue discharge cells.
- the luminance also varies from figure to figure according to the screen load ratio that is decreasing from 90% in Figure 4A to 60% in Figure 4B and 30% in Figure 4C.
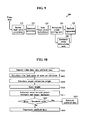
- FIG. 5 shows a schematic block diagram of a controller 200 according to a first exemplary embodiment of the present invention.
- the controller 200 includes a screen load ratio calculator 210, a subfield generator 220, a line load ratio calculator 230, an estimation weight setting unit 240, and a subfield regenerator 250.
- the screen load ratio calculator 210 calculates the screen load ratio from the video data input during one frame. For example, the screen load ratio calculator 210 may calculate the screen load ratio from an average signal level of the video data of one frame.
- the subfield generator 220 converts the video data to the subfield data according to the luminance weights of the subfields SF1 to SF11.
- the line load ratio calculator 220 calculates the line load ratio of each row electrode for the subfields by using the corresponding subfield data.
- the line load ratio of each row electrode is calculated by using a ratio of the number of the turn-on cells to the number of all the discharge cells formed along the row electrode.
- the estimation weight setting unit 240 determines an updated estimate of the weights of each of the plurality of subfields SF1 to SF11 for the row electrodes according to the line load ratio of each row electrode, and sets the updated estimate of the weight as a new weight.
- the updated weights of the subfields are also referred to as output estimation weights or estimated output weights.
- the subfield regenerator 250 converts the video data to the subfield data according to the updated weight set by the estimation weight setting unit 240.
- the updated weight newly set by the estimation weight setting unit 240 is a virtual weight for regenerating the subfield data, and the number of sustain pulses is applied according to the initial luminance weight such as the exemplary set of weights shown in Figure 2.
- the relative luminance varies as a function of the line load ratio, the screen load ratio, and the phosphor color. Accordingly, the screen load ratio or the phosphor color, or both may also be used, in addition to the line load ratio, when the estimation weight setting unit 240 sets the updated subfield weights or the output estimation weights.
- the estimation weight setting unit 240 may set the subfield weight by using a model 1, a model 2, a model 3, or a model 4.
- average variation ratios obtained by averaging luminance variation ratios of red, green, and blue at each screen load ratio are averaged in respective screen load ratio conditions in the model 1.
- the luminance variation ratio is applied for the respective red, green, and blue in the model 2.
- red luminance variation ratios red in Figure 4A to Figure 4C
- the screen load ratio conditions are grouped into at least two groups, and the model 1 and the model 2 are averaged in each screen load ratio condition for each group.
- the models may be stored for each condition in the estimation weight setting unit 240 as a lookup table, or may be realized by a logic gate (e.g., a field programmable gate array (FPGA)).
- Figure 4A, Figure 4B, and Figure 4C when taken together show the variation of the relative luminance with all three factors of line load ratio that is shown along the horizontal axes, the phosphor colors that each have their corresponding curve, and the screen load ratio that varies from 90% in Figure 4A to 60% in Figure 4B and to 30% in Figure 4C.
- the three separate drawings of Figure 4A to Figure 4C correspond to model 4 where the impact of each of the three parameters is shown separately.
- Model 2 and Model 3 each show the variation of the relative luminance with two of the three factors.
- the variation is averaged over screen load ratio and in model 3 the variation is averaged over phosphor color.
- the average line appearing in each of the Figure 4A to Figure 4C corresponds to model 3 where the relative luminance is still shown as a function of the line load ratio and the screen load ratio but is averaged over the three colors such that only one average line appears corresponding to all three colors.
- a drawing for model 2 would include one plot with three curves for each of the three colors where the curves are averaged over different screen load ratios.
- model 1 the relative luminance would be shown only as a function of the line load ratio and would be averaged over both the three phosphor colors and the various screen load ratios. There are no drawings for model 1. Model 1 may be shown with one plot of relative luminance versus line load ratio that includes one curve only corresponding to an average relative luminance obtained by averaging over the relative luminance values of red, green, and blue phosphors and over the relative luminance values for screen load ratio of 30%, 60%, and 90%.
- Figure 6 shows a flowchart representing a method for compensating the luminance in the controller according to the first exemplary embodiment of the present invention
- Figure 7A shows a diagram representing the subfield weights and subfield data before the luminance is compensated by the method shown in Figure 6
- Figure 7B shows a diagram representing the subfield weight and subfield data after the luminance is compensated by the method shown in Figure 6.
- RW i denotes an initial weight of an i th subfield SFi
- NW i denotes a converted and updated weight of the i th subfield SFi
- LR i denotes a line load ratio of the i th subfield SFi.
- model 1 expresses the relative luminance as a function of the line load ratio alone and is averaged over the other two parameters. Therefore, NW i may be expressed as a function of only LR i and a previous value of the subfield weight RW i .
- the subfield generator 220 converts the input video data into the subfield data in step 5610, and the line load ratio calculator 230 calculates the line load ratio LR i of each row electrode for each subfield SFi in step S620. That is, the line load ratio calculator 230 outputs a ratio of the turn-on cells to all the discharge cells as the line load ratio LR i according to the subfield data, for each row electrode.
- the line load ratio is 30% in a first subfield SF1 since there are 3 turn-on cells out of the total of 10 cells along the row, and the line load ratio is 100% in a second subfield SF2 since there are 10 turn-on cells out of the total 10.
- the estimation weight setting unit 240 uses a predetermined model (e.g., Equation 1), calculates an output estimation weight (updated weight) according to the line load ratio for each of the subfields SF1 to SF11 in step S630, and sets the calculated output estimation weight as a new weight NW i for regenerating the subfield data in step S640.
- the regenerated and updated output estimation weights are shown as the last row of Figure 7A. These updated weights become the new weights of each of the subfields as shown as the second row of Figure 7B.
- the subfield regenerator 250 regenerates the subfield data according to the updated new weight NW i in step S650, as shown in Figure 7B.
- the new weight NW i set by the estimation weight setting unit 240 is for regenerating the subfield data, and the number of sustain pulses applied to the subfields SF1 to SF11 when an image is actually displayed is determined by the initial weight RW i .
- the initial weight RW i for each subfield is shown as the second row of Figure 7A.
- the actual luminance is calculated by using the calculated output estimation weight NW i in the predetermined model for the respective subfields and the subfield data.
- the error between the actual luminance and the target luminance is reduced.
- the actual luminance shown in Figure 7B is obtained when an image is displayed by using the subfield data that is regenerated in step S650. That is, the actual luminance is obtained according to the line load ratio determined by the regenerated subfield data and the output estimation weight in each subfield determined by Equation 1.
- the weight of each subfield is reset according to the line load ratio, and the subfield data are regenerated according to the reset weight to compensate the luminance.
- the luminance error may be increased in the luminance compensation method according to the first exemplary embodiment of the present invention. This increase will now be described with reference to Figure 8A and Figure 8B.
- Figure 8A shows a diagram representing the subfield weight and the subfield data before the luminance is compensated in the method shown in Figure 6, and Figure 8B shows a diagram representing the subfield weight and subfield data after the luminance is compensated in the method shown in Figure 6.
- Figure 8A and Figure 8B it is assumed that a 250 grayscale accounts for 17% of one row electrode and a 50 grayscales account for 83% of the one row electrode.
- the output estimation weights of the respective subfields are given as in Figure 8A. That is, the actual weight and the output estimation weight are the same in the subfield having a line load ratio of 100%, but the output estimation weight is higher than the actual weight in the subfield having a line load ratio of less than 100%.
- the actual luminance of a 50 grayscale is 50, which is the same as the target luminance, but a great difference is generated between the actual luminance and the target luminance of the 250 grayscale since the actual luminance is 289.
- Figure 8B shows that a new weight is set and the subfield data are regenerated according to the first exemplary embodiment of the present invention.
- the output estimation weight is calculated again to calculate the actual luminance
- the error between the actual and target luminance is reduced since the target luminance of the 250 grayscale is now 256.54, but an error between the actual and target luminance is generated since the target luminance of the 50 grayscale is now 45.54.
- the line load ratio of an eighth subfield SF8 is greatly changed by the change of the subfield data of the 50 grayscale, there is a great difference between the set weight (33.42) and the output estimation weight 28.4 of the subfield SF8. Accordingly, a large difference is generated in the target luminance.
- Figure 9 shows a schematic diagram of a controller 200' according to a second exemplary embodiment of the present invention
- Figure 10 shows a flowchart representing a luminance compensation method according to the second exemplary embodiment of the present invention.
- Figure 11 shows a diagram representing the subfield data after the data shown in Figure 8A are compensated by the method shown in Figure 10.
- the controller 200' according to the second exemplary embodiment of the present invention is similar to the controller 200 of the first embodiment.
- the controller 200' of the second embodiment further includes a luminance error determining unit 260.
- the function of a subfield data generator 250' of the controller 200' is different from the function of the subfield data generator 250 of the controller 200 of the first exemplary embodiment of the present invention.
- step S641 the luminance error determining unit 260 calculates an error between the actual luminance and the target luminance for the respective grayscales of the plurality of discharge cells of each row electrode.
- step S642 the luminance error determining unit 260 determines whether the calculated error is less than a threshold value for a corresponding grayscale.
- step S643 the subfield regenerator 250' does not regenerate the subfield data for the grayscales having an error that is less than the threshold value. Rather, in step S650, the subfield generator 250' regenerates the subfield data according to the new weight NW i for the grayscales having an error that is greater than the threshold value.
- the threshold value may be equally set for all the grayscales, or a relatively greater threshold value may be set for the higher grayscales.
- the threshold value for an error ratio may be equally set for all the grayscales. In this case, the error ratio corresponds to an error between the actual luminance and the target luminance divided by the target luminance.
- Figure 12 shows a schematic block diagram of a controller 200" according to the third exemplary embodiment of the present invention
- Figure 13 shows a flowchart representing a luminance compensation method according to the third exemplary embodiment of the present invention.
- the controller 200" according to the third exemplary embodiment of the present invention is similar to the controller 200 of the first embodiment. However, the controller 200" further includes a basic load determining unit 270. Further, the functions of an estimation weight setting unit 240" and a subfield regenerator 250" are different from those included in the controllers 200 and 200' of the first and second exemplary embodiments of the present invention.
- a subfield group has a load ratio for affecting the luminance, and the subfield formation of the subfield group may be changed by the compensation method according to the first exemplary embodiment of the present invention shown in Figure 6.
- the subfield groups having similar subfield data patterns will be referred to as "basic loads.”
- the subfields forming a basic load may change after each update of the luminance weights of the subfields in order to maintain the load ratio of the basic load.
- the basic load determining unit 270 detects the basic load from the line load ratio determined according to the initial weight and the line load ratio after the compensation is performed by the estimation weight setting unit 240" and the subfield regenerator 250". The basic load determining unit 270 then sets a subfield range affected by the basic load (hereinafter, called an "estimation subfield range"). The basic load determining unit 270 assumes the line load ratio of the basic load as an estimation line load ratio of a subfield in an estimation subfield range.
- the estimation weight setting unit 240" resets the subfield weights based on the estimation line load ratio from the basic load determining unit 270.
- the subfield regenerator 250" regenerates the subfield data according to the reset subfield weight.
- the subfield regenerator 250" regenerates the subfield data in step S650 after steps S610 to S640 occur as described in Figure 6 with steps S630 and S640 being performed by the estimation weight setting unit 240". Then, the basic load determining unit 270 detects the basic load in steps S661 to S663.
- the subfield data generated by the subfield generator 220 according to the initial weight, in step S620 will be referred to as "initial subfield data”
- the subfield data regenerated by the subfield regenerator 250" in step S650 will be referred to as "first subfield data.”
- the basic load determining unit 270 detects whether a subfield located among subfields of a basic load detection range may be categorized as a basic load or as part of a basic load group of subfields.
- the luminance is affected more significantly when the line load ratio is changed in a subfield having a high weight. Therefore, the subfields having the higher weights are set as the basic load detection subfields, according to the third exemplary embodiment of the present invention.
- six subfields of SF6 to SF11 having the six highest weights, amongst all of the subfields SF1 to SF11 may be set as the basic load detection subfields or the basic load detection range.
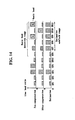
- the basic load determining unit 270 looks for the subfield or the group of subfields forming the basic load among the basic load detection range. As shown in Figure 14, the basic load determining unit 270 compares the line load ratio determined by the initial subfield data (hereinafter, referred to as a "pre-compensation line load ratio") to the line load ratio determined by the first subfield data (hereinafter, referred to as an "after-compensation line load ratio") in the basic load detection range of subfields. Subfields, within the basic load detection range, having an error between the two line load ratios that is greater than a threshold value may be determined as the basic load group including subfields SF9, SF10, and SF11. The same threshold value may be set for all the subfields. Alternatively, a low threshold value may be set for a subfield having a higher weight since data of the subfield having the higher weight have a greater effect on the luminance.
- the basic load determining unit 270 determines a range of subfields (i.e., an estimation subfield range) that may be affected by the subfields in the basic load in step S662.
- the estimation subfield range includes the subfields forming the basic load, and may further include one or more subfields neighboring the subfields forming the basic load. That is, since the load of a subfield having a weight that is higher than the highest weight of the basic load may vary according to the variation of the basic load, the estimation subfield range may include a subfield having a lowest weight among subfields having a weight that is higher than the highest weight of the basic load.
- the estimation subfield range may include one or two subfield having a highest weight among subfields having a weight that is lower than the lowest weight of the basic loads.
- the basic load determining unit 270 determines the estimation line load ratio of the subfields in the estimation subfield range based on the line load ratio of the basic load. In this case, when there is only one subfield in the basic load group of subfields, the basic load determining unit 270 sets the estimation line load ratio of the subfields in the estimation subfield range to be equal to the higher of the pre-compensation and the after-compensation line load ratios of that one subfield.
- the basic load determining unit 270 sets the estimation line load ratio for all the subfields within the estimation subfield range equal to an average of the higher of the pre-compensation and after-compensation line load ratios of the subfields forming the basic load. In other words, first the higher line load ratio for each subfield within the subfields forming the basic load is determined. The higher line load ratio for SF9, SF10, and SF11 are shown, respectively as A, B, and C. Next, these higher line load ratios are averaged and the one average value is set as the estimation line load ratio of all the subfields within the estimation subfield range.
- (A+B+C)/3 would be set as the line load ratio of all of the subfields within the estimation subfield range.
- the estimation line load ratio of the subfields outside the estimation subfield range remains at the after-compensation line load ratio.
- the estimation weight setting unit 240" uses the line load ratio set by the basic load determining unit 270 and the above model, and determines the updated subfield weight in step S670.
- the estimation line load ratio is used for the subfields in the estimation subfield range, and the after-compensation line load ratios are used for the other subfields.
- step S680 the subfield regenerator 250" regenerates the subfield data according to the subfield weights that were determined in step S670 by the estimation weight setting unit 240" based on the basic load.
- the line load ratio of the subfields in the estimation subfield range is set high, there is no great change in the weights of the subfields as a result of the resetting of the weights in step S670. Accordingly, since there is no great change in the subfield data of the subfields in the estimation subfield range, the subfield data that is affected by the basic load may be maintained.
- the subfield data used for formation of a subfield having a high line load ratio is not greatly changed, an error caused by inaccurate compensation of the luminance may be avoided.
- a predetermined luminance when the luminance is not changed according to the line load ratio, a predetermined luminance may be maintained for the same grayscales regardless of the line load ratio.
Landscapes
- Engineering & Computer Science (AREA)
- Physics & Mathematics (AREA)
- Computer Hardware Design (AREA)
- General Physics & Mathematics (AREA)
- Theoretical Computer Science (AREA)
- Power Engineering (AREA)
- Plasma & Fusion (AREA)
- Control Of Indicators Other Than Cathode Ray Tubes (AREA)
- Control Of Gas Discharge Display Tubes (AREA)
Abstract
Description
- The present invention relates to a plasma display device and a driving method thereof. More particularly, but not exclusively, the present invention relates to a method for allocating a sustain pulse to a plurality of subfields that form one frame.
- A plasma display device is a flat panel display device that uses plasma generated by a gas discharge process to display characters or images. In general, one frame of the plasma display device is divided into a plurality of subfields, each having a corresponding brightness weight, to drive the plasma display device. Turn-on/turn-off cells (i.e., cells to be turned on or off) are selected during an address period of each subfield, and a sustain discharge operation is performed on the turn-on cells to display an image during a sustain period. Grayscales are expressed by a combination of weights of the subfields that are used to perform a display operation.
- In a display panel of the plasma display device, a plurality of row electrodes and a plurality of column electrodes are formed, and discharge cells are formed where the row electrodes cross the column electrodes. Accordingly, currents flowing to the row electrodes vary according to the number of the turn-on cells along the row electrode, and a voltage drop occurs according to the currents. The voltage drop is reduced as the number of turn-on cells of the row electrode is reduced and luminance in one discharge cell is increased when the voltage drop is reduced. That is, since the luminance expressed by one subfield varies according to the number of turn-on cells of the row electrodes, a luminance deviation at the row electrode may occur for the same gray scale.
- The present invention provides a plasma display device for preventing a luminance deviation caused by a line load ratio, and a driving method thereof.
- According to an embodiment of the present invention, subfield data are compensated according to the line load ratio.
- An exemplary embodiment of the present invention provides a plasma display device including a plurality of row electrodes, a plurality of column electrodes, and a plurality of discharge cells defined by the plurality of row electrodes and the plurality of column electrodes, and a driving method thereof. In the driving method, one frame is divided into a plurality of subfields having respective luminance weights, and a first line load ratio in each subfield is determined from a plurality of video signals corresponding to a first row electrode among the plurality of row electrodes. A first output estimation weight of each subfield is set based on the first line load ratio of each subfield in the first row electrode. Subsequently, a plurality of video signals corresponding to the first row electrode are respectively converted into a plurality of first subfield data based on the first output estimation weight, and a driving signal is applied to the first row electrode and the plurality of column electrodes according to the plurality of first subfield data.
- In this case, the first line load ratio in each subfield is determined from a plurality of video signals that are mapped into an initial set of subfield data. Further, each subfield has an initial luminance weight. The initial subfield weights are updated by the above method to produce the output estimation weight. The initial subfield data are updated according to the updated subfield weights to yield the first subfield data. Also, the plurality of video signals corresponding to the first row electrode may be mapped into the plurality of subfields having the respective luminance weights, and are converted into a plurality of second subfield data. The first line load ratio of each subfield may be determined from the plurality of second subfield data.
- In addition, at least one model for changes of output luminance depending on changes of the line load ratio may be generated, the at least one model is used, and the first output estimation weight of the plurality of subfields may be calculated from the luminance weight and the plurality of first line load ratios.
- The plurality of video signals corresponding to the first row electrode may be mapped into the plurality of subfields having the respective first output estimation weights, and the video signals may be converted into the plurality of first subfield data.
- The plurality of video signals corresponding to the first row electrode may be mapped into the plurality of subfields having the respective first output estimation weights, and the video signals may be mapped into a plurality of second subfield data. In this case, the plurality of video signals corresponding to the first row electrode are mapped into the plurality of subfields having the respective first output estimation weights, the video signals are converted into a plurality of third subfield data, an error between the luminance weight and the first output estimation weight of each subfield is calculated for the first row electrode, second subfield data are set as the first subfield data in a subfield having the error that is less than a threshold value among the plurality of subfields, and third subfield data are set as the first subfield data in a subfield having the error that is greater than the threshold value.
- The plurality of video signals corresponding to the first row electrode are mapped into the plurality of subfields having the respective first output estimation weights, the video signals are converted into a plurality of second subfield data, a second line load ratio of each subfield is determined from the plurality of second subfield data. At least some subfields are detected among subfields having an error between the first line load ratio and the second line load ratio that is greater than a threshold value corresponding to the respective subfields, the at least some subfields are set as a basic load, and the second line load ratio is compensated in a subfield group having the basic load. Subsequently, a second output estimation weight is set based on the compensated second line load ratio, the plurality of video signals corresponding to the first row electrode are mapped into the plurality of subfields having the respective second output estimation weights, and the video signals are converted to the plurality of first subfield data.
- An exemplary plasma display device according to an exemplary embodiment of the present invention includes a row electrode having a plurality of discharge cells, a controller, and a driver. The controller divides one frame into a plurality of subfields having respective luminance weights, maps a plurality of video signals respectively corresponding to the plurality of discharge cells into the plurality of subfields, converts the video signals into a plurality of first subfield data, measures a line load ratio of each subfield from the plurality of first subfield data, respectively compensates the plurality of first subfield data according to the line load ratio of each subfield, and generates a plurality of second subfield data. The driver discharges a plurality of turn-on cells based on the plurality of second subfield data in the plurality of subfields having the luminance weight. When the second subfield data are generated using the subfield data of one frame, they will be used to generate the sustain pulses.
- An exemplary plasma display device according to another embodiment of the present invention includes a plurality of row electrodes respectively having a plurality of discharge cells, a controller, and a driver. The controller may divide one frame into a plurality of subfields having respective luminance weights, calculate a screen load ratio from a plurality of video signals corresponding to the one frame, calculate a line load ratio for each subfield of the respective row electrodes from the plurality of video signals corresponding to the respective row electrodes, respectively compensate the plurality of video signals according to the line load ratio of the row electrode in the discharge cell corresponding to the screen load ratio, and generate a plurality of subfield data.
- In this case, the controller may convert the video signal of a first grayscale corresponding to a row electrode having a first line load ratio into first subfield data in a first frame having a first screen load ratio, and convert a video signal of a second grayscale that is equal to the first grayscale corresponding to a row electrode having a second line load ratio that is equal to the first line load ratio into second subfield data that are different from the first subfield data in a second frame having a second screen load ratio that is different from the first screen load ratio.
In addition, the controller may convert the video signal of a first grayscale corresponding to a row electrode having a first line load ratio into first subfield data, and convert the video signal of a second grayscale that is equal to the first grayscale corresponding to a row electrode having a second line load ratio that is different from the first line load ratio into second subfield data that are different from the first subfield data. - An exemplary plasma display device according to a further embodiment of the present invention includes a row electrode at least having a plurality of first discharge cells emitting a first color and a plurality of second discharge cells emitting a second color, a controller, and a driver. The controller divides one frame into a plurality of subfields having respective luminance weights, calculates a line load ratio for each subfield of the row electrode from a plurality of video signals respectively corresponding to the plurality of first and second discharge cells, respectively compensates the plurality of video signals according to the line load ratio and the first and second colors, and generates a plurality of subfield data.
- Embodiments of the present invention are now described by way of example and with reference to the accompanying drawings, of which:
- Figure 1 shows a schematic diagram of a plasma display device according to a first exemplary embodiment of the present invention;
- Figure 2 shows a diagram representing a subfield arrangement according to the first exemplary embodiment of the present invention;
- Figure 3A shows a diagram representing a screen to be displayed;
- Figure 3B shows a diagram representing a screen perceived by eye when the screen shown in Figure 3A is actually displayed;
- Figure 4A, Figure 4B, and Figure 4C show graphs representing luminance variations according to line load ratios for three screen load ratios of 90%, 60%, and 30%, respectively;
- Figure 5 shows a schematic block diagram of a controller according to the first exemplary embodiment of the present invention;
- Figure 6 shows a flowchart representing a method for compensating a luminance in the controller according to the first exemplary embodiment of the present invention;
- Figure 7A shows a diagram representing subfield weights and subfield data before the luminance is compensated in the method shown in Figure 6;
- Figure 7B shows a diagram representing the subfield weights and subfield data after the luminance is compensated in the method shown in Figure 6;
- Figure 8A shows a diagram representing the subfield weights and the subfield data before the luminance is compensated in the method shown in Figure 6;
- Figure 8B shows a diagram representing the subfield weights and subfield data after the luminance is compensated in the method shown in Figure 6;
- Figure 9 shows a schematic diagram of a controller according to a second exemplary embodiment of the present invention;
- Figure 10 shows a flowchart representing a luminance compensation method according to the second exemplary embodiment of the present invention;
- Figure 11 shows a diagram representing the subfield data after the data shown in Figure 8A are compensated in the method shown in Figure 10;
- Figure 12 shows a schematic block diagram of a controller according to a third exemplary embodiment of the present invention;
- Figure 13 shows a flowchart representing a luminance compensation method according to the third exemplary embodiment of the present invention; and
- Figure 14 shows a diagram representing a basic load detection method according to the third exemplary embodiment of the present invention.
- As shown in Figure 1, the plasma display device according to the first exemplary embodiment of the present invention includes a plasma display panel (PDP) 100, a
controller 200, anaddress electrode driver 300, asustain electrode driver 400, and ascan electrode driver 500. - The
PDP 100 includes a plurality of address electrodes (hereinafter, referred to as A electrodes) A1 to Am extending in a column direction, and a plurality of sustain and scan electrodes (hereinafter, referred to as X and Y electrodes) X1 to Xn and Y1 to Yn in pairs extending in a row direction. In general, the X electrodes X1 to Xn respectively correspond to the Y electrodes Y1 to Yn, and neighboring X and Y electrodes form a row electrode. The Y and X electrodes Y1 to Yn and X1 to Xn are arranged perpendicular to the A electrodes A1 to Am, and a discharge space formed at an area where the address electrodes A1 to Am cross the sustain and scan electrodes X1 to Xn and Y1 to Yn forms adischarge cell 110. The electrodes cross over or under and do not intersect. Since phosphor layers of red, green, and blue are alternately formed along a row direction and corresponding to the A electrodes A1 to Am, it is assumed that discharge cells of red, green, and blue are alternately arranged in thePDP 100 along the row direction. - The PDP 100 is driven during frames of time. The
controller 200 divides one frame into a plurality of subfields SF1 to SF11 each having a corresponding luminance weight as shown in Figure 2. Further, each subfield includes an address period and a sustain period. In addition, thecontroller 200 converts a plurality of video data for the plurality ofdischarge cells 110 into subfield data indicating respective light emitting/non-light emitting states in the plurality of subfields SF1 to SF11. In Figure 2, one frame includes 11 subfields SF1 to SF11 respectively having luminance weights of 1, 2, 3, 5, 10, 18, 34, 60, 90, 130, and 158, using which grayscales from 0 to 511 may be expressed. For example, thecontroller 200 may convert video data of 120 grayscale into subfield data of "00110111000". Here, "00110111000" sequentially corresponds to the respective subfields SF1 to SF11, 1 indicates that the discharge cell is light-emitted in the corresponding subfield, and 0 indicates that the discharge cell is not light-emitted in the corresponding subfield. If the subfields are assigned the luminance weights shown in Figure 2, then the grayscale of 120 may be obtained by 0x1+0x2+1x3+1x5+0x10+1x18+1x34+1x60+0x90+0x130+0x158=3+5+18+34+60=120. Thesame grayscale 120, however, may also be obtained by a different combination of subfields during which the discharge cell emits light. - In this case, the
controller 200 measures line load ratios of the row electrodes from the generated subfield data, and determines output estimation weights, also referred to as estimated output weights, of the respective subfields SF1 to SF11 according to the measured line load ratios. The output estimation weights are the updated and newly estimated luminance weights of each subfield. In addition, thecontroller 200 converts the video data to the subfield data according to the measured output estimation weights of the respective subfields SF1 to SF11, and applies driving control signals to the A, X, andY electrode drivers - The A, X, and
Y electrode drivers controller 200. In further detail, during the address period in each subfield, the A, X, andY electrode drivers discharge cells 110. During the sustain period of each subfield, the X and/or theY electrode drivers - A method for compensating luminance by determining the output estimation weight of the respective subfields SF1 to SF11 by the
controller 200 will now be described with reference to Figure 3A to Figure 14. - Luminance variations caused according to a screen load ratio and a line load ratio when a screen is displayed according to the subfield data determined by an initial subfield weight without compensating the luminance according to the first exemplary embodiment of the present invention is first described with reference to Figure 3A, Figure 3B, Figure 4A, Figure 4B, and Figure 4C.
- Figure 3A shows a diagram representing a screen to be displayed, and Figure 3B shows a diagram representing a screen seen and perceived by eye when the screen shown in Figure 3A is actually being displayed. Figure 4A, Figure 4B, and Figure 4C show graphs representing the luminance variations according to line load ratios. As shown in Figure 3A, when on a screen a
quadrangle area 111 is illustrated in black and an area surrounding the quadrangle area is illustrated in white, the line load ratio of a row electrode passing through thequadrangle area 111 is less than the line load ratio of a row electrode that does not pass through thequadrangle area 111. - The number of turn-on cells on the row electrode having the higher load ratio is greater than the number of turn-on cells on the row electrode having the lower load ratio. Therefore, discharge currents according to the sustain discharge are increased on the row electrode having the higher load ratio, and a significant voltage drop occurs on the row electrode having the higher load ratio. As shown in Figure 3B, white luminance of the row electrodes having the higher load ratio (the row electrodes that do not pass through the quadrangle area 111) is reduced to less than the white luminance of the row electrodes having the lower load ratio. That is, a luminance deviation occurs according to the load ratio for each electrode.
- The luminance deviation may vary according to the screen load ratio shown in Figure 4A, Figure 4B, and Figure 4C, because the discharge currents on the row electrodes vary according to the screen load ratio and the discharge currents affect the luminance.
- In further detail, Figure 4A, Figure 4B, and Figure 4C show graphs representing relative luminance variations according to the line load ratio when the screen load ratio is respectively 90%, 60%, and 30%. In the graphs, the vertical axis varies between 90 and 150 and shows a relative luminance assuming that the luminance is 100 when the line load ratio is 100%. The horizontal axis varies from 100% to less than 6%, and shows the value of the line load ratio. In addition, "red", "green", or "blue" labels for the relative luminance curves, respectively indicate cases that the red, green, or blue discharge cells are emitting light; a label of "white" indicates a relative luminance curve when the red, green, and blue discharge cells are emitting together; and a label "average" indicates an average value of the relative luminance for the red, green, and blue discharge cells.
- From Figure 4A, Figure 4B, and Figure 4C, it can be understood that the luminance is increased as the line load ratio of the row electrode is decreased, and the increase in luminance is different for the red, green, and blue discharge cells. In addition, the luminance also varies from figure to figure according to the screen load ratio that is decreasing from 90% in Figure 4A to 60% in Figure 4B and 30% in Figure 4C.
- A method for compensating the luminance deviation according to the first exemplary embodiment of the present invention will now be described with reference to Figure 5, Figure 6, Figure 7A, and Figure 7B.
- Figure 5 shows a schematic block diagram of a
controller 200 according to a first exemplary embodiment of the present invention. Thecontroller 200 includes a screenload ratio calculator 210, asubfield generator 220, a lineload ratio calculator 230, an estimationweight setting unit 240, and asubfield regenerator 250. - The screen
load ratio calculator 210 calculates the screen load ratio from the video data input during one frame. For example, the screenload ratio calculator 210 may calculate the screen load ratio from an average signal level of the video data of one frame. To generate the subfield data, thesubfield generator 220 converts the video data to the subfield data according to the luminance weights of the subfields SF1 to SF11. The lineload ratio calculator 220 calculates the line load ratio of each row electrode for the subfields by using the corresponding subfield data. The line load ratio of each row electrode is calculated by using a ratio of the number of the turn-on cells to the number of all the discharge cells formed along the row electrode. - The estimation
weight setting unit 240 determines an updated estimate of the weights of each of the plurality of subfields SF1 to SF11 for the row electrodes according to the line load ratio of each row electrode, and sets the updated estimate of the weight as a new weight. The updated weights of the subfields are also referred to as output estimation weights or estimated output weights. The subfield regenerator 250 converts the video data to the subfield data according to the updated weight set by the estimationweight setting unit 240. In this case, the updated weight newly set by the estimationweight setting unit 240 is a virtual weight for regenerating the subfield data, and the number of sustain pulses is applied according to the initial luminance weight such as the exemplary set of weights shown in Figure 2. - In addition, as described in the description of Figure 4A to Figure 4C, the relative luminance varies as a function of the line load ratio, the screen load ratio, and the phosphor color. Accordingly, the screen load ratio or the phosphor color, or both may also be used, in addition to the line load ratio, when the estimation
weight setting unit 240 sets the updated subfield weights or the output estimation weights. For example, the estimationweight setting unit 240 may set the subfield weight by using amodel 1, amodel 2, amodel 3, or amodel 4. Only the line load ratio is used inmodel 1; the line load ratio and the phosphor color are used inmodel 2; the line load ratio and the screen load ratio are used inmodel 3; and the line load ratio, the screen load ratio, and the phosphor color are used inmodel 4. - In further detail, average variation ratios (average in Figure 4A to Figure 4C) obtained by averaging luminance variation ratios of red, green, and blue at each screen load ratio are averaged in respective screen load ratio conditions in the
model 1. The luminance variation ratio is applied for the respective red, green, and blue in themodel 2. For example, red luminance variation ratios (red in Figure 4A to Figure 4C) at each screen load ratio are averaged in the respective screen load ratio conditions. In themodel 3 andmodel 4, the screen load ratio conditions are grouped into at least two groups, and themodel 1 and themodel 2 are averaged in each screen load ratio condition for each group. The models may be stored for each condition in the estimationweight setting unit 240 as a lookup table, or may be realized by a logic gate (e.g., a field programmable gate array (FPGA)). Figure 4A, Figure 4B, and Figure 4C, when taken together show the variation of the relative luminance with all three factors of line load ratio that is shown along the horizontal axes, the phosphor colors that each have their corresponding curve, and the screen load ratio that varies from 90% in Figure 4A to 60% in Figure 4B and to 30% in Figure 4C. The three separate drawings of Figure 4A to Figure 4C correspond to model 4 where the impact of each of the three parameters is shown separately. -
Model 2 andModel 3, each show the variation of the relative luminance with two of the three factors. Inmodel 2, the variation is averaged over screen load ratio and inmodel 3 the variation is averaged over phosphor color. The average line appearing in each of the Figure 4A to Figure 4C corresponds to model 3 where the relative luminance is still shown as a function of the line load ratio and the screen load ratio but is averaged over the three colors such that only one average line appears corresponding to all three colors. There are no drawings formodel 2. A drawing formodel 2 would include one plot with three curves for each of the three colors where the curves are averaged over different screen load ratios. Inmodel 1, the relative luminance would be shown only as a function of the line load ratio and would be averaged over both the three phosphor colors and the various screen load ratios. There are no drawings formodel 1.Model 1 may be shown with one plot of relative luminance versus line load ratio that includes one curve only corresponding to an average relative luminance obtained by averaging over the relative luminance values of red, green, and blue phosphors and over the relative luminance values for screen load ratio of 30%, 60%, and 90%. - A method for resetting a subfield weight by using the above models by the estimation
weight setting unit 240 will now be described with reference to Figure 6, Figure 7A, and Figure 7B. - Figure 6 shows a flowchart representing a method for compensating the luminance in the controller according to the first exemplary embodiment of the present invention; Figure 7A shows a diagram representing the subfield weights and subfield data before the luminance is compensated by the method shown in Figure 6; and Figure 7B shows a diagram representing the subfield weight and subfield data after the luminance is compensated by the method shown in Figure 6.
- For better understanding and ease of description, it is assumed that only 10 discharge cells are formed along one row electrode, and the luminance of video data of the first to the tenth discharge cells are respectively 5, 10, 15, 20, 25, 120, 140, 120, 80, and 20 as shown along the left column in Figure 7A and Figure 7B.
Model 1 that is used in Figure 7A and Figure 7B is expressed byEquation 1 which is a regression equation.
- Where, RWi denotes an initial weight of an ith subfield SFi, NWi denotes a converted and updated weight of the ith subfield SFi, and LRi denotes a line load ratio of the ith subfield SFi. As explained above,
model 1 expresses the relative luminance as a function of the line load ratio alone and is averaged over the other two parameters. Therefore, NWi may be expressed as a function of only LRi and a previous value of the subfield weight RWi. - First, as shown in Figure 6 and Figure 7A, the
subfield generator 220 converts the input video data into the subfield data in step 5610, and the lineload ratio calculator 230 calculates the line load ratio LRi of each row electrode for each subfield SFi in step S620. That is, the lineload ratio calculator 230 outputs a ratio of the turn-on cells to all the discharge cells as the line load ratio LRi according to the subfield data, for each row electrode. As shown in Figure 7A, for example, the line load ratio is 30% in a first subfield SF1 since there are 3 turn-on cells out of the total of 10 cells along the row, and the line load ratio is 100% in a second subfield SF2 since there are 10 turn-on cells out of the total 10. - The estimation
weight setting unit 240 uses a predetermined model (e.g., Equation 1), calculates an output estimation weight (updated weight) according to the line load ratio for each of the subfields SF1 to SF11 in step S630, and sets the calculated output estimation weight as a new weight NWi for regenerating the subfield data in step S640. The regenerated and updated output estimation weights are shown as the last row of Figure 7A. These updated weights become the new weights of each of the subfields as shown as the second row of Figure 7B. The subfield regenerator 250 regenerates the subfield data according to the updated new weight NWi in step S650, as shown in Figure 7B. - The new weight NWi set by the estimation
weight setting unit 240 is for regenerating the subfield data, and the number of sustain pulses applied to the subfields SF1 to SF11 when an image is actually displayed is determined by the initial weight RWi. The initial weight RWi for each subfield is shown as the second row of Figure 7A. - Referring back to Figure 7A, there is a large error between a target luminance and an actual luminance as shown in the last four columns of the figure. In Figure 7A, the actual luminance is calculated by using the calculated output estimation weight NWi in the predetermined model for the respective subfields and the subfield data. As shown in Figure 7B, after the luminance is compensated, the error between the actual luminance and the target luminance is reduced. In this case, the actual luminance shown in Figure 7B is obtained when an image is displayed by using the subfield data that is regenerated in step S650. That is, the actual luminance is obtained according to the line load ratio determined by the regenerated subfield data and the output estimation weight in each subfield determined by
Equation 1. - As described, according to the first exemplary embodiment of the present invention, the weight of each subfield is reset according to the line load ratio, and the subfield data are regenerated according to the reset weight to compensate the luminance.
- However, the luminance error may be increased in the luminance compensation method according to the first exemplary embodiment of the present invention. This increase will now be described with reference to Figure 8A and Figure 8B.
- Figure 8A shows a diagram representing the subfield weight and the subfield data before the luminance is compensated in the method shown in Figure 6, and Figure 8B shows a diagram representing the subfield weight and subfield data after the luminance is compensated in the method shown in Figure 6. In Figure 8A and Figure 8B, it is assumed that a 250 grayscale accounts for 17% of one row electrode and a 50 grayscales account for 83% of the one row electrode.
- When the model given as
Equation 1 is used, the output estimation weights of the respective subfields are given as in Figure 8A. That is, the actual weight and the output estimation weight are the same in the subfield having a line load ratio of 100%, but the output estimation weight is higher than the actual weight in the subfield having a line load ratio of less than 100%. In the above condition, the actual luminance of a 50 grayscale is 50, which is the same as the target luminance, but a great difference is generated between the actual luminance and the target luminance of the 250 grayscale since the actual luminance is 289. - In this case, Figure 8B shows that a new weight is set and the subfield data are regenerated according to the first exemplary embodiment of the present invention. When the output estimation weight is calculated again to calculate the actual luminance, the error between the actual and target luminance is reduced since the target luminance of the 250 grayscale is now 256.54, but an error between the actual and target luminance is generated since the target luminance of the 50 grayscale is now 45.54. Particularly, since the line load ratio of an eighth subfield SF8 is greatly changed by the change of the subfield data of the 50 grayscale, there is a great difference between the set weight (33.42) and the output estimation weight 28.4 of the subfield SF8. Accordingly, a large difference is generated in the target luminance.
- An exemplary embodiment for reducing the difference in the present invention will now be described with reference to Figure 9, Figure 10, and Figure 11.
- Figure 9 shows a schematic diagram of a controller 200' according to a second exemplary embodiment of the present invention, and Figure 10 shows a flowchart representing a luminance compensation method according to the second exemplary embodiment of the present invention. Figure 11 shows a diagram representing the subfield data after the data shown in Figure 8A are compensated by the method shown in Figure 10.
- As shown in Figure 9, the controller 200' according to the second exemplary embodiment of the present invention is similar to the
controller 200 of the first embodiment. The controller 200' of the second embodiment, however, further includes a luminanceerror determining unit 260. Moreover, the function of a subfield data generator 250' of the controller 200' is different from the function of thesubfield data generator 250 of thecontroller 200 of the first exemplary embodiment of the present invention. - In further detail, as shown in Figure 10, after the subfield weight is determined in steps S610 to S640 as described in the written description of Figure 6, in step S641 the luminance
error determining unit 260 calculates an error between the actual luminance and the target luminance for the respective grayscales of the plurality of discharge cells of each row electrode. In step S642, the luminanceerror determining unit 260 determines whether the calculated error is less than a threshold value for a corresponding grayscale. In step S643, the subfield regenerator 250' does not regenerate the subfield data for the grayscales having an error that is less than the threshold value. Rather, in step S650, the subfield generator 250' regenerates the subfield data according to the new weight NWi for the grayscales having an error that is greater than the threshold value. - In this case, the threshold value may be equally set for all the grayscales, or a relatively greater threshold value may be set for the higher grayscales. The threshold value for an error ratio may be equally set for all the grayscales. In this case, the error ratio corresponds to an error between the actual luminance and the target luminance divided by the target luminance.
- Referring back to Figure 8A, when the difference between the actual luminance and the target luminance is larger for
grayscale 250 and smaller forgrayscale 50, if according to the approach of the second embodiment, the subfield data are generated only for the 250 grayscale and not for the 50 grayscale, then the results appear in Figure 11. A comparison between Fig. 8B and Fig. 11 shows that by using the approach of the second embodiment, the error between the target luminance and the actual luminance for the 250 and 50 grayscales is reduced. - Referring back to Figure 8A and Figure 8B, when the line load ratio of the 50 grayscale is 83%, corresponding to SF3, a subfield formation used to express the 50 grayscale affects the line load ratio. Accordingly, an error occurs since the line load ratio of each subfield is changed when the subfield formation of the 50 grayscale that affects the line load ratio is changed as shown in Figure 8B. Accordingly, the error may be reduced when the subfield formation is maintained in such grayscales.
- This approach will now be described according to a third embodiment of the present invention with reference to Figure 12, Figure 13, and Figure 14.
- Figure 12 shows a schematic block diagram of a
controller 200" according to the third exemplary embodiment of the present invention, and Figure 13 shows a flowchart representing a luminance compensation method according to the third exemplary embodiment of the present invention. - As shown in Figure 12, the
controller 200" according to the third exemplary embodiment of the present invention is similar to thecontroller 200 of the first embodiment. However, thecontroller 200" further includes a basicload determining unit 270. Further, the functions of an estimationweight setting unit 240" and asubfield regenerator 250" are different from those included in thecontrollers 200 and 200' of the first and second exemplary embodiments of the present invention. A subfield group has a load ratio for affecting the luminance, and the subfield formation of the subfield group may be changed by the compensation method according to the first exemplary embodiment of the present invention shown in Figure 6. Hereinafter, the subfield groups having similar subfield data patterns will be referred to as "basic loads." The subfields forming a basic load may change after each update of the luminance weights of the subfields in order to maintain the load ratio of the basic load. - The basic
load determining unit 270 detects the basic load from the line load ratio determined according to the initial weight and the line load ratio after the compensation is performed by the estimationweight setting unit 240" and thesubfield regenerator 250". The basicload determining unit 270 then sets a subfield range affected by the basic load (hereinafter, called an "estimation subfield range"). The basicload determining unit 270 assumes the line load ratio of the basic load as an estimation line load ratio of a subfield in an estimation subfield range. The estimationweight setting unit 240" resets the subfield weights based on the estimation line load ratio from the basicload determining unit 270. The subfield regenerator 250" regenerates the subfield data according to the reset subfield weight. - As shown in Figure 13, the
subfield regenerator 250" regenerates the subfield data in step S650 after steps S610 to S640 occur as described in Figure 6 with steps S630 and S640 being performed by the estimationweight setting unit 240". Then, the basicload determining unit 270 detects the basic load in steps S661 to S663. Hereinafter, the subfield data generated by thesubfield generator 220 according to the initial weight, in step S620, will be referred to as "initial subfield data," and the subfield data regenerated by thesubfield regenerator 250" in step S650 will be referred to as "first subfield data." - In further detail, in step S661, the basic
load determining unit 270 detects whether a subfield located among subfields of a basic load detection range may be categorized as a basic load or as part of a basic load group of subfields. As shown in Figure 8A and Figure 8B, the luminance is affected more significantly when the line load ratio is changed in a subfield having a high weight. Therefore, the subfields having the higher weights are set as the basic load detection subfields, according to the third exemplary embodiment of the present invention. For example, as shown in Figure 14, six subfields of SF6 to SF11 having the six highest weights, amongst all of the subfields SF1 to SF11, may be set as the basic load detection subfields or the basic load detection range. The basicload determining unit 270, therefore, looks for the subfield or the group of subfields forming the basic load among the basic load detection range. As shown in Figure 14, the basicload determining unit 270 compares the line load ratio determined by the initial subfield data (hereinafter, referred to as a "pre-compensation line load ratio") to the line load ratio determined by the first subfield data (hereinafter, referred to as an "after-compensation line load ratio") in the basic load detection range of subfields. Subfields, within the basic load detection range, having an error between the two line load ratios that is greater than a threshold value may be determined as the basic load group including subfields SF9, SF10, and SF11. The same threshold value may be set for all the subfields. Alternatively, a low threshold value may be set for a subfield having a higher weight since data of the subfield having the higher weight have a greater effect on the luminance. - Subsequently, the basic
load determining unit 270 determines a range of subfields (i.e., an estimation subfield range) that may be affected by the subfields in the basic load in step S662. In this case, the estimation subfield range includes the subfields forming the basic load, and may further include one or more subfields neighboring the subfields forming the basic load. That is, since the load of a subfield having a weight that is higher than the highest weight of the basic load may vary according to the variation of the basic load, the estimation subfield range may include a subfield having a lowest weight among subfields having a weight that is higher than the highest weight of the basic load. In addition, since the load of a subfield having a weight that is lower than the lowest weight of the basic load may vary according to the variation of the basic load, the estimation subfield range may include one or two subfield having a highest weight among subfields having a weight that is lower than the lowest weight of the basic loads. - Subsequently, in step S663, the basic
load determining unit 270 determines the estimation line load ratio of the subfields in the estimation subfield range based on the line load ratio of the basic load. In this case, when there is only one subfield in the basic load group of subfields, the basicload determining unit 270 sets the estimation line load ratio of the subfields in the estimation subfield range to be equal to the higher of the pre-compensation and the after-compensation line load ratios of that one subfield. When there are more than two subfields in the basic load, as shown in Figure 14, the basicload determining unit 270 sets the estimation line load ratio for all the subfields within the estimation subfield range equal to an average of the higher of the pre-compensation and after-compensation line load ratios of the subfields forming the basic load. In other words, first the higher line load ratio for each subfield within the subfields forming the basic load is determined. The higher line load ratio for SF9, SF10, and SF11 are shown, respectively as A, B, and C. Next, these higher line load ratios are averaged and the one average value is set as the estimation line load ratio of all the subfields within the estimation subfield range. For the case shown in Figure 14, (A+B+C)/3 would be set as the line load ratio of all of the subfields within the estimation subfield range. The estimation line load ratio of the subfields outside the estimation subfield range remains at the after-compensation line load ratio. - The estimation
weight setting unit 240" uses the line load ratio set by the basicload determining unit 270 and the above model, and determines the updated subfield weight in step S670. In this case, the estimation line load ratio is used for the subfields in the estimation subfield range, and the after-compensation line load ratios are used for the other subfields. - In step S680, the
subfield regenerator 250" regenerates the subfield data according to the subfield weights that were determined in step S670 by the estimationweight setting unit 240" based on the basic load. In this case, since the line load ratio of the subfields in the estimation subfield range is set high, there is no great change in the weights of the subfields as a result of the resetting of the weights in step S670. Accordingly, since there is no great change in the subfield data of the subfields in the estimation subfield range, the subfield data that is affected by the basic load may be maintained. - As described, according to the second and third exemplary embodiments of the present invention, since the subfield data used for formation of a subfield having a high line load ratio is not greatly changed, an error caused by inaccurate compensation of the luminance may be avoided.
- According to the exemplary embodiments of the present invention, when the luminance is not changed according to the line load ratio, a predetermined luminance may be maintained for the same grayscales regardless of the line load ratio.
- While this invention has been described in connection with certain exemplary embodiments, it is to be understood that the invention is not limited to the disclosed embodiments, but, on the contrary, is intended to cover various modifications and arrangements included within the scope of the appended claims.
Claims (23)
- A driving method for a plasma display device having a plurality of row electrodes and a plurality of discharge cells associated with the plurality of row electrodes, the plasma display device being driven during a time frame, the frame being divided into a plurality of subfields each associated with a luminance weight, the method comprising:determining, for each row electrode, a line load ratio for each subfield, being a ratio of the number of discharge cells to be turned on during the subfield to the total number of discharge cells associated with the row electrode;generating subfield data corresponding to video data based on the line load ratio, the subfield data indicating which of the discharge cells are to be turned on during the subfield; anddriving the discharge cells according to the subfield data.
- The driving method of claim 1, wherein the step of determining the line load ratio comprises:converting the video data into a plurality of initial subfield data indicating which of the discharge cells are to be turned on during the subfield; anddetermining from the plurality of initial subfield data the line load ratio of each subfield.
- The driving method of claim 1 or 2, further comprising:determining an estimated output weight for each subfield in dependence on the line load ratio for the subfield, the estimated output weight comprising an updated luminance weight; andgenerating the subfield data based on the estimated output weights.
- The driving method of claim 3, wherein the step of determining an estimated output weight comprises:calculating the estimated output weight for each of the plurality of subfields from the luminance weight and the line load ratio for each subfield using at least one model for predicting variation of output luminance as a function of variation of the line load ratio.
- The driving method of claim 4, wherein the at least one model comprises a model independent of a screen load ratio calculated from video data corresponding to the frame.
- The driving method of claim 4 or 5,
wherein the plurality of discharge cells include a plurality of first and second discharge cells emitting a first and second colour, respectively, and
wherein the at least one model includes a first model corresponding to the first colour and a second model corresponding to the second colour. - The driving method of claim 4, further comprising
calculating a plurality of screen load ratios from the video data corresponding to a plurality of frames, each screen load ratio corresponding to one frame,
wherein the plurality of screen load ratios are divided into groups according to size, each group corresponding to one size of screen load ratio, and
wherein the at least one model comprises a plurality of first models, each first model corresponding to one of the groups. - The driving method of claim 7,
wherein the plurality of discharge cells comprise a plurality of first and second discharge cells emitting a first and second colour, respectively,
wherein each of the plurality of first models comprises a second model corresponding to the first colour and a third model corresponding to the second colour. - The driving method of claim 1, further comprising:converting the video data corresponding to each of the discharge cells into initial subfield data in response to the luminance weight of each subfield, the video data being associated with a target luminance for each discharge cell;calculating an actual luminance for each of the discharge cells associated with the row electrode from the output estimation weight of each subfield and the subfield data;calculating an error between the target luminance and the actual luminance of each discharge cell;updating the initial subfield data corresponding to a discharge cell having an error greater than a threshold value, thereby generating the subfield data; andmaintaining the initial subfield data corresponding to a discharge cell having an error less than the threshold value, thereby setting the initial subfield data as the subfield data.
- The driving method of claim 9, wherein the threshold value is varied according to a grayscale value.
- The driving method of any one of claims 2 to 8, wherein the line load ratio determined from the initial subfield data comprises a first line load ratio, the method further comprising:determining from the subfield data a second line load ratio for each subfield;detecting a group of subfields as a basic load, each subfield of the group of subfields having an error between the first line load ratio and the second line load ratio greater than a threshold value;compensating the second line load ratio for subfields of the basic load; andsetting a second output estimation weight in response to the compensated second line load ratio, the second output estimation weight being an updated value for the first output estimation weight.
- The driving method of claim 11,
wherein the group of subfields of the basic load are detected from among subfields having a corresponding luminance weight greater than a predetermined weight, and
wherein the threshold value is varied according to the luminance weight of each subfield. - The driving method of claim 11 or 12, further comprising
compensating the second line load ratio for a subfield having a lowest luminance weight among subfields having a luminance weight higher than a highest luminance weight of the subfields of the basic load. - The driving method of claim 11 or 12, further comprising
compensating the second line load ratio for one or two subfields having a highest luminance weight among subfields having a luminance weight lower than a lowest luminance weight of the subfields of the basic load. - The driving method of any one of claims 11 to 14, wherein the compensating of the second line load ratio includes:estimating a maximum value for each subfield within the subfields of the basic load as the greater of the first line load ratio and the second line load ratio;averaging the maximum values to obtain one averaged maximum estimated value; andupdating the second line load ratio of the subfields of the basic load as the one averaged maximum estimated value.
- A plasma display device having a plurality of row electrodes and a plurality of discharge cells associated with the plurality of row electrodes, the plasma display device being driven during a time frame, the frame being divided into a plurality of subfields each associated with a luminance weight, the device comprising:means for determining, for each row electrode, a line load ratio for each subfield, being a ratio of the number of discharge cells to be turned on during the subfield to the total number of discharge cells associated with the row electrode;means for generating subfield data corresponding to video data based on the line load ratio, the subfield data indicating which of the discharge cells are to be turned on during the subfield; andmeans for driving the discharge cells according to the subfield data.
- The plasma display device of claim 16, further comprising:an estimation weight setting unit arranged to determine an estimated output weight for the plurality of subfields in response to the line load ratio of each subfield; wherein the generating means is arranged to generate the subfield data according to the estimated output weight of the plurality of subfields.
- The plasma display device of claim 17, wherein the estimated output weight of each subfield corresponds to an output luminance of the respective subfield having a first line load ratio.
- A plasma display device according to any one of claims 16 to 18, further comprising:means for calculating a screen load ratio from video data corresponding to the one frame, wherein the means for generating the subfield data is dependent on the screen load ratio.
- The plasma display device of claim 19,
wherein the generating means is arranged to convert video data of a first grayscale corresponding to a row electrode having a first line load ratio into first subfield data in a first frame having a first screen load ratio, and
wherein the generating means is arranged to convert video data of a second grayscale corresponding to a row electrode having a second line load ratio into second subfield data in a second frame having a second screen load ratio, the second grayscale being equal to the first grayscale, the second line load ratio being equal to the first line load ratio, the second subfield data being different from the first subfield data, and the second screen load ratio being different from the first screen load ratio. - The plasma display device of claim 19, wherein the generating means is arranged to convert video data of a first grayscale corresponding to a row electrode having a first line load ratio into first subfield data, and to convert the video signal of a second grayscale corresponding to a row electrode having a second line load ratio into second subfield data, the second grayscale being equal to the first grayscale, the second line load ratio being different from the first line load ratio, and the second subfield data being different from the first subfield data.
- A plasma display device according to any one of claims 16 to 21, wherein the row electrode corresponds to a plurality of first discharge cells emitting a first colour and a plurality of second discharge cells emitting a second colour; wherein the means for generating the subfield data is dependent on the colour emitted by the discharge cell.
- The plasma display device of claim 22,
wherein the generating means is arranged to convert video data of a first grayscale corresponding to a first discharge cell of the row electrode into first subfield data, and to convert video data of a second grayscale corresponding to a second discharge cell of the row electrode into second subfield data, the second subfield data being different from the first subfield data, the second grayscale being equal to the first grayscale.
Applications Claiming Priority (1)
| Application Number | Priority Date | Filing Date | Title |
|---|---|---|---|
| KR1020060019236A KR100805105B1 (en) | 2006-02-28 | 2006-02-28 | Plasma display device and driving method thereof |
Publications (2)
| Publication Number | Publication Date |
|---|---|
| EP1826742A1 true EP1826742A1 (en) | 2007-08-29 |
| EP1826742B1 EP1826742B1 (en) | 2014-08-06 |
Family
ID=38120381
Family Applications (1)
| Application Number | Title | Priority Date | Filing Date |
|---|---|---|---|
| EP06122099.2A Active EP1826742B1 (en) | 2006-02-28 | 2006-10-11 | Plasma display device and driving method |
Country Status (3)
| Country | Link |
|---|---|
| US (1) | US8194003B2 (en) |
| EP (1) | EP1826742B1 (en) |
| KR (1) | KR100805105B1 (en) |
Families Citing this family (3)
| Publication number | Priority date | Publication date | Assignee | Title |
|---|---|---|---|---|
| KR100844427B1 (en) | 2007-09-04 | 2008-07-08 | 현대자동차주식회사 | Seat belt wearing detection system and method and method |
| KR100898299B1 (en) * | 2007-11-14 | 2009-05-18 | 삼성에스디아이 주식회사 | Plasma display device and driving method thereof |
| JP5239811B2 (en) * | 2008-12-11 | 2013-07-17 | パナソニック株式会社 | Driving method of plasma display device |
Citations (5)
| Publication number | Priority date | Publication date | Assignee | Title |
|---|---|---|---|---|
| EP1400947A2 (en) * | 2002-09-17 | 2004-03-24 | Lg Electronics Inc. | Method and apparatus for driving plasma display panel |
| US20050200571A1 (en) * | 2004-03-09 | 2005-09-15 | Pioneer Corporation | Display device |
| US20050212727A1 (en) * | 2004-03-29 | 2005-09-29 | Lg Electronics Inc. | Plasma display apparatus and image processing method thereof |
| US20060038748A1 (en) * | 2004-08-17 | 2006-02-23 | Chun-Chueh Chiu | Image processing method for plasma display panel |
| EP1667094A1 (en) * | 2004-12-03 | 2006-06-07 | Fujitsu Hitachi Plasma Display Limited | Image display apparatus and driving method thereof |
Family Cites Families (10)
| Publication number | Priority date | Publication date | Assignee | Title |
|---|---|---|---|---|
| JPH0832903A (en) * | 1994-07-18 | 1996-02-02 | Pioneer Electron Corp | Plasma display device |
| JP3580732B2 (en) * | 1999-06-30 | 2004-10-27 | 富士通株式会社 | Plasma display panel to keep color temperature or color deviation constant |
| JP3877694B2 (en) | 2003-03-28 | 2007-02-07 | 三洋電機株式会社 | Display processing device |
| KR100681653B1 (en) * | 2003-03-31 | 2007-02-09 | 주식회사 대우일렉트로닉스 | PDP's Line Picture Distortion Prevention Method |
| KR100518889B1 (en) * | 2003-07-29 | 2005-09-30 | 엘지전자 주식회사 | Method and apparatus for bright compensation of plasma display panel |
| KR100551049B1 (en) * | 2003-10-23 | 2006-02-09 | 삼성에스디아이 주식회사 | Plasma display panel and driving method and device thereof |
| KR100603312B1 (en) * | 2003-11-24 | 2006-07-20 | 삼성에스디아이 주식회사 | Driving method of plasma display panel |
| KR100552908B1 (en) * | 2003-12-16 | 2006-02-22 | 엘지전자 주식회사 | Driving method and driving apparatus of plasma display panel |
| JP4565877B2 (en) * | 2004-04-16 | 2010-10-20 | 日立プラズマディスプレイ株式会社 | Plasma display device |
| KR100551012B1 (en) * | 2004-05-31 | 2006-02-13 | 삼성에스디아이 주식회사 | Driving apparatus for plasma display panel and driving method thereof |
-
2006
- 2006-02-28 KR KR1020060019236A patent/KR100805105B1/en not_active Expired - Fee Related
- 2006-10-11 EP EP06122099.2A patent/EP1826742B1/en active Active
-
2007
- 2007-02-21 US US11/677,552 patent/US8194003B2/en not_active Expired - Fee Related
Patent Citations (5)
| Publication number | Priority date | Publication date | Assignee | Title |
|---|---|---|---|---|
| EP1400947A2 (en) * | 2002-09-17 | 2004-03-24 | Lg Electronics Inc. | Method and apparatus for driving plasma display panel |
| US20050200571A1 (en) * | 2004-03-09 | 2005-09-15 | Pioneer Corporation | Display device |
| US20050212727A1 (en) * | 2004-03-29 | 2005-09-29 | Lg Electronics Inc. | Plasma display apparatus and image processing method thereof |
| US20060038748A1 (en) * | 2004-08-17 | 2006-02-23 | Chun-Chueh Chiu | Image processing method for plasma display panel |
| EP1667094A1 (en) * | 2004-12-03 | 2006-06-07 | Fujitsu Hitachi Plasma Display Limited | Image display apparatus and driving method thereof |
Non-Patent Citations (1)
| Title |
|---|
| PARK S-H ET AL: "AN OPTIMUM SELECTION OF SUBFIELD PATTERN OF PLASMA DISPLAYS BASED ON GENETIC ALGORITHM", IEICE TRANSACTIONS ON ELECTRONICS, ELECTRONICS SOCIETY, TOKYO, JP, vol. E84-C, no. 11, November 2001 (2001-11-01), pages 1659 - 1666, XP001110776, ISSN: 0916-8524 * |
Also Published As
| Publication number | Publication date |
|---|---|
| US8194003B2 (en) | 2012-06-05 |
| KR100805105B1 (en) | 2008-02-21 |
| EP1826742B1 (en) | 2014-08-06 |
| KR20070089336A (en) | 2007-08-31 |
| US20070200798A1 (en) | 2007-08-30 |
Similar Documents
| Publication | Publication Date | Title |
|---|---|---|
| KR100599747B1 (en) | Driving Device of Plasma Display Panel and Its Gradient Expression Method | |
| KR20080029752A (en) | Multi-gradation display method and device | |
| US20100097413A1 (en) | Plasma display device, and driving method used in the plasma display device | |
| JP4233511B2 (en) | Plasma display panel driving apparatus and gradation expression method thereof | |
| US7453422B2 (en) | Plasma display panel having an apparatus and method for displaying pictures | |
| JP4611880B2 (en) | Plasma display device and image processing method for plasma display device | |
| US8194003B2 (en) | Plasma display device with line load compensation and driving method thereof | |
| KR100560502B1 (en) | Plasma display device and driving method thereof | |
| KR100477972B1 (en) | Plasma display panel and gray display method thereof | |
| WO2011074213A1 (en) | Plasma display device and method for driving plasma display panel | |
| KR20080112908A (en) | Driving method of plasma display device and plasma display panel | |
| US20080252559A1 (en) | Plasma display and a driving method for the display | |
| CN102640204A (en) | Plasma display device and method for driving plasma display panel | |
| KR100502894B1 (en) | Plasma display panel and gray display method thereof | |
| KR100708852B1 (en) | Plasma display device and driving method thereof | |
| US20090115698A1 (en) | Plasma display device and driving method thereof | |
| US20020060652A1 (en) | Data conversion method for displaying an image | |
| EP1768091A1 (en) | Plasma display and device and driving method thereof | |
| KR100551058B1 (en) | Driving apparatus for plasma display panel and driving method thereof | |
| EP1923854A2 (en) | Plasma display and driving method | |
| KR100839378B1 (en) | Plasma display device and driving method thereof | |
| KR100796684B1 (en) | Plasma display device and driving method thereof | |
| KR20050113875A (en) | Driving apparatus of plasma display panel and driving method thereof | |
| CN102656622A (en) | Plasma display device and method for driving plasma display panel | |
| KR20060091208A (en) | Image processing apparatus and image processing method of plasma display panel |
Legal Events
| Date | Code | Title | Description |
|---|---|---|---|
| PUAI | Public reference made under article 153(3) epc to a published international application that has entered the european phase |
Free format text: ORIGINAL CODE: 0009012 |
|
| 17P | Request for examination filed |
Effective date: 20061011 |
|
| AK | Designated contracting states |
Kind code of ref document: A1 Designated state(s): AT BE BG CH CY CZ DE DK EE ES FI FR GB GR HU IE IS IT LI LT LU LV MC NL PL PT RO SE SI SK TR |
|
| AX | Request for extension of the european patent |
Extension state: AL BA HR MK YU |
|
| 17Q | First examination report despatched |
Effective date: 20071213 |
|
| AKX | Designation fees paid |
Designated state(s): DE FR GB |
|
| RIC1 | Information provided on ipc code assigned before grant |
Ipc: G09G 3/20 20060101ALN20090210BHEP Ipc: G09G 3/288 20060101AFI20090210BHEP |
|
| RAP1 | Party data changed (applicant data changed or rights of an application transferred) |
Owner name: SAMSUNG SDI CO., LTD. Owner name: SEOUL NATIONAL UNIVERSITY INDUSTRY FOUNDATION |
|
| GRAP | Despatch of communication of intention to grant a patent |
Free format text: ORIGINAL CODE: EPIDOSNIGR1 |
|
| RAP1 | Party data changed (applicant data changed or rights of an application transferred) |
Owner name: SEOUL NATIONAL UNIVERSITY R&DB FOUNDATION Owner name: SAMSUNG SDI CO., LTD. |
|
| INTG | Intention to grant announced |
Effective date: 20140425 |
|
| RAP1 | Party data changed (applicant data changed or rights of an application transferred) |
Owner name: SEOUL NATIONAL UNIVERSITY R&DB FOUNDATION |
|
| GRAS | Grant fee paid |
Free format text: ORIGINAL CODE: EPIDOSNIGR3 |
|
| GRAA | (expected) grant |
Free format text: ORIGINAL CODE: 0009210 |
|
| AK | Designated contracting states |
Kind code of ref document: B1 Designated state(s): DE FR GB |
|
| REG | Reference to a national code |
Ref country code: GB Ref legal event code: FG4D |
|
| REG | Reference to a national code |
Ref country code: DE Ref legal event code: R096 Ref document number: 602006042569 Country of ref document: DE Effective date: 20140918 |
|
| REG | Reference to a national code |
Ref country code: DE Ref legal event code: R097 Ref document number: 602006042569 Country of ref document: DE |
|
| PLBE | No opposition filed within time limit |
Free format text: ORIGINAL CODE: 0009261 |
|
| STAA | Information on the status of an ep patent application or granted ep patent |
Free format text: STATUS: NO OPPOSITION FILED WITHIN TIME LIMIT |
|
| 26N | No opposition filed |
Effective date: 20150507 |
|
| GBPC | Gb: european patent ceased through non-payment of renewal fee |
Effective date: 20141106 |
|
| REG | Reference to a national code |
Ref country code: FR Ref legal event code: ST Effective date: 20150630 |
|
| PG25 | Lapsed in a contracting state [announced via postgrant information from national office to epo] |
Ref country code: FR Free format text: LAPSE BECAUSE OF NON-PAYMENT OF DUE FEES Effective date: 20141031 |
|
| PG25 | Lapsed in a contracting state [announced via postgrant information from national office to epo] |
Ref country code: GB Free format text: LAPSE BECAUSE OF NON-PAYMENT OF DUE FEES Effective date: 20141106 |
|
| REG | Reference to a national code |
Ref country code: DE Ref legal event code: R082 Ref document number: 602006042569 Country of ref document: DE Representative=s name: VENNER SHIPLEY GERMANY LLP, DE Ref country code: DE Ref legal event code: R082 Ref document number: 602006042569 Country of ref document: DE Representative=s name: VENNER SHIPLEY LLP, DE |
|
| PGFP | Annual fee paid to national office [announced via postgrant information from national office to epo] |
Ref country code: DE Payment date: 20250922 Year of fee payment: 20 |