EP1811498A1 - Speech signal separation apparatus and method - Google Patents

Speech signal separation apparatus and method Download PDF

Info

Publication number
EP1811498A1
EP1811498A1 EP07100711A EP07100711A EP1811498A1 EP 1811498 A1 EP1811498 A1 EP 1811498A1 EP 07100711 A EP07100711 A EP 07100711A EP 07100711 A EP07100711 A EP 07100711A EP 1811498 A1 EP1811498 A1 EP 1811498A1
Authority
EP
European Patent Office
Prior art keywords
separation
time
signals
matrix
frequency domain
Prior art date
Legal status (The legal status is an assumption and is not a legal conclusion. Google has not performed a legal analysis and makes no representation as to the accuracy of the status listed.)
Withdrawn
Application number
EP07100711A
Other languages
German (de)
French (fr)
Inventor
Atsuo Hiroe
Current Assignee (The listed assignees may be inaccurate. Google has not performed a legal analysis and makes no representation or warranty as to the accuracy of the list.)
Sony Corp
Original Assignee
Sony Corp
Priority date (The priority date is an assumption and is not a legal conclusion. Google has not performed a legal analysis and makes no representation as to the accuracy of the date listed.)
Filing date
Publication date
Application filed by Sony Corp filed Critical Sony Corp
Publication of EP1811498A1 publication Critical patent/EP1811498A1/en
Withdrawn legal-status Critical Current

Links

Images

Classifications

    • AHUMAN NECESSITIES
    • A61MEDICAL OR VETERINARY SCIENCE; HYGIENE
    • A61FFILTERS IMPLANTABLE INTO BLOOD VESSELS; PROSTHESES; DEVICES PROVIDING PATENCY TO, OR PREVENTING COLLAPSING OF, TUBULAR STRUCTURES OF THE BODY, e.g. STENTS; ORTHOPAEDIC, NURSING OR CONTRACEPTIVE DEVICES; FOMENTATION; TREATMENT OR PROTECTION OF EYES OR EARS; BANDAGES, DRESSINGS OR ABSORBENT PADS; FIRST-AID KITS
    • A61F11/00Methods or devices for treatment of the ears or hearing sense; Non-electric hearing aids; Methods or devices for enabling ear patients to achieve auditory perception through physiological senses other than hearing sense; Protective devices for the ears, carried on the body or in the hand
    • A61F11/04Methods or devices for enabling ear patients to achieve auditory perception through physiological senses other than hearing sense, e.g. through the touch sense
    • GPHYSICS
    • G10MUSICAL INSTRUMENTS; ACOUSTICS
    • G10LSPEECH ANALYSIS TECHNIQUES OR SPEECH SYNTHESIS; SPEECH RECOGNITION; SPEECH OR VOICE PROCESSING TECHNIQUES; SPEECH OR AUDIO CODING OR DECODING
    • G10L21/00Speech or voice signal processing techniques to produce another audible or non-audible signal, e.g. visual or tactile, in order to modify its quality or its intelligibility
    • G10L21/02Speech enhancement, e.g. noise reduction or echo cancellation
    • G10L21/0272Voice signal separating
    • AHUMAN NECESSITIES
    • A61MEDICAL OR VETERINARY SCIENCE; HYGIENE
    • A61FFILTERS IMPLANTABLE INTO BLOOD VESSELS; PROSTHESES; DEVICES PROVIDING PATENCY TO, OR PREVENTING COLLAPSING OF, TUBULAR STRUCTURES OF THE BODY, e.g. STENTS; ORTHOPAEDIC, NURSING OR CONTRACEPTIVE DEVICES; FOMENTATION; TREATMENT OR PROTECTION OF EYES OR EARS; BANDAGES, DRESSINGS OR ABSORBENT PADS; FIRST-AID KITS
    • A61F11/00Methods or devices for treatment of the ears or hearing sense; Non-electric hearing aids; Methods or devices for enabling ear patients to achieve auditory perception through physiological senses other than hearing sense; Protective devices for the ears, carried on the body or in the hand
    • A61F11/04Methods or devices for enabling ear patients to achieve auditory perception through physiological senses other than hearing sense, e.g. through the touch sense
    • A61F11/045Methods or devices for enabling ear patients to achieve auditory perception through physiological senses other than hearing sense, e.g. through the touch sense using mechanical stimulation of nerves
    • GPHYSICS
    • G08SIGNALLING
    • G08BSIGNALLING SYSTEMS, e.g. PERSONAL CALLING SYSTEMS; ORDER TELEGRAPHS; ALARM SYSTEMS
    • G08B21/00Alarms responsive to a single specified undesired or abnormal condition and not otherwise provided for
    • GPHYSICS
    • G08SIGNALLING
    • G08BSIGNALLING SYSTEMS, e.g. PERSONAL CALLING SYSTEMS; ORDER TELEGRAPHS; ALARM SYSTEMS
    • G08B5/00Visible signalling systems, e.g. visible personal calling systems or remote indication of seats occupied
    • GPHYSICS
    • G10MUSICAL INSTRUMENTS; ACOUSTICS
    • G10LSPEECH ANALYSIS TECHNIQUES OR SPEECH SYNTHESIS; SPEECH RECOGNITION; SPEECH OR VOICE PROCESSING TECHNIQUES; SPEECH OR AUDIO CODING OR DECODING
    • G10L19/00Speech or audio signals analysis-synthesis techniques for redundancy reduction, e.g. in vocoders; Coding or decoding of speech or audio signals, using source filter models or psychoacoustic analysis
    • G10L19/008Multichannel audio signal coding or decoding using interchannel correlation to reduce redundancy, e.g. joint-stereo, intensity-coding or matrixing

Definitions

  • This invention relates to a speech signal separation apparatus and method for separating a speech signal with which a plurality of signals are mixed are separated into the signals using independent component analysis (ICA).
  • ICA independent component analysis
  • ICA independent component analysis
  • the signal (observation signal) X k (t) observed by the kth (1 ⁇ k ⁇ n) microphone k is represented by an expression of summation of results of convolution arithmetic operation of an original signal and a transfer function for all sound sources as represented by the expression (1) given below. Further, where the observation signals of all microphones are represented by a single expression, it is given as the expression (2) specified as below.
  • results of short-time Fourier transform of the signal vectors x(t) and s(t) through a window of the length L are presented by X( ⁇ , t) and S( ⁇ , t), respectively, and results of similar short-time Fourier transform of the matrix A(t) are represented by A( ⁇ )
  • the expression (2) in the time domain can be represented as the expression (3) in the time-frequency domain given below.
  • represents the number of frequency bins (1 ⁇ ⁇ ⁇ M)
  • t represents the frame number (1 ⁇ t ⁇ T).
  • S( ⁇ , t) and A( ⁇ ) are estimated in the time-frequency domain.
  • X ⁇ ⁇ t A ⁇ ⁇ S ⁇ ⁇ t
  • X ⁇ ⁇ t X 1 ( ⁇ , t ) ⁇ X n ( ⁇ , t )
  • S ⁇ ⁇ t S 1 ( ⁇ , t ) ⁇ S n ( ⁇ , t )
  • the number of frequency bins originally is equal to the length L of the window, and the frequency bins individually represent frequency components where the range from -R/2 to R/2 is divided into L portions.
  • R is the sampling frequency.
  • Y( ⁇ , t) represents a column vector which includes results Y k ( ⁇ , t) of short-time Fourier transform of Y k (t) through a window of the length L, and W( ⁇ ) represents an n ⁇ n matrix (separation matrix) whose elements are W ij ( ⁇ ).
  • Y ⁇ ⁇ t W ⁇ ⁇ X ⁇ ⁇ t
  • Y ⁇ ⁇ t Y 1 ( ⁇ , t ) ⁇ Y n ( ⁇ , t )
  • W ⁇ w 11 ( ⁇ ) ⁇ w 1 ⁇ n ( ⁇ ) ⁇ ⁇ ⁇ w n ⁇ 1 ( ⁇ ) ⁇ W nn ( ⁇ )
  • W( ⁇ ) is determined with which Y 1 ( ⁇ , t) to Y n ( ⁇ , t) become statistically independent of each other (actually the independency is maximum) when t is varied while ⁇ is fixed.
  • W( ⁇ ) A( ⁇ ) -1 . If Y 1 ( ⁇ , t) to Y n ( ⁇ , t) which are statistically independent of each other are obtained for all ⁇ , then the separation signals y(t) in the time domain can be obtained by inverse Fourier transforming them.
  • FIG. 8 An outline of conventional independent component analysis in the time-frequency domain is described with reference to FIG. 8.
  • Original signals which are emitted from n sound sources and are independent of each other are represented by s 1 to s n and a vector which includes the original signals s 1 to s n as elements thereof is represented by s.
  • An observation signal x observed by the microphones is obtained by applying the convolution and mixing arithmetic operation of the expression (2) given hereinabove to the original signal s.
  • An example of the observation signal x where the number n of microphones is two, that is, where the number of channels is two, is illustrated in FIG. 9A. Then, short-time Fourier transform is applied to the observation signal x to obtain a signal X in the time-frequency domain.
  • X k ( ⁇ , t) assume complex number values.
  • of X k ( ⁇ , t) in the form of the intensity of the color is referred to as spectrogram.
  • FIG. 9B An example of the spectrogram is shown in FIG. 9B.
  • the axis of abscissa indicates t (frame number) and the axis of ordinate indicates ⁇ (frequency bin number).
  • each frequency bin of the signal X is multiplied by W( ⁇ ) to obtain such separation signals Y as seen in FIG. 9C.
  • the separation signals Y are inverse Fourier transformed to obtain such separation signals y in the time domain as see in FIG. 9D.
  • KL information amount a Kullback-Leibler information amount
  • kurtosis a Kullback-Leibler information amount
  • KL information amount I(X k ( ⁇ ) which is a scale representative of the independency of the separation signals X 1 ( ⁇ ) to Y n ( ⁇ ) is defined as represented by the expression (5) given below.
  • H(Y k ( ⁇ )) in the expression (5) is re-written into the first term of the expression (6) given below in accordance with the definition of entropy, and H(Y( ⁇ )) is developed into the second and third terms of the expression (6) in accordance with the expression (4).
  • P Yk( ⁇ ) (Y k ( ⁇ , t)) represents a probabilistic density function (PDF) of Y k ( ⁇ , t)
  • H(X( ⁇ )) represents the simultaneous entropy of the observation signal X( ⁇ ).
  • the separation process determines a separation matrix W( ⁇ ) with which the KL information amount I(Y( ⁇ )) is minimized.
  • the most basic algorithm for determining the separation matrix W( ⁇ ) is to update a separation matrix based on a natural gradient method as recognized from the expressions (7) and (8) given below. Details of the deriving process of the expressions (7) and (8) are described in Noboru MURATA, "Introduction to the independent component analysis", Tokyo Denki University Press (hereinafter referred to as Non-Patent Document 1), particularly in "3.3.1 Basic Gradient Method”.
  • In represents an n x n unit matrix
  • E t [ ⁇ ] represents an average in the frame direction.
  • the superscript "H” represents an Hermitian inversion (a vector is inverted and elements thereof are replaced by a conjugate complex number).
  • the function ⁇ is differentiation of a logarithm of a probability density function and is called score function (or "activation function").
  • ⁇ in the expression (6) above represents a learning function which has a very low positive value.
  • the probability density function used in the expression (7) above need not necessarily truly reflect the distribution of Y k ( ⁇ , t) but may be fixed. Examples of the probability density function are indicated by the following expressions (10) and (12), and the score functions in this instance are indicated by the following expressions (11) and (13), respectively.
  • the loop processes of the expressions (7) to (9) are repeated many times, then the elements of W( ⁇ ) finally converge to certain values, which make estimated values of the separation matrix. Then, a result when a separation process is performed using the separation matrix makes a final separation signal.
  • a modification value ⁇ W( ⁇ ) of the separation matrix W( ⁇ ) is determined in accordance with the expression (15) above, and W( ⁇ ) is updated in accordance with the expression (8). If the loop processes of the expressions (15), (8) and (9) are repeated many times, then the elements of W( ⁇ ) finally converge to certain values, which make estimated values of the separation matrix. Then, a result when a separation process is performed using the separation matrix makes a final separation signal. In the method in which the expression (15) given above is used, since it involves the orthogonality restriction, the converge is reached by a number of times of execution of the loop processes smaller than that where the expression (7) given hereinabove is used.
  • the signal separation process is performed for each frequency bin as described hereinabove with reference to FIG. 10, but a relationship between the frequency bins is not taken into consideration. Therefore, even if the separation itself results in success, there is the possibility that inconsistency of the separation destination may occur among the frequency bins.
  • FIGS. 12A and 12B An example of the permutation is illustrated in FIGS. 12A and 12B.
  • FIG. 12A illustrates spectrograms produced from two files of "rsm2_mA.wav” and "rsm2_mB.wav” in the WEB page (http://www.cn1.salk.edu/ ⁇ tewon/Blind/blind_audo.html" and represents an example of an observation signal wherein speech and music are mixed.
  • Each spectrogram was produced by Fourier transforming data of 40,000 samples from the top of the file with a shift width of 128 using a Hanning window of a window length of 512.
  • FIG. 12B illustrates spectrograms of separation signals when the two spectrograms of FIG.
  • Non-Patent Document 2 Horoshi SAWADA, Ryo MUKAI, Akiko ARAKI and Shoji MAKINO, "Blind separation or three or more sound sources in an actual environment", 2003 Autumnal Meeting for Reading Papers of the Acoustical Society of Japan, pp.547-548 (hereinafter referred to as Non-Patent Document 2).
  • both methods suffer from a problem of permutation because a signal separation process is performed for each frequency bin.
  • the reference (a) above if such a situation that occasionally the difference between envelopes is unclear depending upon frequency bins occurs, then an error in replacement occurs. Further, if wrong replacement occurs once, then the separation destination is mistaken in all of the later frequency bins. Meanwhile, the reference (b) above has a problem in accuracy in direction estimation and besides requires position information of microphones. Further, although the reference (c) above is advantageous in that the accuracy in replacement is enhanced, it requires position information of microphones similarly to the reference (b). Further, all methods have a problem that, since the two steps of separation and replacement are involved, the processing time is long. From the point of view of the processing time, preferably also the problem of permutation is eliminated at a point of time when the separation is completed. However, this is difficult with the method which uses the post-process.
  • a speech signal separation apparatus for separating an observation signal in a time domain of a plurality of channels wherein a plurality of signals including a speech signal are mixed using independent component analysis to produce a plurality of separation signals of the different channels, including a first conversion section configured to convert the observation signal in the time domain into an observation signal in a time-frequency domain, a non-correlating section configured to non-correlate the observation signal in the time-frequency domain between the channels, a separation section configured to produce separation signals in the time-frequency domain from the observation signal in the time-frequency domain, and a second conversion section configured to convert the separation signals in the time-frequency domain into separation signals in the time domain, the separation section being operable to produce the separation signals in the time-frequency domain from the observation signal in the time-frequency domain and a separation matrix in which initial values are substituted, calculate modification values for the separation matrix using the separation signals in the time-frequency domain, a score function which uses a multi-dimensional probability density function, and the separation matrix, modify
  • a speech signal separation method for separating an observation signal in a time domain of a plurality of channels wherein a plurality of signals including a speech signal are mixed using independent component analysis to produce a plurality of separation signals of the different channels, including the steps of converting the observation signal in the time domain into an observation signal in a time-frequency domain, non-correlating the observation signal in the time-frequency domain between the channels, producing separation signals in the time-frequency domain from the observation signal in the time-frequency domain and a separation matrix in which initial values are substituted, calculating modification values for the separation matrix using the separation signals in the time-frequency domain, a score function which uses a multi-dimensional probability density function, and the separation matrix, modifying the separation matrix using the modification values until the separation matrix substantially converges, and converting the separation signals in the time-frequency domain produced using the substantially converged separation matrix into separation signals in the time domain, each of the separation matrix which includes the initial values and the separation matrix after the modification which includes the modification values being a normal
  • separation signals in the time-frequency domain are produced from the observation signal in the time-frequency domain and a separation matrix in which initial values are substituted.
  • modification values for the separation matrix are calculated using the separation signals in the time-frequency domain, a score function which uses a multi-dimensional probability density function, and the separation matrix.
  • the separation matrix is modified using the modification values until the separation matrix substantially converges.
  • the separation signals in the time-frequency domain produced using the substantially converged separation matrix are converted into separation signals in the time domain.
  • the problem of permutation can be eliminated without performing a post-process after the separation. Further, since the observation signal in the time-frequency domain is non-correlated between the channels in advances and each of the separation matrix which includes the initial values and the separation matrix after the modification which includes the modification values is a normal orthogonal matrix, the separation matrix converges through of a comparatively small number of times of execution of the loop process.
  • the invention is applied to a speech signal separation apparatus which separates a speech signal with which a plurality of signals are mixed into the individual signals using the independent component analysis. While conventionally a separation matrix W( ⁇ ) is used to separate signals for individual frequencies as described hereinabove, in the present embodiment, a separation matrix W is used to separate signals over entire spectrograms as seen in FIG. 1. In the following, particular calculation expressions used in the present embodiment are described, and then a particular configuration of the speech signal separation apparatus of the present invention is applied.
  • Y k (t) represents a column vector produced by cutting out a spectrum of the frame number t from within the spectrogram of the channel number k.
  • Y k t Y k 1 ⁇ t ⁇ Y k M ⁇ t
  • a further restriction of normal orthogonality is provided to the separation matrix W of the expression (17) given above.
  • a restriction represented by the expression (20) given below is applied to the separation matrix W.
  • I nM represents a unit matrix of nM x nM.
  • the restriction to the separation matrix W may be applied for each frequency bin similarly as in the prior art.
  • a pre-process (hereinafter described) of correlating which is applied to an observation signal in advance may be performed for each frequency bin similarly as in the prior art.
  • the scale representative of the independency of a signal is calculated from the entire spectrograms.
  • the KL information amount, kurtosis and so forth are available as the scale representative of the independency of a signal in the independent component analysis, here the KL information amount is used as an example.
  • the KL information amount I(Y) of the entire spectrograms is defined as given by the expression (22) below.
  • a value obtained by subtracting the simultaneous entropy H(Y) regarding all channels from the sum total of the entropy H(Y k ) regarding each channel is defined as the KL information amount I(Y).
  • PY k (Y k (t)) represents the probability density function of Yk(t), and H(X) represents the simultaneous entropy of the observation signals X.
  • Y k Y k 1 ⁇ Y k T
  • a gradient method with the normal orthogonality restriction represented by the expressions (24) to (26) is used.
  • f( ⁇ ) represents an operation by which, when ⁇ W satisfies the normal orthogonality restriction, that is, when W is a normal orthogonal matrix, also W + ⁇ W becomes a normal orthogonal matrix.
  • a modified value ⁇ W of the separation matrix W is determined in accordance with the expression (24) above and the separation matrix W is updated in accordance with the expression (25), and then the updated separation matrix W is used to produce a separation signal in accordance with the expression (26). If the loop processes of the expressions (24) to (26) are repeated many times, then the elements of the separation matrix W finally converge to certain values, which make estimated values of the separation matrix. Then, a result when the separation process is performed using the separation matrix makes a final separation signal. Particularly in the present embodiment, a KL information amount is calculated from the entire spectrograms, and the separation matrix W is used to separate signals over the entire spectrograms. Therefore, no permutation occurs with the separation signals.
  • the matrix ⁇ W is a discrete matrix similarly to the separation matrix W, it has a comparatively high efficiency if an expression for updating non-zero elements is used. Therefore, the matrices ⁇ W( ⁇ ) and W( ⁇ ) which are composed only of elements of an ⁇ th frequency bin are defined as represented by the expressions (27) and (28) given below, and the matrix ⁇ W( ⁇ ) is calculated in accordance with the expression (29) given below. If this expression (2) is defined for all ⁇ , then this results in calculation of all non-zero elements in the matrix ⁇ W.
  • the W + ⁇ W determined in this manner has a form of a normal orthogonal matrix.
  • the function ⁇ k ⁇ (Y k (t)) is partial differentiation of a logarithm of the probability density function with the ⁇ th argument as in the expression (31) above and is called score function (or activation function).
  • score function or activation function
  • the score function is a multi-dimensional (multi-variable) function.
  • One of methods of deriving a score function is to construct a multi-dimensional probability density function in accordance with the expression (32) given below and differentiate a logarithm of the multi-dimensional probability density function.
  • h is a constant for adjusting the sum total of the probability to 1.
  • f( ⁇ ) represents an arbitrary scalar function.
  • a score function may be construct so as to satisfy the following conditions i) and ii). It is to be noted that the expressions (35) and (37) satisfy the conditions i) and ii).
  • the return value of the score function ⁇ k ⁇ (Y k (t)) is a dimensionless amount signifies that, where the unit of ⁇ k ⁇ (Y k (t)) is represented by [x], [x] cancels between the numerator and the denominator of the score function and the return value does not include the dimension of [x] (where n is a real number, whose unit is described as [X n ]).
  • phase of the return value of the function ⁇ k ⁇ (Y k (t)) is opposite to the phase of the ⁇ th argument Y k ( ⁇ , t) represents that arg ⁇ k ⁇ (Y k (t)) ⁇ -arg ⁇ k ⁇ (Y k ( ⁇ , t)) is satisfied with any Y k ( ⁇ , t).
  • arg ⁇ z ⁇ represents a phase component of the complex number z.
  • the score function is defined as a differential of logP Yk (Y k (t)), that the phase of the return value is "opposite" to the phase of the ⁇ th argument makes a condition of the score function.
  • the score function is defined otherwise as a differential of log(1/P Yk (Y k (t)))
  • that the phase of the return value is "same" as the phase of the ⁇ th argument makes a condition of the score function.
  • the score function relies only upon the phase of the ⁇ th argument.
  • the expression (39) is a generalized form of the expression (35) given hereinabove with regard to N so that separation can be performed without permutation also in any norm other than the L2 norm.
  • the expression (40) is a generalized form of the expression (37) given hereinabove with regard to N.
  • L and m are positive constants and may be, for example, 1.
  • a is a constant for preventing division by zero and has a non-negative value.
  • ⁇ k ⁇ ⁇ Y k t - Klm tanh K ⁇ Y k t ⁇ ⁇ N m ⁇ Y k ⁇ ⁇ t ⁇ Y k t ⁇ N + a L Y k ⁇ ⁇ t Y k ⁇ ⁇ t
  • L ⁇ 0 , a ⁇ 0 ⁇ k ⁇ ⁇ Y k t - K ⁇ Y k ⁇ ⁇ t ⁇ Y k t ⁇ N + a L Y k ⁇ ⁇ t Y k ⁇ ⁇ t L ⁇ 0
  • a further generalized score function is given as the expression (41) below.
  • g(x) is a function which satisfies the following conditions iii) to vi).
  • g(x) which provide success in separation are given below as the expressions (42) to (46).
  • the constant terms are determined so as to satisfy the conditions iii) to v) given hereinabove.
  • g x b ⁇ tanh Kx
  • m is a constant independent of the channel number k and the frequency bin number ⁇ , but may otherwise vary depending upon k or ⁇ .
  • m may be replaced by m k ( ⁇ ) as in the expression (47) given below.
  • m k ( ⁇ ) is used in this manner, the scale of Y k ( ⁇ , t) upon convergence can be adjusted to some degree.
  • ⁇ k ⁇ ⁇ Y k t - m k ( ⁇ ) g K ⁇ ⁇ Y k t ⁇ N ⁇
  • the absolute value of a complex number may otherwise be approximated with an absolute value of the real part or the imaginary part as given by the expression (48) or (49) below, or may be approximated with the sum of the absolute values as given by the expression (50).
  • the value of the L N norm almost depends upon a component of Y k (t) which has a high absolute value
  • the L N norm upon calculation of the L N norm, not all components of Y k (t) may be used, but only x% of a comparatively high order of a high absolute value component or components may be used.
  • the high order x% can be determined in advance from a spectrogram of an observation signal.
  • a further generalized score function is given as the expression (54) below.
  • This score function is represented by the product of a function f(Y k (t)) wherein a vector Y k (t) is an argument, another function g(Y k ( ⁇ , t)) wherein a scalar Y k ( ⁇ , t) is an argument, and the term -Y k ( ⁇ , t) for determining the phase of the return value (f( ⁇ ) and g( ⁇ ) are different from the functions described hereinabove).
  • f(Y k (t) and g(Y k ( ⁇ , t)) are determined so that the product of them satisfies the following conditions vii) and viii) with regard to any Y k (t) and Y k ( ⁇ , t).
  • the phase of the score function becomes same as that of -Y k ( ⁇ , t), and the condition that the phase of the return value of the score function is opposite to the phase of the ⁇ th argument is satisfied. Further, from the condition viii) above, the dimension is canceled with that of Y k ( ⁇ , t), and the condition that the return value of the score function is a dimensionless amount is satisfied.
  • the speech signal separation apparatus generally denoted by 1 includes n microphones 10 1 to 10 n for observing independent sounds emitted from n sound sources, and an A/D (Analog/Digital) converter 11 for A/D converting the sound signals to obtain an observation signal.
  • a short-time Fourier transform (F/G) section 12 short-time Fourier transforms the observation signal to produce spectrogram of the observation signal.
  • a standardization and non-correlating section 13 performs a standardization process (adjustment of the average and the variance) and a non-correlating process (non-correlating between channels) for the spectrograms of the observation signal.
  • a signal separation section 14 makes use of signal models retained in a signal model retaining section 15 to separate the spectrograms of the observation signals into spectrograms based on independent signals.
  • a signal model particularly is a score function described hereinabove.
  • a rescaling section 16 performs a process of adjusting the scale among the frequency bins of the spectrograms of the separation signals. Further, the rescaling section 16 performs a process of canceling the effect of the standardization process on the observation signal before the separation process.
  • An inverse Fourier transform section 17 performs an inverse Fourier transform process to convert the spectrograms of the separation signals into separation signals in the time domain.
  • a D/A conversion section 18 D/A converts the separation signals in the time domain, and n speakers 19 1 to 19 n reproduce sounds independent of each other.
  • step S1 Sound signals are observed through the microphones, and at step S2, the observation signal is short-time Fourier transformed to obtain spectrograms. Then at step S3, a standardization process and a non-correlating process are performed for the spectrograms of the observation signals.
  • the standardization here is an operation of adjusting the average and the standard deviation of the frequency bins to zero and one, respectively. An average value is subtracted for each frequency bin to adjust the average to zero, and the standardization deviation can be adjusted to 1 by dividing resulting spectrograms by the standard deviations.
  • the non-correlating is also called whitening or sphering and is an operation of reducing the correlation between channels to zero.
  • the non-correlating may be performed for each frequency bin similarly as in the prior art.
  • This variance-covariance matrix ⁇ ( ⁇ ) can be represented as given by the expression (56) below using the unique vector P k ( ⁇ ) and a characteristic value ⁇ k ( ⁇ ).
  • a separation process is performed for the standardized and non-correlated observation signal.
  • a separation matrix W and a separation signal Y are determined.
  • the separation signal Y obtained at step S4 exhibits scales which are different among different frequency bins although it does not suffer from permutation.
  • a rescaling process is performed to adjust the scale among the frequency bins.
  • a process of restoring the averages and the standard deviations which have been varied by the standardization process is performed. It is to be noted that details of the rescaling process at step S5 are hereinafter described.
  • the separation signals after the rescaling process at step S5 are converted into separation signals in the time domain, and at step S7, the separation signals in the time domain are reproduced from the speakers.
  • X(t) in FIG. 5 is a standardized and non-correlated observation signal and corresponds to X'(t) of FIG. 4.
  • initial values are substituted into a separation matrix W.
  • the initial values are a normal orthogonal matrix.
  • converged values in the preceding operation cycle may be used as the initial values in the present operation cycle. This can reduce the number of times of a loop process before convergence.
  • step S12 it is decided whether or not W exhibits convergence. If W exhibits convergence, then the processing is ended, but if W does not exhibit convergence, then the processing advances to step S13.
  • step S13 the separation signals Y at the point of time are calculated, and at step S14, ⁇ W is calculated in accordance with the expression (29) given hereinabove. Since this ⁇ W is calculated for each frequency bin, a loop process is repetitively performed while the expression (2) is applied to each value of ⁇ . After ⁇ W is determined, W is updated at step S15, whereafter the processing returns to step S12.
  • the updating process of W is performed until W converges, the updating process of W may otherwise be repeated by a sufficiently great predetermined number of times.
  • a signal of the SIMO (Single Input Multiple Output) format is produced from results of separation (whose scales are not uniform).
  • This method is expansion of a rescaling method for each frequency bin described in Noboru Murata and Shiro Ikeda, "An on-line algorithm for blind source separation on speed signals", Proceedings of 1998 International Symposium on Nonlinear Theory and its Applications (NOLTA '98), pp.923-926, Crans-Montana, Switzerland, September 1998 (http:llwww.ism.ac./jp ⁇ shiro/papers/conferences/nolta1998.pdf ) to scaling of the entire spectrograms using the separation matrix W of the expression (17) given hereinabove.
  • X Yk (t) An element of the observation signal vector X(t) which originates from the kth sound source is represented by X Yk (t).
  • X Yk (t) can be determined by assuming a state that only the kth sound source emits sound and applying a transfer function to the kth sound source. If results of separation of the independent component analysis are used, then the state that only the kth sound source emits sound can be represented by setting the elements of the vector of the expression (19) given hereinabove other than Y k (t) to zero, and the transfer function can be represented as an inverse matrix of the separation matrix W. Accordingly, X Yk (t) can be determined in accordance with the expression (58) given below.
  • Q is a matrix for the standardization and non-correlating of an observation signal.
  • the second term on the right side is the vector of the expression (19) given hereinabove in which the elements other that Y k (t) are set to zero.
  • X Yk (t) determined in this manner, the instability of the scale is eliminated.
  • X Yk t WQ - 1 0 Y k t 0
  • the second method of rescaling is based on the minimum distortion principle. This is expansion of the rescaling method for each frequency bin described in K. Matuoka and S. Nakashima, "Minimal distortion principle for blind source separation", Proceedings of International Conference on INDEPENDENT COMPONENT ANALYSIS and BLIND SIGNAL SEPARATION (ICA 2001), 2001, pp.722-727 (http://ica2001.ucsd.edu/index_files/pdfs/099-matauoka.pdf ) to rescaling of the entire spectrograms using the separation matrix W of the expression (17) given hereinabove.
  • the third method of rescaling utilizes independency of a separation signal and a residual signal as described below.
  • a signal ⁇ k ( ⁇ )Y k ( ⁇ , t) obtained by multiplying a separation result Y k ( ⁇ , t) at the channel number k and the frequency bin number ⁇ by a scaling coefficient ⁇ k ( ⁇ ) and a residual X k ( ⁇ , t) - ⁇ k ( ⁇ )Y k ( ⁇ , t) of the separation result Y k ( ⁇ , t) from the observation signal are assumed. If ⁇ k ( ⁇ ) has a correct value, then the factor of Y k ( ⁇ , t) must disappear completely from the residual X k ( ⁇ , t) - ⁇ k ( ⁇ )Y k ( ⁇ , t). Then, ⁇ k ( ⁇ )Y k ( ⁇ , t) at this time represents estimation of one of the original signals observed through the microphones including the scale.
  • the instability of the scale disappears if the scaling factor ⁇ k ( ⁇ ) which satisfies the expression (60) given below is determined and Y k ( ⁇ , t) is multiplied by the thus determined scaling factor ⁇ k ( ⁇ ).
  • the expression (61) is obtained as a condition which should be satisfied by the scaling factor ⁇ k ( ⁇ ).
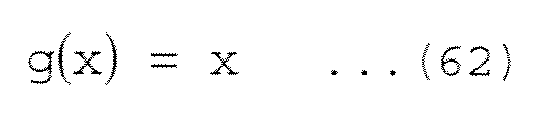
  • g(x) of the expression (61) may be an arbitrary function, and, for example, any of the expressions (62) to (65) given below can be used as g(x). If ⁇ k ( ⁇ )Y k ( ⁇ , t) is used in place of Y k ( ⁇ , t) as a separation result, then the instability of the scale is eliminated.
  • FIG. 6A illustrates spectrograms produced from the two files of "rsm2_mA,wav” and "rsm2_mB.wav” mentioned hereinabove and represents an example of an observation signal wherein speech and music are mixed with each other.
  • FIG. 6B illustrates results where the two spectrograms of FIG. 6A are used as an observation signal and the updating expression given as the expression (29) above and the score function of the expression (37) given hereinabove are used to perform separation.
  • the other conditions are similar to those described hereinabove with reference to FIG. 12.
  • FIG. 6B while permutation occurs where the conventional method is used (FIG. 12B), no permutation occurs where the separation method according to the present embodiment is used.
  • the separation matrix W is used to separate signals over the entire spectrograms. Consequently, the problem of permutation can be eliminated without performing a post-process after the separation.
  • the separation matrix W can be determined through a reduced number of times of execution of a loop process when compared with that in an alternative case wherein no normal orthogonality restriction is provided.
  • the learning coefficient ⁇ in the expression (25) given hereinabove is a constant
  • the value of the learning coefficient ⁇ may otherwise be varied adaptively depending upon the value of ⁇ W.
  • may be set to a low value to prevent an overflow of W, but where ⁇ W is proximate to a zero matrix (where W approaches converging points), ⁇ may be set to a high value to accelerate convergence to the converging points.
  • N is calculated as a norm of a matrix ⁇ W, for example, in accordance with the expression (68) given below.
  • the learning coefficient ⁇ is represented as a function of
  • N is calculated similarly also with regard to W in addition to ⁇ W, and a ratio between them, that is,
  • N 2 can be used.
  • a is an arbitrary positive value and is a parameter for adjusting the degree of decrease of f( ⁇ ).
  • f x ⁇ 0 ax L
  • 1 f x ⁇ 0 cosh ax L
  • f x ⁇ 0 exp - ax L
  • signals of the entire spectrograms that is, signals of all frequency bins of the spectrograms.
  • a frequency bin in which little signals exist over all channels has little influence on separation signals in the time domain irrespective of whether the separation results in success or in failure. Therefore, if such frequency bins are removed to degenerate the spectrograms, then the calculation amount can be reduced and the speed of the separation can be raised.
  • a method of degenerating a spectrogram As a method of degenerating a spectrogram, the following example is available.
  • spectrograms of an observation signal it is decided whether or not the absolute value of the signal is higher than a predetermined threshold value for each frequency bin.
  • a frequency bin in which the signal is lower than the threshold value in all frames and in all channels is decided as a frequency in which no signal exists, and the frequency bin is removed from the spectrograms.
  • a method of calculating the intensity D( ⁇ ) of a signal for example, in accordance with the expression (75) given below for each frequency bin and adopting M - m frequency bins which exhibit comparatively high signal intensities (removing m frequency bins which exhibit comparatively low signal intensities) is available.
  • the present invention can be applied also to another case wherein the number of microphones is greater than the number of sound sources.
  • the number of microphones can be reduced down to the number of sound sources, for example, if principal component analysis (PCA) is used.
  • PCA principal component analysis
  • separation signals are used for speech recognition and so forth.
  • the inverse Fourier transform process may be omitted suitably.
  • separation signals are used for speech recognition, it is necessary to specify which one of a plurality of separation signals represents speech. To this end, for example, one of methods described below may be used.

Landscapes

  • Engineering & Computer Science (AREA)
  • Health & Medical Sciences (AREA)
  • Physics & Mathematics (AREA)
  • Biomedical Technology (AREA)
  • Acoustics & Sound (AREA)
  • Life Sciences & Earth Sciences (AREA)
  • Neurology (AREA)
  • General Health & Medical Sciences (AREA)
  • Computational Linguistics (AREA)
  • Otolaryngology (AREA)
  • Psychology (AREA)
  • Heart & Thoracic Surgery (AREA)
  • Vascular Medicine (AREA)
  • Animal Behavior & Ethology (AREA)
  • Physiology (AREA)
  • Public Health (AREA)
  • Veterinary Medicine (AREA)
  • General Physics & Mathematics (AREA)
  • Biophysics (AREA)
  • Quality & Reliability (AREA)
  • Signal Processing (AREA)
  • Audiology, Speech & Language Pathology (AREA)
  • Human Computer Interaction (AREA)
  • Multimedia (AREA)
  • Business, Economics & Management (AREA)
  • Emergency Management (AREA)
  • Circuit For Audible Band Transducer (AREA)
  • Complex Calculations (AREA)
  • Compression, Expansion, Code Conversion, And Decoders (AREA)
  • Auxiliary Devices For Music (AREA)

Abstract

A speech signal separation apparatus for separating an observation signal in a time domain of a plurality of channels wherein a plurality of signals having a speech signal are mixed using independent component analysis to produce a plurality of separation signals of the different channels, including: a first conversion section (11), a non-correlating section (13), a separation section (14), and a second conversion section (18).

Description

    BACKGROUND OF THE INVENTION 1. Field of the Invention
  • This invention relates to a speech signal separation apparatus and method for separating a speech signal with which a plurality of signals are mixed are separated into the signals using independent component analysis (ICA).
  • 2. Description of the Related Art
  • A technique of independent component analysis (ICA) of separating and reconstructing a plurality of original signals using only statistic independency from a signal in which the original signals are mixed linearly with unknown coefficients attracts notice in the field of signal processing. By applying the independent component analysis, a speech signal can be separated and reconstructed even in such a situation that, for example, a speaker and a microphone are located at places spaced from away from each other and the microphone picks up sound other than the speech of the speaker.
  • Here, it is investigated to separate a speech signal with which a plurality of signals are mixed into the individual signals using the independent component analysis in the time-frequency domain.
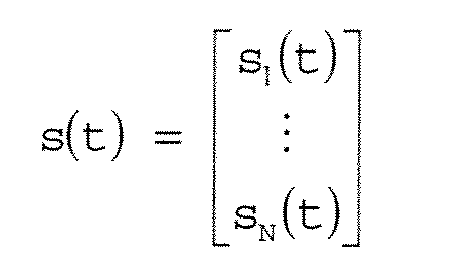
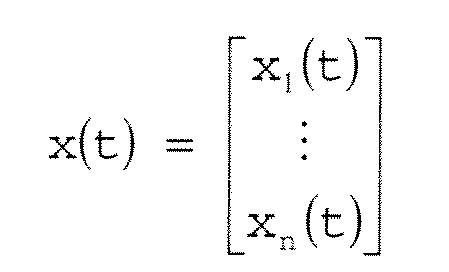
  • It is assumed that, as seen in FIG. 7, different sounds are emitted individually from N sound sources and are observed using n microphones. Sound (original signal) emitted from a sound source is subject to time delay, reflection and so forth before it reaches a microphone. Therefore, the signal (observation signal) Xk(t) observed by the kth (1 ≤ k ≤ n) microphone k is represented by an expression of summation of results of convolution arithmetic operation of an original signal and a transfer function for all sound sources as represented by the expression (1) given below. Further, where the observation signals of all microphones are represented by a single expression, it is given as the expression (2) specified as below. In the expressions (1) and (2), x(t) and s(t) are column vectors which include Xk(t) and Sk(t) as elements thereof, respectively, and A represents an n × N matrix which includes elements aij(t). It is to be noted that, in the following description, it is assumed that N = n. x k t = j = 1 N τ = 0 a kj τ s j t - τ = j = 1 N a kj * s j t
    Figure imgb0001
    x t = A * s t
    Figure imgb0002

    where s t = s 1 ( t ) s N ( t )
    Figure imgb0003
    x t = x 1 ( t ) x n ( t )
    Figure imgb0004
    A t = a 11 ( t ) a 1 N ( t ) a n 1 ( t ) a nN ( t )
    Figure imgb0005
  • In the independent component analysis in the time-frequency domain, not A and s(t) are estimated from x(t) of the expression (2) given above, but x(t) is converted into a signal in a time-frequency domain, and signals corresponding to A and s(t) are estimated from the signal in the time-frequency domain. In the following, a method of the estimation is described.
  • Where results of short-time Fourier transform of the signal vectors x(t) and s(t) through a window of the length L are presented by X(ω, t) and S(ω, t), respectively, and results of similar short-time Fourier transform of the matrix A(t) are represented by A(ω), the expression (2) in the time domain can be represented as the expression (3) in the time-frequency domain given below. It is to be noted that ω represents the number of frequency bins (1 ≤ ω ≤ M), and t represents the frame number (1 ≤ t ≤ T). In the independent component analysis in the time-frequency domain, S(ω, t) and A(ω) are estimated in the time-frequency domain. X ω t = A ω S ω t
    Figure imgb0006

    where X ω t = X 1 ( ω , t ) X n ( ω , t )
    Figure imgb0007
    S ω t = S 1 ( ω , t ) S n ( ω , t )
    Figure imgb0008
  • It is to be noted that the number of frequency bins originally is equal to the length L of the window, and the frequency bins individually represent frequency components where the range from -R/2 to R/2 is divided into L portions. Here, R is the sampling frequency. It is to be noted that a negative frequency component is a c conjugate complex number of a positive frequency component and can be represented by X(-ω) = conj(X(ω)) (conj(·) is a conjugate complex number). Therefore, in the present specification, only non-negative frequency components from 0 to R/2 (the number of frequency bins is L/2 + 1) are taken into consideration, and the numbers from 1 to M (M = L/2 + 1) are applied to the frequency components.
  • In order to estimate S(ω, t) and A(ω) in the time-frequency domain, for example, such an expression as the expression (4) given below is considered. In the expression (4), Y(ω, t) represents a column vector which includes results Yk(ω, t) of short-time Fourier transform of Yk(t) through a window of the length L, and W(ω) represents an n × n matrix (separation matrix) whose elements are Wij(ω). Y ω t = W ω X ω t
    Figure imgb0009

    where Y ω t = Y 1 ( ω , t ) Y n ( ω , t )
    Figure imgb0010
    W ω = w 11 ( ω ) w 1 n ( ω ) w n 1 ( ω ) W nn ( ω )
    Figure imgb0011
  • Then, W(ω) is determined with which Y1(ω, t) to Yn(ω, t) become statistically independent of each other (actually the independency is maximum) when t is varied while ω is fixed. As hereinafter described, since the independent component analysis in the time-frequency domain exhibits instability in permutation, a solution exists in addition to W(ω) = A(ω)-1. If Y1(ω, t) to Yn(ω, t) which are statistically independent of each other are obtained for all ω, then the separation signals y(t) in the time domain can be obtained by inverse Fourier transforming them.
  • An outline of conventional independent component analysis in the time-frequency domain is described with reference to FIG. 8. Original signals which are emitted from n sound sources and are independent of each other are represented by s1 to sn and a vector which includes the original signals s1 to sn as elements thereof is represented by s. An observation signal x observed by the microphones is obtained by applying the convolution and mixing arithmetic operation of the expression (2) given hereinabove to the original signal s. An example of the observation signal x where the number n of microphones is two, that is, where the number of channels is two, is illustrated in FIG. 9A. Then, short-time Fourier transform is applied to the observation signal x to obtain a signal X in the time-frequency domain. Where elements of the signal X are represented by Xk(ω, t), Xk(ω, t) assume complex number values. A chart which represents the absolute values |Xk(ω, t)| of Xk(ω, t) in the form of the intensity of the color is referred to as spectrogram. An example of the spectrogram is shown in FIG. 9B. In FIG. 9B, the axis of abscissa indicates t (frame number) and the axis of ordinate indicates ω (frequency bin number). Then, each frequency bin of the signal X is multiplied by W(ω) to obtain such separation signals Y as seen in FIG. 9C. Then, the separation signals Y are inverse Fourier transformed to obtain such separation signals y in the time domain as see in FIG. 9D.
  • It is to be noted that, in the following description, also Yk(ω, t) and Xk(ω, t) themselves which are signals in the independent component analysis are each represented as "spectrogram".
  • Here, as the scale for representing the independency of a signal in the independent component analysis, a Kullback-Leibler information amount (Hereinafter referred to as "KL information amount"), a kurtosis and so forth are available. However, the KL information amount is used here as an example.
  • Attention is paid to a certain frequency bin as seen in FIG. 10. Where Yk(ω, t) when the frame number t thereof is varied within the range from 1 to T is represented by Yk(ω), the KL information amount I(Xk(ω) which is a scale representative of the independency of the separation signals X1(ω) to Yn(ω) is defined as represented by the expression (5) given below. In particular, the value obtained when the simultaneous entropy H(Yk(ω)) for each frequency bin (= ω) for all channels is subtracted from the sum total of the entropy H(Yk(ω)) for the frequency bins (= ω) for the individual channels is defined as KL information amount I(Y(ω)). A relationship between H(Yk(ω)) and H(Y(ω)) where n = 2 is illustrated in FIG. 11. H(Yk(ω)) in the expression (5) is re-written into the first term of the expression (6) given below in accordance with the definition of entropy, and H(Y(ω)) is developed into the second and third terms of the expression (6) in accordance with the expression (4). In the expression (6), PYk(ω)(Yk(ω, t)) represents a probabilistic density function (PDF) of Yk(ω, t), and H(X(ω)) represents the simultaneous entropy of the observation signal X(ω). I Y ω = k = 1 n H Y k ω - H Y ω
    Figure imgb0012
    = k = 1 n E t [ - log P Yk ω Y k ω t ] - log | det W ω | - H X ω
    Figure imgb0013
    where Y k ω = Y k ( ω , 1 ) Y k ω T
    Figure imgb0014
    Y ω = Y 1 ( ω ) Y n ( ω )
    Figure imgb0015
    X ω = X ω 1 X ω T
    Figure imgb0016
  • Since the KL information amount I(Y(ω)) exhibits a minimum value (ideally zero) where Y1(ω) to Yn(ω) are independent of each other, the separation process determines a separation matrix W(ω) with which the KL information amount I(Y(ω)) is minimized.
  • The most basic algorithm for determining the separation matrix W(ω) is to update a separation matrix based on a natural gradient method as recognized from the expressions (7) and (8) given below. Details of the deriving process of the expressions (7) and (8) are described in Noboru MURATA, "Introduction to the independent component analysis", Tokyo Denki University Press (hereinafter referred to as Non-Patent Document 1), particularly in "3.3.1 Basic Gradient Method". ΔW ω = I n + E t φ ( Y ω t ) Y ω t H W ω
    Figure imgb0017
    W ω W ω + η ΔW ω
    Figure imgb0018
    where Y ω t = W ω X ω t
    Figure imgb0019
    φ Y ω t = φ 1 Y 1 ω t φ n Y n ω t
    Figure imgb0020
    φ k Y k ω t = Y k ω t log P Yk ω Y k ω t
    Figure imgb0021
  • In the expression (7) above, In represents an n x n unit matrix, and Et[·] represents an average in the frame direction. Further, the superscript "H" represents an Hermitian inversion (a vector is inverted and elements thereof are replaced by a conjugate complex number). Further, the function ϕ is differentiation of a logarithm of a probability density function and is called score function (or "activation function"). Further, η in the expression (6) above represents a learning function which has a very low positive value.
  • It is to be noted that it is known that the probability density function used in the expression (7) above need not necessarily truly reflect the distribution of Yk(ω, t) but may be fixed. Examples of the probability density function are indicated by the following expressions (10) and (12), and the score functions in this instance are indicated by the following expressions (11) and (13), respectively. P Yk ω Y k ω t = 1 cosh Y k ω t
    Figure imgb0022
    φ k ( Y k ω t ) = - tanh Y k ω t Y k ω t Y k ω t
    Figure imgb0023
    P Yk ω ( Y k ω t ) = exp - Y k ( ω , t )
    Figure imgb0024
    φ k = Y k w t = - Y k ω t Y k ( ω , t )
    Figure imgb0025
  • According to the natural gradient method, a modification value ΔW(ω) of the separation matrix W(ω) in accordance with the expression (7) given hereinabove, and then W(ω) is updated in accordance with the expression (8) given above, whereafter the updated separation matrix W(ω) is used to produce a separation signal in accordance with the expression (9). If the loop processes of the expressions (7) to (9) are repeated many times, then the elements of W(ω) finally converge to certain values, which make estimated values of the separation matrix. Then, a result when a separation process is performed using the separation matrix makes a final separation signal.
  • However, such a simple natural gradient method as described above has a problem that the number of times of execution of the loop processes until W(ω) converges is great. Therefore, in order to reduce the number of times of execution of the loop processes, a method has been proposed wherein a pre-process (hereinafter described) called non-correlating is applied to an observation signal, and a separation matrix is searched out from within an orthogonal matrix. The orthogonal matrix is a square matrix which satisfies a condition defined by the expression (14) given below. If the orthogonality restriction (condition for satisfying that, when W(ω) is an orthogonal matrix, also W(ω) + η·ΔW(ω) becomes an orthogonal matrix) is applied to the expression (7) given hereinabove, then the expression (15) given below is obtained. Details of the process of derivation of the expression (15) are disclosed in Non-Patent Document 1, particularly in "3.3.2 Gradient method restricted to an orthogonal matrix". W ω W ω H = I n
    Figure imgb0026
    ΔW w = E t [ φ ( Y ω t ) Y ω t H - Y ( ω , t ) φ Y ( ω , t ) H ] W ω
    Figure imgb0027
  • In the gradient method with an orthogonality restriction, a modification value ΔW(ω) of the separation matrix W(ω) is determined in accordance with the expression (15) above, and W(ω) is updated in accordance with the expression (8). If the loop processes of the expressions (15), (8) and (9) are repeated many times, then the elements of W(ω) finally converge to certain values, which make estimated values of the separation matrix. Then, a result when a separation process is performed using the separation matrix makes a final separation signal. In the method in which the expression (15) given above is used, since it involves the orthogonality restriction, the converge is reached by a number of times of execution of the loop processes smaller than that where the expression (7) given hereinabove is used.
  • SUMMARY OF THE INVENTION
  • Incidentally, in the independent component analysis in the time-frequency domain described above, the signal separation process is performed for each frequency bin as described hereinabove with reference to FIG. 10, but a relationship between the frequency bins is not taken into consideration. Therefore, even if the separation itself results in success, there is the possibility that inconsistency of the separation destination may occur among the frequency bins. The inconsistency of the separation destination signifies such a phenomenon that, for example, while, where ω = 1, a signal originating from S1 appears at Y1, where ω = 2, a signal originating from S2 appears at Y1. This is called problem of permutation.
  • An example of the permutation is illustrated in FIGS. 12A and 12B. FIG. 12A illustrates spectrograms produced from two files of "rsm2_mA.wav" and "rsm2_mB.wav" in the WEB page (http://www.cn1.salk.edu/~tewon/Blind/blind_audo.html" and represents an example of an observation signal wherein speech and music are mixed. Each spectrogram was produced by Fourier transforming data of 40,000 samples from the top of the file with a shift width of 128 using a Hanning window of a window length of 512. Meanwhile, FIG. 12B illustrates spectrograms of separation signals when the two spectrograms of FIG. 12A were used as observation signals and arithmetic operation of the expressions (15), (8) and (9) was repeated by 200 times. The expression (13) given hereinabove was used as the score function ϕ. As can be seen from FIG. 12B, permutation appears notably at frequency bins in the proximity of positions to which arrow marks are applied.
  • In this manner, the conventional independent component analysis of the time-frequency domain suffers from a problem of permutation. It is to be noted that, for the independent component analysis with an orthogonality restriction, also methods which use a fixed point method and the Jacob method are available in addition to the gradient method defined by the expressions (14) and (15) given hereinabove. The methods mentioned are disclosed in "3.4 Fixed point method" and "Jacob method" of Non-Patent Document 1 mentioned hereinabove. Also examples wherein the methods are applied to independent component analysis of the time-frequency domain are known and disclosed, for example, in Horoshi SAWADA, Ryo MUKAI, Akiko ARAKI and Shoji MAKINO, "Blind separation or three or more sound sources in an actual environment", 2003 Autumnal Meeting for Reading Papers of the Acoustical Society of Japan, pp.547-548 (hereinafter referred to as Non-Patent Document 2). However, both methods suffer from a problem of permutation because a signal separation process is performed for each frequency bin.
  • Conventionally, in order to eliminate the problem of permutation, a method is known which involves replacement by a post-process. In the post-process, after such spectrograms as illustrated in FIG. 12B are obtained by separation for each frequency bin, replacement of separation signals is performed between different channels in accordance with some reference to obtain spectrograms which do not involve permutation. As the reference for replacement, (a) similarity of an envelope (refer to Non-Patent Document 1), (b) an estimated sound source direction (refer to the description of "Prior Art" of Japanese Patent Laid-Open No. 2004-145172 (hereinafter referred to as Patent Document 1), and (c) a combination of (a) and (b) (refer to Patent Document 1) can be applied.
  • However, according to the reference (a) above, if such a situation that occasionally the difference between envelopes is unclear depending upon frequency bins occurs, then an error in replacement occurs. Further, if wrong replacement occurs once, then the separation destination is mistaken in all of the later frequency bins. Meanwhile, the reference (b) above has a problem in accuracy in direction estimation and besides requires position information of microphones. Further, although the reference (c) above is advantageous in that the accuracy in replacement is enhanced, it requires position information of microphones similarly to the reference (b). Further, all methods have a problem that, since the two steps of separation and replacement are involved, the processing time is long. From the point of view of the processing time, preferably also the problem of permutation is eliminated at a point of time when the separation is completed. However, this is difficult with the method which uses the post-process.
  • Therefore, it is demanded to provide a speech signal separation apparatus and method which can eliminate, when a speech signal with which a plurality of signals are mixed is separated into the signals using the independent component analysis, the problem of permutation without performing a post-process after the separation.
  • According to an embodiment of the present invention, there is provided a speech signal separation apparatus for separating an observation signal in a time domain of a plurality of channels wherein a plurality of signals including a speech signal are mixed using independent component analysis to produce a plurality of separation signals of the different channels, including a first conversion section configured to convert the observation signal in the time domain into an observation signal in a time-frequency domain, a non-correlating section configured to non-correlate the observation signal in the time-frequency domain between the channels, a separation section configured to produce separation signals in the time-frequency domain from the observation signal in the time-frequency domain, and a second conversion section configured to convert the separation signals in the time-frequency domain into separation signals in the time domain, the separation section being operable to produce the separation signals in the time-frequency domain from the observation signal in the time-frequency domain and a separation matrix in which initial values are substituted, calculate modification values for the separation matrix using the separation signals in the time-frequency domain, a score function which uses a multi-dimensional probability density function, and the separation matrix, modify the separation matrix until the separation matrix substantially converges using the modification values and produce separation signals in the time-frequency domain using the substantially converged separation matrix, each of the separation matrix which includes the initial values and the separation matrix after the modification which includes the modification values being a normal orthogonal matrix.
  • According to another embodiment of the present invention, there is provided a speech signal separation method for separating an observation signal in a time domain of a plurality of channels wherein a plurality of signals including a speech signal are mixed using independent component analysis to produce a plurality of separation signals of the different channels, including the steps of converting the observation signal in the time domain into an observation signal in a time-frequency domain, non-correlating the observation signal in the time-frequency domain between the channels, producing separation signals in the time-frequency domain from the observation signal in the time-frequency domain and a separation matrix in which initial values are substituted, calculating modification values for the separation matrix using the separation signals in the time-frequency domain, a score function which uses a multi-dimensional probability density function, and the separation matrix, modifying the separation matrix using the modification values until the separation matrix substantially converges, and converting the separation signals in the time-frequency domain produced using the substantially converged separation matrix into separation signals in the time domain, each of the separation matrix which includes the initial values and the separation matrix after the modification which includes the modification values being a normal orthogonal matrix.
  • In the speech signal separation apparatus and method, in order to separate an observation signal in a time domain of a plurality of channels wherein a plurality of signals including a speech signal are mixed using independent component analysis to produce a plurality of separation signals of the different channels, separation signals in the time-frequency domain are produced from the observation signal in the time-frequency domain and a separation matrix in which initial values are substituted. Then, modification values for the separation matrix are calculated using the separation signals in the time-frequency domain, a score function which uses a multi-dimensional probability density function, and the separation matrix. Thereafter, the separation matrix is modified using the modification values until the separation matrix substantially converges. Then, the separation signals in the time-frequency domain produced using the substantially converged separation matrix are converted into separation signals in the time domain. Consequently, the problem of permutation can be eliminated without performing a post-process after the separation. Further, since the observation signal in the time-frequency domain is non-correlated between the channels in advances and each of the separation matrix which includes the initial values and the separation matrix after the modification which includes the modification values is a normal orthogonal matrix, the separation matrix converges through of a comparatively small number of times of execution of the loop process.
  • The above and other features and advantages of the present invention will become apparent from the following description and the appended claims, taken in conjunction with the accompanying drawings in which like parts or elements denoted by like reference symbols.
  • BRIEF DESCRIPTION OF THE DRAWINGS
    • FIG. 1 is a view illustrating a manner in which a signal separation process is performed over entire spectrograms;
    • FIG. 2 is a view illustrating entropy and simultaneous entropy where the present invention is applied;
    • FIG. 3 is a block diagram showing a general configuration of a speech signal separation apparatus to which the present invention is applied;
    • FIG. 4 is a flow chart illustrating an outline of a process of the speech signal separation apparatus;
    • FIG. 5 is a flow chart illustrating details of a separation process in the process of FIG. 4;
    • FIGS. 6A and 6B are views illustrating an observation signal and a separation signal where a signal separation process is performed over entire spectrograms;
    • FIG. 7 is a schematic view illustrating a situation wherein original signals outputted from N sound sources are observed using n microphones;
    • FIG. 8 is a flow diagram illustrating an outline of conventional independent component analysis in the time-frequency domain;
    • FIGS. 9A to 9D are observation signals and spectrograms of the observation signals and separation signals and spectrograms of the separation signals;
    • FIG. 10 is a view illustrating a manner in which a signal separation process is executed for each frequency bin;
    • FIG. 11 is a view illustrating conventional entropy and simultaneous entropy; and
    • FIGS. 12A and 12B are views illustrating an example of observation signals and separation signals where a conventional signal separation process is performed for each frequency bin.
    DETAILED DESCRIPTION OF THE PREFERRED EMBODIMENT
  • In the following, a particular embodiment of the present invention is described in detail with reference to the accompanying drawings. In the present embodiment, the invention is applied to a speech signal separation apparatus which separates a speech signal with which a plurality of signals are mixed into the individual signals using the independent component analysis. While conventionally a separation matrix W(ω) is used to separate signals for individual frequencies as described hereinabove, in the present embodiment, a separation matrix W is used to separate signals over entire spectrograms as seen in FIG. 1. In the following, particular calculation expressions used in the present embodiment are described, and then a particular configuration of the speech signal separation apparatus of the present invention is applied.
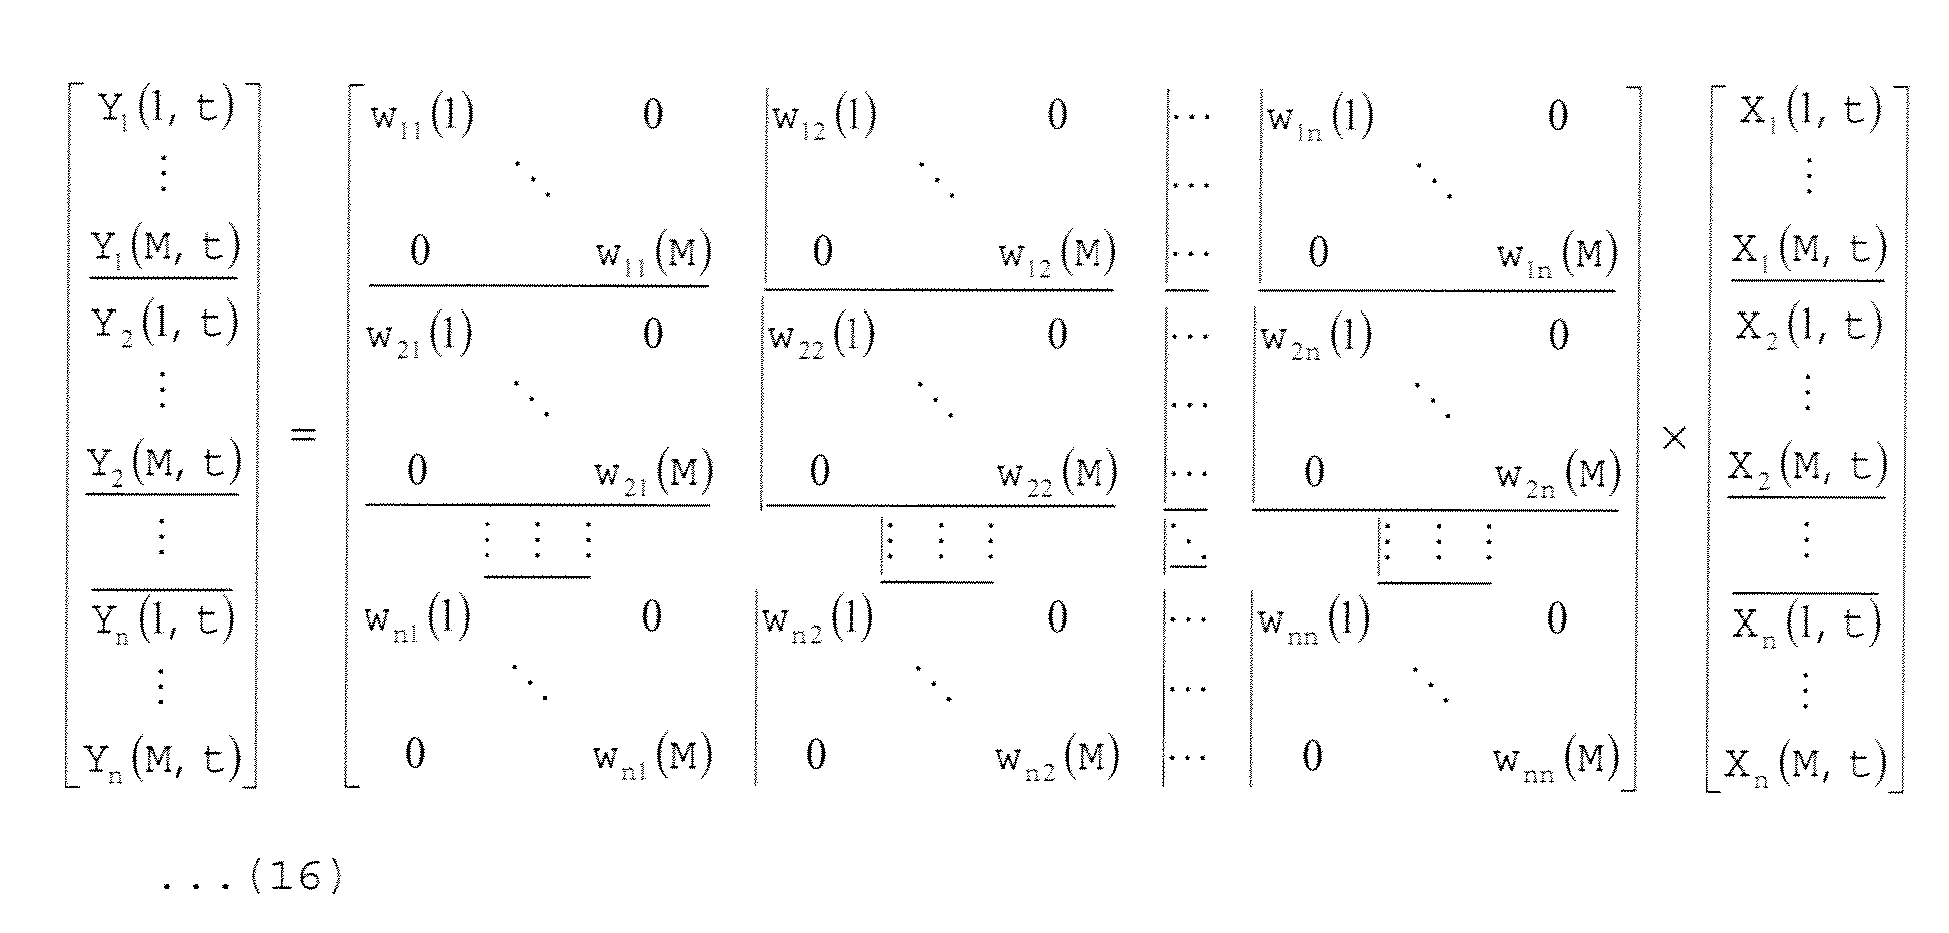
  • If conventional separation for each frequency bin is represented by a matrix and a vector, then it can be represented as the expression (9) given hereinabove. If this expression (9) is developed for all ω (1 ≤ ω ≤ M) and represented in the form of the product of a matrix and a vector, then such an expression (16) given below is obtained. This expression (16) represents matrix arithmetic operation for separating the entire spectrograms. If the opposite sides of the expression (16) are represented using characters Y(t), W and X(t), then the expression (17) given below is obtained. Further, if the components for each channel of the expression (16) are each represented by one character, then the expression (18) given below is obtained. In the expression (18), Yk(t) represents a column vector produced by cutting out a spectrum of the frame number t from within the spectrogram of the channel number k.
    Figure imgb0028
    Y t = WX t
    Figure imgb0029
    [ Y 1 t Y 2 t Y n t ] = w 11 w 12 w 1 n w 21 w 22 w 2 n w n 1 w n 2 w nn × [ X 1 t X 2 t X n t ]
    Figure imgb0030
    where Y k t = Y k 1 t Y k M t
    Figure imgb0031
    W ij = diag w ij ( 1 ) 2 , w ij M
    Figure imgb0032
    X k t = X k 1 t X k M t
    Figure imgb0033
  • In the present embodiment, a further restriction of normal orthogonality is provided to the separation matrix W of the expression (17) given above. In other words, a restriction represented by the expression (20) given below is applied to the separation matrix W. In the expression (20), InM represents a unit matrix of nM x nM. However, since the expression (20) is equivalent to the expression (21) given below, the restriction to the separation matrix W may be applied for each frequency bin similarly as in the prior art. Further, since the expression (20) and the expression (21) are equivalent to each other, also a pre-process (hereinafter described) of correlating which is applied to an observation signal in advance may be performed for each frequency bin similarly as in the prior art. WW H = I nM
    Figure imgb0034
    all ωs correspond to W ω W ω H = I n
    Figure imgb0035
  • Further, in the present embodiment, also the scale representative of the independency of a signal is calculated from the entire spectrograms. As described hereinabove, while the KL information amount, kurtosis and so forth are available as the scale representative of the independency of a signal in the independent component analysis, here the KL information amount is used as an example.
  • In the present embodiment, the KL information amount I(Y) of the entire spectrograms is defined as given by the expression (22) below. In particular, a value obtained by subtracting the simultaneous entropy H(Y) regarding all channels from the sum total of the entropy H(Yk) regarding each channel is defined as the KL information amount I(Y). A relationship between the entropy H(Yk) and the simultaneous entropy H(Y) where n = 2 is illustrated in FIG. 2. H(Yk) of the expression (22) is re-written into the first term of the expression (23) given below from the definition of the entropy, and H(Y) is expanded like the second and third terms of the expression (23) from the relationship of Y = WX. In the expression (23), PYk(Yk(t)) represents the probability density function of Yk(t), and H(X) represents the simultaneous entropy of the observation signals X. I Y = k = 1 n H Y k - H Y
    Figure imgb0036
    = k = 1 n E t [ - log P Yk Y k t ] - log det W - H X
    Figure imgb0037
    where Y k = Y k 1 Y k T
    Figure imgb0038
    Y = Y 1 Y n
    Figure imgb0039
    X = X 1 X T
    Figure imgb0040
  • Since the KL information amount I(Y) exhibits a minimum value (ideally 0) where Y1 to Yn are independent of one another, in the separation process, a separation matrix W which minimizes the KL information amount I(Y) and satisfies the normal orthogonality restriction is determined.
  • In the present embodiment, in order to determine such a separation matrix W as described above, a gradient method with the normal orthogonality restriction represented by the expressions (24) to (26) is used. In the expression (24), f(·) represents an operation by which, when ΔW satisfies the normal orthogonality restriction, that is, when W is a normal orthogonal matrix, also W + η·ΔW becomes a normal orthogonal matrix. ΔW = f - I Y W W H W
    Figure imgb0041
    W W + η ΔW
    Figure imgb0042
    Y = WX
    Figure imgb0043
  • In the gradient method with the normal orthogonality restriction, a modified value ΔW of the separation matrix W is determined in accordance with the expression (24) above and the separation matrix W is updated in accordance with the expression (25), and then the updated separation matrix W is used to produce a separation signal in accordance with the expression (26). If the loop processes of the expressions (24) to (26) are repeated many times, then the elements of the separation matrix W finally converge to certain values, which make estimated values of the separation matrix. Then, a result when the separation process is performed using the separation matrix makes a final separation signal. Particularly in the present embodiment, a KL information amount is calculated from the entire spectrograms, and the separation matrix W is used to separate signals over the entire spectrograms. Therefore, no permutation occurs with the separation signals.
  • Here, since the matrix ΔW is a discrete matrix similarly to the separation matrix W, it has a comparatively high efficiency if an expression for updating non-zero elements is used. Therefore, the matrices ΔW(ω) and W(ω) which are composed only of elements of an ωth frequency bin are defined as represented by the expressions (27) and (28) given below, and the matrix ΔW(ω) is calculated in accordance with the expression (29) given below. If this expression (2) is defined for all ω, then this results in calculation of all non-zero elements in the matrix ΔW. The W + η·ΔW determined in this manner has a form of a normal orthogonal matrix. ΔW ω = Δw ll ω Δw nl ω Δw nl ω Δw nn ω
    Figure imgb0044
    W ω = w 11 ω w 1 n ω w n 1 ω w nn ω
    Figure imgb0045
    ΔW ω = { E t φ ω ( Y t ) Y ω t H - Y ω t φ ω Y t H } W ω
    Figure imgb0046
    where φ ω = Y t = φ 1 ω Y 1 t φ n ω ( Y n t )
    Figure imgb0047
    φ k ω Y k t = Y k ω t log P Yk Y k t = Y k ω t P Yk Y k t P Yk Y k t
    Figure imgb0048
  • In the expression (30) above, the function ϕ(Yk(t)) is partial differentiation of a logarithm of the probability density function with the ωth argument as in the expression (31) above and is called score function (or activation function). In the present embodiment, since a multi-dimensional probability density function is used, also the score function is a multi-dimensional (multi-variable) function.
  • In the following, a derivation method of the score function and a particular example of the score function are described.
  • One of methods of deriving a score function is to construct a multi-dimensional probability density function in accordance with the expression (32) given below and differentiate a logarithm of the multi-dimensional probability density function. In the expression (32), h is a constant for adjusting the sum total of the probability to 1. However, since h disappears through reduction in the process of derivation of a score function, there is no necessity to substitute a particular value into h. Further, f(·) represents an arbitrary scalar function. Furthermore, ||Yk(t)||2 is an L2 norm of Yk(t) and is an LN norm calculated in accordance with the expression (33) given below where N = 2. P Yk Y k t = hf K Y k t 2
    Figure imgb0049
    where Y k t N = ω = 1 M Y k ω t N 1 / N
    Figure imgb0050
  • An example of the multi-dimensional probability density function is given as the expressions (34) and (36) below and the score function in this instance is given as the expression (35) and (37) below. In this instance, the differentiation of an absolute value of a complex number is defined as given by the expression (38) below. P Yk Y k t = h cosh m K Y k t 2
    Figure imgb0051
    φ k ω Y k t = - mK tanh K Y k t 2 Y k ω t Y k t 2
    Figure imgb0052
    P Yk Y k t ) = h exp ( - K Y k t 2
    Figure imgb0053
    φ k ω Y k ω t = - K Y k ω t | | Y k t | | 2
    Figure imgb0054
    Y k ω t Y k ω t = Y k ω t Y k ω t
    Figure imgb0055
  • Also it is possible to directly construct a score function without intervention of a multi-dimensional probability density function without deriving a score function through intervention of a multi-dimensional probability density function as described above. To this end, a score function may be construct so as to satisfy the following conditions i) and ii). It is to be noted that the expressions (35) and (37) satisfy the conditions i) and ii).
    1. i) That the return value is a dimensionless amount.
    2. ii) That the phase of the return value (phase of a complex number) is opposite to the phase of the ωth argument Yk(ω, t).
  • Here, that the return value of the score function ϕ(Yk(t)) is a dimensionless amount signifies that, where the unit of ϕ(Yk(t)) is represented by [x], [x] cancels between the numerator and the denominator of the score function and the return value does not include the dimension of [x] (where n is a real number, whose unit is described as [Xn]).
  • Meanwhile, that the phase of the return value of the function ϕ(Yk(t)) is opposite to the phase of the ωth argument Yk(ω, t) represents that arg{ϕ(Yk(t))} -arg{ϕ(Yk(ω, t)) is satisfied with any Yk(ω, t). It is to be noted that arg{z} represents a phase component of the complex number z. For example, where the complex number z is represented as z = r·exp(iθ) using the magnitude r and the phase angle θ, arg{z} = θ.
  • It is to be noted that, since, in the present embodiment, the score function is defined as a differential of logPYk(Yk(t)), that the phase of the return value is "opposite" to the phase of the ωth argument makes a condition of the score function. However, where the score function is defined otherwise as a differential of log(1/PYk(Yk(t))), that the phase of the return value is "same" as the phase of the ωth argument makes a condition of the score function. In any case, the score function relies only upon the phase of the ωth argument.
  • A particular example of the score function which satisfies both of the conditions i) and ii) described hereinabove is represented by the expressions (39) and (40) given below. The expression (39) is a generalized form of the expression (35) given hereinabove with regard to N so that separation can be performed without permutation also in any norm other than the L2 norm. Also the expression (40) is a generalized form of the expression (37) given hereinabove with regard to N. In the expressions (39) and (40), L and m are positive constants and may be, for example, 1. Meanwhile, a is a constant for preventing division by zero and has a non-negative value. φ k ω Y k t = - Klm tanh K Y k t N m Y k ω t Y k t N + a L Y k ω t Y k ω t |
    Figure imgb0056
    L 0 , a 0
    Figure imgb0057
    φ k ω Y k t = - K Y k ω t Y k t N + a L Y k ω t Y k ω t
    Figure imgb0058
    L 0
    Figure imgb0059
  • Where the unit of Yk(ω, t) in the expressions (39) and (40) is [x], an equal number (L + 1) of amounts which have [x] appear with the numerator and the denominator, and therefore, the unit [x] cancels between them. Consequently, the entire score function provides a dimensionless amount (tanh is regarded as a dimensionless amount). Further, since the phases of the return values of the expressions above are equal to the phase of - Yk(ω, t) (the other terms do not have an influence on the phase), the phases of the return values have a phase opposite to that of the ωth argument Yk(ω, t).
  • A further generalized score function is given as the expression (41) below. In the expression (41), g(x) is a function which satisfies the following conditions iii) to vi).
    • iii) That g(x) ≥ 0 where x ≥ 0.
    • iv) That, where x ≥ 0, g(x) is a constant, a monotonically increasing function or a monotonically decreasing function.
    • v) That, where g(x) is a monotonically increasing function or a monotonically decreasing function, g(x) converges to a positive value when x → ∞.
    • vi) g(x) is a dimensionless amount with regard to x. φ k ω Y k t = - mg K Y k t N | Y k ω t | + a 2 Y k t N + a 1 L Y k ω t | Y k ω t | + a 3
      Figure imgb0060
      m 0 , L , a 1 , a 2 , a 3 0
      Figure imgb0061
  • Examples of g(x) which provide success in separation are given below as the expressions (42) to (46). In the expressions (42) to (46), the constant terms are determined so as to satisfy the conditions iii) to v) given hereinabove. g x = b ± tanh Kx
    Figure imgb0062
    g x = 1
    Figure imgb0063
    g x = x + b 2 x + b 1 b 1 , b 2 0
    Figure imgb0064
    g x = 1 ± h exp ( - Kx ) 0 h 1
    Figure imgb0065
    g x = b ± arctan Kx
    Figure imgb0066
  • It is to be noted that, in the expression (41) above, m is a constant independent of the channel number k and the frequency bin number ω, but may otherwise vary depending upon k or ω. In other words, m may be replaced by mk(ω) as in the expression (47) given below. Where mk(ω) is used in this manner, the scale of Yk(ω, t) upon convergence can be adjusted to some degree. φ k ω Y k t = - m k ( ω ) g K Y k t N | Y k ω t | + a 2 Y k t N + a 1 L Y k ω t | Y k ω t | + a 3
    Figure imgb0067
    m 0 , L , a 1 , a 2 , a 3 0
    Figure imgb0068
  • Here, when the LN norm ||Yk(t)||N of Yk(t) in the expressions (39) to (41) and (47) is to be calculated, it is necessary to determine an absolute value of a complex number. However, the absolute value of a complex number may otherwise be approximated with an absolute value of the real part or the imaginary part as given by the expression (48) or (49) below, or may be approximated with the sum of the absolute values as given by the expression (50). Y k ω t Re Y k ω t
    Figure imgb0069
    Y k ω t Im Y k ω t
    Figure imgb0070
    Y k ω t Re Y k ω t + Im Y k ω t
    Figure imgb0071
  • In a system wherein a complex number is retained separately as a real part and an imaginary part, the absolute value of a complex number z represented by z = x + iy (x and y are real numbers and i is the imaginary unit) is calculated in accordance with the expression (51) given below. On the other hand, since the absolute values of the real part and the imaginary part are calculated in accordance with the expressions (52) and (53) given below, the amount of calculation is reduced. Particularly in the case of the L1 norm, since the absolute value can be calculated only by the calculation and the sum of absolute values of real numbers without using the square or the square root, the calculation can be simplified significantly. z = x 2 + y 2
    Figure imgb0072
    Re ( z ) = x
    Figure imgb0073
    Im z | = | y
    Figure imgb0074
  • Further, since the value of the LN norm almost depends upon a component of Yk(t) which has a high absolute value, upon calculation of the LN norm, not all components of Yk(t) may be used, but only x% of a comparatively high order of a high absolute value component or components may be used. The high order x% can be determined in advance from a spectrogram of an observation signal.
  • A further generalized score function is given as the expression (54) below. This score function is represented by the product of a function f(Yk(t)) wherein a vector Yk(t) is an argument, another function g(Yk(ω, t)) wherein a scalar Yk(ω, t) is an argument, and the term -Yk(ω, t) for determining the phase of the return value (f(·) and g(·) are different from the functions described hereinabove). It is to be noted that f(Yk(t) and g(Yk(ω, t)) are determined so that the product of them satisfies the following conditions vii) and viii) with regard to any Yk(t) and Yk(ω, t).
    • vii) That the product of f(Yk(t)) and g(Yk(ω, t)) is a non-negative real number.
    • viii) That the dimension of the product of f(Yk(t)) and g(Yk(ω, t)) is [1/x].
  • (The unit of Yk(ω, t) is [x]). φ Y k t = - m k ω f Y k t g ( Y k ω t ) Y k ω t
    Figure imgb0075
  • From the condition vii) above, the phase of the score function becomes same as that of -Yk(ω, t), and the condition that the phase of the return value of the score function is opposite to the phase of the ωth argument is satisfied. Further, from the condition viii) above, the dimension is canceled with that of Yk(ω, t), and the condition that the return value of the score function is a dimensionless amount is satisfied.
  • The particular calculation expressions used in the present embodiment are described above. In the following, a particular configuration of the speech signal separation apparatus according to the present embodiment is described.
  • A general configuration of the speech signal separation apparatus according to the present embodiment is shown in FIG. 3. Referring to FIG. 3, the speech signal separation apparatus generally denoted by 1 includes n microphones 101 to 10n for observing independent sounds emitted from n sound sources, and an A/D (Analog/Digital) converter 11 for A/D converting the sound signals to obtain an observation signal. A short-time Fourier transform (F/G) section 12 short-time Fourier transforms the observation signal to produce spectrogram of the observation signal. A standardization and non-correlating section 13 performs a standardization process (adjustment of the average and the variance) and a non-correlating process (non-correlating between channels) for the spectrograms of the observation signal. A signal separation section 14 makes use of signal models retained in a signal model retaining section 15 to separate the spectrograms of the observation signals into spectrograms based on independent signals. A signal model particularly is a score function described hereinabove.
  • A rescaling section 16 performs a process of adjusting the scale among the frequency bins of the spectrograms of the separation signals. Further, the rescaling section 16 performs a process of canceling the effect of the standardization process on the observation signal before the separation process. An inverse Fourier transform section 17 performs an inverse Fourier transform process to convert the spectrograms of the separation signals into separation signals in the time domain. A D/A conversion section 18 D/A converts the separation signals in the time domain, and n speakers 191 to 19n reproduce sounds independent of each other.
  • An outline of the process of the speech signal separation apparatus is described with reference to a flow chart of FIG. 4. First at step S1, sound signals are observed through the microphones, and at step S2, the observation signal is short-time Fourier transformed to obtain spectrograms. Then at step S3, a standardization process and a non-correlating process are performed for the spectrograms of the observation signals.
  • The standardization here is an operation of adjusting the average and the standard deviation of the frequency bins to zero and one, respectively. An average value is subtracted for each frequency bin to adjust the average to zero, and the standardization deviation can be adjusted to 1 by dividing resulting spectrograms by the standard deviations. Where an observation signal after the standardization is represented by X', the standardized observation signal can be represented as X' = P(X - µ). It is to be noted that P represents a variation standardization matrix composed of inverse numbers of the standard deviations, and µ represents an average value vector formed from average values of the frequency bins.
  • Meanwhile, the non-correlating is also called whitening or sphering and is an operation of reducing the correlation between channels to zero. The non-correlating may be performed for each frequency bin similarly as in the prior art.
  • The non-correlating is further described. A variance-covariance matrix Σ(ω) of the observation signal vector X(ω, t) at the frequency bin = ω is defined as given by the expression (55) below. This variance-covariance matrix Σ(ω) can be represented as given by the expression (56) below using the unique vector Pk(ω) and a characteristic value λk(ω). Where a matrix composed of unique vectors pk(ω) is represented by P(ω) and a diagonal matrix composed of characteristic values λk(ω) is represented by Λ(ω), if X(ω, t) is converted as given by the expression (57) below, then the elements of X'(ω, t) which is a result of the conversion are not correlating to each other. In other words, the condition of Et[X'(ω, t)X'(ω, t)H] = In is satisfied. Σ ω = E t X ( ω , t ) X ω t H
    Figure imgb0076
    Σ ω p k ω = p k ω λ k ω
    Figure imgb0077
    ω t = P ω H Λ ω - 1 / 2 P ω X ω t = U ω X ( ω , t )
    Figure imgb0078
    where P ω = p 1 ω p n ω
    Figure imgb0079
    Λ ω - 1 / 2 = diag λ 1 ω - 1 / 2 , , λ n ω - 1 / 2
    Figure imgb0080
    Y ω t = W ( ω ) X ʹ ω t = W ω U ( ω ) X ( ω , t )
    Figure imgb0081
  • Then at step S4, a separation process is performed for the standardized and non-correlated observation signal. In particular, a separation matrix W and a separation signal Y are determined. It is to be noted that, while normal orthogonality restriction is applied to the process at step S4, details are hereinafter described. The separation signal Y obtained at step S4 exhibits scales which are different among different frequency bins although it does not suffer from permutation. Thus, at step S5, a rescaling process is performed to adjust the scale among the frequency bins. Here, also a process of restoring the averages and the standard deviations which have been varied by the standardization process is performed. It is to be noted that details of the rescaling process at step S5 are hereinafter described. Then at step S6, the separation signals after the rescaling process at step S5 are converted into separation signals in the time domain, and at step S7, the separation signals in the time domain are reproduced from the speakers.
  • Details of the separation process at step S4 (FIG. 4) described above are described below with reference to a flow chart of FIG. 5. It is to be noted that X(t) in FIG. 5 is a standardized and non-correlated observation signal and corresponds to X'(t) of FIG. 4.
  • First at step S11, initial values are substituted into a separation matrix W. In order to satisfy the normal orthogonality restriction, also the initial values are a normal orthogonal matrix. Further, where a separation process is performed many times in the same environment, converged values in the preceding operation cycle may be used as the initial values in the present operation cycle. This can reduce the number of times of a loop process before convergence.
  • Then at step S12, it is decided whether or not W exhibits convergence. If W exhibits convergence, then the processing is ended, but if W does not exhibit convergence, then the processing advances to step S13.
  • Then at step S13, the separation signals Y at the point of time are calculated, and at step S14, ΔW is calculated in accordance with the expression (29) given hereinabove. Since this ΔW is calculated for each frequency bin, a loop process is repetitively performed while the expression (2) is applied to each value of ω. After ΔW is determined, W is updated at step S15, whereafter the processing returns to step S12.
  • It is to be noted that, while, in the foregoing description, the steps S13 and S15 are provided on the outer sides of the frequency bin loop, the processes at the steps may be displaced to the inner side of the frequency bin loop such that ΔW is calculated for each frequency bin similarly as in the prior art. In this instance, the calculation expression of ΔW(ω) and the updating expressions of W(ω) may be integrated such that W(ω) is calculated directly without calculating ΔW(ω).
  • Further, while, in FIG. 5, the updating process of W is performed until W converges, the updating process of W may otherwise be repeated by a sufficiently great predetermined number of times.
  • Now, details of the rescaling process at step S5 (FIG. 4) described hereinabove are described. For the rescaling method, any one of the three methods described below may be used.
  • According to the first method of rescaling, a signal of the SIMO (Single Input Multiple Output) format is produced from results of separation (whose scales are not uniform). This method is expansion of a rescaling method for each frequency bin described in Noboru Murata and Shiro Ikeda, "An on-line algorithm for blind source separation on speed signals", Proceedings of 1998 International Symposium on Nonlinear Theory and its Applications (NOLTA '98), pp.923-926, Crans-Montana, Switzerland, September 1998 (http:llwww.ism.ac./jp~shiro/papers/conferences/nolta1998.pdf) to scaling of the entire spectrograms using the separation matrix W of the expression (17) given hereinabove.
  • An element of the observation signal vector X(t) which originates from the kth sound source is represented by XYk(t). XYk(t) can be determined by assuming a state that only the kth sound source emits sound and applying a transfer function to the kth sound source. If results of separation of the independent component analysis are used, then the state that only the kth sound source emits sound can be represented by setting the elements of the vector of the expression (19) given hereinabove other than Yk(t) to zero, and the transfer function can be represented as an inverse matrix of the separation matrix W. Accordingly, XYk(t) can be determined in accordance with the expression (58) given below. In the expression (58), Q is a matrix for the standardization and non-correlating of an observation signal. Further, the second term on the right side is the vector of the expression (19) given hereinabove in which the elements other that Yk(t) are set to zero. In XYk(t) determined in this manner, the instability of the scale is eliminated. X Yk t = WQ - 1 0 Y k t 0
    Figure imgb0082
  • The second method of rescaling is based on the minimum distortion principle. This is expansion of the rescaling method for each frequency bin described in K. Matuoka and S. Nakashima, "Minimal distortion principle for blind source separation", Proceedings of International Conference on INDEPENDENT COMPONENT ANALYSIS and BLIND SIGNAL SEPARATION (ICA 2001), 2001, pp.722-727 (http://ica2001.ucsd.edu/index_files/pdfs/099-matauoka.pdf) to rescaling of the entire spectrograms using the separation matrix W of the expression (17) given hereinabove.
  • In the rescaling based on the minimum distortion principle, the separation matrix W is re-calculated in accordance with the expression (59) given below. If the re-calculated separation matrix W is used to calculate separation signals in accordance with Y = WX again, then the instability of the scale disappears from Y. W diag ( WQ - 1 ) WQ
    Figure imgb0083
  • The third method of rescaling utilizes independency of a separation signal and a residual signal as described below.
  • A signal αk(ω)Yk(ω, t) obtained by multiplying a separation result Yk(ω, t) at the channel number k and the frequency bin number ω by a scaling coefficient αk(ω) and a residual Xk(ω, t) - αk(ω)Yk(ω, t) of the separation result Yk(ω, t) from the observation signal are assumed. If αk(ω) has a correct value, then the factor of Yk(ω, t) must disappear completely from the residual Xk(ω, t) - αk(ω)Yk(ω, t). Then, αk(ω)Yk(ω, t) at this time represents estimation of one of the original signals observed through the microphones including the scale.
  • Here, if the scale of independency is introduced, then that the element disappears completely can be represented as that {Xk(ω, t) - ak(ω)Yk(ω, t)} and {Yk(ω, t)} are independent of each other in the direction of time. This condition can be represented as given by the expression (60) below using arbitrary scalar functions f(·) and g(·). It is to be noted that an overlying line represents a conjugate complex number. Accordingly, the instability of the scale disappears if the scaling factor αk(ω) which satisfies the expression (60) given below is determined and Yk(ω, t) is multiplied by the thus determined scaling factor αk(ω). E t [ f X k ω t - a k ω Y k ( ω , t ) g ( Y k ( ω , t ) ) ] - E t f X k ω t - a k ω Y k ( ω , t ) E t [ g ( Y k ( ω , t ) ) ] = 0
    Figure imgb0084
  • If a case of f(x) = x is considered as a requirement of the expression (60) above, then the expression (61) is obtained as a condition which should be satisfied by the scaling factor αk(ω). g(x) of the expression (61) may be an arbitrary function, and, for example, any of the expressions (62) to (65) given below can be used as g(x). If αk(ω)Yk(ω, t) is used in place of Yk(ω, t) as a separation result, then the instability of the scale is eliminated. a k ω = E t X k ω t g ( Y k ( ω , t ) ) - E t X k ω t E t g ( Y k ( ω , t ) ) E t Y k ω t g ( Y k ( ω , t ) ) - E t Y k ω t E t g ( Y k ( ω , t ) )
    Figure imgb0085
    g x = x
    Figure imgb0086
    g x = x
    Figure imgb0087
    g x = x 3 / 2
    Figure imgb0088
    g x = tanh ( x ) x x
    Figure imgb0089
  • In the following, particular separation results are described. FIG. 6A illustrates spectrograms produced from the two files of "rsm2_mA,wav" and "rsm2_mB.wav" mentioned hereinabove and represents an example of an observation signal wherein speech and music are mixed with each other. Meanwhile, FIG. 6B illustrates results where the two spectrograms of FIG. 6A are used as an observation signal and the updating expression given as the expression (29) above and the score function of the expression (37) given hereinabove are used to perform separation. The other conditions are similar to those described hereinabove with reference to FIG. 12. As can be seen from FIG. 6B, while permutation occurs where the conventional method is used (FIG. 12B), no permutation occurs where the separation method according to the present embodiment is used.
  • As described in detail above, with the speech signal separation apparatus 1 according to the present embodiment, in place of separation of signals for individual frequency bins using the separation matrix W(ω) as in the prior art, the separation matrix W is used to separate signals over the entire spectrograms. Consequently, the problem of permutation can be eliminated without performing a post-process after the separation. Particularly with the speech signal separation apparatus 1 of the present embodiment, since a gradient method with the normal orthogonality restriction is used, the separation matrix W can be determined through a reduced number of times of execution of a loop process when compared with that in an alternative case wherein no normal orthogonality restriction is provided.
  • It is to be noted that the present invention is not limited to the embodiment described hereinabove, but various medications and alterations can be made without departing from the spirit and scope of the present invention.
  • For example, while, in the embodiment described above, the learning coefficient η in the expression (25) given hereinabove is a constant, the value of the learning coefficient η may otherwise be varied adaptively depending upon the value of ΔW. In particular, where the absolute values of the elements of ΔW are high, η may be set to a low value to prevent an overflow of W, but where ΔW is proximate to a zero matrix (where W approaches converging points), η may be set to a high value to accelerate convergence to the converging points.
  • In the following, a calculation method of η where the value of the learning coefficient η is varied adaptively in this manner is described.
  • ||ΔW||N is calculated as a norm of a matrix ΔW, for example, in accordance with the expression (68) given below. The learning coefficient η is represented as a function of ||ΔW||N as seen from the expression (66) given below. Or, a norm ||W||N is calculated similarly also with regard to W in addition to ΔW, and a ratio between them, that is, ||ΔW||N/||W||N, is determined as an argument of f(·) as given by the expression (67) below. As a simple example, N = 2 can be used. For f(·) of the expressions (66) and (67), for example, a monotonically decreasing function which satisfies f(0) = η0 and f(∞) → 0 is used as in the expressions (69) to (71) given below. In the expressions (69) to (71), a is an arbitrary positive value and is a parameter for adjusting the degree of decrease of f(·). Meanwhile, L is an arbitrary positive real number. As a simple example, a = 1 and L = 2 can be used. η = f ΔW N
    Figure imgb0090
    η = f ΔW N / W N
    Figure imgb0091
    where ΔW N = ω = 1 M j = 1 n i = 1 n W i , j ω N 1 N
    Figure imgb0092
    f x = η 0 ax L + 1
    Figure imgb0093
    f x = η 0 cosh ax L
    Figure imgb0094
    f x = η 0 exp - ax L
    Figure imgb0095
  • It is to be noted that, while, in the expressions (66) and (67), a learning coefficient η common to all frequency bins is used, different learning coefficients η may be used for the individual frequency bins as seen from the expression (72) given below. In this instance, the norm ||ΔW(ω)||)N of ΔW(ω) is calculated, for example, in accordance with the expression (74) given below, and the learning coefficient η(ω) is represented as a function of ||ΔW(ω)||N as seen from the expression (73) given below. In the expression (73), f(') is similar to that in the expressions (66) and (67). Further, ||ΔW(ω)||N/||W(ω)||N may be used in place of ||ΔW(ω)||N. W ω W ω + η ω ΔW ω
    Figure imgb0096
    η ω = f ΔW ω N
    Figure imgb0097
    ΔW ω N = j = 1 n i = 1 n w ij ω N 1 N
    Figure imgb0098
  • Further, in the embodiment described above, signals of the entire spectrograms, that is, signals of all frequency bins of the spectrograms, are used. However, a frequency bin in which little signals exist over all channels (only components proximate to zero exist) has little influence on separation signals in the time domain irrespective of whether the separation results in success or in failure. Therefore, if such frequency bins are removed to degenerate the spectrograms, then the calculation amount can be reduced and the speed of the separation can be raised.
  • As a method of degenerating a spectrogram, the following example is available. In particular, after spectrograms of an observation signal are produced, it is decided whether or not the absolute value of the signal is higher than a predetermined threshold value for each frequency bin. Then, a frequency bin in which the signal is lower than the threshold value in all frames and in all channels is decided as a frequency in which no signal exists, and the frequency bin is removed from the spectrograms. However, in order to allow later reconstruction, it is recorded what numbered frequency bin is removed. If it is assumed that no signal exists in m frequency bins, then the spectrograms after the removal have M - m frequency bins.
  • As another example of degenerating spectrograms, a method of calculating the intensity D(ω) of a signal, for example, in accordance with the expression (75) given below for each frequency bin and adopting M - m frequency bins which exhibit comparatively high signal intensities (removing m frequency bins which exhibit comparatively low signal intensities) is available. D ω = k = 1 n t = 1 T Y k ω t 2
    Figure imgb0099
  • After the spectrograms are degenerated, standardization and non-correlating, separation and rescaling processes are performed for the degenerated spectrograms. Further, those frequency bins removed formerly are inserted back. It is to be noted that a vector whose elements are all equal to zero may be inserted in place of the removed signals. If the resulting signals are inverse Fourier transformed, then separation signals in the time domain can be obtained.
  • Further, while, in the embodiment described hereinabove, the number of microphones and the number of sound sources are equal to each other, the present invention can be applied also to another case wherein the number of microphones is greater than the number of sound sources. In this instance, the number of microphones can be reduced down to the number of sound sources, for example, if principal component analysis (PCA) is used.
  • Further, while, in the embodiment described hereinabove, sound is reproduced through a speaker, it is otherwise possible to output separation signals so as to be used for speech recognition and so forth. In this instance, the inverse Fourier transform process may be omitted suitably. Where separation signals are used for speech recognition, it is necessary to specify which one of a plurality of separation signals represents speech. To this end, for example, one of methods described below may be used.
    1. (a) For each of a plurality of separation signals, one channel which is most "likely to speech" is specified using the kurtosis or the like, and the separation signal is used for speech recognition.
    2. (b) A plurality of separation signals are inputted in parallel to a plurality of speech recognition apparatus so that speech recognition is performed by the speech recognition apparatus. Then, the scale such as the likelihood or the reliability is calculated for each recognition result, and that one of the recognition results which exhibits the highest scale is adopted.
  • While a preferred embodiment of the present invention has been described using specific terms, such description is for illustrative purpose only, and it is to be understood that changes and variations may be set without departing from the scope of the following claims.

Claims (4)

  1. A speech signal separation apparatus for separating an observation signal in a time domain of a plurality of channels wherein a plurality of signals including a speech signal are mixed using independent component analysis to produce a plurality of separation signals of the different channels, comprising:
    a first conversion section (11) configured to convert the observation signal in the time domain into an observation signal in a time-frequency domain;
    a non-correlating section (13) configured to non-correlate the observation signal in the time-frequency domain between the channels;
    a separation section (14) configured to produce separation signals in the time-frequency domain from the observation signal in the time-frequency domain; and
    a second conversion section (18) configured to convert the separation signals in the time-frequency domain into separation signals in the time domain;
    said separation section (14) being operable to produce the separation signals in the time-frequency domain from the observation signal in the time-frequency domain and a separation matrix in which initial values are substituted, calculate modification values for the separation matrix using the separation signals in the time-frequency domain, a score function which uses a multi-dimensional probability density function, and the separation matrix, modify the separation matrix until the separation matrix substantially converges using the modification values and produce separation signals in the time-frequency domain using the substantially converged separation matrix;
    each of the separation matrix which includes the initial values and the separation matrix after the modification which includes the modification values being a normal orthogonal matrix.

  2. The speech signal separation apparatus according to claim 1, wherein the score function returns a dimensionless amount as a return value thereof which has a phase which relies upon only one argument.
  3. A speech signal separation method for separating an observation signal in a time domain of a plurality of channels wherein a plurality of signals including a speech signal are mixed using independent component analysis to produce a plurality of separation signals of the different channels, comprising the steps of:
    converting the observation signal in the time domain into an observation signal in a time-frequency domain;
    non-correlating the observation signal in the time-frequency domain between the channels;
    producing separation signals in the time-frequency domain from the observation signal in the time-frequency domain and a separation matrix in which initial values are substituted;
    calculating modification values for the separation matrix using the separation signals in the time-frequency domain, a score function which uses a multi-dimensional probability density function, and the separation matrix;
    modifying the separation matrix using the modification values until the separation matrix substantially converges; and
    converting the separation signals in the time-frequency domain produced using the substantially converged separation matrix into separation signals in the time domain;
    each of the separation matrix which includes the initial values and the separation matrix after the modification which includes the modification values being a normal orthogonal matrix.
  4. The speech signal separation method according to claim 3, wherein the score function returns a dimensionless amount as a return value thereof which has a phase which relies upon only one argument.
EP07100711A 2006-01-18 2007-01-18 Speech signal separation apparatus and method Withdrawn EP1811498A1 (en)

Applications Claiming Priority (1)

Application Number Priority Date Filing Date Title
JP2006010277A JP4556875B2 (en) 2006-01-18 2006-01-18 Audio signal separation apparatus and method

Publications (1)

Publication Number Publication Date
EP1811498A1 true EP1811498A1 (en) 2007-07-25

Family

ID=37891937

Family Applications (1)

Application Number Title Priority Date Filing Date
EP07100711A Withdrawn EP1811498A1 (en) 2006-01-18 2007-01-18 Speech signal separation apparatus and method

Country Status (5)

Country Link
US (1) US7797153B2 (en)
EP (1) EP1811498A1 (en)
JP (1) JP4556875B2 (en)
KR (1) KR20070076526A (en)
CN (1) CN100559472C (en)

Cited By (2)

* Cited by examiner, † Cited by third party
Publication number Priority date Publication date Assignee Title
CN102081928A (en) * 2010-11-24 2011-06-01 南京邮电大学 Method for separating single-channel mixed voice based on compressed sensing and K-SVD
EP2312578A4 (en) * 2008-07-11 2012-09-12 Nec Corp Signal analyzing device, signal control device, and method and program therefor

Families Citing this family (39)

* Cited by examiner, † Cited by third party
Publication number Priority date Publication date Assignee Title
JP4449871B2 (en) 2005-01-26 2010-04-14 ソニー株式会社 Audio signal separation apparatus and method
US7970564B2 (en) * 2006-05-02 2011-06-28 Qualcomm Incorporated Enhancement techniques for blind source separation (BSS)
JP5018193B2 (en) * 2007-04-06 2012-09-05 ヤマハ株式会社 Noise suppression device and program
US7987090B2 (en) * 2007-08-09 2011-07-26 Honda Motor Co., Ltd. Sound-source separation system
US8954324B2 (en) 2007-09-28 2015-02-10 Qualcomm Incorporated Multiple microphone voice activity detector
US8175871B2 (en) 2007-09-28 2012-05-08 Qualcomm Incorporated Apparatus and method of noise and echo reduction in multiple microphone audio systems
US8223988B2 (en) 2008-01-29 2012-07-17 Qualcomm Incorporated Enhanced blind source separation algorithm for highly correlated mixtures
JP5294300B2 (en) * 2008-03-05 2013-09-18 国立大学法人 東京大学 Sound signal separation method
JP4572945B2 (en) 2008-03-28 2010-11-04 ソニー株式会社 Headphone device, signal processing device, and signal processing method
WO2009151578A2 (en) * 2008-06-09 2009-12-17 The Board Of Trustees Of The University Of Illinois Method and apparatus for blind signal recovery in noisy, reverberant environments
JP5195652B2 (en) * 2008-06-11 2013-05-08 ソニー株式会社 Signal processing apparatus, signal processing method, and program
JP4631939B2 (en) 2008-06-27 2011-02-16 ソニー株式会社 Noise reducing voice reproducing apparatus and noise reducing voice reproducing method
JP5277887B2 (en) * 2008-11-14 2013-08-28 ヤマハ株式会社 Signal processing apparatus and program
JP5550456B2 (en) * 2009-06-04 2014-07-16 本田技研工業株式会社 Reverberation suppression apparatus and reverberation suppression method
JP5375400B2 (en) * 2009-07-22 2013-12-25 ソニー株式会社 Audio processing apparatus, audio processing method and program
US8340943B2 (en) * 2009-08-28 2012-12-25 Electronics And Telecommunications Research Institute Method and system for separating musical sound source
KR101225932B1 (en) 2009-08-28 2013-01-24 포항공과대학교 산학협력단 Method and system for separating music sound source
KR101272972B1 (en) 2009-09-14 2013-06-10 한국전자통신연구원 Method and system for separating music sound source without using sound source database
JP2011107603A (en) * 2009-11-20 2011-06-02 Sony Corp Speech recognition device, speech recognition method and program
JP2011215317A (en) * 2010-03-31 2011-10-27 Sony Corp Signal processing device, signal processing method and program
JP5307770B2 (en) * 2010-07-09 2013-10-02 シャープ株式会社 Audio signal processing apparatus, method, program, and recording medium
KR20120031854A (en) * 2010-09-27 2012-04-04 한국전자통신연구원 Method and system for separating music sound source using time and frequency characteristics
US20120095729A1 (en) * 2010-10-14 2012-04-19 Electronics And Telecommunications Research Institute Known information compression apparatus and method for separating sound source
US9111526B2 (en) * 2010-10-25 2015-08-18 Qualcomm Incorporated Systems, method, apparatus, and computer-readable media for decomposition of a multichannel music signal
CN102903368B (en) 2011-07-29 2017-04-12 杜比实验室特许公司 Method and equipment for separating convoluted blind sources
US8886526B2 (en) * 2012-05-04 2014-11-11 Sony Computer Entertainment Inc. Source separation using independent component analysis with mixed multi-variate probability density function
US8880395B2 (en) * 2012-05-04 2014-11-04 Sony Computer Entertainment Inc. Source separation by independent component analysis in conjunction with source direction information
US9099096B2 (en) * 2012-05-04 2015-08-04 Sony Computer Entertainment Inc. Source separation by independent component analysis with moving constraint
US20130294611A1 (en) * 2012-05-04 2013-11-07 Sony Computer Entertainment Inc. Source separation by independent component analysis in conjuction with optimization of acoustic echo cancellation
CN102708860B (en) * 2012-06-27 2014-04-23 昆明信诺莱伯科技有限公司 Method for establishing judgment standard for identifying bird type based on sound signal
KR101474321B1 (en) * 2012-06-29 2014-12-30 한국과학기술원 Permutation/Scale Problem Solving Apparatous and Method for Blind Signal Separation
JP2014219467A (en) * 2013-05-02 2014-11-20 ソニー株式会社 Sound signal processing apparatus, sound signal processing method, and program
EP3165007B1 (en) * 2014-07-03 2018-04-25 Dolby Laboratories Licensing Corporation Auxiliary augmentation of soundfields
CN106055903B (en) * 2016-06-02 2017-11-03 东南大学 Random dynamic loads decomposition technique based on Piecewise Constant function orthogonal basis
CN110232931B (en) * 2019-06-18 2022-03-22 广州酷狗计算机科技有限公司 Audio signal processing method and device, computing equipment and storage medium
CN113870878B (en) * 2020-06-30 2025-07-04 微软技术许可有限责任公司 Speech Enhancement
GB2609605B (en) * 2021-07-16 2024-04-17 Sony Interactive Entertainment Europe Ltd Audio generation methods and systems
GB2609021B (en) 2021-07-16 2024-04-17 Sony Interactive Entertainment Europe Ltd Audio generation methods and systems
CN116469377B (en) * 2023-04-28 2025-10-24 深圳市北科瑞声科技股份有限公司 Voice recognition method, device, electronic device and storage medium

Citations (1)

* Cited by examiner, † Cited by third party
Publication number Priority date Publication date Assignee Title
WO2005029463A1 (en) * 2003-09-05 2005-03-31 Kitakyushu Foundation For The Advancement Of Industry, Science And Technology A method for recovering target speech based on speech segment detection under a stationary noise

Family Cites Families (6)

* Cited by examiner, † Cited by third party
Publication number Priority date Publication date Assignee Title
US5959966A (en) * 1997-06-02 1999-09-28 Motorola, Inc. Methods and apparatus for blind separation of radio signals
US7047043B2 (en) * 2002-06-06 2006-05-16 Research In Motion Limited Multi-channel demodulation with blind digital beamforming
JP3975153B2 (en) 2002-10-28 2007-09-12 日本電信電話株式会社 Blind signal separation method and apparatus, blind signal separation program and recording medium recording the program
JP3949074B2 (en) * 2003-03-31 2007-07-25 日本電信電話株式会社 Objective signal extraction method and apparatus, objective signal extraction program and recording medium thereof
JP4496379B2 (en) * 2003-09-17 2010-07-07 財団法人北九州産業学術推進機構 Reconstruction method of target speech based on shape of amplitude frequency distribution of divided spectrum series
JP4449871B2 (en) * 2005-01-26 2010-04-14 ソニー株式会社 Audio signal separation apparatus and method

Patent Citations (1)

* Cited by examiner, † Cited by third party
Publication number Priority date Publication date Assignee Title
WO2005029463A1 (en) * 2003-09-05 2005-03-31 Kitakyushu Foundation For The Advancement Of Industry, Science And Technology A method for recovering target speech based on speech segment detection under a stationary noise

Non-Patent Citations (6)

* Cited by examiner, † Cited by third party
Title
ATSUO HIROE ED - JUSTINIAN ROSCA ET AL: "Solution of Permutation Problem in Frequency Domain ICA, Using Multivariate Probability Density Functions", INDEPENDENT COMPONENT ANALYSIS AND BLIND SIGNAL SEPARATION LECTURE NOTES IN COMPUTER SCIENCE;;LNCS, SPRINGER-VERLAG, BE, vol. 3889, 2006, pages 601 - 608, XP019028869, ISBN: 3-540-32630-8 *
CIARAMELLA A ET AL: "Amplitude and permutation indeterminacies in frequency domain convolved ICA", IJCNN 2003. PROCEEDINGS OF THE INTERNATIONAL JOINT CONFERENCE ON NEURAL NETWORKS 2003. PORTLAND, OR, JULY 20 - 24, 2003, INTERNATIONAL JOINT CONFERENCE ON NEURAL NETWORKS, NEW YORK, NY : IEEE, US, vol. VOL. 4 OF 4, 20 July 2003 (2003-07-20), pages 708 - 713, XP010652512, ISBN: 0-7803-7898-9 *
DAVIES M E ET AL: "Audio source separation of convolutive mixtures", IEEE TRANSACTIONS ON SPEECH AND AUDIO PROCESSING, IEEE SERVICE CENTER, NEW YORK, NY, US, vol. 11, no. 5, September 2003 (2003-09-01), pages 489 - 497, XP011100008, ISSN: 1063-6676 *
FUTOSHI ASANO ET AL: "Combined Approach of Array Processing and Independent Component Analysis for Blind Separation of Acoustic Signals", IEEE TRANSACTIONS ON SPEECH AND AUDIO PROCESSING, IEEE SERVICE CENTER, NEW YORK, NY, US, vol. 11, no. 3, May 2003 (2003-05-01), pages 204 - 215, XP011079702, ISSN: 1063-6676 *
NOBORU MURATA: "Introduction to the independent component analysis", 1 January 2004 (2004-01-01), XP055054630 *
SAWADA H ET AL: "A robust and precise method for solving the permutation problem of frequency-domain blind source separation", IEEE TRANSACTIONS ON SPEECH AND AUDIO PROCESSING, IEEE SERVICE CENTER, NEW YORK, NY, US, vol. 12, no. 5, September 2004 (2004-09-01), pages 530 - 538, XP003001158, ISSN: 1063-6676 *

Cited By (3)

* Cited by examiner, † Cited by third party
Publication number Priority date Publication date Assignee Title
EP2312578A4 (en) * 2008-07-11 2012-09-12 Nec Corp Signal analyzing device, signal control device, and method and program therefor
CN102081928A (en) * 2010-11-24 2011-06-01 南京邮电大学 Method for separating single-channel mixed voice based on compressed sensing and K-SVD
CN102081928B (en) * 2010-11-24 2013-03-06 南京邮电大学 Method for separating single-channel mixed voice based on compressed sensing and K-SVD

Also Published As

Publication number Publication date
JP4556875B2 (en) 2010-10-06
CN101086846A (en) 2007-12-12
US7797153B2 (en) 2010-09-14
JP2007193035A (en) 2007-08-02
KR20070076526A (en) 2007-07-24
CN100559472C (en) 2009-11-11
US20070185705A1 (en) 2007-08-09

Similar Documents

Publication Publication Date Title
US7797153B2 (en) Speech signal separation apparatus and method
JP4449871B2 (en) Audio signal separation apparatus and method
US7895038B2 (en) Signal enhancement via noise reduction for speech recognition
Smaragdis et al. Supervised and semi-supervised separation of sounds from single-channel mixtures
CN112567459B (en) Sound separation device, sound separation system, sound separation method and storage medium
JP4403436B2 (en) Signal separation device, signal separation method, and computer program
US20080228470A1 (en) Signal separating device, signal separating method, and computer program
EP2960899A1 (en) Method of singing voice separation from an audio mixture and corresponding apparatus
US11862141B2 (en) Signal processing device and signal processing method
Stöter et al. Common fate model for unison source separation
CN116964668A (en) Signal processing devices and methods and programs
US7809560B2 (en) Method and system for identifying speech sound and non-speech sound in an environment
JP7046636B2 (en) Signal analyzers, methods, and programs
US10839823B2 (en) Sound source separating device, sound source separating method, and program
US12148437B2 (en) Feature domain bandwidth extension and spectral rebalance for ASR data augmentation
US12417777B2 (en) Information processing device and method for outputting a target sound signal from a mixed sound signal
He et al. A Novel Weighted Sparse Component Analysis for Underdetermined Blind Speech Separation
Li et al. Speech Enhancement Using Non-negative Low-Rank Modeling with Temporal Continuity and Sparseness Constraints
Hermus et al. Perceptual Speech Enhancement with SVD-based Subspace Filtering
Verhaegen NMF-based reduction of background sounds in TV shows for better automatic speech recognition
Schlüter Vocal tract normalization equals linear transformation in cepstral space

Legal Events

Date Code Title Description
PUAI Public reference made under article 153(3) epc to a published international application that has entered the european phase

Free format text: ORIGINAL CODE: 0009012

AK Designated contracting states

Kind code of ref document: A1

Designated state(s): AT BE BG CH CY CZ DE DK EE ES FI FR GB GR HU IE IS IT LI LT LU LV MC NL PL PT RO SE SI SK TR

AX Request for extension of the european patent

Extension state: AL BA HR MK YU

17P Request for examination filed

Effective date: 20080116

17Q First examination report despatched

Effective date: 20080214

AKX Designation fees paid

Designated state(s): DE FR GB

GRAP Despatch of communication of intention to grant a patent

Free format text: ORIGINAL CODE: EPIDOSNIGR1

INTG Intention to grant announced

Effective date: 20130409

RIN1 Information on inventor provided before grant (corrected)

Inventor name: HIROE, ATSUO

STAA Information on the status of an ep patent application or granted ep patent

Free format text: STATUS: THE APPLICATION IS DEEMED TO BE WITHDRAWN

18D Application deemed to be withdrawn

Effective date: 20130820