EP1811041A1 - Biomarkers for liver fibrotic injury - Google Patents
Biomarkers for liver fibrotic injury Download PDFInfo
- Publication number
- EP1811041A1 EP1811041A1 EP07001462A EP07001462A EP1811041A1 EP 1811041 A1 EP1811041 A1 EP 1811041A1 EP 07001462 A EP07001462 A EP 07001462A EP 07001462 A EP07001462 A EP 07001462A EP 1811041 A1 EP1811041 A1 EP 1811041A1
- Authority
- EP
- European Patent Office
- Prior art keywords
- seq
- protein
- cirrhosis
- chosen
- liver fibrosis
- Prior art date
- Legal status (The legal status is an assumption and is not a legal conclusion. Google has not performed a legal analysis and makes no representation as to the accuracy of the status listed.)
- Ceased
Links
Images




Classifications
-
- G—PHYSICS
- G01—MEASURING; TESTING
- G01N—INVESTIGATING OR ANALYSING MATERIALS BY DETERMINING THEIR CHEMICAL OR PHYSICAL PROPERTIES
- G01N33/00—Investigating or analysing materials by specific methods not covered by groups G01N1/00 - G01N31/00
- G01N33/48—Biological material, e.g. blood, urine; Haemocytometers
- G01N33/50—Chemical analysis of biological material, e.g. blood, urine; Testing involving biospecific ligand binding methods; Immunological testing
- G01N33/68—Chemical analysis of biological material, e.g. blood, urine; Testing involving biospecific ligand binding methods; Immunological testing involving proteins, peptides or amino acids
- G01N33/6893—Chemical analysis of biological material, e.g. blood, urine; Testing involving biospecific ligand binding methods; Immunological testing involving proteins, peptides or amino acids related to diseases not provided for elsewhere
-
- C—CHEMISTRY; METALLURGY
- C12—BIOCHEMISTRY; BEER; SPIRITS; WINE; VINEGAR; MICROBIOLOGY; ENZYMOLOGY; MUTATION OR GENETIC ENGINEERING
- C12Q—MEASURING OR TESTING PROCESSES INVOLVING ENZYMES, NUCLEIC ACIDS OR MICROORGANISMS; COMPOSITIONS OR TEST PAPERS THEREFOR; PROCESSES OF PREPARING SUCH COMPOSITIONS; CONDITION-RESPONSIVE CONTROL IN MICROBIOLOGICAL OR ENZYMOLOGICAL PROCESSES
- C12Q1/00—Measuring or testing processes involving enzymes, nucleic acids or microorganisms; Compositions therefor; Processes of preparing such compositions
- C12Q1/68—Measuring or testing processes involving enzymes, nucleic acids or microorganisms; Compositions therefor; Processes of preparing such compositions involving nucleic acids
- C12Q1/6876—Nucleic acid products used in the analysis of nucleic acids, e.g. primers or probes
- C12Q1/6883—Nucleic acid products used in the analysis of nucleic acids, e.g. primers or probes for diseases caused by alterations of genetic material
-
- G—PHYSICS
- G01—MEASURING; TESTING
- G01N—INVESTIGATING OR ANALYSING MATERIALS BY DETERMINING THEIR CHEMICAL OR PHYSICAL PROPERTIES
- G01N33/00—Investigating or analysing materials by specific methods not covered by groups G01N1/00 - G01N31/00
- G01N33/48—Biological material, e.g. blood, urine; Haemocytometers
- G01N33/50—Chemical analysis of biological material, e.g. blood, urine; Testing involving biospecific ligand binding methods; Immunological testing
- G01N33/5005—Chemical analysis of biological material, e.g. blood, urine; Testing involving biospecific ligand binding methods; Immunological testing involving human or animal cells
- G01N33/5008—Chemical analysis of biological material, e.g. blood, urine; Testing involving biospecific ligand binding methods; Immunological testing involving human or animal cells for testing or evaluating the effect of chemical or biological compounds, e.g. drugs, cosmetics
- G01N33/502—Chemical analysis of biological material, e.g. blood, urine; Testing involving biospecific ligand binding methods; Immunological testing involving human or animal cells for testing or evaluating the effect of chemical or biological compounds, e.g. drugs, cosmetics for testing non-proliferative effects
- G01N33/5023—Chemical analysis of biological material, e.g. blood, urine; Testing involving biospecific ligand binding methods; Immunological testing involving human or animal cells for testing or evaluating the effect of chemical or biological compounds, e.g. drugs, cosmetics for testing non-proliferative effects on expression patterns
-
- C—CHEMISTRY; METALLURGY
- C12—BIOCHEMISTRY; BEER; SPIRITS; WINE; VINEGAR; MICROBIOLOGY; ENZYMOLOGY; MUTATION OR GENETIC ENGINEERING
- C12Q—MEASURING OR TESTING PROCESSES INVOLVING ENZYMES, NUCLEIC ACIDS OR MICROORGANISMS; COMPOSITIONS OR TEST PAPERS THEREFOR; PROCESSES OF PREPARING SUCH COMPOSITIONS; CONDITION-RESPONSIVE CONTROL IN MICROBIOLOGICAL OR ENZYMOLOGICAL PROCESSES
- C12Q2600/00—Oligonucleotides characterized by their use
- C12Q2600/158—Expression markers
-
- G—PHYSICS
- G01—MEASURING; TESTING
- G01N—INVESTIGATING OR ANALYSING MATERIALS BY DETERMINING THEIR CHEMICAL OR PHYSICAL PROPERTIES
- G01N2800/00—Detection or diagnosis of diseases
- G01N2800/08—Hepato-biliairy disorders other than hepatitis
- G01N2800/085—Liver diseases, e.g. portal hypertension, fibrosis, cirrhosis, bilirubin
Definitions
- liver fibrosis and/or cirrhosis based on the differential expression of various proteins
- kits for diagnosing fibrosis and/or cirrhosis are described.
- Liver fibrosis represents a continuous disease spectrum characterized by an increase in total liver collagen and other matrix proteins that disrupt the architecture of the liver and impair liver function (1, 2).
- the progression of fibrosis in the liver is a response to necroinflammatory changes.
- the overall liver fibrosis process is one of dynamic inflammation and repair and has the potential to be resolved (3). Fibrosis is seen as scar formation in the patient's liver. When the liver becomes permanently injured and scarred, the condition is called cirrhosis.
- Liver fibrosis and/or cirrhosis are the major risk factors of hepatocellular carcinoma (HCC).
- HCC hepatocellular carcinoma
- HBV hepatitis B virus
- HCV hepatitis C virus
- cirrhosis being the end-stage of fibrosis.
- the cirrhosis caused by these risk factors often progresses insidiously. Patients with end-stage liver cirrhosis can die within one year unless they accept liver transplantation, which has a 75% five-year survival rate (3).
- the inventors have used differential analysis such as microarray mRNA expression profiling and quantitative protein profiling to find additional unique and identifiable signatures potentially valuable for the diagnosis and treatment of liver fibrosis and/or cirrhosis.
- the invention provides a method of detecting liver fibrosis and/or cirrhosis comprising obtaining a biological sample from a patient and assaying the sample for differential expression of at least one gene encoding a protein chosen from SEQ ID NO: 1 - SEQ ID NO: 63 and human orthologs thereof, wherein the differential expression of at least one gene suggests the presence of liver fibrosis and/or cirrhosis.
- kits for diagnosing liver fibrosis and/or cirrhosis which comprises one or more nucleic acid probes that hybridize to nucleic acid molecules of at least one gene encoding a protein chosen from SEQ ID NO: 1 - SEQ ID NO: 63 and human orthologs thereof and packaging indicating use for detection of liver fibrosis and/or cirrhosis.
- kits for diagnosing liver fibrosis comprising one or more nucleic acid probes as described above, wherein the human orthologs comprise at least one gene encoding a protein chosen from SEQ ID NO: 64 - SEQ ID NO: 120.
- the invention further provides a kit for diagnosing liver fibrosis and/or cirrhosis that comprises one or more antibodies that specifically bind to at least one protein encoded by a sequence chosen from SEQ ID NO: 1 - SEQ ID NO: 63 and human orthologs thereof, and packaging indicating use for detection of liver fibrosis and/or cirrhosis.
- kits for diagnosis of liver fibrosis and/or cirrhosis comprising one or more antibodies as described above, wherein the human orthologs comprise at least one gene encoding a protein chosen from SEQ ID NO: 64 - SEQ ID NO: 120.
- the invention also provides a method of identifying a compound that decreases the differential expression of at least one gene encoding a protein chosen from SEQ ID NO: 7 - SEQ ID NO: 23 and SEQ ID NO: 42 - SEQ ID NO: 63 and human orthologs thereof, comprising providing a cell expressing at least one of the aforementioned genes, contacting the cell with a test compound, and determining whether the differential expression of the at least one gene is decreased in the presence of the test compound, wherein the decreased differential expression is an indication of halting or reversing liver fibrosis and/or cirrhosis.
- the invention further provides a method of identifying a compound that increases the differential expression of at least one gene encoding a protein chosen from SEQ ID NO: 1 - SEQ ID NO: 6 and SEQ ID NO: 24 - SEQ ID NO: 41 and human orthologs thereof, comprising providing a cell expressing at least one of the aforementioned genes, contacting the cell with a test compound, and determining whether the differential expression of the at least one gene is increased in the presence of the test compound, wherein the increased differential expression is an indication of halting or reversing liver fibrosis and/or cirrhosis.
- Table 1 is the result of a biochemical analysis of the serum of rats treated with dimethylnitrosamine (DMN) as compared with that of the control rats over a six-week time period.
- DN dimethylnitrosamine
- Table 2 is a list of genes showing significant changes in gene expression and their human orthologs. The genes were selected from the combined results of microarray analysis and quantitative proteomic analysis and those whose relationship to fibrosis are not yet disclosed in public literature.
- Table 3 is the result of interacting network analysis for the proteins showing significant changes in expression in oligonucleotide microarray (Table 3A) and iTRAQ proteomic (Table 3B) studies. Proteins in the network identified in the present study which have not previously been reported to associate with liver injury are shown in bold.
- the term "biological sample” refers to any biological material collected from cells, tissues, or organs of the subject.
- the source of the biological sample may vary depending on the particular symptoms present in the subject to be diagnosed.
- the biological sample may be analyzed immediately after it is taken, or stored. If stored, the sample may be equilibrated with an appropriate storage buffer, and kept at 4°C, at -20°C, at -70°C, or even in cryogenic liquids, such as liquid nitrogen or liquid helium.
- the biological sample may consist of blood, serum, or plasma.
- the biological sample may consist of a biopsy or tissue sample.
- the biological sample may consist of aminotic fluid, milk, saliva, cerebrospinal fluid, lymph, sweat, mucus, synovial fluid, lacrimal fluid, or other clinical specimens or samples.
- the term "patient” refers to a mammalian animal, including but not limited to human, primates, domestic mammals, laboratory mammals, etc..
- RNA/mRNA level refers to gene expression on the RNA/mRNA level, protein level, or both RNA/mRNA and protein levels as compared to normal gene expression, e.g., an increased or decreased gene expression on the RNA/mRNA level, protein level, or both RNA/mRNA and protein levels.
- the terms "gene” and “gene encoding a protein” refer to any nucleic acid sequence or portion thereof with a functional role in encoding or transcribing a protein.
- the gene may encompass all the nucleic acids responsible for encoding a functional protein of certain SEQ ID NO or only a portion of the nucleic acids responsible for encoding or expressing a protein of certain SEQ ID NO.
- the nucleic acid sequence may contain normal sequences as well as genetic abnormalities within exons, introns, initiation or termination regions, promoter sequences, other regulatory sequences or unique adjacent regions to the gene.
- human ortholog refers to a corresponding human gene wherein the non-human gene and the human gene are derived from a single ancestral gene in the last common ancestor of human and non-human, and the human genes have the same function.
- probes refers to hybridization probes that are oligonucleotides that bind in a base-specific manner to a complementary strand of nucleic acid. Such probes also include peptide nucleic acids, as described in Nielsen et al., 1991, (13), and other nucleic acid analogs and nucleic acid mimetics. See, e.g., U.S. Pat. No. 6,156,501 , which is incorporated herein by reference.
- nucleic acid refers to any DNA or RNA/mRNA, for example, chromosomal, mitochondrial, viral and/or bacterial nucleic acid present in tissue sample as well as synthetic nucleic acids.
- nucleic acid encompasses either or both strands of a double stranded nucleic acid molecule and includes any fragment or portion of an intact nucleic acid molecule.
- packaging refers generally to packaging material comprising external labeling and internal material in the container, including but not limited to instructions for using the kit.
- the term “antibody,” refers to an immunoglobulin or a fragment or a derivative thereof, and encompasses any polypeptide comprising an antigen-binding site, whether produced in vitro or in vivo.
- the term includes, but is not limited to, polyclonal, monoclonal, monospecific, polyspecific, humanized, single-chain, chimeric, synthetic, recombinant, hybrid, mutated, and grafted antibodies.
- the term “antibody” also includes antibody fragments such as Fab, F(ab') 2 , Fv, scFv, Fd, dAb, and other antibody fragments that retain antigen-binding function, i.e., the ability to bind a specific antigen.
- an antigen-binding domain i.e., a part of an antibody molecule that comprises amino acids responsible for the specific binding between the antibody and the antigen.
- An antigen-binding domain typically comprises an antibody light chain variable region (V L ) and an antibody heavy chain variable region (V H ), however, it does not necessarily have to comprise both.
- V L antibody light chain variable region
- V H antibody heavy chain variable region
- Fd antibody fragment consists only of a V H domain, but still retains some antigen-binding function of the intact antibody.
- the term "specifically binds," or the like means that two molecules form a complex that is relatively stable under physiologic conditions (e.g., a stable antigen/antibody complex).
- the term is also applicable where, for example, an antigen-binding domain is specific for a particular epitope, which is found on a number of molecules.
- an antibody may specifically bind multiple proteins when it binds to an epitope present in each.
- Specific binding is characterized by a selective interaction, often including high affinity binding with a low to moderate capacity. Nonspecific binding is usually a less selective interaction, and may have a low affinity with a moderate to high capacity.
- binding is considered specific when the affinity is at least 10 5 M -1 , 10 6 M -1 , 10 7 M -1 or 10 8 M -1 .
- non-specific binding can be reduced without substantially affecting specific binding by varying the binding conditions.
- the conditions are usually defined in terms of concentrations of antibodies, ionic strength of the solution, temperature, time allowed for binding, concentration of non-related molecules (e.g., blocking agents such as serum albumin or milk casein), and so forth. See, e.g., Morgan et al., "The Matrix Effects on Kinetic Rate Constants of Antibody-Antigen Interactions Reflect Solvent Viscosity," J.
- protein refers to a polymeric form of any length of amino acids, which can include naturally-occurring or synthetic amino acids and coded and non-coded amino acids, peptides, depsipeptides, polypeptides with cyclic, bicyclic, depsicyclic, or depsibicyclic peptide backbones, single chain protein as well as multimers, as well as any fragment or portion of the intact protein molecule.
- the term "compound” refers to a substance comprising one or more chemical elements in any proportion and of any structure, including but not limited to cyclic, bicyclic, branched or straight chain.
- the compound may be organic or inorganic.
- the compound also refers to a composition comprising one or more chemical elements, one or more herbal/plant elements or herbal/plant extractions, or both chemical elements and herbal/plant elements or extractions.
- hepatocellular carcinoma HCC
- hepatic cirrhosis a chronic liver disease is a common and potentially lethal problem in Asia.
- the development of hepatocellular carcinoma (HCC) is generally preceded by hepatic cirrhosis, which occurs at the end stage of fibrosis.
- the same proteins are expressed in both cirrhosis and fibrosis. Changes in gene expression of these proteins during liver fibrosis are examined to identify markers of liver fibrosis to assist in the diagnosis of fibrosis and/or cirrhosis.
- the study begins with the establishment of a liver fibrosis model.
- Dimethylnitrosamine (DMN) a non-genotoxic hepatotoxin, is used to induce rat necroinflammatory and hepatic fibrosis, as described in Jezequel A.M.
- iTRAQ Reagents are a multiplexed set of four isobaric reagents. The four reagents are amine-specific and yield labeled peptides. The labeled peptides are identical in mass and hence also identical in single MS mode. They produce strong, diagnostic, lowmass MS/MS signature ions allowing for quantification of up to four different samples simultaneously.
- Quantification is performed via the differences in abundance of four product ions, i.e., productions weighing 114, 115, 116, and 117 daltons that are each cleaved from one of the four possible tags. Since all peptides are tagged, proteome coverage is expanded and analysis of multiple peptides per protein improves the confidence in those identified (16).
- the multi-sample capability of the iTRAQ technology provides a way to compare the protein expression profile of different liver states simultaneously.
- the model employed in the present study is very similar to the human liver study model, and thus findings from this study can have human clinical applications.
- This study employed DMN, a potent non-genotoxic hepatotoxin, to simulate liver fibrosis (17, 18). DMN has been demonstrated to induce liver damage rapidly and also has been empirically proven to be useful for the study of human fibrosis formation (14-15, 19) as mentioned above.
- the serum markers that showed significant differences in expression in the rat liver fibrosis model established in this study as compared to the controls, see Table 1, are the same serum markers for human liver fibrosis, e.g., the thirteen serum markers of albumin, glutamic oxaloacetic transaminase (GOT), glutamic pyruvic transaminase (GPT), total bilirubin, alkaline phosphatase (AKP), acid phosphatases (ACP), ⁇ -fetoprotein (AFP), blood urea nitrogen (BUN), cholesterol (CHOL), lactate dehydrogenase (LDH), globulin, prothrombin time (PT) and blood platelets (PLT).
- the markers identified from this study can be used to diagnose liver fibrosis and/or cirrhosis in humans.
- the 63 genes in DMN-treated rats have a difference in gene expression on the RNA/mRNA level and/or the protein level when compared to normal gene expression. Some genes are up-regulated while others are down-regulated. Those 63 rat genes were converted into their human ortholog genes according to the ortholog assertions from the EnsEMBL and HomoloGene database (Table 2 - SEQ ID NO: 1 - SEQ ID NO: 120).
- differential expression of a gene encoding a protein includes differential expression of the full length gene encoding a full length protein or a portion of the gene encoding a portion of the protein.
- the invention provides a method of detecting liver fibrosis and/or cirrhosis comprising obtaining a biological sample from a patient, and assaying the sample for differential expression of at least one gene encoding a protein chosen from SEQ ID NO: 1 to SEQ ID NO: 63 and human orthologs thereof, wherein the differential expression of at least one gene suggests the presence of liver fibrosis and/or cirrhosis.
- the invention provides a method of detecting liver fibrosis and/or cirrhosis by assaying the sample for differential expression of at least one gene encoding a protein chosen from the human orthologs comprising SEQ ID NO: 64 to SEQ ID NO: 120.
- differential gene expression may be assayed by transcription analysis or quantitative proteomic analysis such as microarray, Q-RT-PCR, ICAT and iTRAQ, or any other appropriate methods known to one skilled in the art.
- the invention relates to assaying the up-regulation or increased expression of one or more genes encoding a protein chosen from SEQ ID NO: 7 - SEQ ID NO: 23 and SEQ ID NO: 42 - SEQ ID NO: 63 and human orthologs thereof, wherein the increased expression suggests the presence of liver fibrosis and/or cirrhosis.
- the invention relates to assaying for the increased expression of at least one gene encoding a protein chosen from the human orthologs comprising SEQ ID NO: 68 - SEQ ID NO: 82 and SEQ ID NO: 100 - SEQ ID NO: 120.
- the invention also provides, in another embodiment, assaying for the down-regulation or decreased expression of one or more genes encoding a protein chosen from SEQ ID NO: 1 - SEQ ID NO: 6 and SEQ ID NO: 24 - SEQ ID NO: 41 and human orthologs thereof, wherein the decreased expression suggests the presence of liver fibrosis and/or cirrhosis.
- the invention relates to assaying for the decreased expression of at least one gene encoding a protein chosen from the human orthologs comprising SEQ ID NO: 64 - SEQ ID NO: 67 and SEQ ID NO: 83 - SEQ ID NO: 99.
- the invention also provides a clustering of the genes by functional groups.
- the invention provides a method of detecting liver fibrosis and/or cirrhosis comprising assaying a biological sample for differential expression of at least one gene encoding a protein that functions in cancer, cell cycle, and cell morphology chosen from sequences comprising SEQ ID NO: 9, SEQ ID NO: 69, SEQ ID NO: 12, SEQ ID NO: 72, SEQ ID NO: 4, SEQ ID NO: 65, SEQ ID NO: 17, SEQ ID NO: 76, SEQ ID NO: 7, SEQ ID NO: 68, SEQ ID NO: 19, SEQ ID NO: 78, SEQ ID NO: 5, SEQ ID NO: 66, SEQ ID NO: 20, SEQ ID NO: 79, SEQ ID NO: 22, SEQ ID NO: 81, SEQ ID NO: 21, and SEQ ID NO: 80; a protein that functions in lipid metabolism, small molecule biochemistry, organismal injury and abnormalities chosen from sequences comprising SEQ ID NO: 10, S
- kits based on the genes and/or proteins described above.
- a kit for diagnosing liver fibrosis and/or cirrhosis that comprises one or more nucleic acid probes that hybridize to nucleic acid molecules of at least one gene encoding a protein marker chosen from SEQ ID NO: 1 - SEQ ID NO: 63 and human orthologs thereof and packaging indicating the use for detecting liver fibrosis.
- the kit can detect the differential expression, e.g., the up-regulation or down-regulation, of these genes, wherein the differential expression would suggest liver fibrosis and/or cirrhosis.
- the invention also provides a kit for diagnosing fibrosis and/or cirrhosis comprising nucleic acid probes that hybridize to nucleic acid molecules of at least one gene encoding a protein marker chosen from SEQ ID NO: 1 - SEQ ID NO: 63 and human orthologs thereof. The differential expression of the genes would suggest fibrosis and/or cirrhosis.
- the diagnostic kit comprises one or more nucleic acid probes that hybridize to nucleic acid molecules of at least one gene encoding the human orthologs comprising proteins chosen from SEQ ID NO: 64 - SEQ ID NO: 120 for diagnosing liver fibrosis and/or cirrhosis.
- the kit may be prepared by techniques known to one skilled in the art.
- the probes may be labeled, using labeling techniques that are known to one skilled in the art, to facilitate detection, including but not limited to radioisotope labels or fluorescent labels.
- the probes can hybridize to nucleic acid molecules that are either or both strands of a double stranded nucleic acid molecule and include any fragment or portion of an intact nucleic acid molecule.
- Nucleic acid hybridization is affected by such conditions as salt concentration, temperature, or organic solvents, in addition to the base composition, length of the complementary strands, and the number of nucleotide base mismatches between the hybridizing nucleic acids, as will be readily appreciated by those skilled in the art.
- Stringency conditions depend on the length and base composition of the nucleic acid, which can be determined by techniques well known in the art. Generally, stringency can be altered or controlled by, for example, manipulating temperature and salt concentration during hybridization and washing. For example, a combination of high temperature and low salt concentration increases stringency.
- Such conditions are known to those skilled in the art and can be found in, for example, Strauss, W.M. "Hybridization With Radioactive Probes," in Current Protocols in Molecular Biology 6.3.1-6.3.6, (John Wiley & Sons, N.Y. 2000 ). Both aqueous and nonaqueous conditions as described in the art can be used.
- stringent hybridization conditions hybridization in 0.1 ⁇ SSC (15 mM sodium chloride/1.5 mM sodium citrate) at 50°C or higher.
- Another example of stringent hybridization conditions is hybridization overnight at 42°C in 50% formamide, 1X SSC (150 mM NaCl, 15 mM sodium citrate), 50 mM sodium phosphate (pH 7.6), 5X Denhardt's solution, 10% (w/v) dextran sulfate, and 20 ⁇ g/ml denatured, sheared salmon sperm DNA, followed by washing in 0.1X SSC at about 65°C.
- Highly stringent conditions can include, for example, aqueous hybridization (e.g., free of formamide) in 6X SSC (where 20X SSC contains 3.0 M NaCl and 0.3 M sodium citrate), 1% (w/v) sodium dodecyl sulfate (SDS) at 65°C for about 8 hours (or more), followed by one or more washes in 0.2 X SSC, 0.1 % SDS at 65°C.
- 6X SSC where 20X SSC contains 3.0 M NaCl and 0.3 M sodium citrate
- SDS sodium dodecyl sulfate
- Moderately stringent hybridization conditions permit a nucleic acid to bind a complementary nucleic acid that has at least about 60%, at least about 75%, at least about 85%, or greater than about 90% identity to the complementary nucleic acid.
- Stringency of hybridization is generally reduced by decreasing hybridization and washing temperatures, adding formamide to the hybridization buffer, or increasing salt concentration of the washing buffer, either individually or in combination.
- Moderately stringent conditions can include, for example, aqueous hybridization (e.g., free of formamide) in 6X SSC, 1% (w/v) SDS at 65°C for about 8 hours (or more), followed by one or more washes in 2X SSC, 0.1% SDS at room temperature.
- Another exemplary hybridization under moderate stringency comprises hybridization in 6X SSC, 5X Denhardt's reagent, 0.5% (w/v) SDS, and optionally 100 ⁇ g/ml sonicated salmon or herring sperm DNA, at about 42°C, followed by washing in 2X SSC, 0.1% (w/v) SDS at 65°C.
- the invention provides a kit for diagnosing liver fibrosis and/or cirrhosis comprising one or more antibodies that specifically bind to at least one protein encoded by a sequence chosen from SEQ ID NO: 1 - SEQ ID NO: 63 and human orthologs thereof, and further comprises packaging that indicates use for detection of liver fibrosis and/or cirrhosis.
- the kit comprises one or more antibodies that specifically bind to at least one human ortholog protein encoded by a sequence chosen from SEQ ID NO: 64 - SEQ ID NO: 120, and further comprises packaging that indicates use for detection of liver fibrosis and/or cirrhosis. Differential expression of these genes suggests the presence of fibrosis and/or cirrhosis.
- the antibodies specific to the proteins may be obtained by monoclonal or polyclonal techniques known to one skilled in the art.
- the antibody can be labeled with radioisotopes such as 35 S, 14 C, 125 I, 3 H, and 131 I, using the techniques described in Current Protocols in Immunology (20), as an example.
- the radioactivity can be measured using scintillation counting.
- the antibody may also be fluorescently labeled by, for example, rare earth chelates (europium chelates), Texas Red, rhodamine, fluorescein, dansyl, Lissamine, umbelliferone, phycocrytherin, phycocyanin, or commercially available fluorophores such SPECTRUM ORANGE ® and SPECTRUM GREEN ® and/or derivatives of any one or more of the above.
- the fluorescent labels can be conjugated to the antibody using the techniques disclosed in Current Protocols in Immunology, supra., for example. Fluorescence can be quantified using a fluorimeter.
- Differential protein expression may be assayed using antibodies with commonly used methods known in the art, such as Western blotting or enzyme-linked immunosorbent assay (ELISA).
- Western blotting begins with an electrophoresis step, where proteins from a biological sample of interest are separated on the basis of size and electromagnetic charge by sodium dodecyl sulfate-polyacrylamide gel electrophoresis (SDS-PAGE), according to standard methods known in the art. See, e.g., SAMBROOK ET AL., 3 MOLECULAR CLONING: A LABORATORY MANUAL A8.40-A8.45 (2001 ) (describing various reagents and methods for electrophoresis of proteins by SDS-PAGE).
- the contents of the gel are then transferred to nitrocellulose, nylon, PVDF, or other membrane or filter suitable for fixation and Western blotting by standard methods also known in the art.
- the transfer may be by immersion, semi-dry blotting, or by other comparable methods known in the art.
- the.filters or membranes are fixed to prevent loss of the target proteins during the several hybridization, washing, and staining steps comprising Western blotting. Fixation may be accomplished by heat, cross-linking with ultraviolet light, or by other comparable methods known in the art.
- Non-specific antibody binding sites on the fixed filter or membrane are blocked with buffered solutions (e.g., phosphate-buffered saline ("PBS") or the like) containing a blocking agent such as, for example, 0.5% (w/v) low-fat dry milk or 5% (w/v) bovine serum albumin (BSA).
- PBS phosphate-buffered saline
- BSA bovine serum albumin
- Antibody-antigen complexes are then detected colorimetrically (e.g., with horseradish peroxidase and TMB), or by autoradiography (e.g., alkaline phosphatase). If detected colorimetrically, or by chemiluminescence, the amount of color of fluorescence may be measured using a luminometer, a spectrophotometer, or other similar instruments. If detected autoradiographically, the amount of bound antibody may be measured from the exposed x-ray film using a densitometer, or similar instrument. See, e.g., SAMBROOK ET AL., 3 MOLECULAR CLONING: A LABORATORY MANUAL A8.52-A8.55 .
- Secondary antibodies used in Western blotting may be labeled with a ligand (such as biotin) or a detectable marker (such as a fluorescent group or an enzyme) using conventional techniques.
- a label include fluorophores, chromophores, electron-dense reagents (e.g., silver or gold), enzymes, and ligands having specific binding partners.
- Enzymes such as horseradish peroxidase or alkaline phosphatase are typically detected by their activity. For example, horseradish peroxidase can be detected by its ability to convert tetramethylbenzidine (TMB) to a blue pigment, quantifiable with a spectrophotometer.
- TMB tetramethylbenzidine
- Suitable ligands and/or detectable markers include bioting and avidin or streptavidin, IgG and protein A, and the numerous additional receptor-ligand couples known in the art. Other permutations and possibilities will be readily apparent to those of ordinary skill in the art, and are considered as equivalents within the scope of the instant invention.
- An ELISA begins with an antigen adsorption step, where the target antigen or antigens are adsorbed to the wells of a microtiter plate. See, e.g., KIERKE-GAARD & PERRY LABORATORIES, INC., TECHNICAL GUIDE FOR ELISA 9-13 (2003 ), available at http: // www.kpl.com / docs / techdocs / chapters%201%20-%204.pdf (last accessed January 12, 2007).
- a blocking buffer to block non-specific antibody binding and to minimize false positive results. See, e.g., id. at 13-14 (discussing methods and reagents for blocking microtiter plates).
- casein the main protein component of non-fat dry milk
- caseinate a more soluble version of casein, produced by partial digestion with sodium hydroxide
- normal serum typically used
- Washing reagents are selected for their ability to disrupt low-affinity interactions between various reaction components that can affect the ability to detect specific antigen-antibody interactions. See, e.g., id. at 14-15 (discussing methods and reagents for washing microtiter plates). Wash solutions commonly contain a physiological buffer to prevent denaturation of antigens and their cognate antibodies, and to preserve enzyme activity. Buffers such as PBS, Tris-saline, or imidizole-buffered saline at neutral pH are widely used. Specific buffers are typically selected based on the method of detection to be employed in a particular assay.
- Wash buffers should also include non-ionic detergents such as Tween-20 TM , Triton X-100 TM , or the like, at concentrations of between 0.01% to 0.05% (v/v), in order to disrupt low-affinity, non-specific interactions between reaction components.
- non-ionic detergents such as Tween-20 TM , Triton X-100 TM , or the like, at concentrations of between 0.01% to 0.05% (v/v), in order to disrupt low-affinity, non-specific interactions between reaction components.
- the wells of the microtiter plate are washed.
- the adsorbed antigen then undergoes the primary antibody incubation, after which it is washed again.
- Antibody/antigen complexes are then detected using a secondary antibody labeled with chromogenic (e.g., horseradish peroxidase and TMB), fluorescent or chemiluminescent (e.g., alkaline phosphatase) means. See, e.g., id. at 15-21 (discussing antibody preparation and use, as well as commonly used detection molecules).
- the amount of color or fluorescence may be measured using a luminometer, a spectrophotometer, or other similar instruments.
- the method provides a cell expressing at least one of these genes, contacting the cell with a test compound to determine whether the differential expression is decreased in the presence of the test compound, wherein the differential expression is an indication of halting or reversing liver fibrosis and/or cirrhosis.
- the same method can also identify a compound that would increase the differential expression of at least one gene encoding a protein chosen from SEQ ID NO: 1 - SEQ I D NO: 6 and SEQ ID NO: 24 - SEQ ID NO: 41 and human orthologs thereof.
- the invention encompasses the upper and lower limits and each intervening value between the upper and lower limits of the range to at least a tenth of the upper and lower limit's unit, unless the context clearly indicates otherwise. Further, the invention encompasses any other stated intervening values.
- DMN is a potent hepatoxin that specifically targets the liver and can cause liver fibrosis.
- the histopathological changes resulting from DMN treatment involve the rapid deposition of collagen, the major protein of fibrosis and important to the process of cirrhosis.
- DMN-induced liver injury in rats displays many features, such as portal hypertension ascites as well as a number of other histopathological and biochemical abnormalities.
- DMN-induced liver injury in rats could reflect changes that occur in human hepatic fibrosis and/or cirrhosis and that it is an appropriate animal model for studying human hepatic fibrosis and/or cirrhosis (15).
- the DMN-induced liver fibrosis model was performed as described in Jezequel A.M. et al. (14). Male Sprague-Dawley rats (Slc:SD; Japan SLC, Shizuoka, Japan), weighing from 300 to 350 grams, were used in the experiments.
- the rats were given DMN (Sigma, Saint Louis, MO), dissolved in normal saline, three consecutive days a week for the first three consecutive weeks at the dosage of 6.7 mg/kg per body weight by intraperitoneal injection. Injection time points are shown as inverted triangles in Figure 1. Injections were at a much lower dosage than those used in other experiments where the dosage was 100 mg/kg/day. The higher dosage can cause toxicity in rat liver (21, 22).)
- Liver tissues were immediately removed after sacrifice and subject to histopathological examination. The fixed liver samples were then processed for paraffin embedding. Five micrometer (5 ⁇ m) sections were prepared for hematoxylin and eosin staining (to score necroinflammatory and fatty changes) and for Sirius red/fast green collagen staining (to score for fibrosis) (23). The fatty changes were classified as presence (+) or absence (-).
- FIG. 2A Phenotypic changes resulting from DMN-induced liver damage are shown in Figure 2A.
- the representative phenotypes of the DMN-induced rat liver fibrosis were characterized by scoring the four histopathological features (necrosis, inflammation, fibrosis, and fatty change) as follows: the necrosis scores were from N0 to N3 (the first panel), and the inflammation scores were from I0 to I3.
- the scoring system for examining the intensity of liver fibrosis was modified from the scoring system of the Hepatitis Activity Index (HAI) (29, 30).
- HAI Hepatitis Activity Index
- Fibrosis was divided into four scores: normal (F0), fibrous expansion of portal tracts (F1), bridging fibrosis (F2) and frequent bridging fibrosis with focal nodule formation (F3).
- the fatty change was scored as present (+) or absent (-), respectively (the last panel).
- the images of the fatty change are shown at 200X magnification, whereas the others are shown at 100X magnification (Fig. 2A).
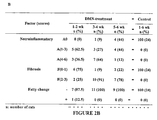
- Figure 2B shows a summary of histopathological scores for the rat model. The results were ranked by time course.
- the necroinflammatory scores were the sum of the necrosis and inflammation scores and range from A0 to A6.
- the fatty change was shown as presence (+) or absence (-). The number of rats was counted and used to calculate the percentage of each histopathological level at each time point.
- Quantitative Real-Time Polymerase Chain Reaction Q-RT-PCR
- RNA preparation and analysis were performed according to Affymetrix's (Santa Clara, CA, U.S.A.) instructions.
- the TaqMan ® assays were conducted in triplicate for each sample, and a mean value was used for calculation of expression levels.
- GAT glutamic oxaloacetic transaminase
- GPT glutamic pyruvic transaminase
- total bilirubin alkaline phosphatase
- Example 2 Establishment of Gene Expression Profile During DMN-Induced Liver Fibrosis Microarray Analysis
- RNA quality was determined using Spectra Max Plus (Molecular Devices, Sunnyvale, CA, U.S.A.) and had an A 260 /A 280 ratio ranging from 1.9 to 2.1. Protocols and reagents for hybridization, washing and staining followed Affymetrix's instructions ( http: // www.affymetrix.com / support / technical / manuals.affx). Labeled cRNA was hybridized to the Affymetrix GeneChip Test 3 Array to verify the quality prior to hybridization to the Affymetrix Rat Genome U34A Array.
- microarray images were transformed into text files containing intensity information using GeneChip ® Operating Software (GCOS) developed by Affymetrix.
- GCOS GeneChip ® Operating Software
- the microarray datasets were then analyzed using GeneSpring ® 7.2 software (Silicon Genetics, Redwood City, CA, U.S.A.).
- liver tissues of 12 control animals and 12 DMN-treated rats (2 rats for each time point) were selected to perform microarray experiments. Before any statistical analyses were applied to the microarray data, reproducibility was assessed. Genes were selected as present when they were assigned a present call according to the perfect match (PM)/mismatch (MM) algorithm of Affymetrix in all gene chips (28). Of the 8799 probe sets analyzed, overall expression patterns for 2385 transcripts on the chips were reported to be present (P ⁇ 0.05). To verify that intra-sample variability did not obscure differences between the controls and DMN-treated groups, as well as to determine the fold-change that should be considered as significant, expression profiles among the 24 control datasets were compared.
- transcripts were filtered by forming two independent clusters from the microarray data and identifying those that were differentially expressed.
- the first cluster generated 2385 transcripts as previously described.
- 268 were differentially expressed transcripts either higher or lower by 1.5 fold or more when comparing the controls and DMN-treated groups.
- the second method which used the "detection flag" selection (24), reported 23 transcripts as "present” in the DMN-treated groups but not in the controls. In contrast, there was only one transcript reported "absent" in all DMN-treated groups but "present” in the controls.
- 292 transcripts representing 256 genes, including 137 up-regulated and 119 down-regulated genes, exhibited differentially expressed gene expression patterns when the DMN-treated groups and controls were compared.
- Hierarchical clustering generated a dendrogram for the gene expression patterns of these 292 transcripts across the 24 samples as shown in Figure 3A.
- the rows represent individual transcripts and columns represent time course samples.
- the color in each cell reflects the expression level of the corresponding tissue, relative to its mean expression level.
- the scale extends from fluorescence radios of 0.25 to 4 relative to the mean level for all samples.
- Quantitative-Real-Time-Reverse-Transcriptase Polymerase Chain Reaction Q-RT-PCR
- Timp1 ( Figure 3B), Timp2, Mmp3, Ggtp (data not shown) and Tgf ⁇ 1 (shown previously in Figure 1 B) were elevated in DMN-treated samples.
- Timp1 expression was elevated over 20-fold in DMN-treated rats in both microarray and Q-RT-PCR experiments.
- TaqMan ® assays were conducted in triplicate for each sample, and a mean value was used for calculation of expression levels (marked by the square).
- 18S rRNA from each sample was quantified on the same plate as the target gene, as indicated by the log scale on the right side of plot.
- Timp1 The expression levels of the two Timp1 transcripts, rc_Al169327_at and rc_Al169327_g_at (marked by a circle and a triangle, respectively), were set forth relative to the mean of all gene expression levels as indicated by the scale on the left side of plot.
- the expression pattern of Timp1 was highly correlated between the Q-RT-PCR results and the GeneChip analysis (the Pearson's correlation coefficients were 0.79 and 0.92, respectively) (Figure 3B), suggesting that the gene expression results were reliable when subject to more detailed analysis.
- Necroinflammatory and fibrosis have been suggested to play important roles in the progression of liver cirrhosis in the rat model (8, 23, 24, 29, 30).
- all rat samples were classified by histopathological evaluation with histopathological scores for necroinflammation (A0-A6) and fibrosis (F0-F3) as described earlier in Figure 2B.
- the student t -test statistic analysis was used for fibrosis-related genes analysis as it was based on the two-subgroup (F(0-1) and F(2-3)) variation in fibrosis score. A P-value of less than 0.05 was considered to be statistically significant.
- Timp1 is a well-known fibrosis marker and has been proven to play a significant role in the progression of liver fibrosis.
- HSCs hepatic stellate cells
- MMPs matrix metalloproteinases
- An increase in expression of Timp1 leads to a more global inhibition of degradation of fibrillar liver collagens by interstitial collagenases (MMP-1/MMP-13) (35).
- MMP-1/MMP-13 interstitial collagenases
- CD63 a transmembrane protein, one of the fibrosis gene signatures observed, is also up-regulated after DMN treatment.
- HSCs activate or differentiate into myofibroblast-like cells, acquiring contractile, proin-flammatory, and fibrogenic properties.
- Activated HSCs migrate and accumulate at the sites of tissue repair, secreting large amounts of extracellular matrix proteins during the progression of fibrosis.
- Activated HSCs have been identified as major collagenproducing cells (collagen is an extracellular matrix protein) and an initiator of liver fibrosis when the liver is injured (7). It has been demonstrated that inhibition of CD63 might be a novel diagnostic marker for the injured liver.
- Annexin A1 ( Anxa1 ) is highly expressed after liver injury in an alcoholic liver disease (ALD) study (34). Alcohol initiated liver injury occurs via inflammation. ALD progression involves continuing liver injury, fibrosis, and impaired liver regeneration. It has been suggested that Anxa1 might play a role in the progression of fibrosis.
- oligonucleotide microarray analysis is a powerful approach for monitoring molecular events during liver injury and repair where the pathogenesis is unknown.
- signature genes identified in this study could discriminate successfully between the low-score and the high-score histopathology groups. Together, the genes would seem to be responsible for fibrosis formation and are possible markers for the detection of fibrosis.
- liver tissues of 6 control and 6 DMN-treated rats were used to perform duplicate iTRAQ labeling experiments.
- Liver tissue was frozen in liquid nitrogen and then pulverized to powder using a mortar and pestle pre-cooled with liquid nitrogen. Then, the liquid nitrogen was allowed to evaporate, and the powdered tissue was separated into tubes and stored at -80°C.
- Tubes were incubated at -20°C until precipitate formed. After decanting the acetone, pellets were resuspended with 0.1% SDS and 6M urea in dissolution buffer (provided by iTRAQ Reagents Kit, Applied Biosystems, Foster City, CA, U.S.A.).
- the total protein contents were determined using the Coomassie Plus Protein Assay Reagent (PIERCE, Rockford, IL, U.S.A.). Two hundred (200) ⁇ g of proteins were taken and diluted by an equal volume (w/v) of dissolution buffer containing 0.1 % (w/v) SDS. Proteins were reduced and cysteines blocked as described in the iTRAQ protocol (Applied Biosystems, Foster City, CA, U.S.A.). Four volumes of dissolution buffer were added to each tube and incubated with 20 ⁇ g Trypsin at 37°C for 16 hours. Tryptic peptides extracted from liver tissue of controls and DMN-treated rats were labeled with iTRAQ 114 and 115, respectively, at each time point of the experiment.
- Peptides with different isobaric tags were pooled and acidified by mixing with 10 mM phosphoric acid (in 25% (v/v) acetonitrile and 75% H 2 O) to a total volume of 4.0 mL for strong cation exchange (SCX) chromatography.
- SCX strong cation exchange
- the resulting sample was injected into a liquid chromatography system (Ettan, GE Healthcare BioScience, Umea, Sweden) using a 2.1 mm ⁇ 200 mm Polysulfoethyl A column packed with 5 micron 300 A beads (PolyLC, Columbia, MD, U.S.A.) at a flow rate of 0.08 mL/min.
- a guard column of the same material was plumbed upstream from the analytical column.
- the buffers used were 10 mM KH 2 PO 4 , 25% (v/v) acetonitrile at pH 3.0 for buffer A and 10 mM KH 2 PO 4 , 1 M KCI, 25% (v/v) acetonitrile at pH 3.0 for buffer B.
- the elution gradient was changed linearly from 0 to 40% buffer B within 16 mL and then up to 100% buffer B in another 4 mL.
- a total of 30 fractions were collected and dried by speed vacuuming centrifugation. All the fractions were desalted on pepClean TM C-18 spin columns (PIERCE, Rockford, IL, U.S.A.).
- the desalted peptide from each SCX fraction was dried by speed vacuuming centrifugation and then analyzed by nanoLC hybrid mass spectrometry.
- the nanoLC system was from LC Packings (Amsterdam, The Netherlands), coupled to an API QSTAR Pulsar Hybrid QqTOF mass spectrometer (Applied Biosystems/MDS Sciex, Foster City, CA, U.S.A.).
- Peptide separation was performed using a reversed-phase C 18 column (75 ⁇ m in diameter x 15 cm in length, 3 ⁇ m particles) with a two-step linear gradient of 5-50% Buffer A over 45 minutes and 50-95% Buffer B over 10 minutes at a flow rate of 0.2 ⁇ l/minute (Buffer A: 2% (v/v) acetonitrile, 0.1% (w/v) formic acid; Buffer B: 80% (v/v) acetonitrile, 0.1% (w/v) formic acid).
- the m/z scanning range for MS and tendem MS (MS/MS) were 400-1200 and 75-1500 Da, respectively. MS/MS mass spectra were analyzed in continuous flow mode with a 10 mm I.D.
- MS/MS spectra were analyzed against rat.fasta databases from NCBI by ProQUANT 2.0 (Applied Biosystems/MDS Sciex, Foster City, CA, U.S.A.).
- the accuracy tolerance for peptide identification was 0.5 Da for MS and 0.5 Da for MS/MS, respectively.
- the cut off for the confidence settings was at 95 and for the score was at 20.
- Relative quantification of peptide was performed on the MS/MS scans, using ratio of the areas under the peaks. Relative quantification of protein was obtained by averaging the constituted peptides identified.
- proteins were transferred to polyvinylidene difluoride membranes and subsequently immunostained with mouse anti-vimentin monoclonal antibody (Chemicon, Temecula, CA, U.S.A.) for 1 hour, then with horseradish peroxidase-labeled goat anti-rat lgG for another hour.
- mouse anti-vimentin monoclonal antibody Chemicon, Temecula, CA, U.S.A.
- horseradish peroxidase-labeled goat anti-rat lgG for another hour.
- the immunoreactive bands were detected using an enhanced chemiluminescence system (ECL, Perkin-Elmer Life Sciences, Wellesley, MA, U.S.A.).
- ECL enhanced chemiluminescence system
- the numbers of distinct peptides identified range from 624-1591 when the confidence threshold was set at 95%. A significant number of these peptides were identified more than once. More than 351 unique proteins were identified in each experiment. Thirty-nine proteins show significant and consistent differences (1.5 fold or more) in protein expression in DMN-treated liver tissue with F2 and F3 fibrosis score compared to control rats. Among these 39 proteins, several have previously been reported to associate with fibrosis formation, including, fibrinogen, and fibronectin.
- Fibrinogen was found to be up-regulated in DMN-induced rats in the present study. This is consistent with the results of fibrinogen gene expression in a model CCl 4 -induced rat liver damage.
- the CCl 4 -induced rat liver damage alsoshowed increased fibrinogen mRNA levels and fibrinogen/fibrin deposition during short-term liver injury and liver fibrogenesis. This may suggest that fibrinogen involves a "clotting-like process" in short term liver damage and liver fibrosis (36).
- Fibronectin consists of two polypeptide chains. It mediates adhesion of collagen, fibrin and heparin to cells and is thus involved in the organization of thrombi and in wound healing by inducing attachment of these structures to cells. Fibronectin and collagen types I and III have been used as a characteristic feature of a liver cirrhotic state in the CCl4-induced liver cirrhosis rat model (37).
- glycine N-methyltransferase Gnmt
- cytoplasmic y actin, Act ⁇ cytoplasmic y actin
- IPA Ingenuity Pathway Analysis
- genes identified from the microarray study forty-two genes fall into 3 groups, i.e., gene networks associated with 1) cancer, cell morphology, and dermatological diseases and conditions; 2) lipid metabolism, small molecule biochemistry, molecular transport; and 3) cancer, cellular movement, cellular growth and profileration.
- Table 3A Twenty-two out of thirty-nine proteins identified in the proteomic study fall into another 3 networks associated with 1) cancer, cell cycle and cell morphology; 2) lipid metabolism, small molecule biochemistry, organismal injury and abnormalities; and 3) hematological disease, endocrine system development and function, nervous system development and function.
- Table 3B Table 3A and 3B list the networks' protein functions and members. Genes identified in the present study are underlined. The underlined genes that have not been reported to associate with liver injury are shown in bold.
- the membranes were washed with TBST buffer (20 mM Tris-HCl, pH 7.6, 137 mM NaCl, 0.1% (v/v) Tween-20) and incubated with goat polyclonal antibody specific for carbonic anhydrase I (Abcam, Cambridge, UK) for 1 hour.
- the membranes were washed again with TBST buffer and immunostained with horseradish peroxidase-conjugated donkey anti-goat IgG (Jackson Immuno Research Laboratories, PA, U.S.A.).
- the immunoreactive bands were visualized using an enhanced chemiluminescence system (ECL, Perkin-Elmer Life Sciences, Wellesley, MA, U.S.A.).
- ECL enhanced chemiluminescence system
- the Western blots clearly show that some serum samples from the cirrhosis patients have higher concentrations of carbonic anhydrase I than samples from normal individuals not suffering from cirrhosis. This result confirms that the markers identified in the rat model for liver fibrosis and/or cirrhosis are also associated with liver fibrosis and/or cirrhosis in humans.
Landscapes
- Life Sciences & Earth Sciences (AREA)
- Health & Medical Sciences (AREA)
- Engineering & Computer Science (AREA)
- Chemical & Material Sciences (AREA)
- Immunology (AREA)
- Biomedical Technology (AREA)
- Molecular Biology (AREA)
- Analytical Chemistry (AREA)
- Urology & Nephrology (AREA)
- Hematology (AREA)
- Proteomics, Peptides & Aminoacids (AREA)
- Organic Chemistry (AREA)
- General Health & Medical Sciences (AREA)
- Biotechnology (AREA)
- Microbiology (AREA)
- Physics & Mathematics (AREA)
- Pathology (AREA)
- Biochemistry (AREA)
- Wood Science & Technology (AREA)
- Medicinal Chemistry (AREA)
- Cell Biology (AREA)
- Bioinformatics & Cheminformatics (AREA)
- General Physics & Mathematics (AREA)
- Zoology (AREA)
- Genetics & Genomics (AREA)
- Food Science & Technology (AREA)
- Toxicology (AREA)
- Biophysics (AREA)
- Tropical Medicine & Parasitology (AREA)
- General Engineering & Computer Science (AREA)
- Measuring Or Testing Involving Enzymes Or Micro-Organisms (AREA)
- Investigating Or Analysing Biological Materials (AREA)
Abstract
Description
- The present invention is related to and claims the benefit of, under U.S.C. 00000§119(e),
U.S. provisional patent application Serial No. 60/761,959, filed on January 24, 2006 - Herein described are methods of detecting liver fibrosis and/or cirrhosis based on the differential expression of various proteins, and kits for diagnosing fibrosis and/or cirrhosis.
- Liver fibrosis represents a continuous disease spectrum characterized by an increase in total liver collagen and other matrix proteins that disrupt the architecture of the liver and impair liver function (1, 2). The progression of fibrosis in the liver is a response to necroinflammatory changes. The overall liver fibrosis process is one of dynamic inflammation and repair and has the potential to be resolved (3). Fibrosis is seen as scar formation in the patient's liver. When the liver becomes permanently injured and scarred, the condition is called cirrhosis.
- Liver fibrosis and/or cirrhosis are the major risk factors of hepatocellular carcinoma (HCC). A range of factors, such as hepatitis B virus (HBV), hepatitis C virus (HCV), hepatotoxins, metabolic disorders and alcoholism, can induce both liver fibrosis and/or cirrhosis, which share similar phenotypes (3-7), with cirrhosis being the end-stage of fibrosis. However, it is not clear what types of genes are involved or how they act when liver injury and repair occur. Moreover, the cirrhosis caused by these risk factors often progresses insidiously. Patients with end-stage liver cirrhosis can die within one year unless they accept liver transplantation, which has a 75% five-year survival rate (3).
- Previous biochemical studies have reported that there are 39 well-known fibrosis or cirrhosis markers (3, 8, 9), but some markers are obtained through invasive sampling.
- Studies for additional markers have proceeded based on microarray analysis of transcriptomes as well as quantitative proteomics. Microarray technologies have been widely used for comprehensive gene expression analysis. In particular, large-scale microarray analysis of gene expression enables researchers to analyze simultaneous changes in thousands of genes and identify significant patterns (10, 11). To date, the most widely used technologies in differential proteomics research were two-dimensional gel electrophoresis (2DE) and liquid chromatography-based isotopecoded affinity tagging (ICAT) technologies (12). Recently, a variation of the ICAT technology, iTRAQ (isobaric tags for relative and absolute quantitation), has been introduced. Both ICAT and iTRAQ tagging permit online identification of multiple markers and relative quantification of these proteins.
- The inventors have used differential analysis such as microarray mRNA expression profiling and quantitative protein profiling to find additional unique and identifiable signatures potentially valuable for the diagnosis and treatment of liver fibrosis and/or cirrhosis.
- The invention provides a method of detecting liver fibrosis and/or cirrhosis comprising obtaining a biological sample from a patient and assaying the sample for differential expression of at least one gene encoding a protein chosen from SEQ ID NO: 1 - SEQ ID NO: 63 and human orthologs thereof, wherein the differential expression of at least one gene suggests the presence of liver fibrosis and/or cirrhosis.
- Also provided is a method of detecting liver fibrosis and/or cirrhosis by assaying the biological sample for differential expression of the human orthologs described above, wherein the human orthologs comprise at least one gene encoding a protein chosen from SEQ ID NO: 64 - SEQ ID NO: 120.
- Also provided is a kit for diagnosing liver fibrosis and/or cirrhosis, which comprises one or more nucleic acid probes that hybridize to nucleic acid molecules of at least one gene encoding a protein chosen from SEQ ID NO: 1 - SEQ ID NO: 63 and human orthologs thereof and packaging indicating use for detection of liver fibrosis and/or cirrhosis.
- In addition, a kit is provided for diagnosing liver fibrosis comprising one or more nucleic acid probes as described above, wherein the human orthologs comprise at least one gene encoding a protein chosen from SEQ ID NO: 64 - SEQ ID NO: 120.
- The invention further provides a kit for diagnosing liver fibrosis and/or cirrhosis that comprises one or more antibodies that specifically bind to at least one protein encoded by a sequence chosen from SEQ ID NO: 1 - SEQ ID NO: 63 and human orthologs thereof, and packaging indicating use for detection of liver fibrosis and/or cirrhosis.
- Also provided is a kit for diagnosis of liver fibrosis and/or cirrhosis comprising one or more antibodies as described above, wherein the human orthologs comprise at least one gene encoding a protein chosen from SEQ ID NO: 64 - SEQ ID NO: 120.
- The invention also provides a method of identifying a compound that decreases the differential expression of at least one gene encoding a protein chosen from SEQ ID NO: 7 - SEQ ID NO: 23 and SEQ ID NO: 42 - SEQ ID NO: 63 and human orthologs thereof, comprising providing a cell expressing at least one of the aforementioned genes, contacting the cell with a test compound, and determining whether the differential expression of the at least one gene is decreased in the presence of the test compound, wherein the decreased differential expression is an indication of halting or reversing liver fibrosis and/or cirrhosis.
- The invention further provides a method of identifying a compound that increases the differential expression of at least one gene encoding a protein chosen from SEQ ID NO: 1 - SEQ ID NO: 6 and SEQ ID NO: 24 - SEQ ID NO: 41 and human orthologs thereof, comprising providing a cell expressing at least one of the aforementioned genes, contacting the cell with a test compound, and determining whether the differential expression of the at least one gene is increased in the presence of the test compound, wherein the increased differential expression is an indication of halting or reversing liver fibrosis and/or cirrhosis.
- Additional objects and advantages of the invention will be set forth in part in the description which follows, and in part will be obvious from the description, or may be learned by practice of the invention. The objects and advantages of the invention will be realized and attained by means of the elements and combinations particularly pointed out in the appended claims.
- It is to be understood that both the foregoing general description and the following detailed description are exemplary and explanatory only and do not limit the invention as claimed.
- The accompanying drawings, which are incorporated in and constitute a part of this specification, illustrate several embodiments of the invention and together with the description, serve to explain the principles of the invention.
- Table 1 is the result of a biochemical analysis of the serum of rats treated with dimethylnitrosamine (DMN) as compared with that of the control rats over a six-week time period.
- Table 2 is a list of genes showing significant changes in gene expression and their human orthologs. The genes were selected from the combined results of microarray analysis and quantitative proteomic analysis and those whose relationship to fibrosis are not yet disclosed in public literature.
- Table 3 is the result of interacting network analysis for the proteins showing significant changes in expression in oligonucleotide microarray (Table 3A) and iTRAQ proteomic (Table 3B) studies. Proteins in the network identified in the present study which have not previously been reported to associate with liver injury are shown in bold.
-
- Figure 1A is a schematic illustration of DMN treatment for inducing fibrosis in rats. Each rat was either injected with DMN three times per week for three consecutive weeks (shown as inverted triangles) or with normal saline as control. Rats were weighed and sacrificed each week (shown as triangles, starting on
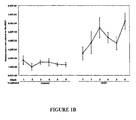
day 11, which is referred to as first week, until week six). Blood samples were collected for biochemical assays (summary in Table 1) and livers were excised and weighed. Livers were then either fixed in formaldehyde for histopathology or used to isolate RNA and protein for microarray and iTRAQ proteomic studies, respectively. - Figure 1 B is the quantitative real-time PCR (Q-RT-PCR) result of Tgfβ1 (transforming growth factor-βl) in DMN-treated rats, showing a higher level of Tgfβ1 expression, the strongest known inducer of fibrogenesis.
- Figure 2A shows the histopathological examination results of liver tissues from DMN-treated rats. The representative phenotype of the rat liver tissue was characterized by scoring the four histopathological features as follows: the necrosis scores are from N0 to N3 (the first row), the inflammation scores are from 10 to 13 (the second row), the fibrosis scores are from F0 to F3 (the third row), and the fatty change scores are presence or absence (+ and -) in the last row.
- Figure 2B is a summary of the histopathological scores for the rat model. The results are ranked by time course. The necroinflammatory change is divided into three grades: A0= none, A(1-3)= mild and A(4-6)= moderate necroinflammatory. The fibrosis change is divided into two grades: F(0-1)= normal to fibrous expansion of portal tracts, F(2-3)= bridge fibrosis to frequent bridging fibrosis with nodule formation. The fatty change is shown as presence or absence (+/-). The number of rats is counted and used to calculate the percentage of rats in each histopathological level at each time point.
- Figure 3A shows the dendrogram of two hundred and fifty-six (256) gene expression patterns from the DMN-induced fibrosis model in rats.
- Figure 3B shows the comparison of Timp1 (tissue inhibitor of metalloproteinase 1) expression between the Q-RT-PCR result and the microarray data, and a good concordance between the two results is shown. For the Q-RT-PCR assay of
Timp 1, expression levels (marked by the square) are relative to the mean of all gene expression, and are measured by the log scale on the right side of the plot. The expression levels of two Timp1 transcripts, rc_Al169327_at and rc_Al169327_g_at (marked by circle and triangle), are relative to the mean of all gene expression levels, and are measured by the scale indicated on the left side of the plot. - Figure 4A shows the vimentin expression ratios in DMN-treated and control rats at 2, 4, and 6 weeks as determined by iTRAQ proteomics. Vimentin expression increased 2.4-to 3.4-fold in the liver when rats were treated with DMN.
- Figure 4B shows the result of Western blot analysis of DMN-induced vimentin expression. The observed result matched with the trend measured by mass spectrometry in iTRAQ proteomic experiments.
- Figure 5 shows the result of Western blot analysis comparing the expression of carbonic anhydrase I in human sera from normal volunteers and from patients with hepatitis B-related cirrhosis.
- As used herein, the term "biological sample" refers to any biological material collected from cells, tissues, or organs of the subject. The source of the biological sample may vary depending on the particular symptoms present in the subject to be diagnosed. The biological sample may be analyzed immediately after it is taken, or stored. If stored, the sample may be equilibrated with an appropriate storage buffer, and kept at 4°C, at -20°C, at -70°C, or even in cryogenic liquids, such as liquid nitrogen or liquid helium. In one embodiment, the biological sample may consist of blood, serum, or plasma. In another embodiment, the biological sample may consist of a biopsy or tissue sample. In additional embodiments of the invention, the biological sample may consist of aminotic fluid, milk, saliva, cerebrospinal fluid, lymph, sweat, mucus, synovial fluid, lacrimal fluid, or other clinical specimens or samples.
- As used herein, the term "patient" refers to a mammalian animal, including but not limited to human, primates, domestic mammals, laboratory mammals, etc..
- As used herein, the term "differential expression" refers to gene expression on the RNA/mRNA level, protein level, or both RNA/mRNA and protein levels as compared to normal gene expression, e.g., an increased or decreased gene expression on the RNA/mRNA level, protein level, or both RNA/mRNA and protein levels.
- As used herein, the terms "gene" and "gene encoding a protein" refer to any nucleic acid sequence or portion thereof with a functional role in encoding or transcribing a protein. The gene may encompass all the nucleic acids responsible for encoding a functional protein of certain SEQ ID NO or only a portion of the nucleic acids responsible for encoding or expressing a protein of certain SEQ ID NO. The nucleic acid sequence may contain normal sequences as well as genetic abnormalities within exons, introns, initiation or termination regions, promoter sequences, other regulatory sequences or unique adjacent regions to the gene.
- As used herein, the term "human ortholog" refers to a corresponding human gene wherein the non-human gene and the human gene are derived from a single ancestral gene in the last common ancestor of human and non-human, and the human genes have the same function.
- As used herein, the term "probes" refers to hybridization probes that are oligonucleotides that bind in a base-specific manner to a complementary strand of nucleic acid. Such probes also include peptide nucleic acids, as described in Nielsen et al., 1991, (13), and other nucleic acid analogs and nucleic acid mimetics. See, e.g.,
U.S. Pat. No. 6,156,501 , which is incorporated herein by reference. - As used herein, the term "nucleic acid" refers to any DNA or RNA/mRNA, for example, chromosomal, mitochondrial, viral and/or bacterial nucleic acid present in tissue sample as well as synthetic nucleic acids. The term "nucleic acid" encompasses either or both strands of a double stranded nucleic acid molecule and includes any fragment or portion of an intact nucleic acid molecule.
- As used herein, the term "packaging" refers generally to packaging material comprising external labeling and internal material in the container, including but not limited to instructions for using the kit.
- As used herein, the term "antibody," refers to an immunoglobulin or a fragment or a derivative thereof, and encompasses any polypeptide comprising an antigen-binding site, whether produced in vitro or in vivo. The term includes, but is not limited to, polyclonal, monoclonal, monospecific, polyspecific, humanized, single-chain, chimeric, synthetic, recombinant, hybrid, mutated, and grafted antibodies. The term "antibody" also includes antibody fragments such as Fab, F(ab')2, Fv, scFv, Fd, dAb, and other antibody fragments that retain antigen-binding function, i.e., the ability to bind a specific antigen. Typically, such fragments would comprise an antigen-binding domain, i.e., a part of an antibody molecule that comprises amino acids responsible for the specific binding between the antibody and the antigen. An antigen-binding domain typically comprises an antibody light chain variable region (VL) and an antibody heavy chain variable region (VH), however, it does not necessarily have to comprise both. For example, a so-called Fd antibody fragment consists only of a VH domain, but still retains some antigen-binding function of the intact antibody.
- As used herein, the term "specifically binds," or the like, means that two molecules form a complex that is relatively stable under physiologic conditions (e.g., a stable antigen/antibody complex). The term is also applicable where, for example, an antigen-binding domain is specific for a particular epitope, which is found on a number of molecules. Thus, an antibody may specifically bind multiple proteins when it binds to an epitope present in each. Specific binding is characterized by a selective interaction, often including high affinity binding with a low to moderate capacity. Nonspecific binding is usually a less selective interaction, and may have a low affinity with a moderate to high capacity. Typically, binding is considered specific when the affinity is at least 105 M-1, 106 M-1, 107 M-1 or 108 M-1. If necessary, non-specific binding can be reduced without substantially affecting specific binding by varying the binding conditions. Such conditions are known in the art, and a skilled artisan using routine techniques can select appropriate conditions. The conditions are usually defined in terms of concentrations of antibodies, ionic strength of the solution, temperature, time allowed for binding, concentration of non-related molecules (e.g., blocking agents such as serum albumin or milk casein), and so forth. See, e.g., Morgan et al., "The Matrix Effects on Kinetic Rate Constants of Antibody-Antigen Interactions Reflect Solvent Viscosity," J. Immunol. Meth. 217:51:60 (1998); and Zhuang et al., "Measurement of Association Rate Constant of Antibody-Antigen Interactions in Solution Based on Enzyme-Linked Immunosorbent Assay," J. Biosci. Bioeng. 92(4):330-336 (2001).
- As used herein, the term "protein" refers to a polymeric form of any length of amino acids, which can include naturally-occurring or synthetic amino acids and coded and non-coded amino acids, peptides, depsipeptides, polypeptides with cyclic, bicyclic, depsicyclic, or depsibicyclic peptide backbones, single chain protein as well as multimers, as well as any fragment or portion of the intact protein molecule.
- As used herein, the term "compound" refers to a substance comprising one or more chemical elements in any proportion and of any structure, including but not limited to cyclic, bicyclic, branched or straight chain. The compound may be organic or inorganic. The compound also refers to a composition comprising one or more chemical elements, one or more herbal/plant elements or herbal/plant extractions, or both chemical elements and herbal/plant elements or extractions.
- Chronic liver disease is a common and potentially lethal problem in Asia. The development of hepatocellular carcinoma (HCC) is generally preceded by hepatic cirrhosis, which occurs at the end stage of fibrosis. The same proteins are expressed in both cirrhosis and fibrosis. Changes in gene expression of these proteins during liver fibrosis are examined to identify markers of liver fibrosis to assist in the diagnosis of fibrosis and/or cirrhosis. The study begins with the establishment of a liver fibrosis model. Dimethylnitrosamine (DMN), a non-genotoxic hepatotoxin, is used to induce rat necroinflammatory and hepatic fibrosis, as described in Jezequel A.M. et al. (14), which is a known model for studying human liver damage (15). During a six-week time course, histopathological, biochemical and quantitative RT-PCR analyses confirmed the incidence of hepatic fibrosis in the rat model system.
- The microarray and the iTRAQ quantitative proteomics technology were used. The iTRAQ technology permits the identification of multiple proteins at the same time as well as the relative quantification of these proteins. Applied Biosystems iTRAQ Reagents are a multiplexed set of four isobaric reagents. The four reagents are amine-specific and yield labeled peptides. The labeled peptides are identical in mass and hence also identical in single MS mode. They produce strong, diagnostic, lowmass MS/MS signature ions allowing for quantification of up to four different samples simultaneously. Quantification is performed via the differences in abundance of four product ions, i.e., productions weighing 114, 115, 116, and 117 daltons that are each cleaved from one of the four possible tags. Since all peptides are tagged, proteome coverage is expanded and analysis of multiple peptides per protein improves the confidence in those identified (16). The multi-sample capability of the iTRAQ technology provides a way to compare the protein expression profile of different liver states simultaneously.
- The model employed in the present study is very similar to the human liver study model, and thus findings from this study can have human clinical applications. This study employed DMN, a potent non-genotoxic hepatotoxin, to simulate liver fibrosis (17, 18). DMN has been demonstrated to induce liver damage rapidly and also has been empirically proven to be useful for the study of human fibrosis formation (14-15, 19) as mentioned above. Also, the serum markers that showed significant differences in expression in the rat liver fibrosis model established in this study as compared to the controls, see Table 1, are the same serum markers for human liver fibrosis, e.g., the thirteen serum markers of albumin, glutamic oxaloacetic transaminase (GOT), glutamic pyruvic transaminase (GPT), total bilirubin, alkaline phosphatase (AKP), acid phosphatases (ACP), α-fetoprotein (AFP), blood urea nitrogen (BUN), cholesterol (CHOL), lactate dehydrogenase (LDH), globulin, prothrombin time (PT) and blood platelets (PLT). Thus, the markers identified from this study can be used to diagnose liver fibrosis and/or cirrhosis in humans.
- The present study identified nearly 97 genes as biomarkers for liver fibrotic injury. Results of a PubMed literature search indicate that approximately 30 % of the differentially expressed genes identified in this study by microarray and proteomics approach had been proven to be related to fibrosis or cirrhosis. The remaining 70% are not yet reported in any literature. Combining all the information obtained by both microarray and quantitative proteomics technology, sixty-three (63) genes were selected, all of which showed significant changes in expression between DMN-treated and DMN-untreated groups, but have not been previously reported in any literature in relation to liver fibrosis or cirrhosis (Table 2). The 63 genes in DMN-treated rats have a difference in gene expression on the RNA/mRNA level and/or the protein level when compared to normal gene expression. Some genes are up-regulated while others are down-regulated. Those 63 rat genes were converted into their human ortholog genes according to the ortholog assertions from the EnsEMBL and HomoloGene database (Table 2 - SEQ ID NO: 1 - SEQ ID NO: 120).
- Thus the invention provides a method for detecting liver fibrotic injury based on the liver injury-related differential gene expression study described herein. In the detection method, differential expression of a gene encoding a protein includes differential expression of the full length gene encoding a full length protein or a portion of the gene encoding a portion of the protein.
- Accordingly, the invention provides a method of detecting liver fibrosis and/or cirrhosis comprising obtaining a biological sample from a patient, and assaying the sample for differential expression of at least one gene encoding a protein chosen from SEQ ID NO: 1 to SEQ ID NO: 63 and human orthologs thereof, wherein the differential expression of at least one gene suggests the presence of liver fibrosis and/or cirrhosis. In another embodiment, the invention provides a method of detecting liver fibrosis and/or cirrhosis by assaying the sample for differential expression of at least one gene encoding a protein chosen from the human orthologs comprising SEQ ID NO: 64 to SEQ ID NO: 120.
- Human orthologs of proteins identified in this study can be derived from the search using gene/protein on the Ensembl database at http://www.ensembl.org/Rattus_norvegicus/ together with the HomoloGene NCBI database at http://www.ncbi.nlm.nih.gov/entrez/query.fcgi?db=homologene.
- In the practice of this invention, differential gene expression may be assayed by transcription analysis or quantitative proteomic analysis such as microarray, Q-RT-PCR, ICAT and iTRAQ, or any other appropriate methods known to one skilled in the art.
- In another embodiment, the invention relates to assaying the up-regulation or increased expression of one or more genes encoding a protein chosen from SEQ ID NO: 7 - SEQ ID NO: 23 and SEQ ID NO: 42 - SEQ ID NO: 63 and human orthologs thereof, wherein the increased expression suggests the presence of liver fibrosis and/or cirrhosis. In yet another embodiment, the invention relates to assaying for the increased expression of at least one gene encoding a protein chosen from the human orthologs comprising SEQ ID NO: 68 - SEQ ID NO: 82 and SEQ ID NO: 100 - SEQ ID NO: 120.
- The invention also provides, in another embodiment, assaying for the down-regulation or decreased expression of one or more genes encoding a protein chosen from SEQ ID NO: 1 - SEQ ID NO: 6 and SEQ ID NO: 24 - SEQ ID NO: 41 and human orthologs thereof, wherein the decreased expression suggests the presence of liver fibrosis and/or cirrhosis. In yet another embodiment, the invention relates to assaying for the decreased expression of at least one gene encoding a protein chosen from the human orthologs comprising SEQ ID NO: 64 - SEQ ID NO: 67 and SEQ ID NO: 83 - SEQ ID NO: 99.
- The invention also provides a clustering of the genes by functional groups. Thus, the invention provides a method of detecting liver fibrosis and/or cirrhosis comprising assaying a biological sample for differential expression of at least one gene encoding a protein that functions in cancer, cell cycle, and cell morphology chosen from sequences comprising SEQ ID NO: 9, SEQ ID NO: 69, SEQ ID NO: 12, SEQ ID NO: 72, SEQ ID NO: 4, SEQ ID NO: 65, SEQ ID NO: 17, SEQ ID NO: 76, SEQ ID NO: 7, SEQ ID NO: 68, SEQ ID NO: 19, SEQ ID NO: 78, SEQ ID NO: 5, SEQ ID NO: 66, SEQ ID NO: 20, SEQ ID NO: 79, SEQ ID NO: 22, SEQ ID NO: 81, SEQ ID NO: 21, and SEQ ID NO: 80; a protein that functions in lipid metabolism, small molecule biochemistry, organismal injury and abnormalities chosen from sequences comprising SEQ ID NO: 10, SEQ ID NO: 70, SEQ ID NO: 3, SEQ ID NO: 64, SEQ ID NO: 14, SEQ ID NO: 73, SEQ ID NO: 15 and SEQ ID NO: 74; a protein that functions in hematological disease, endocrine system development and function, nervous system development and function comprising SEQ ID NO: 13; a protein that functions in cancer, cell morphology, dermatological diseases and conditions chosen from sequences comprising SEQ ID NO: 8, SEQ ID NO: 44, SEQ ID NO: 102, SEQ ID NO: 45, SEQ ID NO: 103, SEQ ID NO: 48, SEQ ID NO: 106, SEQ ID NO: 31, SEQ ID NO: 90, SEQ ID NO: 35, SEQ ID NO: 93, SEQ ID NO: 50, SEQ ID NO: 108, SEQ ID NO: 51, SEQ ID NO: 109, SEQ ID NO: 40, and SEQ ID NO: 98; a protein that functions in lipid metabolism, small molecule biochemistry, and molecular transport chosen from sequences comprising SEQ ID NO: 25, SEQ ID NO: 84, SEQ ID NO: 42, SEQ ID NO: 100, SEQ ID NO: 27, SEQ ID NO: 86, SEQ ID NO:47, SEQ ID NO: 105, SEQ ID NO: 36, SEQ ID NO: 94, SEQ ID NO: 16, SEQ ID NO: 75, SEQ ID NO: 53, SEQ ID NO: 111, SEQ ID NO: 37, SEQ ID NO: 95, SEQ ID NO: 38, SEQ ID NO: 96, and SEQ ID NO: 107; and a protein that functions in cancer, cellular movement, cellular growth and proliferation chosen from sequences comprising SEQ ID NO: 59, SEQ ID NO: 117, SEQ ID NO:46, SEQ ID NO: 104, SEQ ID NO: 30, SEQ ID NO: 89, SEQ ID NO: 52, SEQ ID NO: 110, SEQ ID NO: 58, SEQ ID NO: 116, SEQ ID NO: 55, SEQ ID NO: 113, SEQ ID NO: 39, SEQ ID NO: 97, SEQ ID NO: 56, SEQ ID NO: 114, SEQ ID NO: 57, and SEQ ID NO: 115.
- The invention also provides diagnostic kits based on the genes and/or proteins described above. In one embodiment, there is a kit for diagnosing liver fibrosis and/or cirrhosis that comprises one or more nucleic acid probes that hybridize to nucleic acid molecules of at least one gene encoding a protein marker chosen from SEQ ID NO: 1 - SEQ ID NO: 63 and human orthologs thereof and packaging indicating the use for detecting liver fibrosis. The kit can detect the differential expression, e.g., the up-regulation or down-regulation, of these genes, wherein the differential expression would suggest liver fibrosis and/or cirrhosis. In another embodiment, the invention also provides a kit for diagnosing fibrosis and/or cirrhosis comprising nucleic acid probes that hybridize to nucleic acid molecules of at least one gene encoding a protein marker chosen from SEQ ID NO: 1 - SEQ ID NO: 63 and human orthologs thereof. The differential expression of the genes would suggest fibrosis and/or cirrhosis. In another embodiment, the diagnostic kit comprises one or more nucleic acid probes that hybridize to nucleic acid molecules of at least one gene encoding the human orthologs comprising proteins chosen from SEQ ID NO: 64 - SEQ ID NO: 120 for diagnosing liver fibrosis and/or cirrhosis.
- The kit may be prepared by techniques known to one skilled in the art. By way of example, the probes may be labeled, using labeling techniques that are known to one skilled in the art, to facilitate detection, including but not limited to radioisotope labels or fluorescent labels. The probes can hybridize to nucleic acid molecules that are either or both strands of a double stranded nucleic acid molecule and include any fragment or portion of an intact nucleic acid molecule.
- Nucleic acid hybridization is affected by such conditions as salt concentration, temperature, or organic solvents, in addition to the base composition, length of the complementary strands, and the number of nucleotide base mismatches between the hybridizing nucleic acids, as will be readily appreciated by those skilled in the art. Stringency conditions depend on the length and base composition of the nucleic acid, which can be determined by techniques well known in the art. Generally, stringency can be altered or controlled by, for example, manipulating temperature and salt concentration during hybridization and washing. For example, a combination of high temperature and low salt concentration increases stringency. Such conditions are known to those skilled in the art and can be found in, for example, Strauss, W.M. "Hybridization With Radioactive Probes," in Current Protocols in Molecular Biology 6.3.1-6.3.6, (John Wiley & Sons, N.Y. 2000). Both aqueous and nonaqueous conditions as described in the art can be used.
- An example of stringent hybridization conditions is hybridization in 0.1×SSC (15 mM sodium chloride/1.5 mM sodium citrate) at 50°C or higher. Another example of stringent hybridization conditions is hybridization overnight at 42°C in 50% formamide, 1X SSC (150 mM NaCl, 15 mM sodium citrate), 50 mM sodium phosphate (pH 7.6), 5X Denhardt's solution, 10% (w/v) dextran sulfate, and 20 µg/ml denatured, sheared salmon sperm DNA, followed by washing in 0.1X SSC at about 65°C. Highly stringent conditions can include, for example, aqueous hybridization (e.g., free of formamide) in 6X SSC (where 20X SSC contains 3.0 M NaCl and 0.3 M sodium citrate), 1% (w/v) sodium dodecyl sulfate (SDS) at 65°C for about 8 hours (or more), followed by one or more washes in 0.2 X SSC, 0.1 % SDS at 65°C.
- Moderately stringent hybridization conditions permit a nucleic acid to bind a complementary nucleic acid that has at least about 60%, at least about 75%, at least about 85%, or greater than about 90% identity to the complementary nucleic acid. Stringency of hybridization is generally reduced by decreasing hybridization and washing temperatures, adding formamide to the hybridization buffer, or increasing salt concentration of the washing buffer, either individually or in combination. Moderately stringent conditions can include, for example, aqueous hybridization (e.g., free of formamide) in 6X SSC, 1% (w/v) SDS at 65°C for about 8 hours (or more), followed by one or more washes in 2X SSC, 0.1% SDS at room temperature. Another exemplary hybridization under moderate stringency comprises hybridization in 6X SSC, 5X Denhardt's reagent, 0.5% (w/v) SDS, and optionally 100 µg/ml sonicated salmon or herring sperm DNA, at about 42°C, followed by washing in 2X SSC, 0.1% (w/v) SDS at 65°C. Other permutations and possibilities will be readily apparent to those of ordinary skill in the art, and are considered as equivalents within the scope of the instant invention.
- In yet another embodiment, the invention provides a kit for diagnosing liver fibrosis and/or cirrhosis comprising one or more antibodies that specifically bind to at least one protein encoded by a sequence chosen from SEQ ID NO: 1 - SEQ ID NO: 63 and human orthologs thereof, and further comprises packaging that indicates use for detection of liver fibrosis and/or cirrhosis. In an alternative embodiment, the kit comprises one or more antibodies that specifically bind to at least one human ortholog protein encoded by a sequence chosen from SEQ ID NO: 64 - SEQ ID NO: 120, and further comprises packaging that indicates use for detection of liver fibrosis and/or cirrhosis. Differential expression of these genes suggests the presence of fibrosis and/or cirrhosis.
- The antibodies specific to the proteins may be obtained by monoclonal or polyclonal techniques known to one skilled in the art. The antibody can be labeled with radioisotopes such as 35S, 14C, 125I, 3H, and 131I, using the techniques described in Current Protocols in Immunology (20), as an example. The radioactivity can be measured using scintillation counting. The antibody may also be fluorescently labeled by, for example, rare earth chelates (europium chelates), Texas Red, rhodamine, fluorescein, dansyl, Lissamine, umbelliferone, phycocrytherin, phycocyanin, or commercially available fluorophores such SPECTRUM ORANGE® and SPECTRUM GREEN® and/or derivatives of any one or more of the above. The fluorescent labels can be conjugated to the antibody using the techniques disclosed in Current Protocols in Immunology, supra., for example. Fluorescence can be quantified using a fluorimeter.
- Differential protein expression may be assayed using antibodies with commonly used methods known in the art, such as Western blotting or enzyme-linked immunosorbent assay (ELISA). Western blotting begins with an electrophoresis step, where proteins from a biological sample of interest are separated on the basis of size and electromagnetic charge by sodium dodecyl sulfate-polyacrylamide gel electrophoresis (SDS-PAGE), according to standard methods known in the art. See, e.g., SAMBROOK ET AL., 3 MOLECULAR CLONING: A LABORATORY MANUAL A8.40-A8.45 (2001) (describing various reagents and methods for electrophoresis of proteins by SDS-PAGE). The contents of the gel are then transferred to nitrocellulose, nylon, PVDF, or other membrane or filter suitable for fixation and Western blotting by standard methods also known in the art. The transfer may be by immersion, semi-dry blotting, or by other comparable methods known in the art. Next, the.filters or membranes are fixed to prevent loss of the target proteins during the several hybridization, washing, and staining steps comprising Western blotting. Fixation may be accomplished by heat, cross-linking with ultraviolet light, or by other comparable methods known in the art. See, e.g., SAMBROOK ET AL., 3 MOLECULAR CLONING: A LABORATORY MANUAL A8.52-A8.55 (describing various reagents and methods for immunoblotting and detection of antigen/antibody complexes).
- Non-specific antibody binding sites on the fixed filter or membrane are blocked with buffered solutions (e.g., phosphate-buffered saline ("PBS") or the like) containing a blocking agent such as, for example, 0.5% (w/v) low-fat dry milk or 5% (w/v) bovine serum albumin (BSA). After blocking, the filter or membrane then undergoes the primary antibody incubation. After primary antibody incubation, the filter or membrane is washed, and the presence of antibody-antigen complexes detected using a secondary antibody labeled with chromogenic, fluorogenic, or chemiluminescent means. Antibody-antigen complexes are then detected colorimetrically (e.g., with horseradish peroxidase and TMB), or by autoradiography (e.g., alkaline phosphatase). If detected colorimetrically, or by chemiluminescence, the amount of color of fluorescence may be measured using a luminometer, a spectrophotometer, or other similar instruments. If detected autoradiographically, the amount of bound antibody may be measured from the exposed x-ray film using a densitometer, or similar instrument. See, e.g., SAMBROOK ET AL., 3 MOLECULAR CLONING: A LABORATORY MANUAL A8.52-A8.55.
- Secondary antibodies used in Western blotting, whether polyclonal or monoclonal, may be labeled with a ligand (such as biotin) or a detectable marker (such as a fluorescent group or an enzyme) using conventional techniques. Suitable labels include fluorophores, chromophores, electron-dense reagents (e.g., silver or gold), enzymes, and ligands having specific binding partners. Enzymes such as horseradish peroxidase or alkaline phosphatase are typically detected by their activity. For example, horseradish peroxidase can be detected by its ability to convert tetramethylbenzidine (TMB) to a blue pigment, quantifiable with a spectrophotometer. Other suitable ligands and/or detectable markers include bioting and avidin or streptavidin, IgG and protein A, and the numerous additional receptor-ligand couples known in the art. Other permutations and possibilities will be readily apparent to those of ordinary skill in the art, and are considered as equivalents within the scope of the instant invention.
- An ELISA begins with an antigen adsorption step, where the target antigen or antigens are adsorbed to the wells of a microtiter plate. See, e.g., KIERKE-GAARD & PERRY LABORATORIES, INC., TECHNICAL GUIDE FOR ELISA 9-13 (2003), available at http://www.kpl.com/docs/techdocs/chapters%201%20-%204.pdf (last accessed January 12, 2007). The most commonly used adsorption buffers for antibodies are 50 mM Carbonate, pH=9.6; 10 mM Tris-HCl, pH=8.5; and 10 mM PBS, pH=7.2. These buffers work well for many proteins. If the target antigens are not readily adsorbed to the surface of the microtiter plate, plates with surfaces modified or derivatized to permit covalent linkage of proteins to their surface by a variety of chemical means are widely available from commercial suppliers. Time and temperature are the most important factors affecting the amount of protein adsorbed.
- Once the wells of a microtiter plate are coated with the desired antigen or antigens, they are washed with a blocking buffer to block non-specific antibody binding and to minimize false positive results. See, e.g., id. at 13-14 (discussing methods and reagents for blocking microtiter plates). Commonly used blocking agents are either protein solutions, such as BSA (typically used at concentrations between 1% and 5% (w/v) in PBS, pH=7.0), non-fat dry milk, casein (the main protein component of non-fat dry milk), or caseinate (a more soluble version of casein, produced by partial digestion with sodium hydroxide), normal serum (typically used at concentrations between 1% and 5% (v/v)), and gelatin (normally used at concentrations between 1% and 5% (w/v)), or non-ionic detergents, such as Tween-20™ and Triton X-100™.
- Washing reagents are selected for their ability to disrupt low-affinity interactions between various reaction components that can affect the ability to detect specific antigen-antibody interactions. See, e.g., id. at 14-15 (discussing methods and reagents for washing microtiter plates). Wash solutions commonly contain a physiological buffer to prevent denaturation of antigens and their cognate antibodies, and to preserve enzyme activity. Buffers such as PBS, Tris-saline, or imidizole-buffered saline at neutral pH are widely used. Specific buffers are typically selected based on the method of detection to be employed in a particular assay. Wash buffers should also include non-ionic detergents such as Tween-20™, Triton X-100™, or the like, at concentrations of between 0.01% to 0.05% (v/v), in order to disrupt low-affinity, non-specific interactions between reaction components.
- After the blocking step, the wells of the microtiter plate are washed. The adsorbed antigen then undergoes the primary antibody incubation, after which it is washed again. Antibody/antigen complexes are then detected using a secondary antibody labeled with chromogenic (e.g., horseradish peroxidase and TMB), fluorescent or chemiluminescent (e.g., alkaline phosphatase) means. See, e.g., id. at 15-21 (discussing antibody preparation and use, as well as commonly used detection molecules). The amount of color or fluorescence may be measured using a luminometer, a spectrophotometer, or other similar instruments. There are many common variations on the standard ELISA protocol, including competitive ELISA, sandwich ELISA, and numerous others. One of ordinary skill in the art will select the appropriate protocol to use, depending on the antigen to be detected, the source of antigen and/or primary antibody used in the assay, and any other relevant experimental parameters. These and many other permutations will be readily apparent to those of ordinary skill in the art, are considered as equivalents within the scope of the invention.
- Also described is a method that identifies a compound that would decrease the differential expression of at least one gene encoding a protein chosen from SEQ ID NO: 7 - SEQ ID NO: 23 and SEQ ID NO: 42 - SEQ ID NO: 63 and human orthologs thereof. The method provides a cell expressing at least one of these genes, contacting the cell with a test compound to determine whether the differential expression is decreased in the presence of the test compound, wherein the differential expression is an indication of halting or reversing liver fibrosis and/or cirrhosis. The same method can also identify a compound that would increase the differential expression of at least one gene encoding a protein chosen from SEQ ID NO: 1 - SEQ I D NO: 6 and SEQ ID NO: 24 - SEQ ID NO: 41 and human orthologs thereof.
- Other embodiments of the invention will be apparent to those skilled in the art from consideration of the specification and practice of the invention disclosed herein. It is intended that the specification and examples be considered as exemplary only, with the true scope and spirit of the invention being indicated by the following claims.
- Unless defined otherwise, the meanings of all technical and scientific terms used herein are those commonly understood by one of ordinary skill in the art to which this invention belongs. One of ordinary skill in the art will also appreciate that any methods and materials similar or equivalent to those described herein can also be used to practice or test the invention. Further, all publications mentioned herein are incorporated by reference.
- With respect to ranges of values, the invention encompasses the upper and lower limits and each intervening value between the upper and lower limits of the range to at least a tenth of the upper and lower limit's unit, unless the context clearly indicates otherwise. Further, the invention encompasses any other stated intervening values.
- Further, all numbers expressing quantities of ingredients, reaction conditions, percent purity, polypeptide and polynucleotide lengths, and so forth, used in the specification and claims, are modified by the term "about," unless otherwise indicated. Accordingly, the numerical parameters set forth in the specification and claims are approximations that may vary depending upon the desired properties of the present invention. At the very least, and not as an attempt to limit the application of the doctrine of equivalents to the scope of the claims, each numerical parameter should at least be construed in light of the number of reported significant digits, applying ordinary rounding techniques. Nonetheless, the numerical values set forth in the specific examples are reported as precisely as possible. Any numerical value, however, inherently contains certain errors from the standard deviation of its experimental measurement.
- It must be noted that, as used herein and in the appended claims, the singular forms "a," "or," and "the" include plural referents and plural referents include singular forms unless the context clearly dictates otherwise. Thus, for example, reference to "a subject polypeptide" includes a plurality of such polypeptides, reference to "the agent" includes reference to one or more agents and equivalents thereof known to those skilled in the art, reference to "nucleic acid molecules" includes reference to one or more nucleic acid molecules, and reference to "antibodies" includes reference to one or more antibodies and so forth.
- The following examples further illustrate the invention. They are merely illustrative of the invention and disclose various beneficial properties of certain embodiments of the invention. The following examples should not be construed as limiting the invention.
- The practice of the present invention will employ, unless otherwise indicated, conventional techniques for the study of differential gene expression, differential proteomic expression, and histopathology, which are within the level of ordinary skill in the art. Such techniques are explained fully in the applicable literature.
- The following examples illustrate the study of the expression of different proteins in liver fibrosis through the use of animal models.
- A rat hepatic fibrosis model was set up through the use of DMN. DMN is a potent hepatoxin that specifically targets the liver and can cause liver fibrosis. The histopathological changes resulting from DMN treatment involve the rapid deposition of collagen, the major protein of fibrosis and important to the process of cirrhosis. DMN-induced liver injury in rats displays many features, such as portal hypertension ascites as well as a number of other histopathological and biochemical abnormalities. Previous study has suggested that DMN-induced liver injury in rats could reflect changes that occur in human hepatic fibrosis and/or cirrhosis and that it is an appropriate animal model for studying human hepatic fibrosis and/or cirrhosis (15). The DMN-induced liver fibrosis model was performed as described in Jezequel A.M. et al. (14). Male Sprague-Dawley rats (Slc:SD; Japan SLC, Shizuoka, Japan), weighing from 300 to 350 grams, were used in the experiments. To induce hepatic fibrosis over a six-week time course experiment, the rats were given DMN (Sigma, Saint Louis, MO), dissolved in normal saline, three consecutive days a week for the first three consecutive weeks at the dosage of 6.7 mg/kg per body weight by intraperitoneal injection. Injection time points are shown as inverted triangles in Figure 1. Injections were at a much lower dosage than those used in other experiments where the dosage was 100 mg/kg/day. The higher dosage can cause toxicity in rat liver (21, 22).)
- Two to seven rats at each time point were treated with either DMN or with an equal volume of normal saline without DMN as the control (26 DMN-treated rats and 24 control rats). Rats were weighed and sacrificed on
days weeks 1 through 6 (Figure 1A). - To confirm the establishment of a rat liver fibrosis model, Q-RT-PCR, serum analysis, and histopathological analysis were employed.
- Liver tissues were immediately removed after sacrifice and subject to histopathological examination. The fixed liver samples were then processed for paraffin embedding. Five micrometer (5 µm) sections were prepared for hematoxylin and eosin staining (to score necroinflammatory and fatty changes) and for Sirius red/fast green collagen staining (to score for fibrosis) (23). The fatty changes were classified as presence (+) or absence (-).
- Phenotypic changes resulting from DMN-induced liver damage are shown in Figure 2A. In Figure 2A, the representative phenotypes of the DMN-induced rat liver fibrosis were characterized by scoring the four histopathological features (necrosis, inflammation, fibrosis, and fatty change) as follows: the necrosis scores were from N0 to N3 (the first panel), and the inflammation scores were from I0 to I3. The scoring system for examining the intensity of liver fibrosis was modified from the scoring system of the Hepatitis Activity Index (HAI) (29, 30). Fibrosis was divided into four scores: normal (F0), fibrous expansion of portal tracts (F1), bridging fibrosis (F2) and frequent bridging fibrosis with focal nodule formation (F3). The fatty change was scored as present (+) or absent (-), respectively (the last panel). The images of the fatty change are shown at 200X magnification, whereas the others are shown at 100X magnification (Fig. 2A).
- Figure 2B shows a summary of histopathological scores for the rat model. The results were ranked by time course. The necroinflammatory scores were the sum of the necrosis and inflammation scores and range from A0 to A6. The necroinflammatory change was divided into three grades: A0= none, A(1-3)= mild and A(4-6)= moderate necroinflammation. The fibrosis change was divided into two grades: F(0-1)= normal to fibrous expansion of portal tracts, F(2-3)= bridge fibrosis to frequent bridging fibrosis with nodule formation. The fatty change was shown as presence (+) or absence (-). The number of rats was counted and used to calculate the percentage of each histopathological level at each time point.
- As shown in Figure 2B, seventy-five percent of the DMN-treated rats had none (F0) or low levels of fibrosis (F1) in the first two weeks. By the third to fourth week, nearly 90% of the DMN-treated rats had high levels of fibrosis, from bridging fibrosis (F2) to frequent bridging fibrosis with focal nodule formation (F3). In the last two weeks, F2 and F3 were still present in 78% of DMN-treated rats. The fatty changes were only present in a few treated rats (3.7%). In contrast, there were no abnormal pathological patterns present in the control group at all. In addition, no clear abnormality was found in the kidney or spleen of the DMN-treated and normal rats (data not shown). Together, the detailed necroinflammatory and fibrosis scoring systems of the process of the DMN-induced liver damage suggest that dramatic necrosis and inflammation took place during early liver damage progression (week 1-4), followed by fibrosis formation at 3-6 weeks. Collagen fiber deposition in rat liver could be observed, along with bile duct proliferation, centrilobular necrosis, bridge fibrosis and fibrosis surrounding the central veins, after three weeks of DMN treatment.
- To gain additional information about the established animal model, Q-RT-PCR was used to evaluate the gene expression profile of transforming growth factor-β1 (Tgβ1), which is the strongest known inducer of fibrogenesis in the effector cells of hepatic fibrosis that can stimulate the adipocyte transformation (24-27). The same total RNA samples were used for both microarray and Q-RT-PCR analyses. RNA preparation and analysis were performed according to Affymetrix's (Santa Clara, CA, U.S.A.) instructions. The TaqMan® assays were conducted in triplicate for each sample, and a mean value was used for calculation of expression levels. To standardize the quantification of the target genes, 18S ribosomal RNA (18S rRNA) from each sample was quantified on the same plate with the target genes. The Q-RT-PCR result showed that a higher level of mRNA expression of Tgfβ1 was observed in DMN-treated rat livers than in the controls (Figure 1 B). The changes were in agreement with observations described in Jezequel A.M. et al. (14). In sum, these examinations support the DMN-induced rat hepatic fibrosis model.
- The serum of each rat, 50 rats in total, was subjected to various biochemical examinations related to liver damages. Blood samples, collected from the animals at necropsy, were used to measure serum concentrations or activity of albumin, glutamic oxaloacetic transaminase (GOT), glutamic pyruvic transaminase (GPT), total bilirubin, alkaline phosphatase (AKP), acid phosphatases (ACP), a-fetoprotein (AFP), blood urea nitrogen (BUN), cholesterol (CHOL), lactate dehydrogenase (LDH), globulin, prothrombin time (PT) and blood platelets (PLT) using an Hitachi 747 and ACL 3000 clinical chemistry analyzer system (MYCO, Renton, Washington). When the DMN-treated samples and controls were compared, thirteen serum markers showed significant differences and confirmed the DMN-treated group had suffered liver damage. The biochemical data for the DMN-treated group suggest that there were changes in many serum markers and that the protein expression levels or physical responses are similar to human liver damage phenotypes (1, 2). The thirteen serum markers identified in these experiments are the same serum markers for human liver fibrosis.
- The quality of the total RNA for microarray analysis was determined using Spectra Max Plus (Molecular Devices, Sunnyvale, CA, U.S.A.) and had an A260/A280 ratio ranging from 1.9 to 2.1. Protocols and reagents for hybridization, washing and staining followed Affymetrix's instructions (http://www.affymetrix.com/support/technical/manuals.affx). Labeled cRNA was hybridized to the
Affymetrix GeneChip Test 3 Array to verify the quality prior to hybridization to the Affymetrix Rat Genome U34A Array. - The microarray images were transformed into text files containing intensity information using GeneChip® Operating Software (GCOS) developed by Affymetrix. The microarray datasets were then analyzed using GeneSpring® 7.2 software (Silicon Genetics, Redwood City, CA, U.S.A.).
- Over the six week time course of the experiment, the liver tissues of 12 control animals and 12 DMN-treated rats (2 rats for each time point) were selected to perform microarray experiments. Before any statistical analyses were applied to the microarray data, reproducibility was assessed. Genes were selected as present when they were assigned a present call according to the perfect match (PM)/mismatch (MM) algorithm of Affymetrix in all gene chips (28). Of the 8799 probe sets analyzed, overall expression patterns for 2385 transcripts on the chips were reported to be present (P< 0.05). To verify that intra-sample variability did not obscure differences between the controls and DMN-treated groups, as well as to determine the fold-change that should be considered as significant, expression profiles among the 24 control datasets were compared. Scattered graphs of expression levels of the 2385 transcripts represented on the microarray were compared with each other. The relationship between the experimental chips in the microarray analysis was analyzed by linear regression. Overall, there was no statistical difference, with 3.2 % of transcripts deviating more than 2-fold. To investigate the time course variability, the reliable signals of these 2385 probe sets between the first and sixth week of controls, were calculated. Again, there was no statistical difference, with 4.6 % of transcripts deviating more than 2fold. In contrast, a significant scatter was found between controls and DMN-treated groups, with 28.7 % of transcripts deviating more than 2-fold.
- As a first step to minimize the likelihood of false positives, all transcripts were filtered by forming two independent clusters from the microarray data and identifying those that were differentially expressed. For detailed analysis, the first cluster generated 2385 transcripts as previously described. Of these, 268 were differentially expressed transcripts either higher or lower by 1.5 fold or more when comparing the controls and DMN-treated groups. The second method, which used the "detection flag" selection (24), reported 23 transcripts as "present" in the DMN-treated groups but not in the controls. In contrast, there was only one transcript reported "absent" in all DMN-treated groups but "present" in the controls.
- Altogether, 292 transcripts representing 256 genes, including 137 up-regulated and 119 down-regulated genes, exhibited differentially expressed gene expression patterns when the DMN-treated groups and controls were compared. Hierarchical clustering generated a dendrogram for the gene expression patterns of these 292 transcripts across the 24 samples as shown in Figure 3A. The rows represent individual transcripts and columns represent time course samples. The color in each cell reflects the expression level of the corresponding tissue, relative to its mean expression level. The scale extends from fluorescence radios of 0.25 to 4 relative to the mean level for all samples.
- To validate the microarray data, Q-RT-PCR analysis was performed for tissue inhibitor of metalloproteinase 1 (Timp1), tissue inhibitor of metalloproteinase 2 (Timp2), matrix metalloproteinase 3 (Mmp3) and gamma-glutamyl transpeptidase (Ggtp). These genes were chosen for validation because these genes occurred both in this GeneChip study and in previous studies.
- As determined by Q-RT-PCR, Timp1(Figure 3B), Timp2, Mmp3, Ggtp (data not shown) and Tgfβ1 (shown previously in Figure 1 B) were elevated in DMN-treated samples. The results of Q-RT-PCR analysis of these five genes were consistent with previous reports examining these individual markers (8, 9).
- Moreover, a good concordance based on the fold changes between microarray data and Q-RT-PCR results was observed. As shown in Figure 3B, Timp1 expression was elevated over 20-fold in DMN-treated rats in both microarray and Q-RT-PCR experiments. TaqMan® assays were conducted in triplicate for each sample, and a mean value was used for calculation of expression levels (marked by the square). To standardize the quantification of the Timp1 transcript, 18S rRNA from each sample was quantified on the same plate as the target gene, as indicated by the log scale on the right side of plot. The expression levels of the two Timp1 transcripts, rc_Al169327_at and rc_Al169327_g_at (marked by a circle and a triangle, respectively), were set forth relative to the mean of all gene expression levels as indicated by the scale on the left side of plot. The expression pattern of Timp1 was highly correlated between the Q-RT-PCR results and the GeneChip analysis (the Pearson's correlation coefficients were 0.79 and 0.92, respectively) (Figure 3B), suggesting that the gene expression results were reliable when subject to more detailed analysis.
- Necroinflammatory and fibrosis have been suggested to play important roles in the progression of liver cirrhosis in the rat model (8, 23, 24, 29, 30). To clarify the factors responsible for the histopathological phenotype, all rat samples were classified by histopathological evaluation with histopathological scores for necroinflammation (A0-A6) and fibrosis (F0-F3) as described earlier in Figure 2B. The student t-test statistic analysis was used for fibrosis-related genes analysis as it was based on the two-subgroup (F(0-1) and F(2-3)) variation in fibrosis score. A P-value of less than 0.05 was considered to be statistically significant.
- Using the student's t-test, the inventors analyzed those 256 genes with expression either higher or lower by 1.5 fold or more in DMN-induced rats than in control rats. A total of 62 differentially expressed genes (32 up regulated and 30 down regulated) between the F(0-1) and F(2-3) level of fibrosis were identified, estimated using only two subgroup variations for the fibrosis score, at the 5 % significance level. In agreement with previous studies, three genes, including Timp1, CD63 and annexin A1 (Anxa1), exhibited similar gene expression patterns during liver fibrosis (31-34).
- Timp1 is a well-known fibrosis marker and has been proven to play a significant role in the progression of liver fibrosis. In the later stages of liver injury, hepatic stellate cells (HSCs) express a combination of matrix metalloproteinases (MMPs) that have the ability to degrade normal liver matrix, while inhibiting degradation of the fibrillar collagens that accumulate in liver fibrosis. An increase in expression of Timp1 leads to a more global inhibition of degradation of fibrillar liver collagens by interstitial collagenases (MMP-1/MMP-13) (35). As shown in Fig. 3B, expression of Timp1 was elevated more than twenty fold in DMN-treated rats in microarray.
- CD63, a transmembrane protein, one of the fibrosis gene signatures observed, is also up-regulated after DMN treatment. Following chronic injury, HSCs activate or differentiate into myofibroblast-like cells, acquiring contractile, proin-flammatory, and fibrogenic properties. Activated HSCs migrate and accumulate at the sites of tissue repair, secreting large amounts of extracellular matrix proteins during the progression of fibrosis. Activated HSCs have been identified as major collagenproducing cells (collagen is an extracellular matrix protein) and an initiator of liver fibrosis when the liver is injured (7). It has been demonstrated that inhibition of CD63 might be a novel diagnostic marker for the injured liver.
- Annexin A1 (Anxa1) is highly expressed after liver injury in an alcoholic liver disease (ALD) study (34). Alcohol initiated liver injury occurs via inflammation. ALD progression involves continuing liver injury, fibrosis, and impaired liver regeneration. It has been suggested that Anxa1 might play a role in the progression of fibrosis.
- The fact that the present study agrees with previous studies for the three genes as described above indicated that oligonucleotide microarray analysis is a powerful approach for monitoring molecular events during liver injury and repair where the pathogenesis is unknown. Also, the signature genes identified in this study could discriminate successfully between the low-score and the high-score histopathology groups. Together, the genes would seem to be responsible for fibrosis formation and are possible markers for the detection of fibrosis.
- Experiments using iTRAQ tagging were performed to identify differentially expressed proteins in liver fibrosis.
- The liver tissues of 6 control and 6 DMN-treated rats were used to perform duplicate iTRAQ labeling experiments. Liver tissue was frozen in liquid nitrogen and then pulverized to powder using a mortar and pestle pre-cooled with liquid nitrogen. Then, the liquid nitrogen was allowed to evaporate, and the powdered tissue was separated into tubes and stored at -80°C. Twenty volumes (w/v) of lysis buffer (containing 2% (w/v) SDS in 20mM phosphate buffer at pH 7.6) was added to the powdered tissue and incubated at room temperature for 1 hour. Samples were centrifuged at 12000 rpm for 10 minutes and the supernatant was taken for acetone precipitation by adding six volumes of cold acetone to the sample tubes. Tubes were incubated at -20°C until precipitate formed. After decanting the acetone, pellets were resuspended with 0.1% SDS and 6M urea in dissolution buffer (provided by iTRAQ Reagents Kit, Applied Biosystems, Foster City, CA, U.S.A.).
- The total protein contents were determined using the Coomassie Plus Protein Assay Reagent (PIERCE, Rockford, IL, U.S.A.). Two hundred (200) µg of proteins were taken and diluted by an equal volume (w/v) of dissolution buffer containing 0.1 % (w/v) SDS. Proteins were reduced and cysteines blocked as described in the iTRAQ protocol (Applied Biosystems, Foster City, CA, U.S.A.). Four volumes of dissolution buffer were added to each tube and incubated with 20 µg Trypsin at 37°C for 16 hours. Tryptic peptides extracted from liver tissue of controls and DMN-treated rats were labeled with iTRAQ 114 and 115, respectively, at each time point of the experiment.
- Peptides with different isobaric tags were pooled and acidified by mixing with 10 mM phosphoric acid (in 25% (v/v) acetonitrile and 75% H2O) to a total volume of 4.0 mL for strong cation exchange (SCX) chromatography. The resulting sample was injected into a liquid chromatography system (Ettan, GE Healthcare BioScience, Umea, Sweden) using a 2.1 mm × 200 mm Polysulfoethyl A column packed with 5 micron 300 A beads (PolyLC, Columbia, MD, U.S.A.) at a flow rate of 0.08 mL/min. A guard column of the same material was plumbed upstream from the analytical column. The buffers used were 10 mM KH2PO4, 25% (v/v) acetonitrile at pH 3.0 for buffer A and 10 mM KH2PO4, 1 M KCI, 25% (v/v) acetonitrile at pH 3.0 for buffer B. The elution gradient was changed linearly from 0 to 40% buffer B within 16 mL and then up to 100% buffer B in another 4 mL. A total of 30 fractions were collected and dried by speed vacuuming centrifugation. All the fractions were desalted on pepClean™ C-18 spin columns (PIERCE, Rockford, IL, U.S.A.). The desalted peptide from each SCX fraction was dried by speed vacuuming centrifugation and then analyzed by nanoLC hybrid mass spectrometry. The nanoLC system was from LC Packings (Amsterdam, The Netherlands), coupled to an API QSTAR Pulsar Hybrid QqTOF mass spectrometer (Applied Biosystems/MDS Sciex, Foster City, CA, U.S.A.). Peptide separation was performed using a reversed-phase C18 column (75 µm in diameter x 15 cm in length, 3 µm particles) with a two-step linear gradient of 5-50% Buffer A over 45 minutes and 50-95% Buffer B over 10 minutes at a flow rate of 0.2 µl/minute (Buffer A: 2% (v/v) acetonitrile, 0.1% (w/v) formic acid; Buffer B: 80% (v/v) acetonitrile, 0.1% (w/v) formic acid). The m/z scanning range for MS and tendem MS (MS/MS) were 400-1200 and 75-1500 Da, respectively. MS/MS mass spectra were analyzed in continuous flow mode with a 10 mm I.D. fused silica tip. MS/MS spectra were analyzed against rat.fasta databases from NCBI by ProQUANT 2.0 (Applied Biosystems/MDS Sciex, Foster City, CA, U.S.A.). The accuracy tolerance for peptide identification was 0.5 Da for MS and 0.5 Da for MS/MS, respectively. The cut off for the confidence settings was at 95 and for the score was at 20. Relative quantification of peptide was performed on the MS/MS scans, using ratio of the areas under the peaks. Relative quantification of protein was obtained by averaging the constituted peptides identified.
- To validate the method and results obtained from iTRAQ proteomic studies, the expression changes of vimentin quantified by mass spectrometry in iTRAQ experiments were compared with those obtained through Western blot with anti-vimentin antibody. Proteins were extracted with 2% (w/v) SDS in 20 mM phosphate buffer at pH 7.6 from control and DMN-induced rat livers. After resolving by 12% SDS-PAGE, proteins were transferred to polyvinylidene difluoride membranes and subsequently immunostained with mouse anti-vimentin monoclonal antibody (Chemicon, Temecula, CA, U.S.A.) for 1 hour, then with horseradish peroxidase-labeled goat anti-rat lgG for another hour. The immunoreactive bands were detected using an enhanced chemiluminescence system (ECL, Perkin-Elmer Life Sciences, Wellesley, MA, U.S.A.). As demonstrated in Figure 4, the results observed in Western blots matched the trend as measured by mass spectrometry.
- The numbers of distinct peptides identified range from 624-1591 when the confidence threshold was set at 95%. A significant number of these peptides were identified more than once. More than 351 unique proteins were identified in each experiment. Thirty-nine proteins show significant and consistent differences (1.5 fold or more) in protein expression in DMN-treated liver tissue with F2 and F3 fibrosis score compared to control rats. Among these 39 proteins, several have previously been reported to associate with fibrosis formation, including, fibrinogen, and fibronectin.
- Fibrinogen was found to be up-regulated in DMN-induced rats in the present study. This is consistent with the results of fibrinogen gene expression in a model CCl4-induced rat liver damage. The CCl4-induced rat liver damage alsoshowed increased fibrinogen mRNA levels and fibrinogen/fibrin deposition during short-term liver injury and liver fibrogenesis. This may suggest that fibrinogen involves a "clotting-like process" in short term liver damage and liver fibrosis (36). Fibronectin consists of two polypeptide chains. It mediates adhesion of collagen, fibrin and heparin to cells and is thus involved in the organization of thrombi and in wound healing by inducing attachment of these structures to cells. Fibronectin and collagen types I and III have been used as a characteristic feature of a liver cirrhotic state in the CCl4-induced liver cirrhosis rat model (37).
- In addition, glycine N-methyltransferase (Gnmt), aldolase A(Aldoa), Myosin light polypeptide 6 (Myl6) and, cytoplasmic y actin, (Actγ) were identified in both RNA expression microarray and proteomic studies as exhibiting differential expression.
- To further refine the genes with differential expression in the fibrotic liver, we carried out network analysis using the Ingenuity Pathway Analysis (IPA) software (Ingenuity Systems, Mountain View, CA, U.S.A.). The genes, which were identified by microarray and iTRAQ proteomic analyses, were subjected to interacting network analyses. Gene accession numbers were imported into IPA software. These networks described functional relationships between gene products based on known interactions in the literature. The IPA tool then associated these networks with known biologic pathways. Of sixty-two genes identified from the microarray study, forty-two genes fall into 3 groups, i.e., gene networks associated with 1) cancer, cell morphology, and dermatological diseases and conditions; 2) lipid metabolism, small molecule biochemistry, molecular transport; and 3) cancer, cellular movement, cellular growth and profileration. See Table 3A. Twenty-two out of thirty-nine proteins identified in the proteomic study fall into another 3 networks associated with 1) cancer, cell cycle and cell morphology; 2) lipid metabolism, small molecule biochemistry, organismal injury and abnormalities; and 3) hematological disease, endocrine system development and function, nervous system development and function. See Table 3B. Table 3A and 3B list the networks' protein functions and members. Genes identified in the present study are underlined. The underlined genes that have not been reported to associate with liver injury are shown in bold.
- To confirm that the biomarkers identified in the DMN-induced liver fibrosis rat model could be used to diagnose liver fibrosis or cirrhosis in humans, we examined expression of the enzyme carbonic anhydrase I (see Table 2, SEQ ID NOS: 11 and 71) in human sera by Western blot analysis. Serum samples (8 µl from each patient) from normal volunteers and from patients suffering from hepatitis B-related cirrhosis were first treated to remove the twenty high abundance serum proteins using the ProteoPrep® 20 Plasma Immunodepletion Kit (Sigma-Aldrich, St. Louis, MO, U.S.A.). After depletion, the low abundance serum proteins were precipitated with 5 volumes of cold acetone at -20°C for 2 hours. The protein/acetone mixture was then centrifuged at 12,000 rpm for 10 minutes. The protein pellet was resuspended, separated by electrophoresis on a 12% SDS-PAGE gel, and transferred to 0.45 µm polyvinylidene difluoride (PVDF) membranes (Millipore, Billerica, MA, U.S.A.). After blocking in 5% (w/v) nonfat milk, the membranes were washed with TBST buffer (20 mM Tris-HCl, pH 7.6, 137 mM NaCl, 0.1% (v/v) Tween-20) and incubated with goat polyclonal antibody specific for carbonic anhydrase I (Abcam, Cambridge, UK) for 1 hour. The membranes were washed again with TBST buffer and immunostained with horseradish peroxidase-conjugated donkey anti-goat IgG (Jackson Immuno Research Laboratories, PA, U.S.A.). The immunoreactive bands were visualized using an enhanced chemiluminescence system (ECL, Perkin-Elmer Life Sciences, Wellesley, MA, U.S.A.). The Western blots clearly show that some serum samples from the cirrhosis patients have higher concentrations of carbonic anhydrase I than samples from normal individuals not suffering from cirrhosis. This result confirms that the markers identified in the rat model for liver fibrosis and/or cirrhosis are also associated with liver fibrosis and/or cirrhosis in humans.
- The publications discussed herein are provided solely for their disclosure prior to the filing date of the present application. Nothing herein is to be construed as an admission that the present invention is not entitled to antedate such publication by virtue of prior invention. Further, the dates of publication provided may be different from the actual publication dates, which may need to be independently confirmed.
- 1. Friedman, S.L. Molecular regulation of hepatic fibrosis, an integrated cellular response to tissue injury, J. Biol. Chem. 275:2247-2250 (2000).
- 2. Friedman, S.L. Seminars in medicine of the Beth Israel Hospital, Boston. The cellular basis of hepatic fibrosis. Mechanisms and treatment strategies, N. Engl. J. Med. 328:1828-1835 (1993).
- 3. Iredale, J.P. Cirrhosis: new research provides a basis for rational and targeted treatments, BMJ 327:143-147 (2003).
- 4. Okita, K., Sakaida, I., and Hino, K. Current strategies for chemoprevention of hepatocellular carcinoma, Oncology 62 Suppl. 1:24-28 (2002).
- 5. lizuka, N., Oka, M., Yamada-Okabe, H., Mori, N., Tamesa, T., Okada, T., and Takemoto, N. Differential gene expression in distinct virologic types of hepatocellular carcinoma: association with liver cirrhosis, Oncogene 22:3007-3014 (2003).
- 6. Day, C.P. Non-alcoholic steatohepatitis (NASH): where are we now and where are we going?, Gut 50:585-588 (2002).
- 7. Bataller, R., and Brenner, D.A. Liver fibrosis, J. Clin. Invest. 115:209-218 (2005).
- 8. Friedman, S.L. Liver fibrosis - from bench to bedside, J. Hepatol. 38 Suppl. 1:S38-53 (2003).
- 9. Hayasaka, A., and Saisho, H. Serum markers as tools to monitor liver fibrosis, Digestion 59:381384 (1998).
- 10. Hippo, Y., Taniguchi, H., Tsutsumi, S., Machida, N., Chong, J.-M., and Fukayama, M. Global gene expression analysis of gastric cancer by oligonucleotide microarrays, Cancer Res. 62:233240 (2002).
- 11. Ji, J., Chen, X., Leung, S. Y., Chi, J.-T. A., Chu, K. M., and Yuen, S. T. Comprehensive analysis of the gene expression profiles in human gastric cancer cell lines, Oncogene 21:6549-6556 (2002).
- 12. Wright, M.E., Han, D.K., and Aebersold, R. Mass spectrometry-based expression profiling of clinical prostate cancer, Mol. Cell. Proteomics 4(4):545-54 (2005).
- 13. Nielsen, P.E., Egholm, M., Berg, R.H., and Buchardt, O. Sequence-selective recognition of DNA by strand displacement with a thymine-substituted polyamide, Science. 254(5037):1497-500 (1991).
- 14. Jezequel, A.M., Mancini, R., Rinaldesi, M.L., Macarri, G., Venturini, C., and Orlandi, F. A morphological study of the early stages of hepatic fibrosis induced by low doses of dimethylnitrosamine in the rat, J. Hepatol. 5:174-181 (1987).
- 15. George, J., Rao, K.R., Stern, R., and Chandrakasan, G. Dimethylnitrosamine-induced liver injury in rats: the early deposition of collagen, Toxicol. 156:129-138 (2001).
- 16. DeSouza, L., Diehl, G., Rodrigues, M.J., Guo, J., Romaschin, A.D., Colgan, T.J., and Siu, K.W. Search for cancer markers from endometrial tissues using differentially labeled tags iTRAQ and cICAT with multidimensional liquid chromatography and tandem mass spectrometry, J. Proteome Res. 4(2):377-86 (2005).
- 17. Mirsalis, J.C., and Butterworth, B.E. Detection of unscheduled DNA synthesis in hepatocytes isolated from rats treated with genotoxic agents: an in vivo-in vitro assay for potential carcinogens and mutagens, Carcinogenesis 1:621-625 (1980).
- 18. Haggerty, H.G., and Holsapple, M.P. Role of metabolism in dimethylnitrosamine-induced immunosuppression: a review, Toxicol. 63:1-23 (1990).
- 19. Ala-Kokko, L., Pihlajaniemi, T., Myers, J.C., Kivirikko, K.I., and Savolainen, E.R. Gene expression of type I, III and IV collagens in hepatic fibrosis induced by dimethylnitrosamine in the rat, Biochem. J. 244:75-79 (1987).
- 20. Coligen, J.E.. Current Protocols in Immunology, ).
- 21. Waring, J.F., Jolly, R.A., Ciurlionis, R., Lum, P.Y., Praestgaard, J.T., Morfitt, D.C., and Buratto, B. Clustering of hepatotoxins based on mechanism of toxicity using gene expression profiles, Toxicol. Appl. Pharmacol. 175:28-42 (2001).
- 22. Waring, J.F., Ciurlionis, R., Jolly, R.A., Heindel, M., and Ulrich, R.G. Microarray analysis of hepatotoxins in vitro reveals a correlation between gene expression profiles and mechanisms of toxicity Toxicol. Lett. 120:359-368 (2001).
- 23. Lopez-De Leon, A., and Rojkind, M.. A simple micromethod for collagen and total protein determination in formalin-fixed paraffin-embedded sections, J. Histochem. Cytochem. 33:737743 (1985).
- 24. Schuppan, D., Krebs, A, Bauer, M., and Hahn, E.G. Hepatitis C and liver fibrosis, Cell Death Differ. 10 Suppl. 1:S59-67 (2003).
- 25. Gressner, A.M., Weiskirchen, R., Breitkopf, K., and Dooley, S. Roles of TGF-β in hepatic fibrosis, Front. Biosci. 7:d793-807 (2002).
- 26. Bauer, M., and Schuppan, D. TGFβ1 in liver fibrosis: time to change paradigms?, FEBS Lett. 502:1-3 (2001).
- 27. Dooley, S., Delvoux, B., Streckert, M., Bonzel, L., Stopa, M., ten Dijke, P., and Gressner, A.M. Transforming growth factor beta signal transduction in hepatic stellate cells via Smad2/3 phosphorylation, a pathway that is abrogated during in vitro progression to myofibroblasts. TGFβ signal transduction during transdifferentiation of hepatic stellate cells, FEBS Lett. 502:4-10 (2001).
- 28. Marvanova, M., Menager, J., Bezard, E., Bontrop, R.E., Pradier, L., and Wong, G. Microarray analysis of nonhuman primates: validation of experimental models in neurological disorders, FASEB J. 17:929-931 (2003).
- 29. Knodell, R.G., Ishak, K.G., Black, W.C., Chen, T.S., Craig, R., Kaplowitz, N., and Kiernan, T.W. Formulation and application of a numerical scoring system for assessing histological activity in asymptomatic chronic active hepatitis, Hepatol. 1:431-435 (1981).
- 30. Ishak, K., Baptista, A., Bianchi, L., Callea, F., De Groote, J., Gudat, F., and Denk, H., et al. Histological grading and staging of chronic hepatitis, J. Hepatol. 22:696-699 (1985).
- 31. Iredale, J.P.. Tissue inhibitors of metalloproteinases in liver fibrosis, Int. J. Biochem. Cell Biol. 29:43-54 (1997).
- 32. Arthur, M.J., Mann, D.A., and Iredale, J.P. Tissue inhibitors of metalloproteinases, hepatic stellate cells and liver fibrosis, J. Gastroenterol. Hepatol. 13 Suppl.:S33-38 (1998).
- 33. Mazzocca, A., Carloni, V., Sciammetta, S., Cordella, C., Pantaleo, P., Caldini, A., and Gentilini, P. Expression of .
- 34. Seth, D., Leo, M.A., McGuinness, P.H., Lieber, C.S., Brennan, Y., Williams, R., and Wang, X.M., Gene expression profiling of alcoholic liver disease in the baboon (Papio hamadryas) and human liver, Am. J. Pathol. 163:2303-2317 (2003).
- 35. Benyon, R.C. and Arthur, M.J. Extracellular matrix degradation and the role of hepatic stellate cells, Semin. Liver Dis. 21 (3):373-84 (2001).
- 36. Neubauer, K., Knittel, T., Armbrust, T., and Ramadori, G. Accumulation and cellular localization of fibrinogen/fibrin during short-term and long-term rat liver injury, Gastroenterol. 108(4):1124-35 (1995).
- 37. Hernandez-Munoz, R., Diaz-Munoz, M., Suarez-Cuenca, J.A., Trejo-Solis, C., Lopez, V., Sanchez-Sevilla, L., Yanez, L., De Sanchez, V.C. Adenosine reverses a preestablished CCl4induced micronodular cirrhosis through enhancing collagenolytic activity and stimulating hepatocyte cell proliferation in rats, Hepatol.34(4 Pt 1):677-87 (2001).
- 38. Morgan et al., "The Matrix Effects on Kinetic Rate Constants of Antibody-Antigen Interactions Reflect Solvent Viscosity," J. Immunol. Meth. 217:51-60 (1998).
- 39. Zhuang et al., "Measurement of Association Rate Constant of Antibody-Antigen Interactions in Solution Based on Enzyme-Linked Immunosorbent Assay," J. Biosci. Bioeng. 92(4):330-336 (2001).
- 40. Strauss, W.M. "Hybridization With Radioactive Probes," in Current Protocols in Molecular Biology 6.3.1-6.3.6, (John Wiley & Sons, N.Y. 2000).
- 41. SAMBROOK ET AL., 3 MOLECULAR CLONING: A LABORATORY MANUAL A8.40-A8.45, and A8.52A8.55 (2001).
| Numeric variable | control | DMN-treatment | ||||
| 1-2 wk (n)a | 3-4 wk (n)a | 5-6 wk (n)a | 1-2 wk (n)a | 3-4 wk (n)a | 5-6 wk (n)a | |
| Albumin (g/dl) | 4.4±0.4 (7) | 4.6±0.2 (8) | 4.7±0.2 (8) | 3.9±0.7 (7) | 3.5±0.6 (11) | 3.2±0.1 (7) |
| GPT (U/l) | 61.1±26.7 (8) | 65.9±19.7 (7) | 50.3±4.9 (8) | 459.5±78.5 (8) | 566.6±313.5 (11) | 763.6±405.2 (7) |
| GOT (U/l) | 110.3±37.6 (8) | 84.0±23.5 (7) | 109.1±23.5 (8) | 661.54±134.4 (8) | 1006.1±749.6 (11) | 1572.9±965.3 (7) |
| Bilirubin (mg/dl) | 0.13±0.05 (8) | 0.10±0.01 (8) | 0.13±0.05 (8) | 0.72±0.53 (8) | 1.01±0.74 (11) | 1.13±1.00 (7) |
| AKP (KA) | 46.0±3.7 (4) | 44.8±2.2 (4) | 47.0±13.6 (4) | 600.8±93.0 (4) | 668.3±222.0 (3) | 468±12.7 (2) |
| LDH (IU/l) | 262.3±75.1 (4) | 289.3±31.7 (3) | 292.3±31.3 (4) | 414.8±102.7 (4) | 562.0±120.8 (3) | 853.5±91.2 (2) |
| Globulin (g/dl) | 6.9±0.3 (3) | 6.9±0.5 (4) | 7.3±0.2 (4) | 6.7±0.1 (2) | 5.0±0.8 (4) | 3.6±0.3 (2) |
| AFP (ng/dl) | 0.32±0.04 (4) | 0.2±0.01 (2) | 0.24±0.03 (4) | 0.40±0.19 (4) | 0.38±0.05 (4) | 0.35±0.07 (2) |
| CHOL (mg/dl) | 88±5 (4) | 71±20 (4) | 91±5 (4) | 77±8 (4) | 70±13 (6) | 67±18 (5) |
| BUN (mg/dl) | 31±2 (4) | 25±6 (4) | 26±9 (4) | 33±4 (4) | 36±2 (4) | 31±5 (2) |
| ACP (mg/dl) | 2.3±0.8 (4) | 2.6±0.5 (4) | 2.3±0.8 (4) | 1.9±0.6 (4) | 6.2±1.1(4) | 8.2±0.6 (2) |
| PT (sec) | 14±1 (7) | 13±1 (8) | 13±1 (7) | 18±4 (8) | 20±4 (9) | 22±5 (6) |
| PLT (103/-1) | 741±245 (8) | 981±124 (8) | 893±109 (8) | 407±72 (7) | 300±165 (11) | 229±302 (7) |
| GPT, glutamic pyruvic transaminase; GOT, glutamic oxaloacetic transaminase; Bilirubin, total bilirubin; AKP, alkaline phosphatase; LDH, lactate dehydrogenase; AFP, a-fetoprotein; CHOL, cholesterol; BUN, blood urea nitrogen; ACP, acid phosphatase; PT, prothrombin time; PLT, blood platelets. a: Mean±SD of value from 1-2, 3-4 or 5-6 week in treated and untreated groups. |
| ID | Method | Expression | Protein name-Rat | Official Symbol | Gene ID | ID | Human orthologsname | Official Symbol | Human Homolog GeneID |
| SEQ ID NO: 1 | Proteomics | down | cytochrome P450, | Cyp2c23 | 83790 | - | |||
| SEQ ID NO: 2 | Proteomics | down | cytochrome P450, | Cyp2d13 | 24303 | - | |||
| SEQ ID NO: 3 | Proteomics | down | fatty acid synthase | Fasn | 50671 | SEQ ID NO: 64 | fatty acid synthase | FASN | 2194 |
| SEQ ID NO: 4 | Proteomics | down | hydroxysteroid (17-beta) dehydrogease 2 | Hsd17b2 | 79243 | SEQ ID NO: 65 | hydroxysteroid (17-beta) | HSD17B2 | 3294 |
| SEQ ID NO: 5 | Proteomics | down | Estrogen sulfotransferase, | Ste2 | - | SEQ ID NO: 66 | sulfotransferase, estrogen-preferring | SULT1E1 | 6783 |
| SEQ ID NO: 6 | Proteomics | down | similar to cDNA sequence BC022133 | 362399 | SEQ ID NO: 67 | ZXD family zinc finger C | ZXDC | 79364 | |
| SEQ ID NO: 7 | Proteomics | up | S100 calcium binding protein A9 (calgranulin B) | S100a9 | 94195 | SEQ ID NO: 68 | S 100 calcium- binding protein A9 | S100A9 | 6280 |
| SEQ ID NO: 8 | Proteomics | up | actin, gamma, cytoplasmic | Actg(Actgl) | 287876 | - | - | ||
| SEQ ID NO: 9 | Proteomics | up | aldehyde dehydrogenase family 1, member A1 | Aldhlal | 24188 | SEQ ID NO: 69 | aldehyde dehydrogenase 1A1 | ALDH1A1 | 216 |
| SEQ ID NO: 10 | Proteomics | up | Rho GDP dissociation inhibitor (GDI) alpha | Arhgdia | 360678 | SEQ ID NO: 70 | Rho GDP dissociation inhibitor (GDI) alpha | ARHGDIA | 396 |
| SEQ ID NO: 11 | Proteomics | up | carbonic anhydrase I (predicted) | Cal_predicted | 310218 | SEQ ID NO: 71 | carbonic anhydrase I | CA1 | 759 |
| SEQ ID NO: 12 | Proteomics | up | carbonic anhydrase 2 | Ca2 | 54231 | SEQ ID NO: 72 | carbonic anhydrase II | CA2 | 760 |
| SEQ ID NO: 13 | Proteomics | up | cytochrome P450 2cl3 | Cyp2cl3 | 171521 | - | - | - | |
| SEQ ID NO: 14 | Proteomics | up | thyroid autoantigen | G22p1 | 25019 | SEQ ID NO: 73 | ATP-dependent DNA helicase II, 70 kDa subunit | XRCC6 | 2547 |
| SEQ ID NO: 15 | Proteomics | up | myosin, heavy polypeptide 9 | Myh9 | 25745 | SEQ ID NO: 74 | myosin, heavy polypeptide 9, non-muscle | MYH9 | 4627 |
| SEQ ID NO: 16 | Proteomics | up | Myosin light polypeptide 6 | Myl6 | - | SEQ ID NO: 75 | similar to Myosin light polypeptide 6 (Myosin light chain alkali 3) (Myosin light chain 3) (MLC-3) (LC17) | 124685 | |
| SEQ ID NO: 17 | Proteomics | up | prosaposin | Psap | 25524 | SEQ ID NO: 76 | prosaposin | PSAP | 5660 |
| SEQ ID NO: 18 | Proteomics | up | similar to Myosin regulatory light chain 2-A, smooth muscle isoform (Myosin RLC-A) (predicted) | RGD1309537_p redicted | 501203 | SEQ ID NO: 77 | myosin regulatory light chain MRCL3 | 10627 | |
| SEQ ID NO: 19 | Proteomics | up | solute carrier family 4, member 1 | SIc4a1 | 24779 | SEQ ID NO: 78 | solute carrier family 4, anion exchanger, member 1 (erythrocyte membrane protein band 3, Diego blood group) | SLC4AI | 6521 |
| SEQ ID NO: 20 | Proteomics | up | transgelin 2 (predicted) | Tagln2 | 304983 | SEQ ID NO: 79 | transgelin 2 | TAGLN2 | 8407 |
| SEQ ID NO: 21 | Proteomics | up | tropomyosin 3, gamma | Tpm3 | 117557 | SEQ ID NO: 80 | tropomyosin 3 | TPM3 | 7170 |
| SEQ ID NO: 22 | Proteomics | up | talin | Tln | 313494 | SEQ ID NO: 81 | talin 1 | TLN1 | 7094 |
| SEQ ID NO: 23 | Proteomics | up | similar to hypothetical protein D4Ertd765e (predicted) | RGD1308525_ predicted | 298381 | SEQ ID NO: 82 | enoyl Coenzyme A hydratase domain containing 2 | ECHDC2 | 55268 |
| SEQ ID NO: 24 | Microarray | down | aminoadipate aminotransferase | Aadat | 29416 | SEQ ID NO: 83 | alpha-aminoadipate aminotransferase | AADAT | 51166 |
| SEQ ID NO: 25 | Microarray | down | acyl-CoA synthetase long-chain family member 1 | Acsl1 | 25288 | SEQ ID NO: 84 | acyl-CoA synthetase long-chain family member 1 | ACSL1 | 2180 |
| SEQ ID NO: 26 | Microarray | down | aldehyde dehydrogenase 1 family, member L1 | Fthfd | 64392 | SEQ ID NO: 85 | aldehyde dehydrogenase 1 family, member L1 | ALDH1L1 | 10840 |
| SEQ ID NO: 27 | Microarray | down | arginosuccinate synthetase | Ass | 25698 | SEQ ID NO: 86 | argininosuccinate synthetase | ASS | 445 |
| SEQ ID NO: 28 | Microarray | down | dimethylglycine dehydrogenase | Dmgdh | 245961 | SEQ ID NO: 87 | dimethylglycine dehydrogenase | DMGDH | 29958 |
| SEQ ID NO: 29 | Microarray | down | dihydropyrimidinase | Dpys | 65135 | SEQ ID NO: 88 | dihydropyrimidinase | DPYS | 1807 |
| SEQ ID NO: 30 | Microarray | down | phosphodiesterase I/nucleotide pyrophosphatase 2 | Enpp2 | 84050 | SEQ ID NO: 89 | ectonucleotide pyrophosphatase/ phosphodiesterase 2 (autotaxin) | ENPP2 | 5168 |
| SEQ ID NO: 31 | Microarray | down | fatty acid amide hydrolase | Faah | 29347 | SEQ ID NO: 90 | fatty acid amide hydrolase | FAAH | 2166 |
| SEQ ID NO: 32 | Microarray | down | guanidinoacetate methyltransferase | Gamt | 25257 | SEQ ID NO:91 | guanidinoacetate N-methyltransferase | GAMT | 2593 |
| SEQ ID NO: 33 | Microarray | down | L-gulono-gamma-lactone oxidase | Gulo | 60671 | - | - | ||
| SEQ ID NO: 34 | Microarray | down | 3-hydroxyisobutyrate dehydrogenase | Hibadh | 63938 | SEQ ID NO: 92 | 3-hydroxyisobutyrate dehydrogenase | HIBADH | 11112 |
| SEQ ID NO: 35 | Microarray | down | ketohexokinase | Khk | 25659 | SEQ ID NO: 93 | ketohexokinase | KHK | 3795 |
| SEQ ID NO: 36 | Microarray | down | kynureninase (L-kynurenine hydrolase) | Kynu | 116682 | SEQ ID NO: 94 | kynureninase (L-kynurenine hydrolase) | KYNU | 8942 |
| SEQ ID NO: 37 | Microarray | down | Pyruvate carboxylase | Pc | 25104 | SEQ ID NO: 95 | pyruvate carboxylase | PC | 5091 |
| SEQ ID NO: 38 | Microarray | down | pyruvate dehydrogenase kinase 2 subunit p45 (PDK2) | Pdk2 | 81530 | SEQ ID NO: 96 | pyruvate dehydrogenase kinase, isoenzyme 2 | PDK2 | 5164 |
| SEQ ID NO: 39 | Microarray | down | solute carrier family 10, member 1 | Slc 10a1 | 24777 | SEQ ID NO: 97 | solute carrier family 10 (sodium/bile acid cotransporter family), member 1 | SLC10A1 | 6554 |
| SEQ ID NO: 40 | Microarray | down | solute carrier family 37 (glycerol-6- phosphate transporter), member 4 | Slc37a4 | 29573 | SEQ ID NO: 98 | solute carrier family 37 (glycerol-6-phosphate transporter), member 4 | SLC37A4 | 2542 |
| SEQ ID NO: 41 | Microarray | down | similar to Sulfotransferase K2 (rSULTIC2A) | - | 501086 | SEQ ID NO: 99 | sulfotransferase family, cytosolic, 1C, member 1 | SULT1C1 | 6819 |
| SEQ ID NO: 42 | Microarray | up | arachidonate 5-lipoxygenase activating protein | Alox5ap | 29624 | SEQ ID NO: 100 | arachidonate 5-lipoxygenase-activating protein | ALOX5AP | 241 |
| SEQ ID NO: 43 | Microarray | up | adenine phosphoribosyl transferase (predicted) | Aprt_predicted | 292072 | SEQ ID NO: 101 | adenine phosphoribosyltransf erase | APRT | 353 |
| SEQ ID NO: 44 | Microarray | up | brain abundant, membrane attached signal protein 1 | Basp1 | 64160 | SEQ ID NO: 102 | brain abundant, membrane attached signal protein 1 | BASP 1 | 10409 |
| SEQ ID NO: 45 | Microarray | up | benzodiazepin receptor | Bzrp | 24230 | SEQ ID NO: 103 | peripheral benzodiazapine receptor | BZRP | 706 |
| SEQ ID NO: 46 | Microarray | up | carbonyl reductase | Cbr1 | 29224 | SEQ ID NO: 104 | carbonyl reductase 1 | CBR1 | 873 |
| SEQ ID NO: 47 | Microarray | up | CD47 antigen (Rh- related antigen, integrin-associated signal transducer) | Cd47 | 29364 | SEQ ID NO: 105 | CD47 antigen | CD47 | 961 |
| SEQ ID NO: 48 | Microarray | up | embigin | Emb | 114511 | SEQ ID NO: 106 | embigin homolog | EMB | 133418 |
| SEQ ID NO: 49 | Microarray | up | myeloid differentiation primary response gene 116 | Myd116 | 171071 | SEQ ID NO:107 | protein phosphatase 1, regulatory subunit 15A | PPP1R15A | 23645 |
| SEQ ID NO:50 | Microarray | up | N-myc downstream regulated gene 2 | Ndrg2 | 171114 | SEQ ID NO: 108 | N-myc downstream- regulated gene 2 | NDRG2 | 57447 |
| SEQ ID NO:51 | Microarray | up | expressed in non-metastatic cells 1, protein (NM23A) (nucleoside diphosphate kinase) | Nme1 | 191575 | SEQ ID NO: 109 | non-metastatic cells 1, protein (NM23A) expressed in | NME1 | 4830 |
| SEQ ID NO: 52 | Microarray | up | neuregulin 1 | Nrg1 | 112400 | SEQ ID NO: 110 | neuregulin 1 | NRG1 | 3084 |
| SEQ ID NO: 53 | Microarray | up | oxidized low density lipoprotein (lectin-like) receptor 1 | Oldlr1 | 140914 | SEQ ID NO: 111 | oxidised low density lipoprotein (lectin-like) receptor 1 | OLR1 | 4973 |
| SEQ ID NO: 54 | Microarray | up | protein tyrosine kinase 9 | Ptk9 | 315265 | SEQ ID NO: 112 | twinfilin-like protein | PTK9L | 11344 |
| SEQ ID NO: 55 | Microarray | up | syndecan binding protein | Sdcbp | 83841 | SEQ ID NO:113 | syntenin | SDCBP | 6386 |
| SEQ ID NO: 56 | Microarray | up | serine protease inhibitor, Kazal type 1 | Spink1 | 24833 | SEQ ID NO: 114 | serine protease inhibitor, Kazal type 1 | SPINK1 | 6690 |
| SEQ ID NO: 57 | Microarray | up | tyrosine 3/tryptophan 5 -monooxygenase ctivation protein, eta polypeptide | Ywhah | 25576 | SEQ ID NO: 115 | tyrosine 3/tryptophan 5 -monooxygenase activation protein, eta polypeptide | YWHAH | 7533 |
| SEQ ID NO: 58 | Microarray | up | S100 calcium binding protein A10 | S100a10 | 81778 | SEQ ID NO: 116 | S100 calcium- binding protein A10 | S100A10 | 6281 |
| SEQ ID NO: 59 | Microarray | up | B-cell translocation gene 2 | Btg2 | 29619 | SEQ ID NO: 117 | B-cell translocation gene 2 | BTG2 | 7832 |
| SEQ ID NO: 60 | Microarray | up | 3'-phosphoadenosine 5'-phosphosulfate synthase 2 (predicted) | Papss2_ predicted | 294103 | SEQ ID NO:118 | 3'-phosphoadenosine 5'-phosphosulfate synthase 1 | PAPSS1 | 9061 |
| SEQ ID NO: 61 | Microarray | up | biogenesis of lysosome-related organelles complex- 1, subunit 2 | Blocls2 | 293938 | SEQ ID NO: 119 | biogenesis of lysosome-related organelles complex-1, subunit 2 | BLOC1S2 | 282991 |
| SEQ ID NO: 62 | Microarray | up | Similar to RIKEN cDNA 6720467C03 (predicted) | RGD1310681_ predicted | 297903 | - | - | ||
| SEQ ID NO: 63 | Microarray | up | transformed mouse 3T3 cell double minute 2 (predicted) | Mdm2_ predicted | 314856 | SEQ ID NO:120 | mouse double minute 2 homolog | MDM2 | 4193 |
| Genes* | Top functions | |
| 1 | ACTG1 , ADARBI, AHCY, AKT1, ALDOA, BASP1, BZRP, CD63, Crisp1 (MGI:102553), EMB, FAAH , GLI1, GNMT, HRAS, IFNG, KHK, KRT18, MYC, MYCN, NDRG2, NME1, OTC, PPARA, RHOB, RPL23, RPL27, RPL35, RPL38, RPL41, Rpm12, RPS16, RPS27, RT1-A, SARDH, SLC37A4 | Cancer, Cell Morphology, Dermatological Diseases and Conditions |
| 2 | ACSL1, ALOX5AP, ANXA1, ASS, ATF3, CD47 , CIDEC, CP, DF, FABP1, GPD1, HOXA11, KYNU , MMP16, MTP, MYL6, OLR1, PC, PDK2, PF4, PLIN, PLP1, PPARG, PPP1R15A, PROC, PTGES, RGS7, SLC27A1, SPHK1, TIMP1, TNF, UBQLN2, UCP2, UCP3, Wap | Lipid Metabolism, Small Molecule Biochemistry, Molecular Transport |
| 3 | AC02, AKR1B10, BTG2, CBR1 , DAD1, DUSP5, ELF3, ENPP2 , FGF2, GBP1, GLG1, GPI, GRIN2C, HSPA1A, IGFALS, IL1B, JUN, KCNH2, MAOB, MT1L, MT2A, NR3C1, NRG1 , P53AIP1, PHKG1, S100A10, SDCBP , SHBG, SLC10A1 , SLC10A2, SPINK1 , SPRY1, TP53, YWHAH , ZFP36L2 | Cancer, Cellular Movement, Cellular Growth and Proliferation |
| * Genes identified in the present study are underlined. The underlined genes that have not been reported to associate with liver injury are in bold. |
| Genes* | Top functions | |
| 1 | ADD1, ALB, ALDH1A1 , CA2 , CASP3, CNN2, CTNNB1, DIA1, ENPP1, GBA, GM2A, HGF, HSD17B2 , IL1B, ITPA, JTV1, KRT17, LMNA, LMNB2, MAP4, MYC, OAT, PLS3, PSAP , S100A9 , SERPINH1, SLC4A1 , SRM, SULT1E1 , TAGLN2 , TGFB1, TLN1 , TPM3 , UGDH, VIM | Cancer, Cell Cycle, Cell Morphology Cycle, |
| 2 | ACADM, ACTC, ADCY7, ALDH2, ALDOA, ALDOB, ARG2, ARHGDIA , CD276, CNR2, CPS1, CROT, Cyp4a10, Cyp4a14, EHHADH, EPHX1, FAAH, FASN, FN1, G22P1 , GNMT, GOT2, HOXD4, HPX, HRSP12, Ifil, IFNG, IL4, LEP, Mug1, MYH9 , MYOD1, PPARA, SORD, TGM2 | Lipid Metabolism, Small Molecule Biochemistry, Organismal Injury and Abnormalities |
| 3 | ALB, ANXA1, CLU, CYP2C13 , CYP3A2, FGA, FGB, FGG, FLI1, GAL, GFAP, GH1, GHRH, GHRL, HBA1, HBA2, HBB, Hbb-ar, Hbb-b1, Hbb-b2, Hbb-bh1, Hbb-y, HBD, HBE1, HBG1, HBG2, HBQ1, HBZ, IL6, NTS, SOCS2, Stat5, TF, TG, TTR | Hematological Disease, Endocrine System Development and Function, Nervous System Development and Function |
| * Genes identified in the present study are underlined. The underlined genes that have not been reported to associate with liver injury are in bold. |






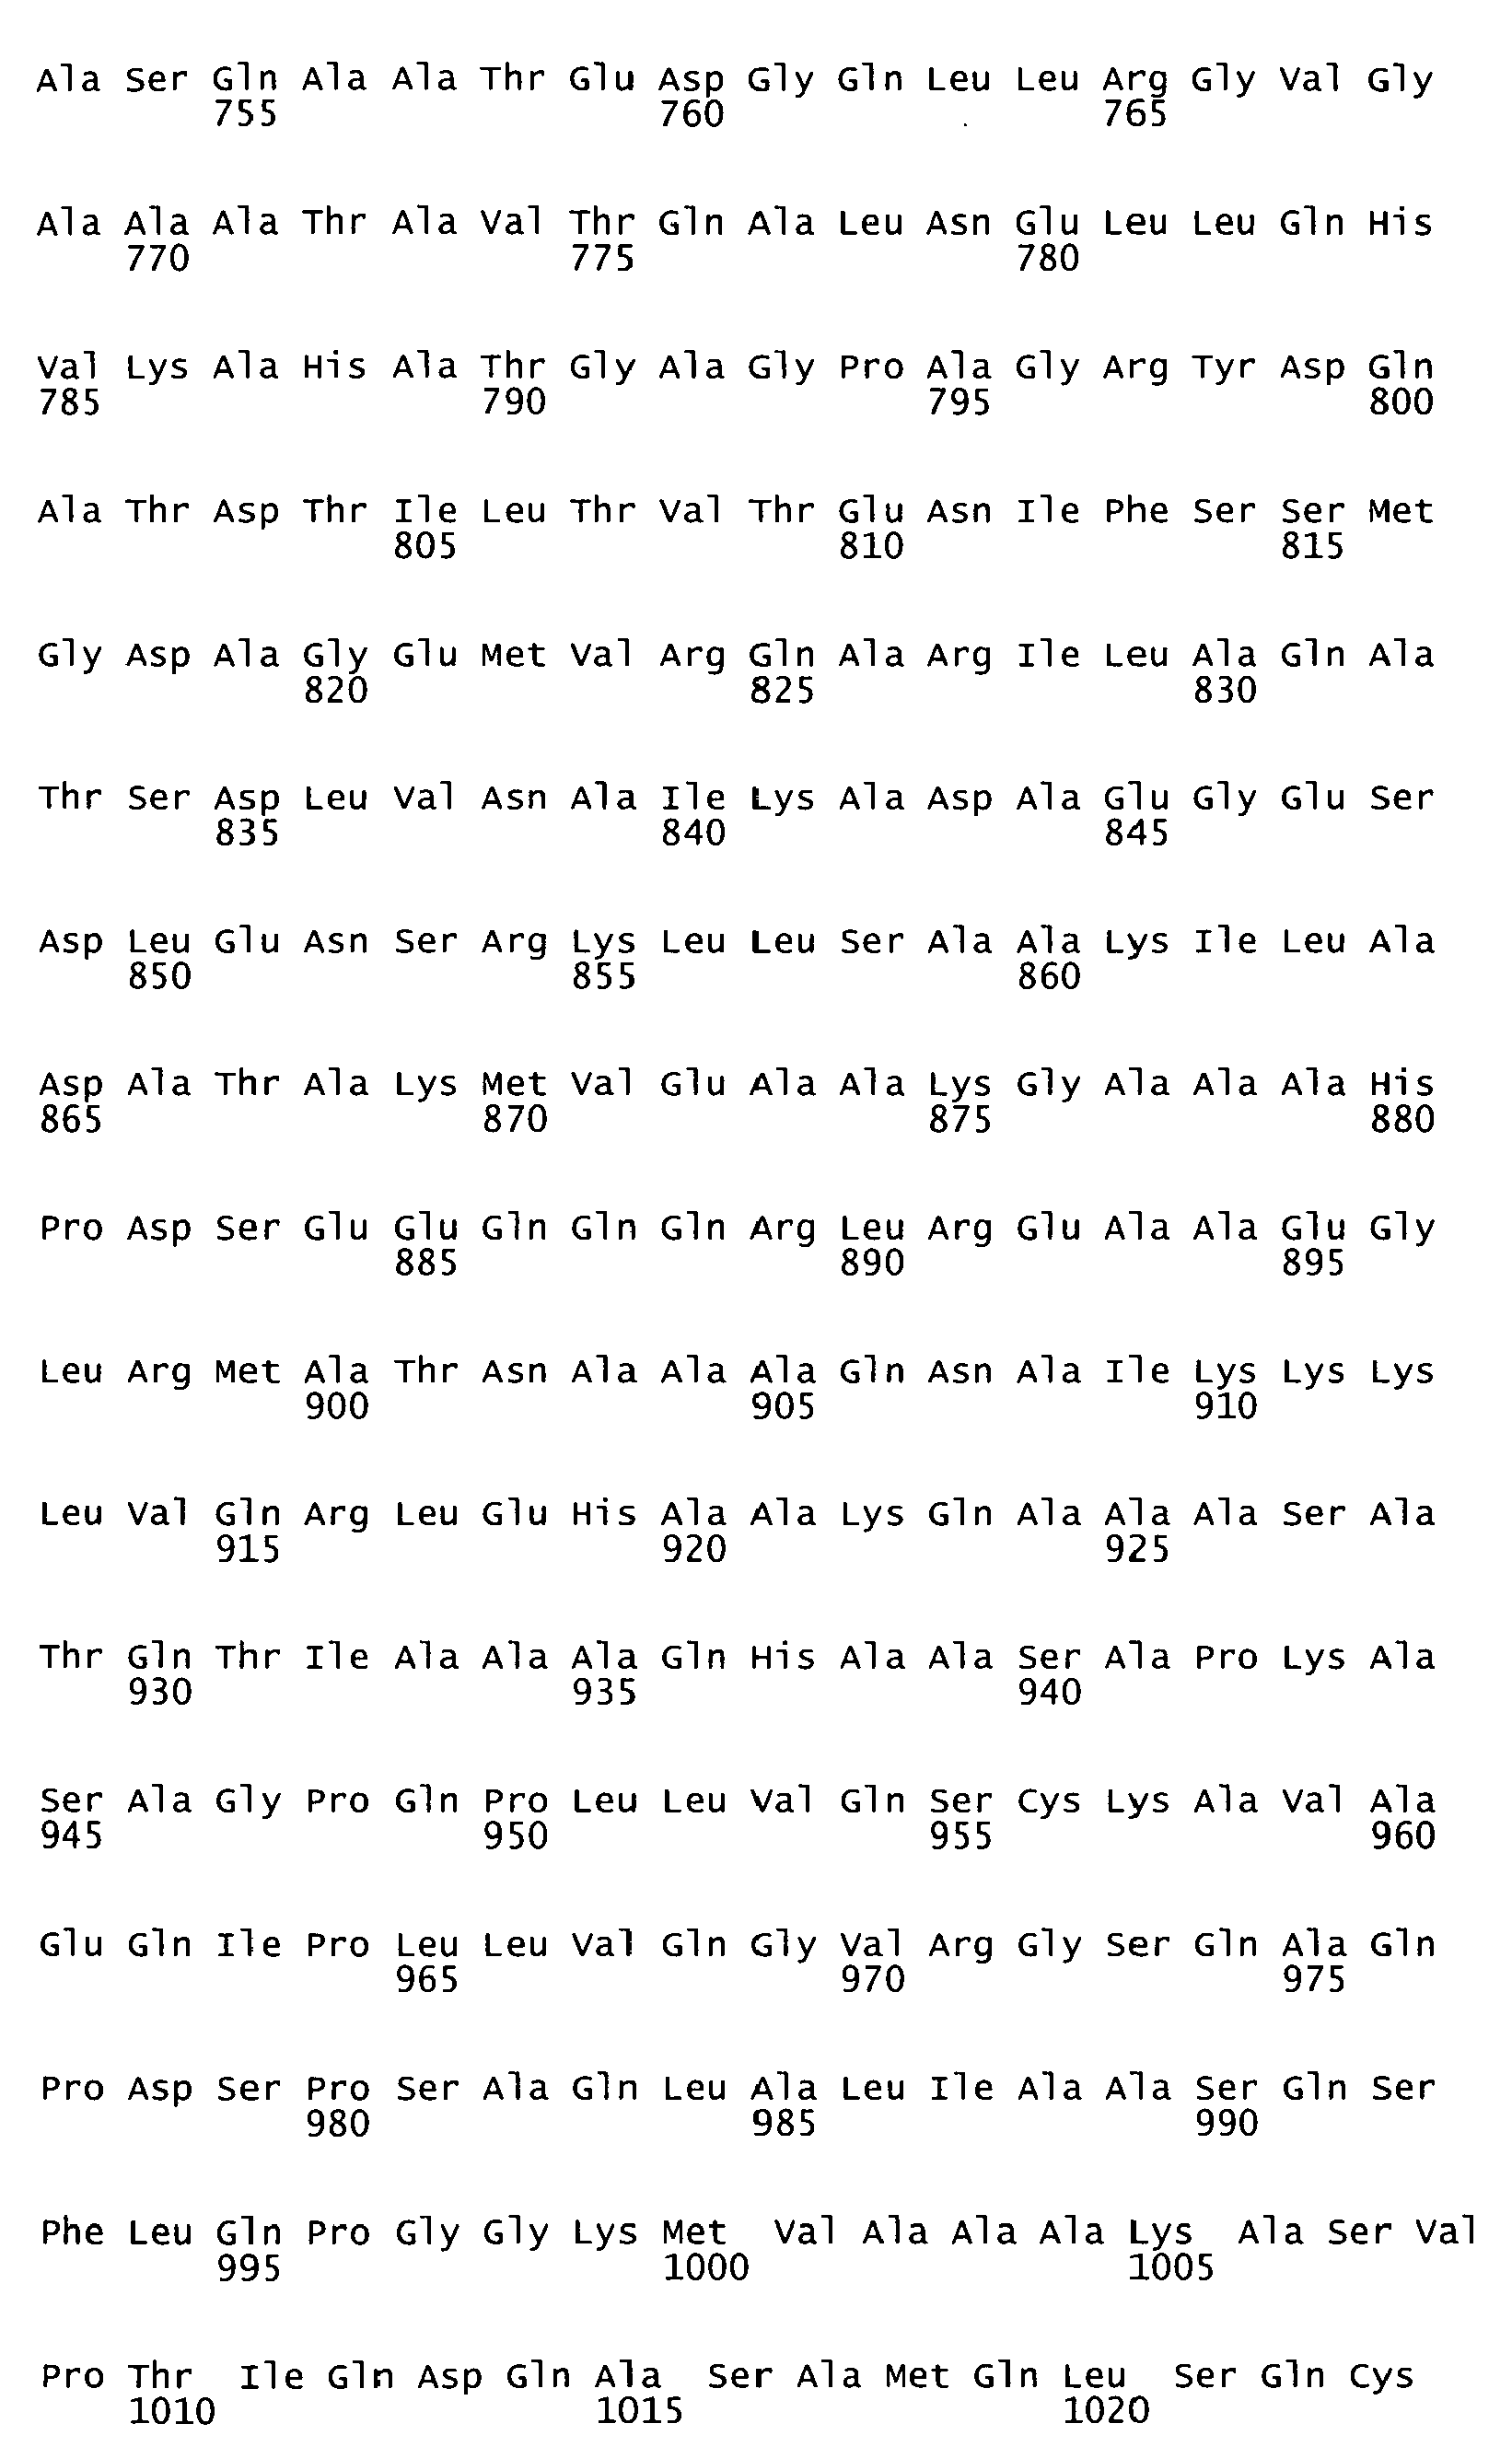


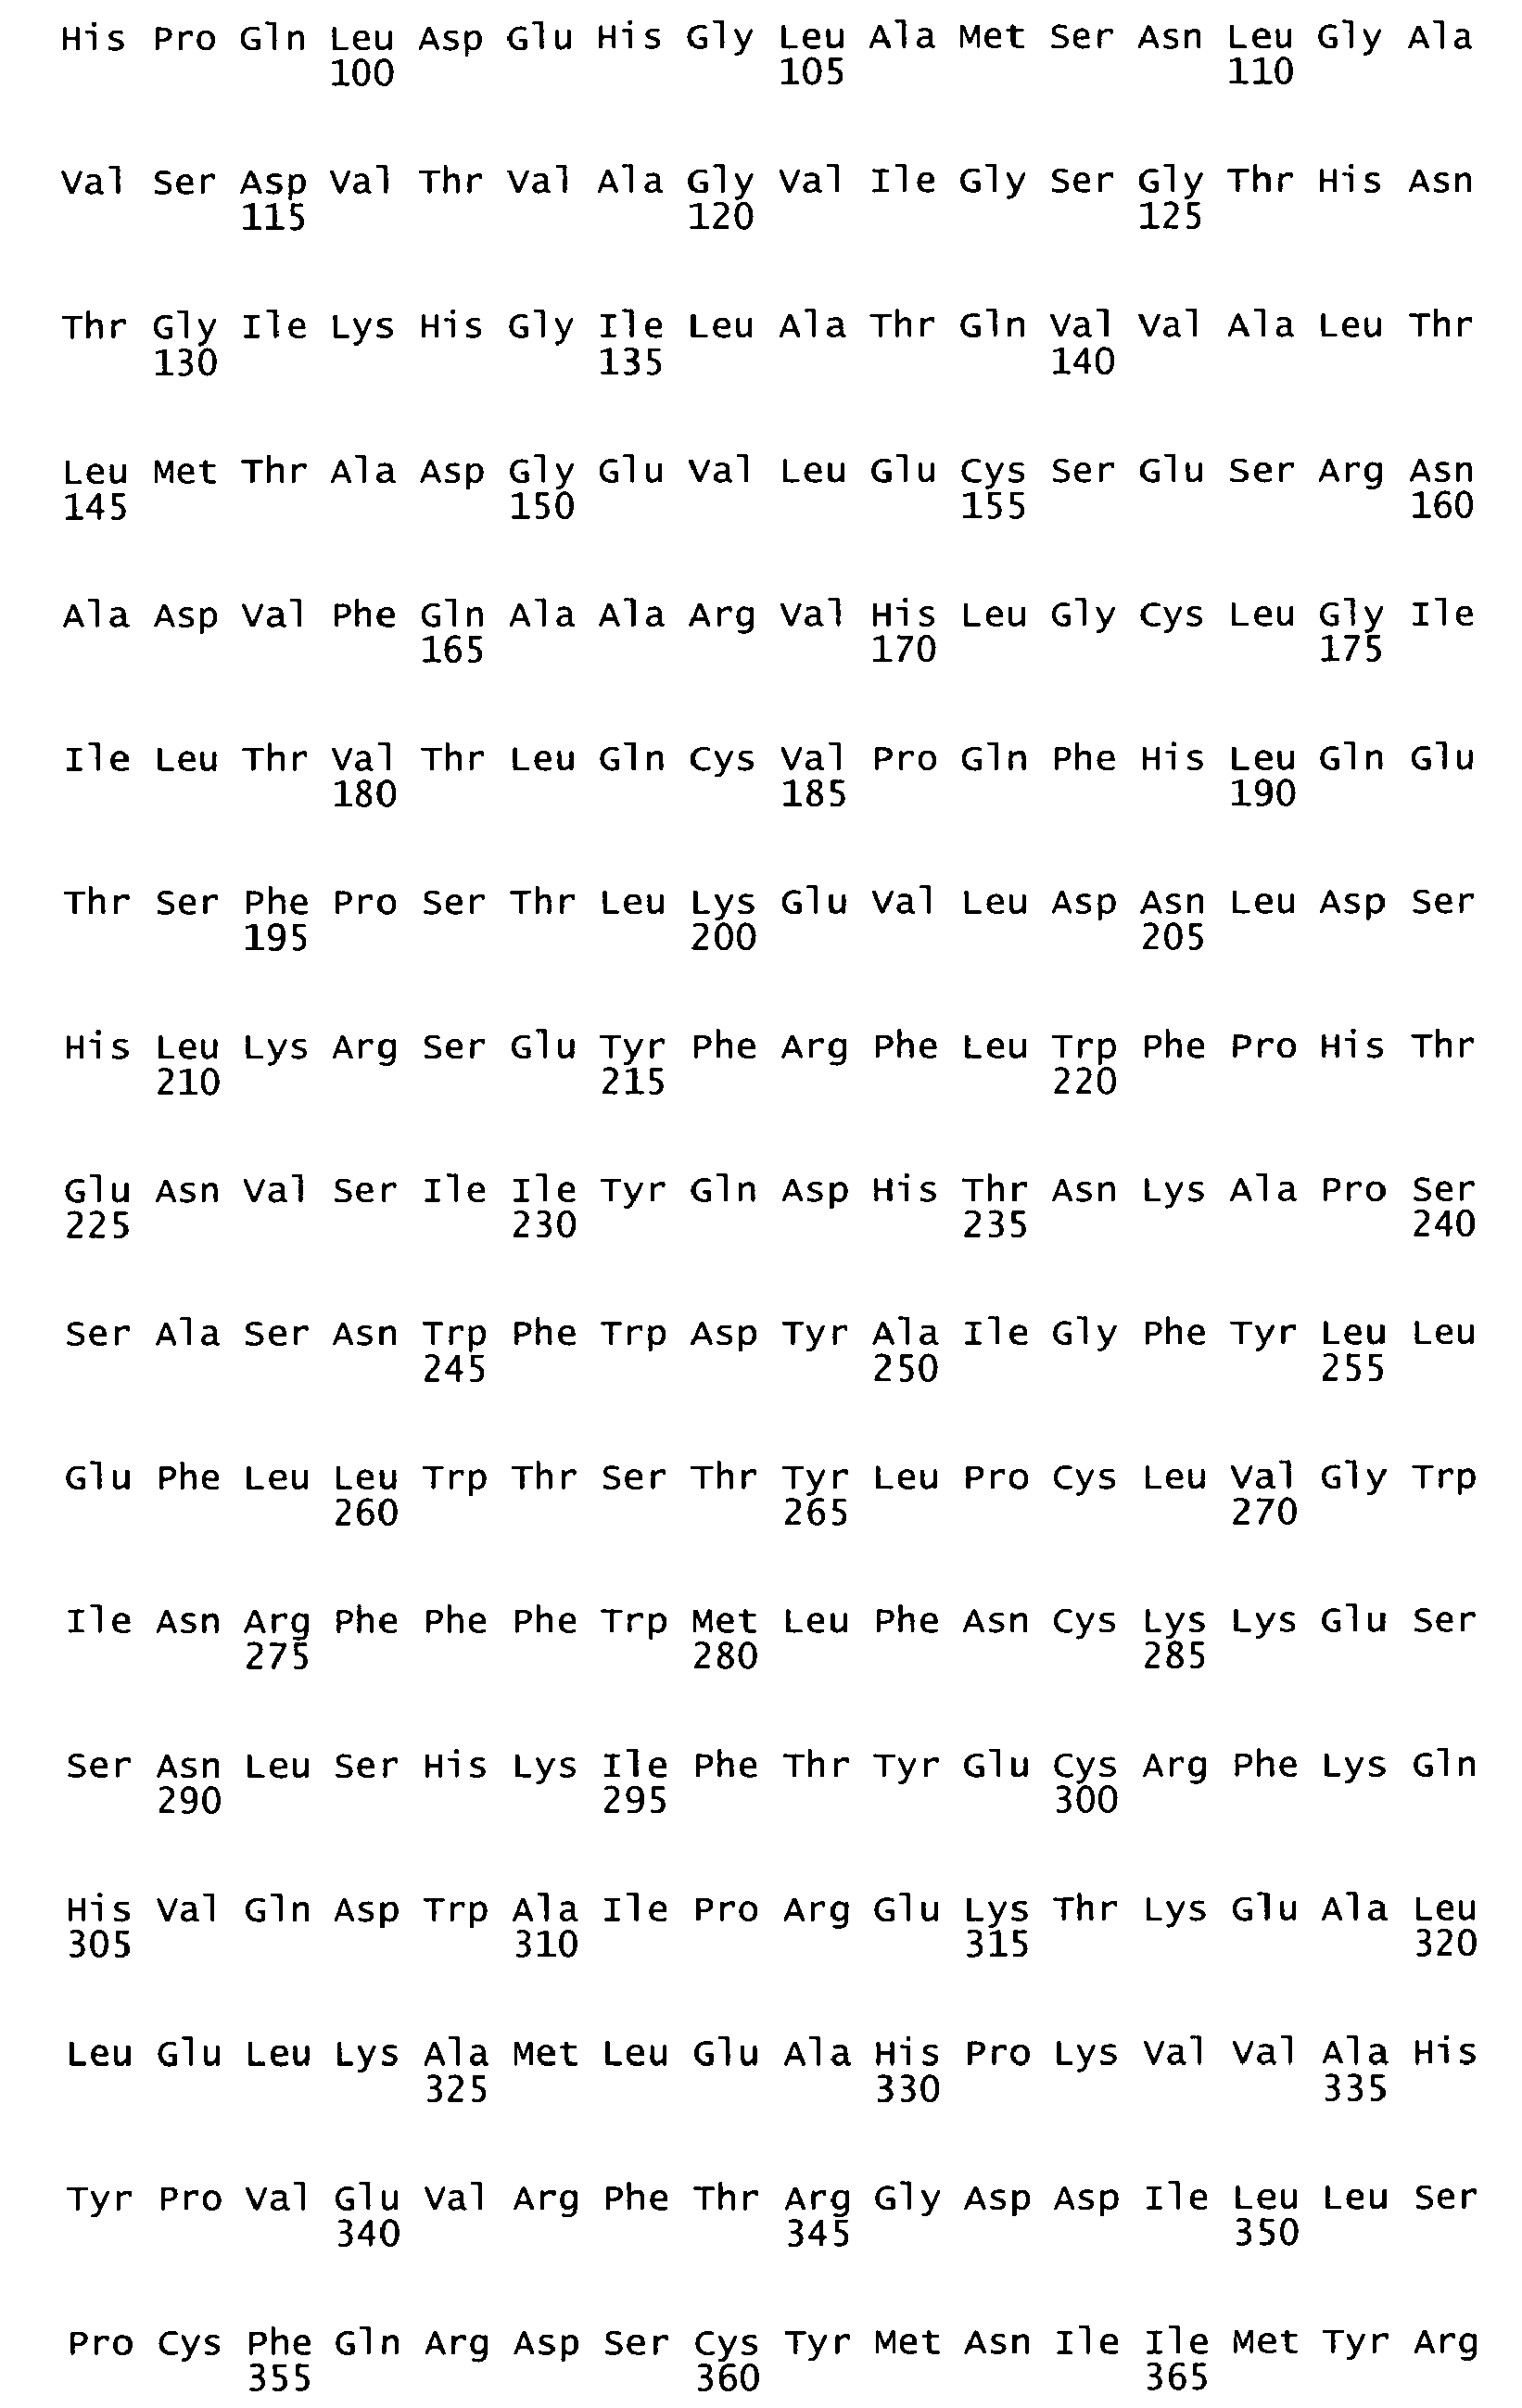


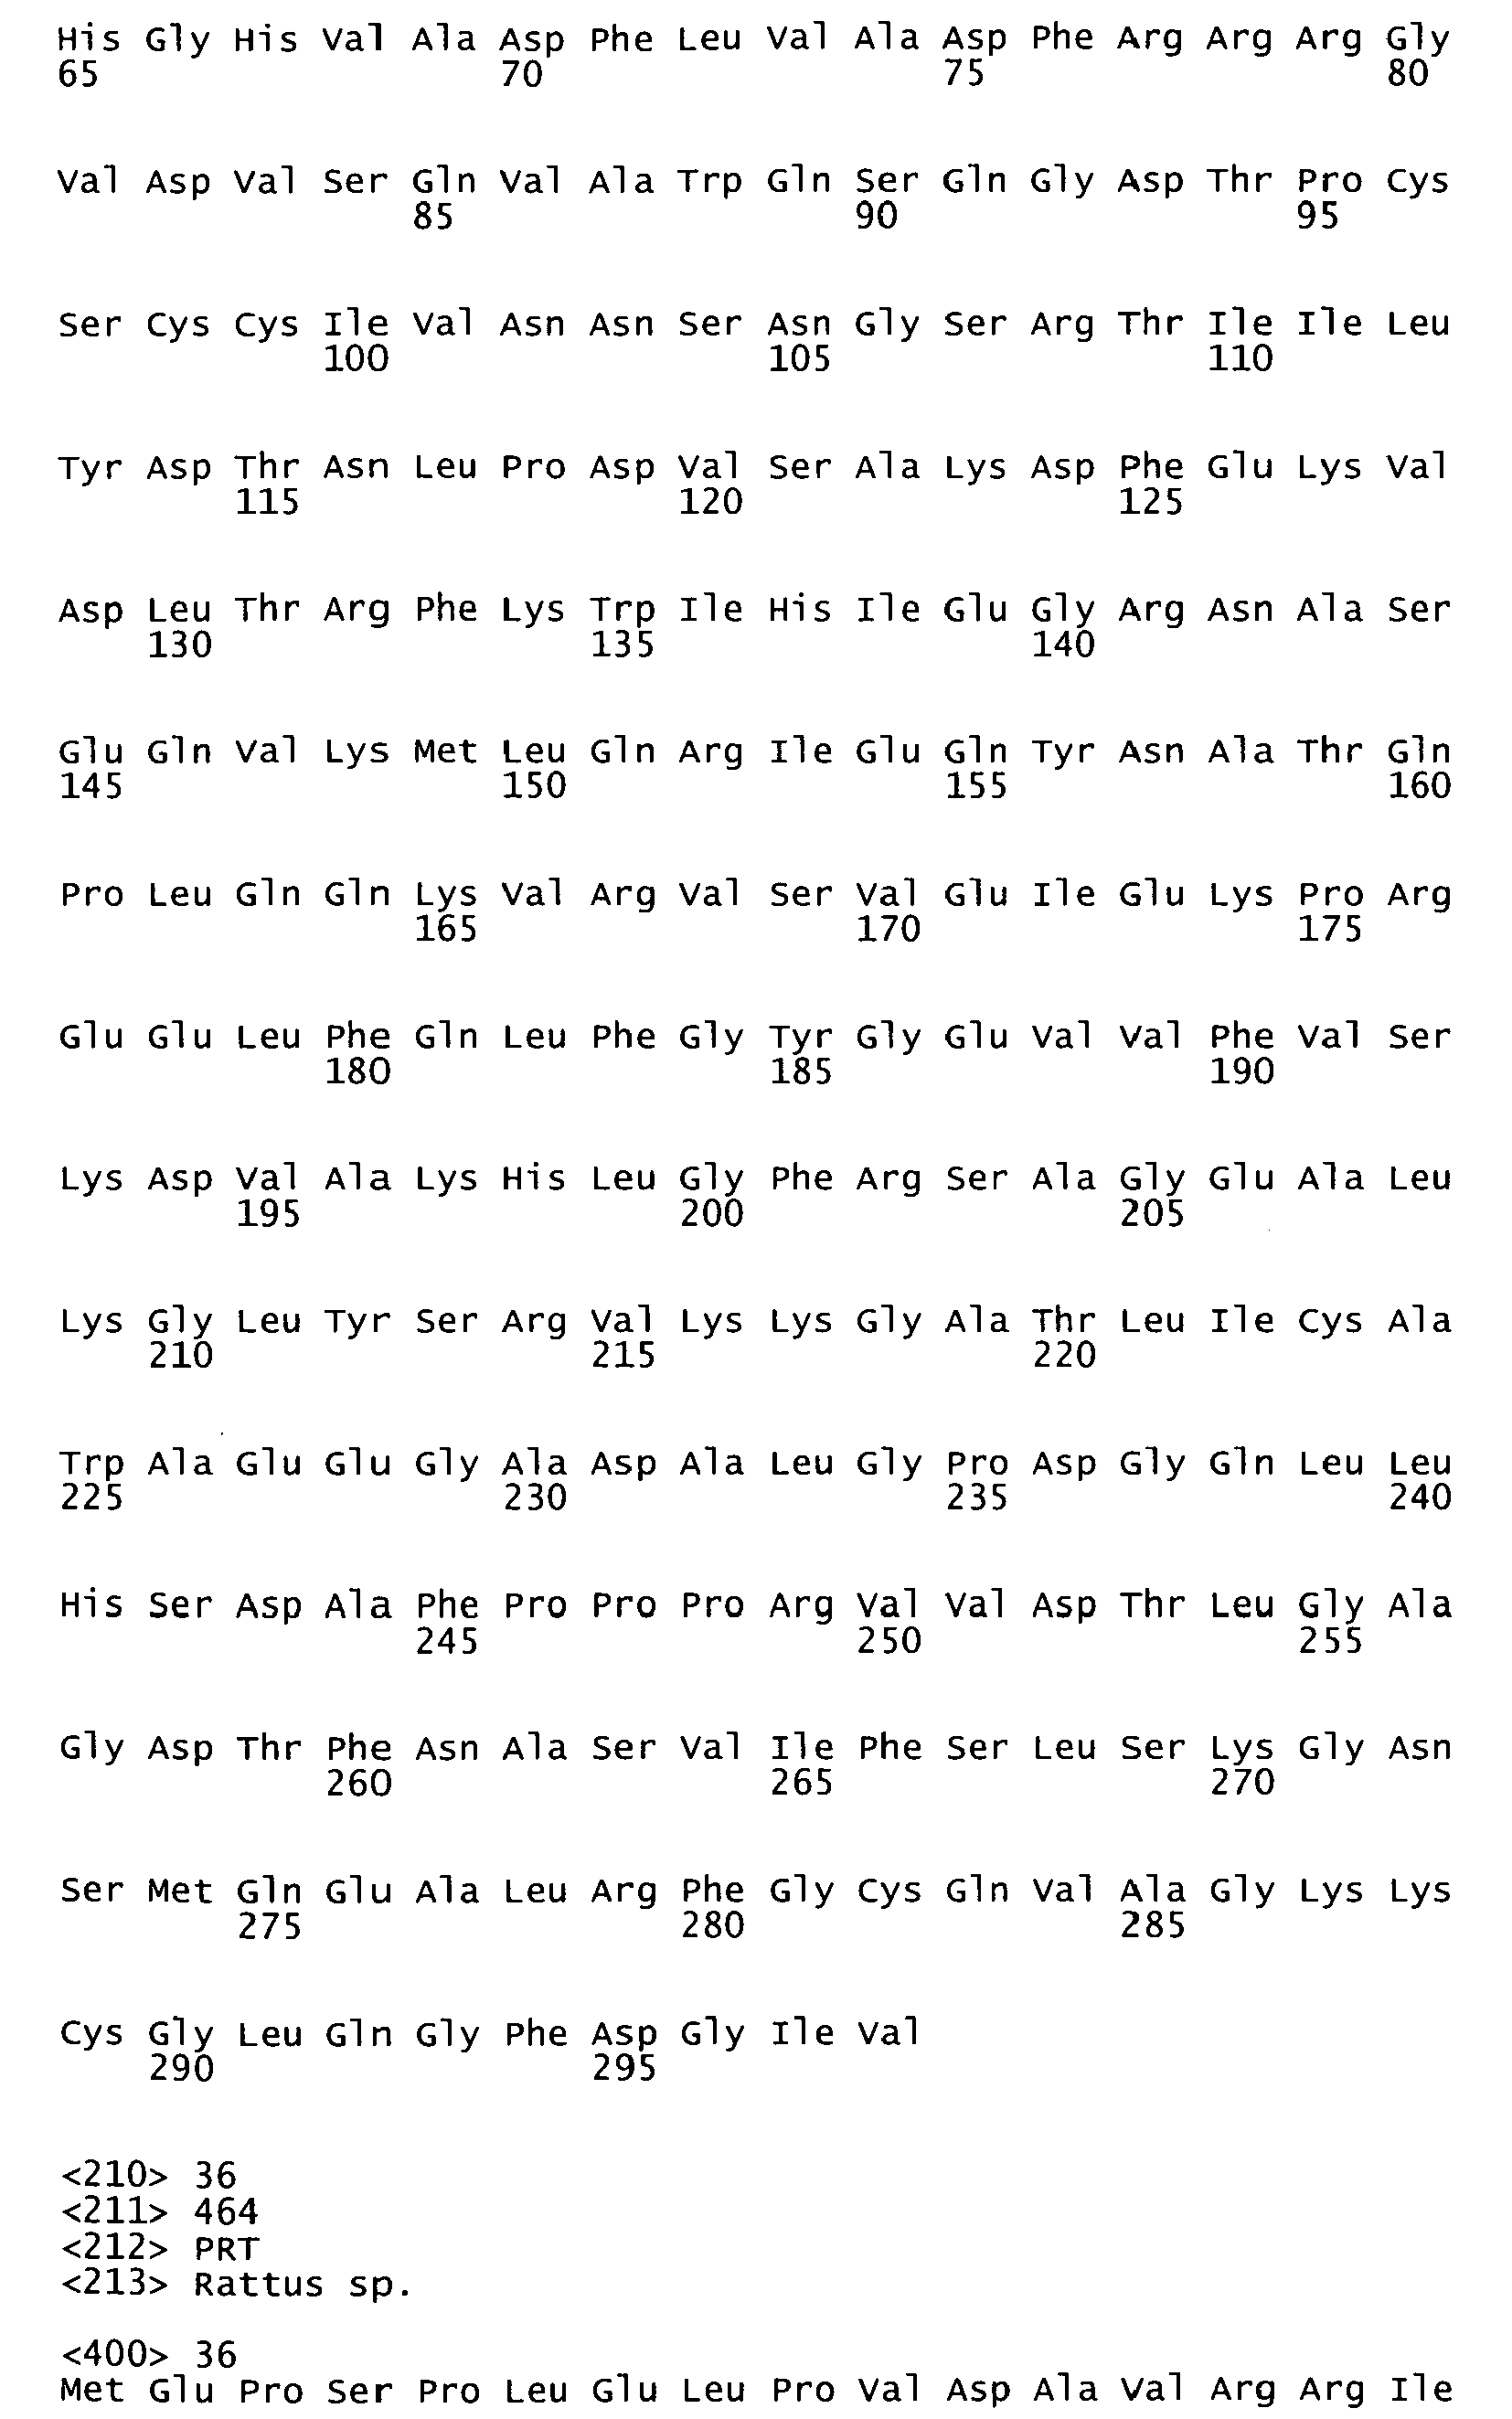


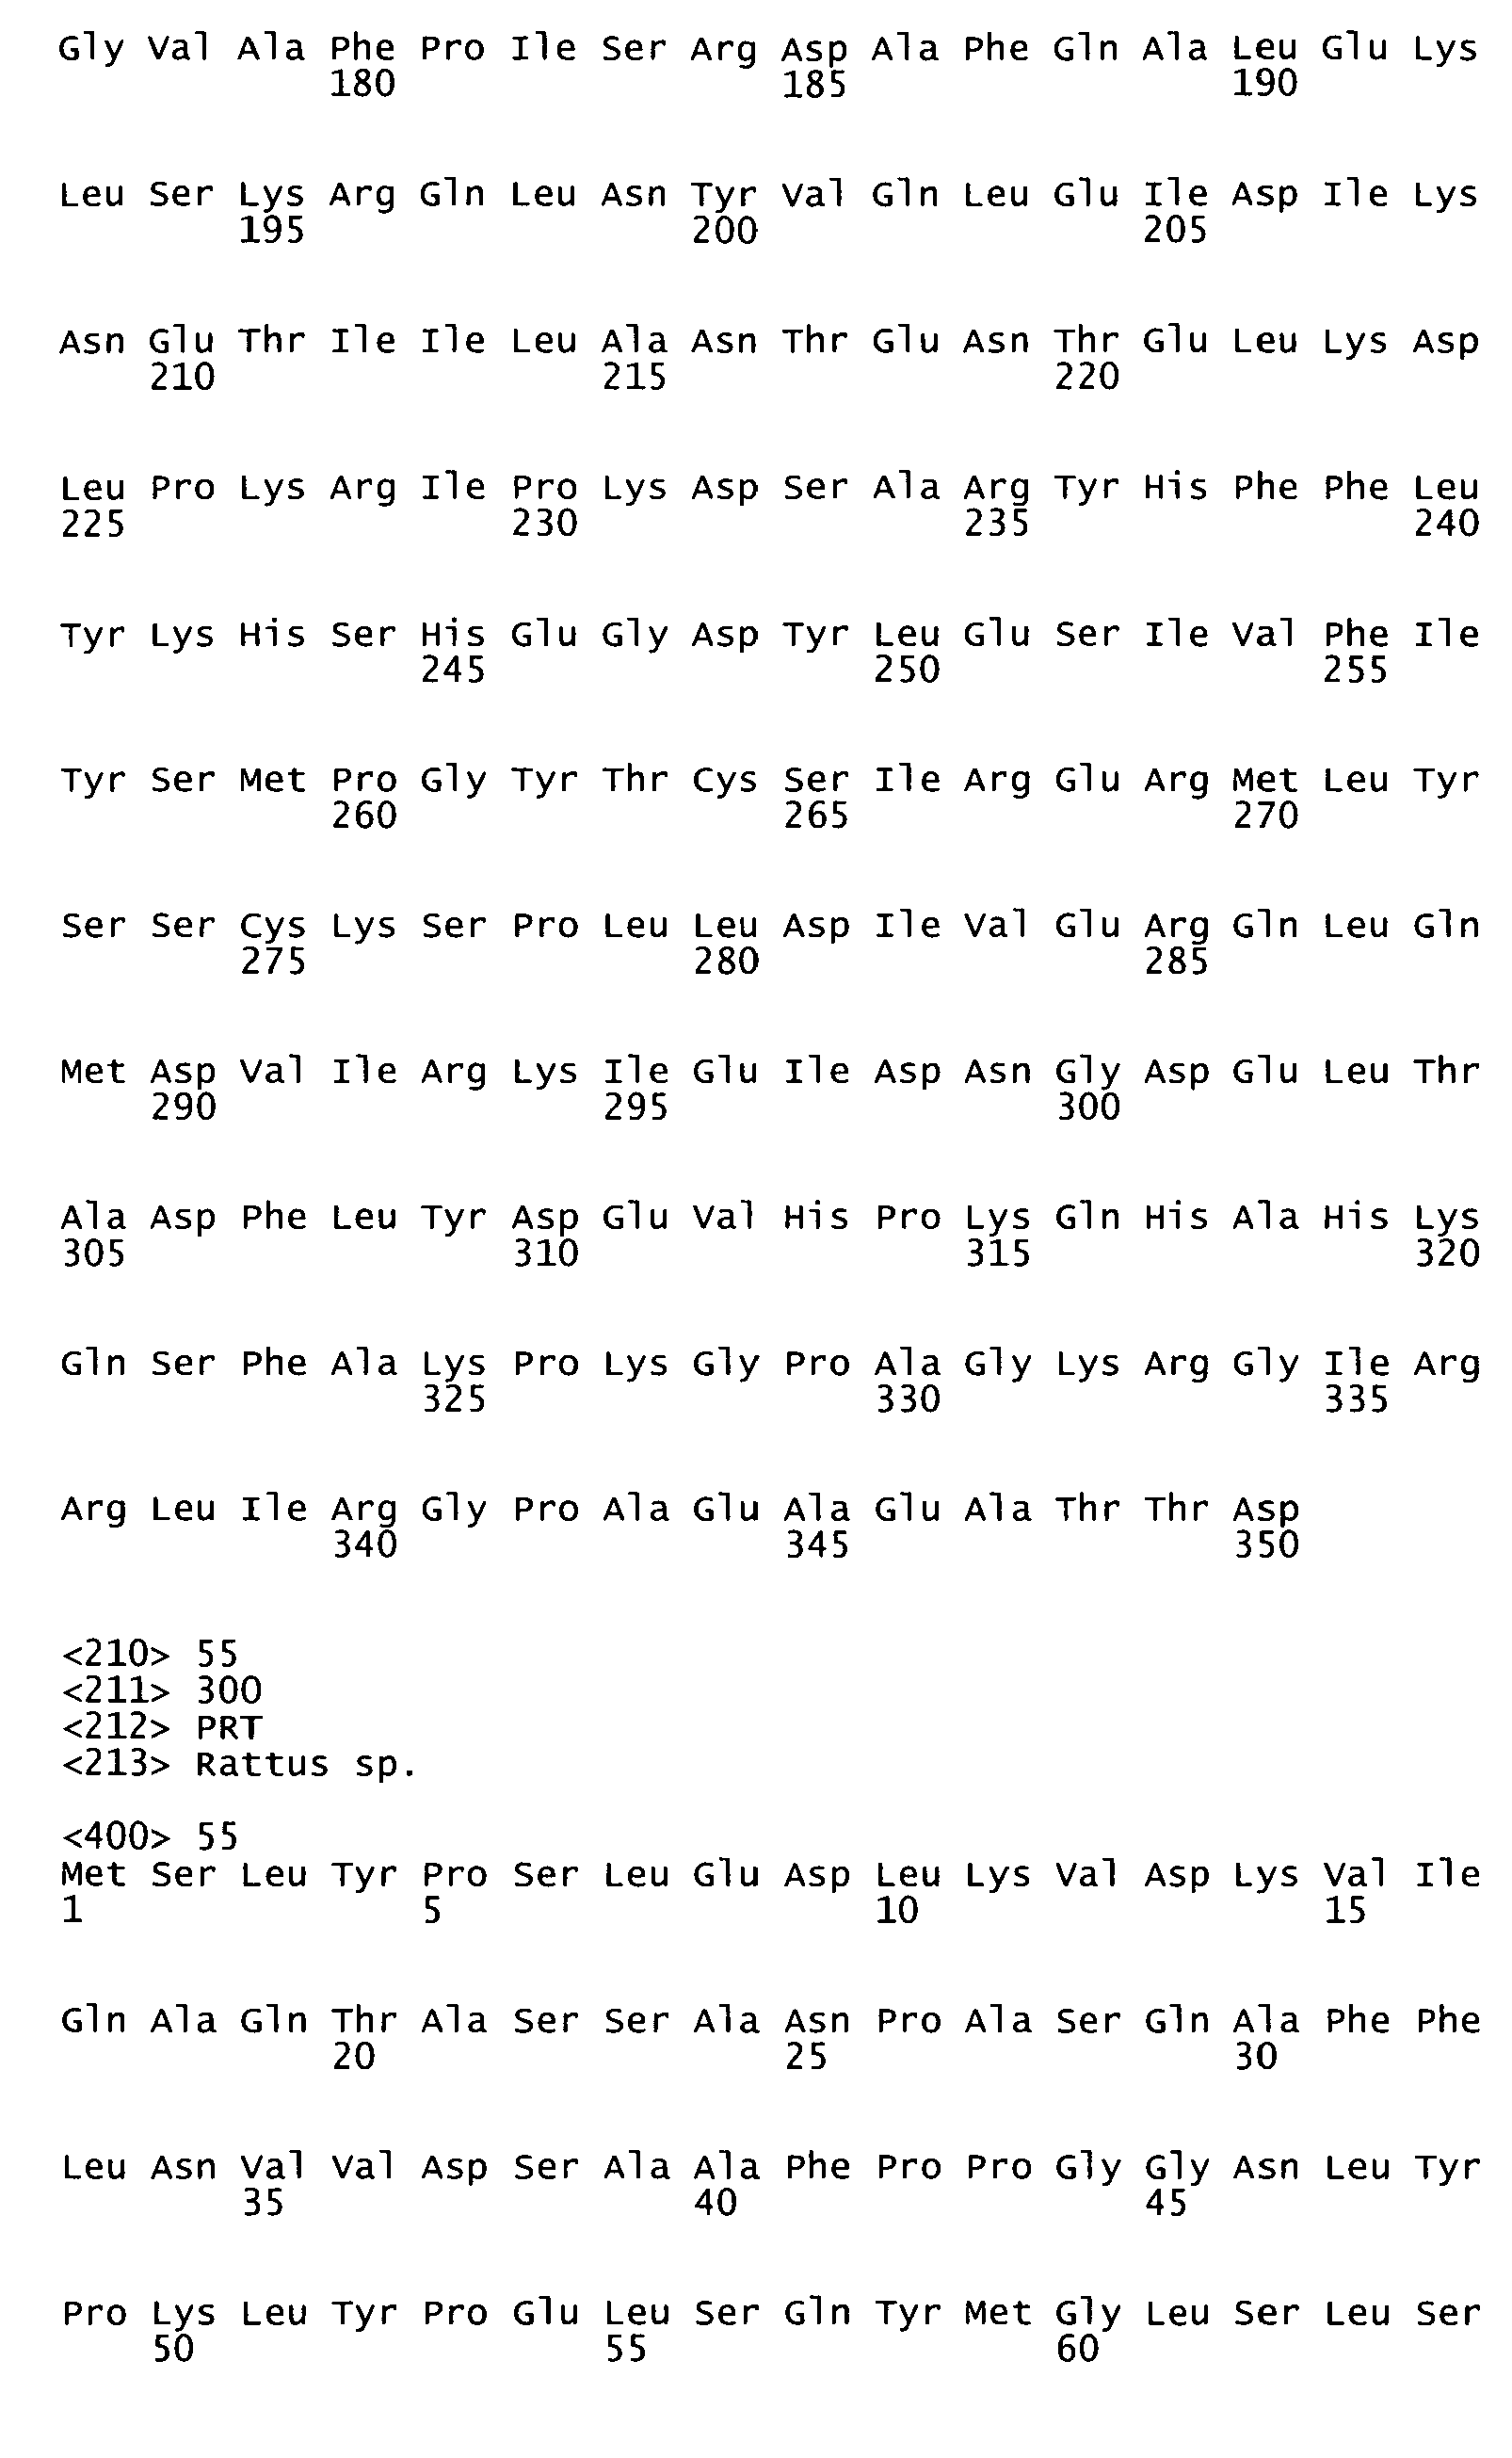


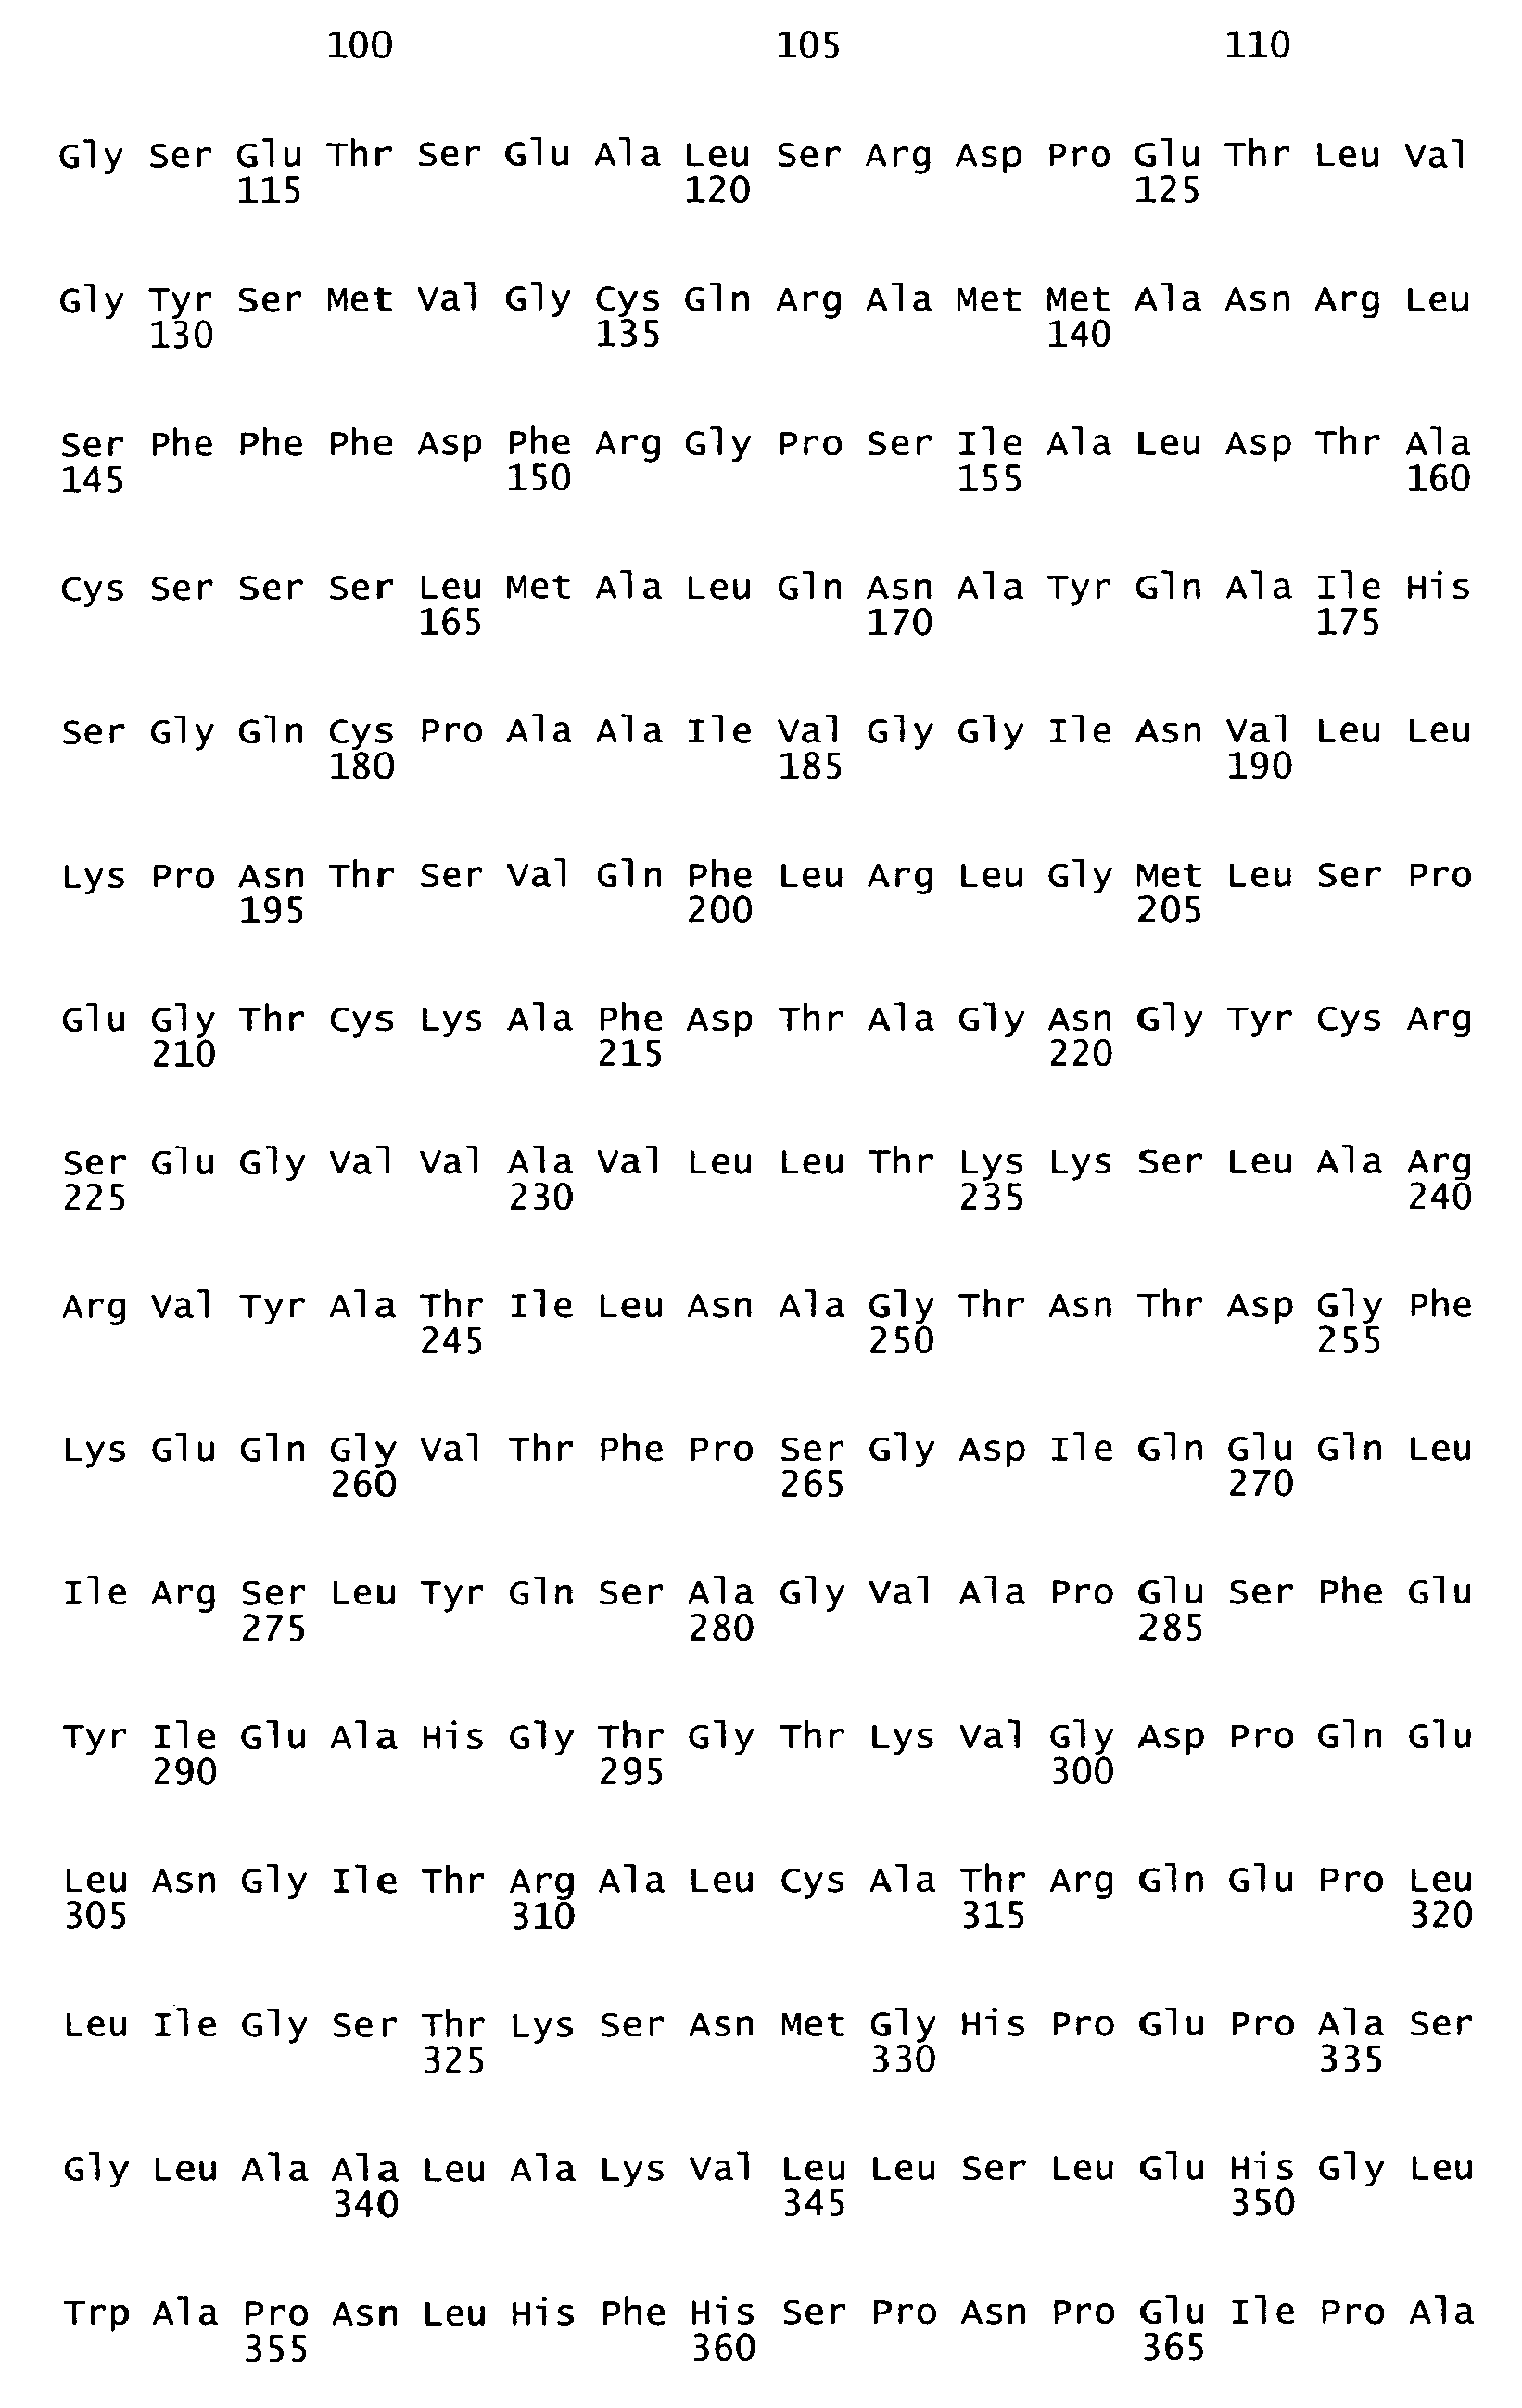


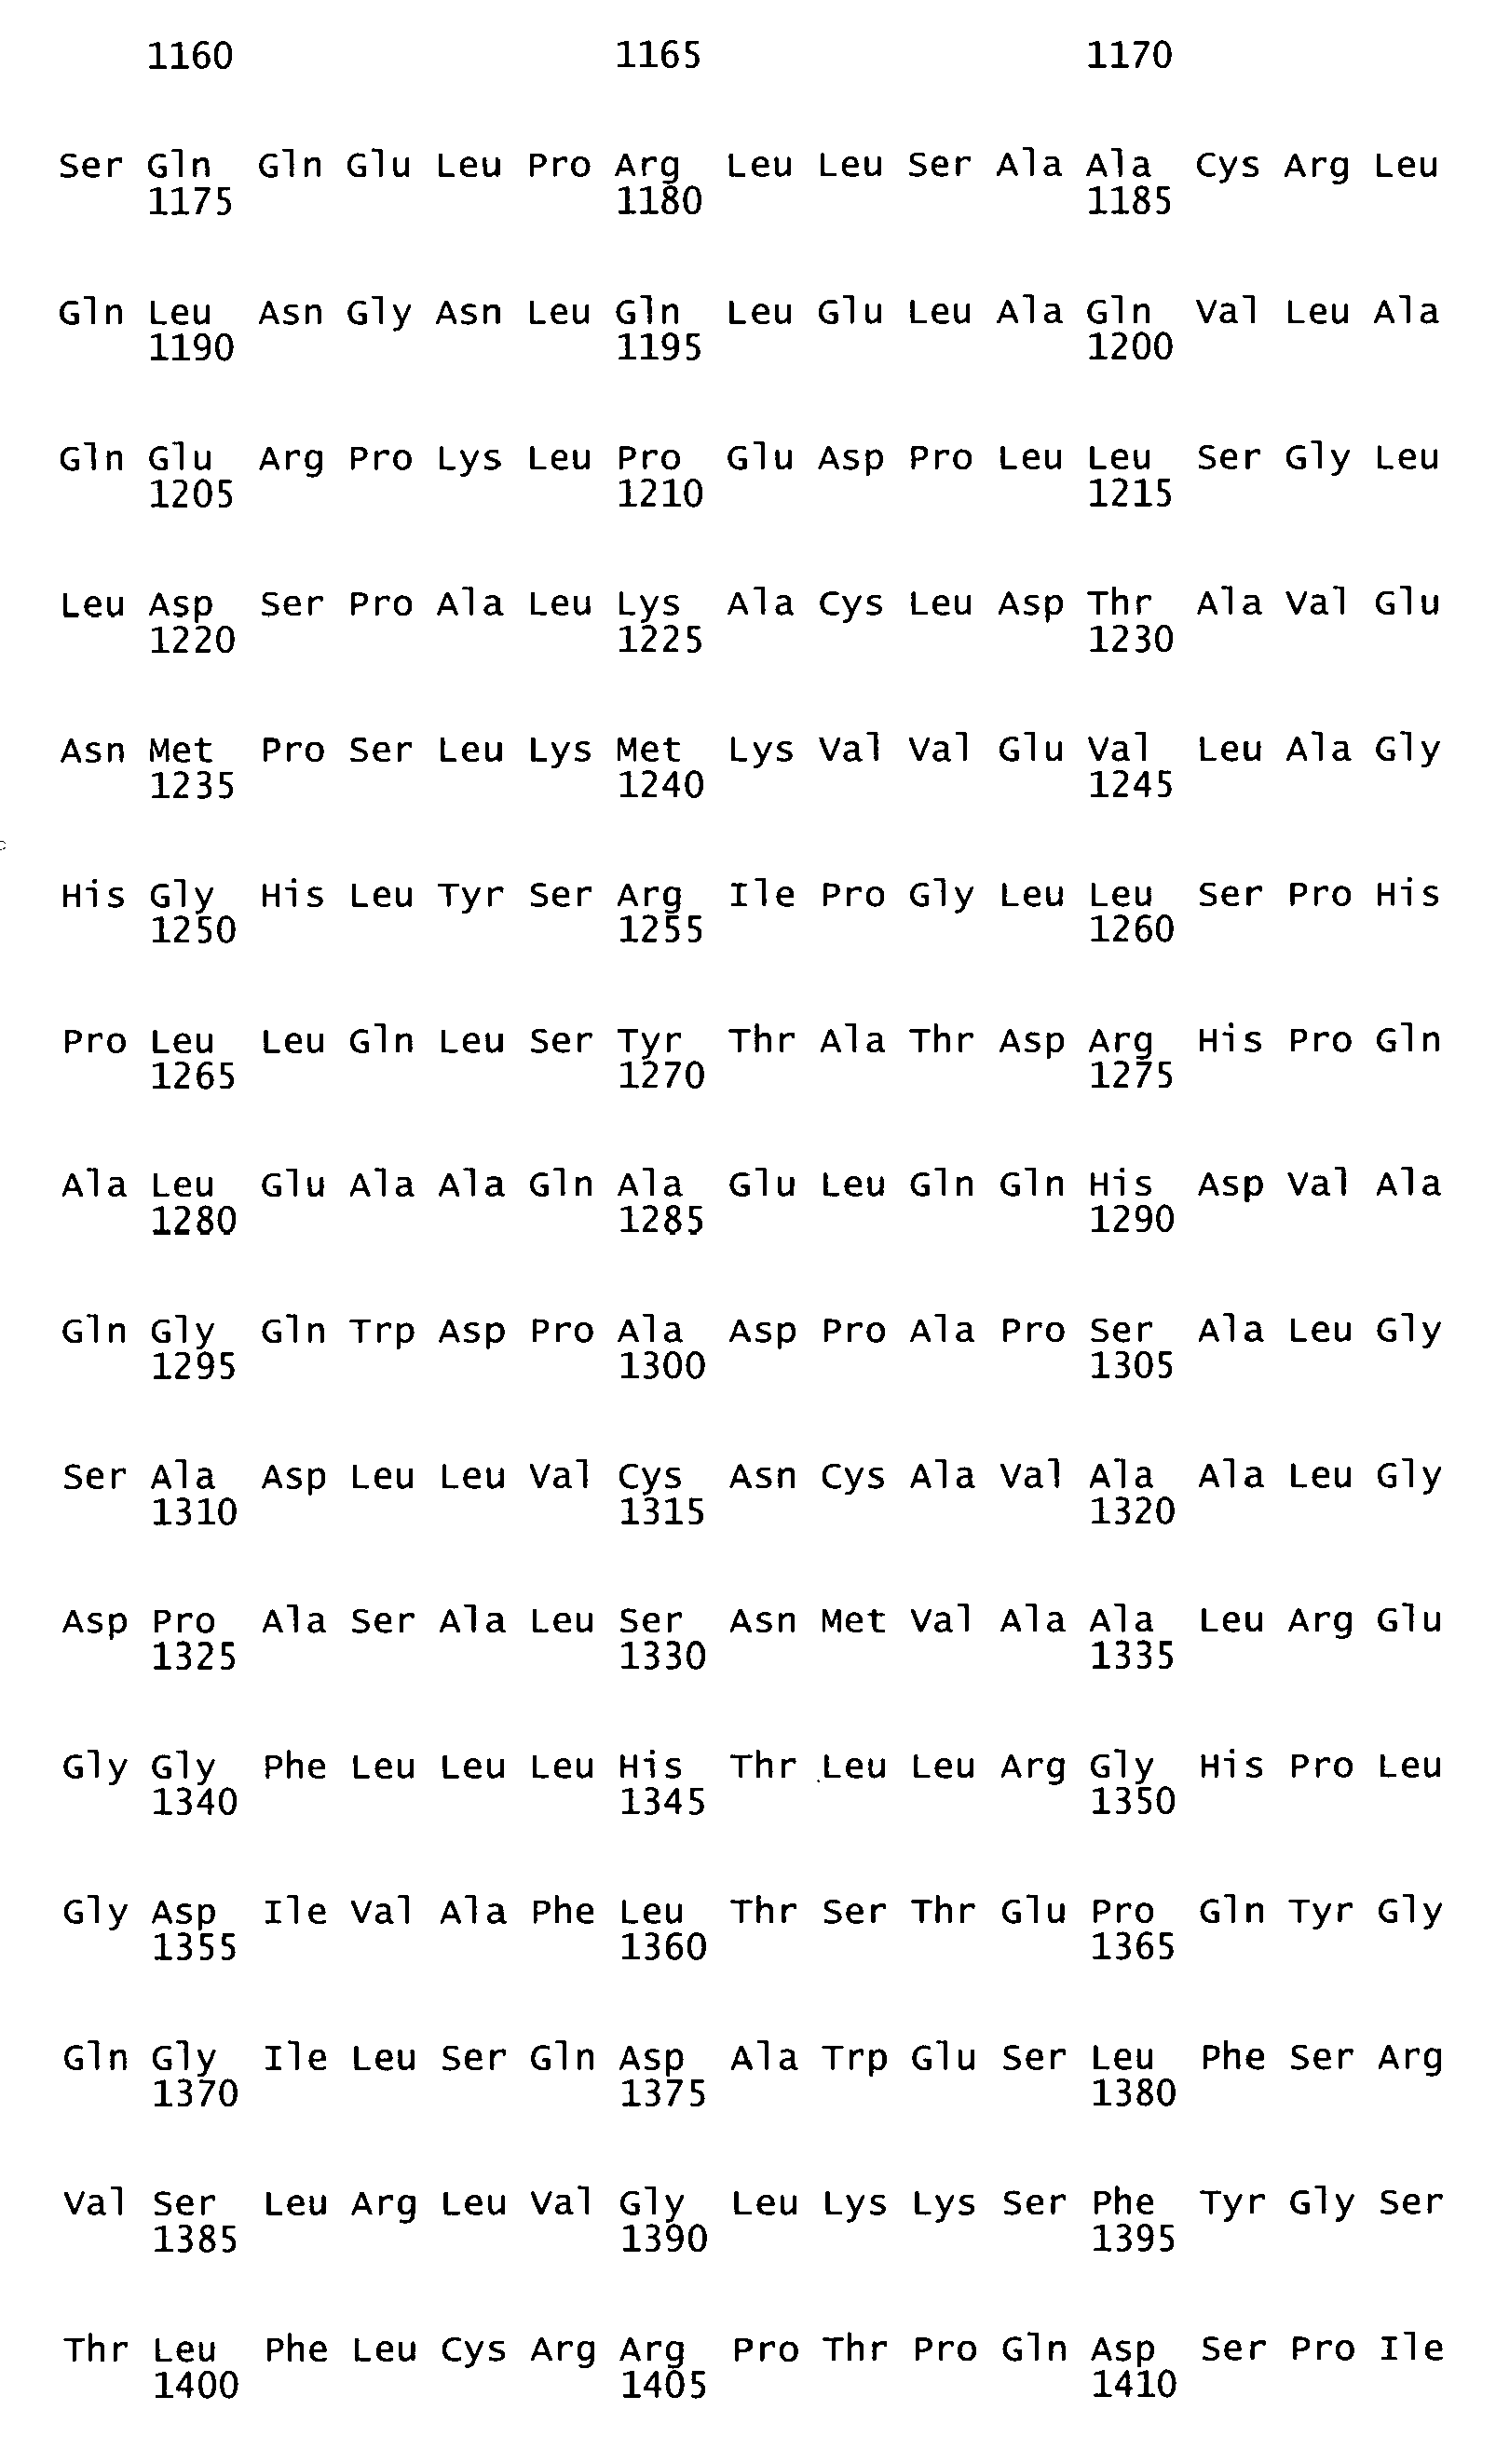


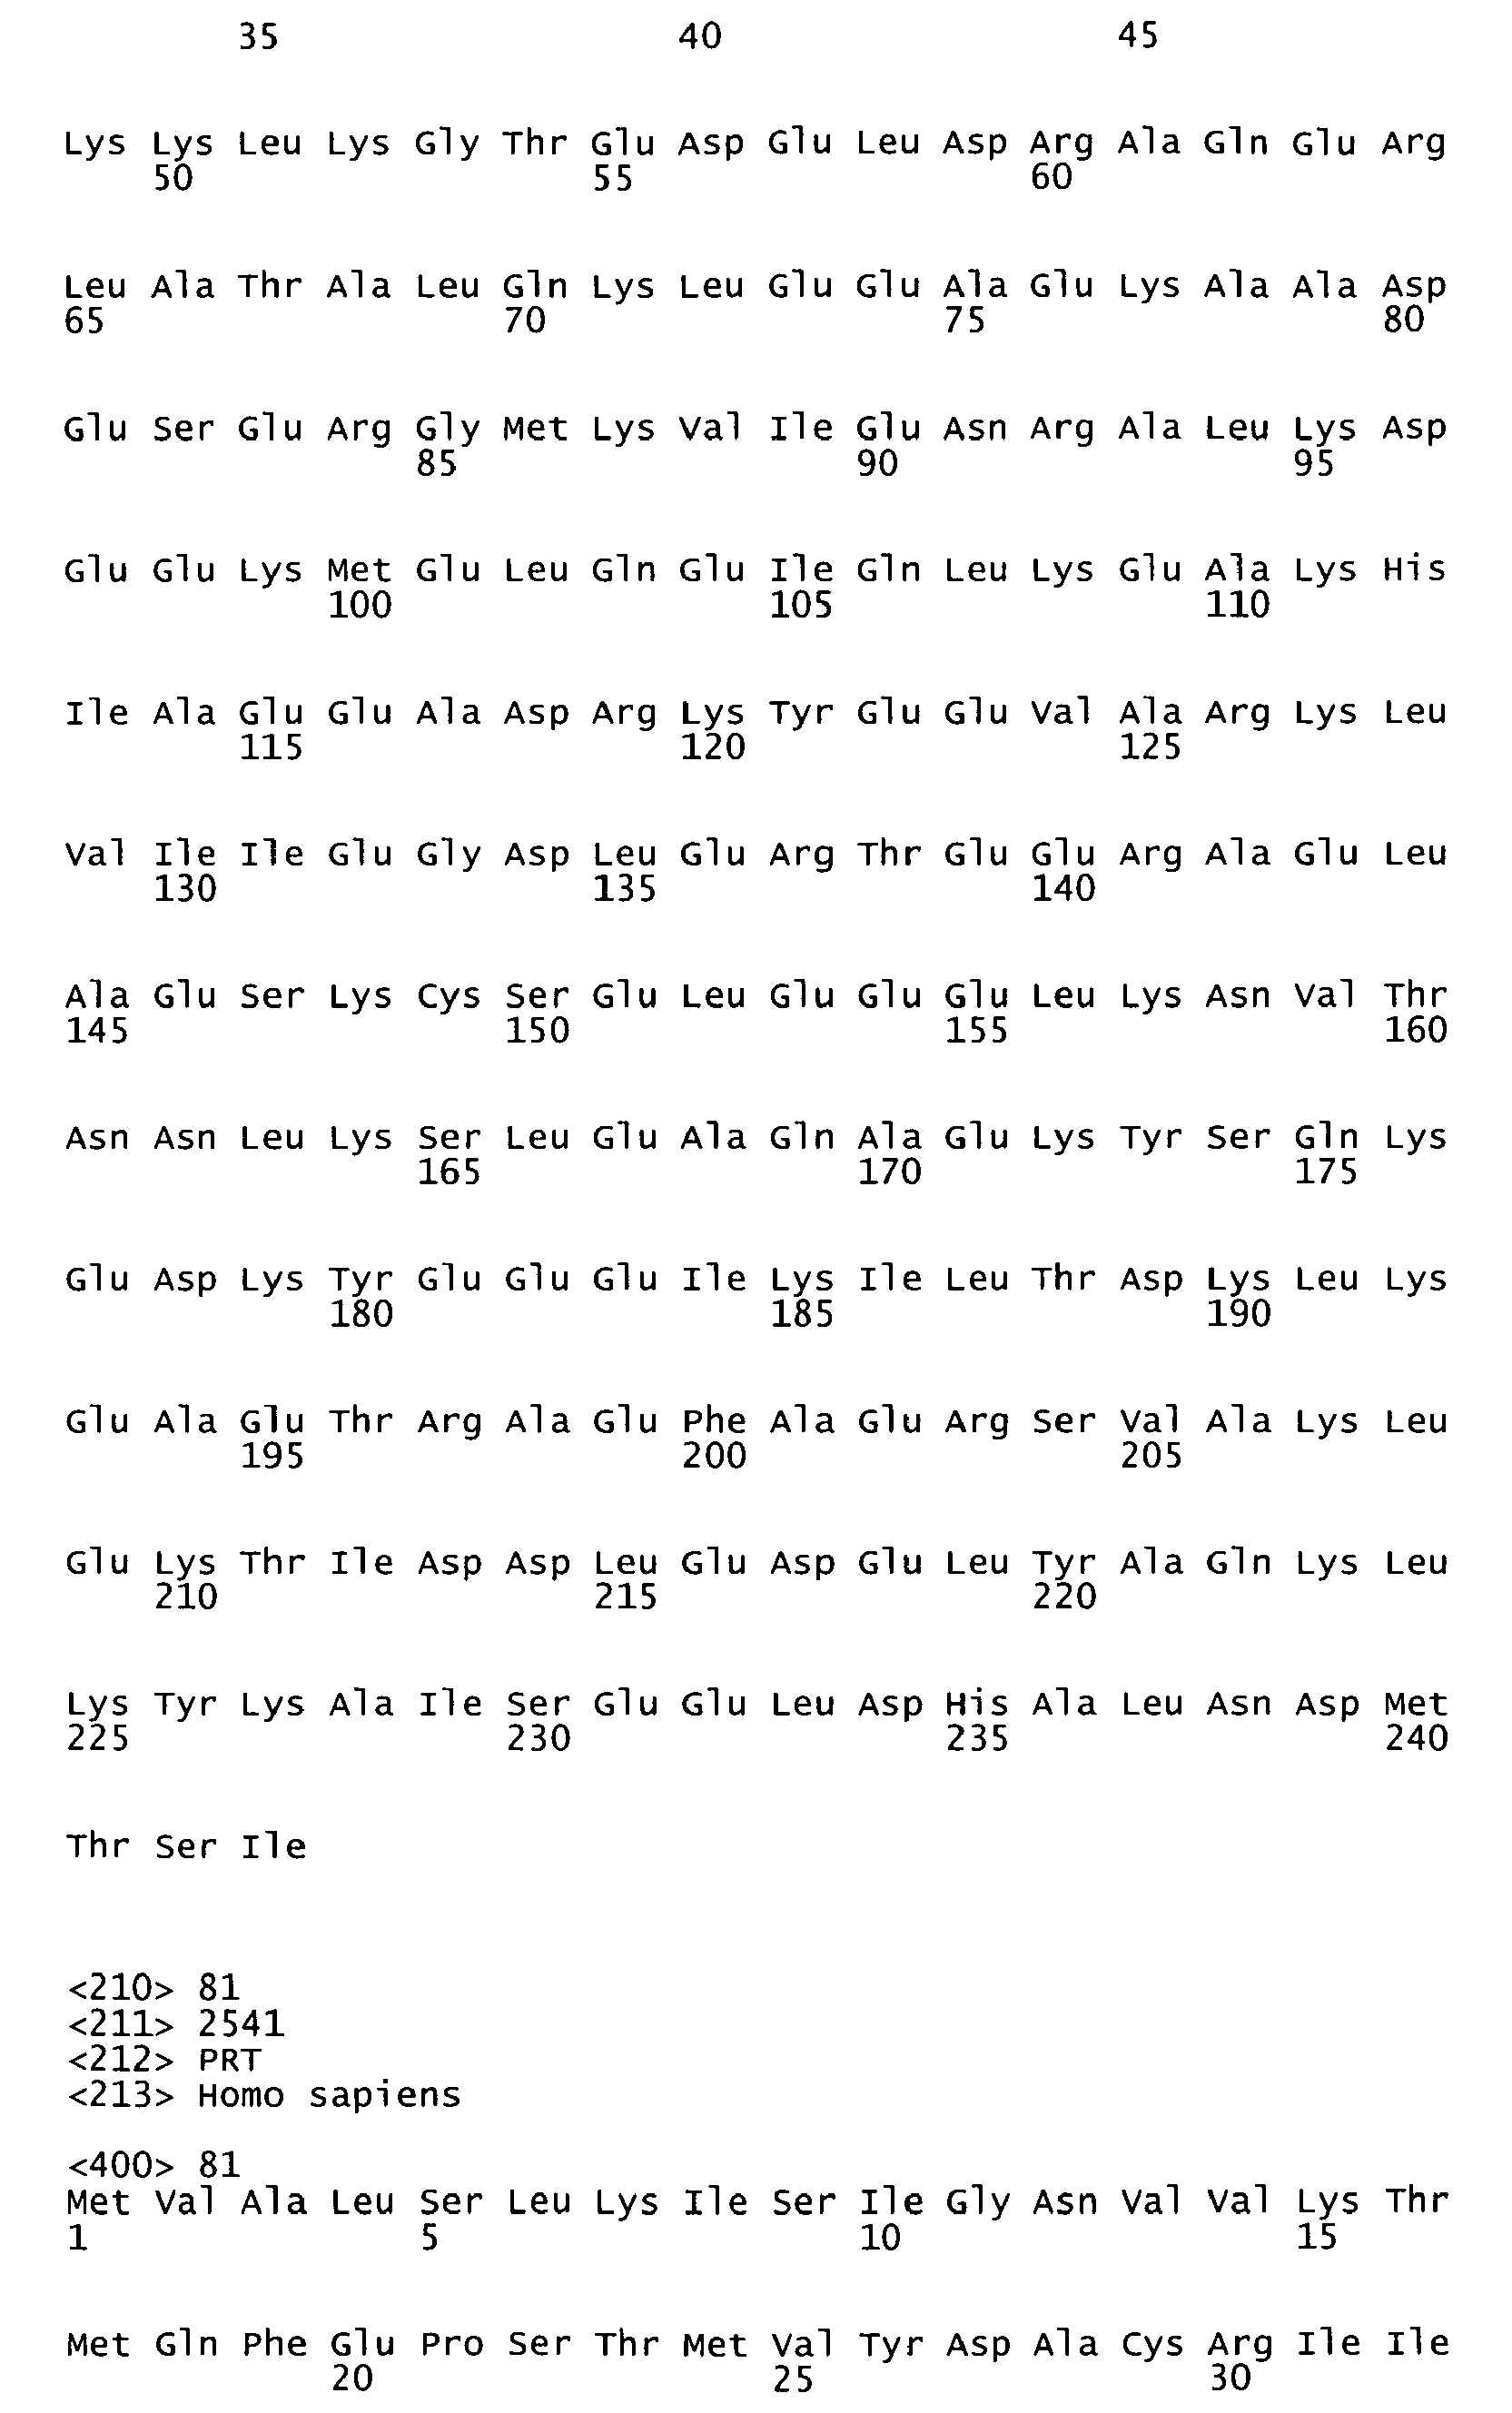


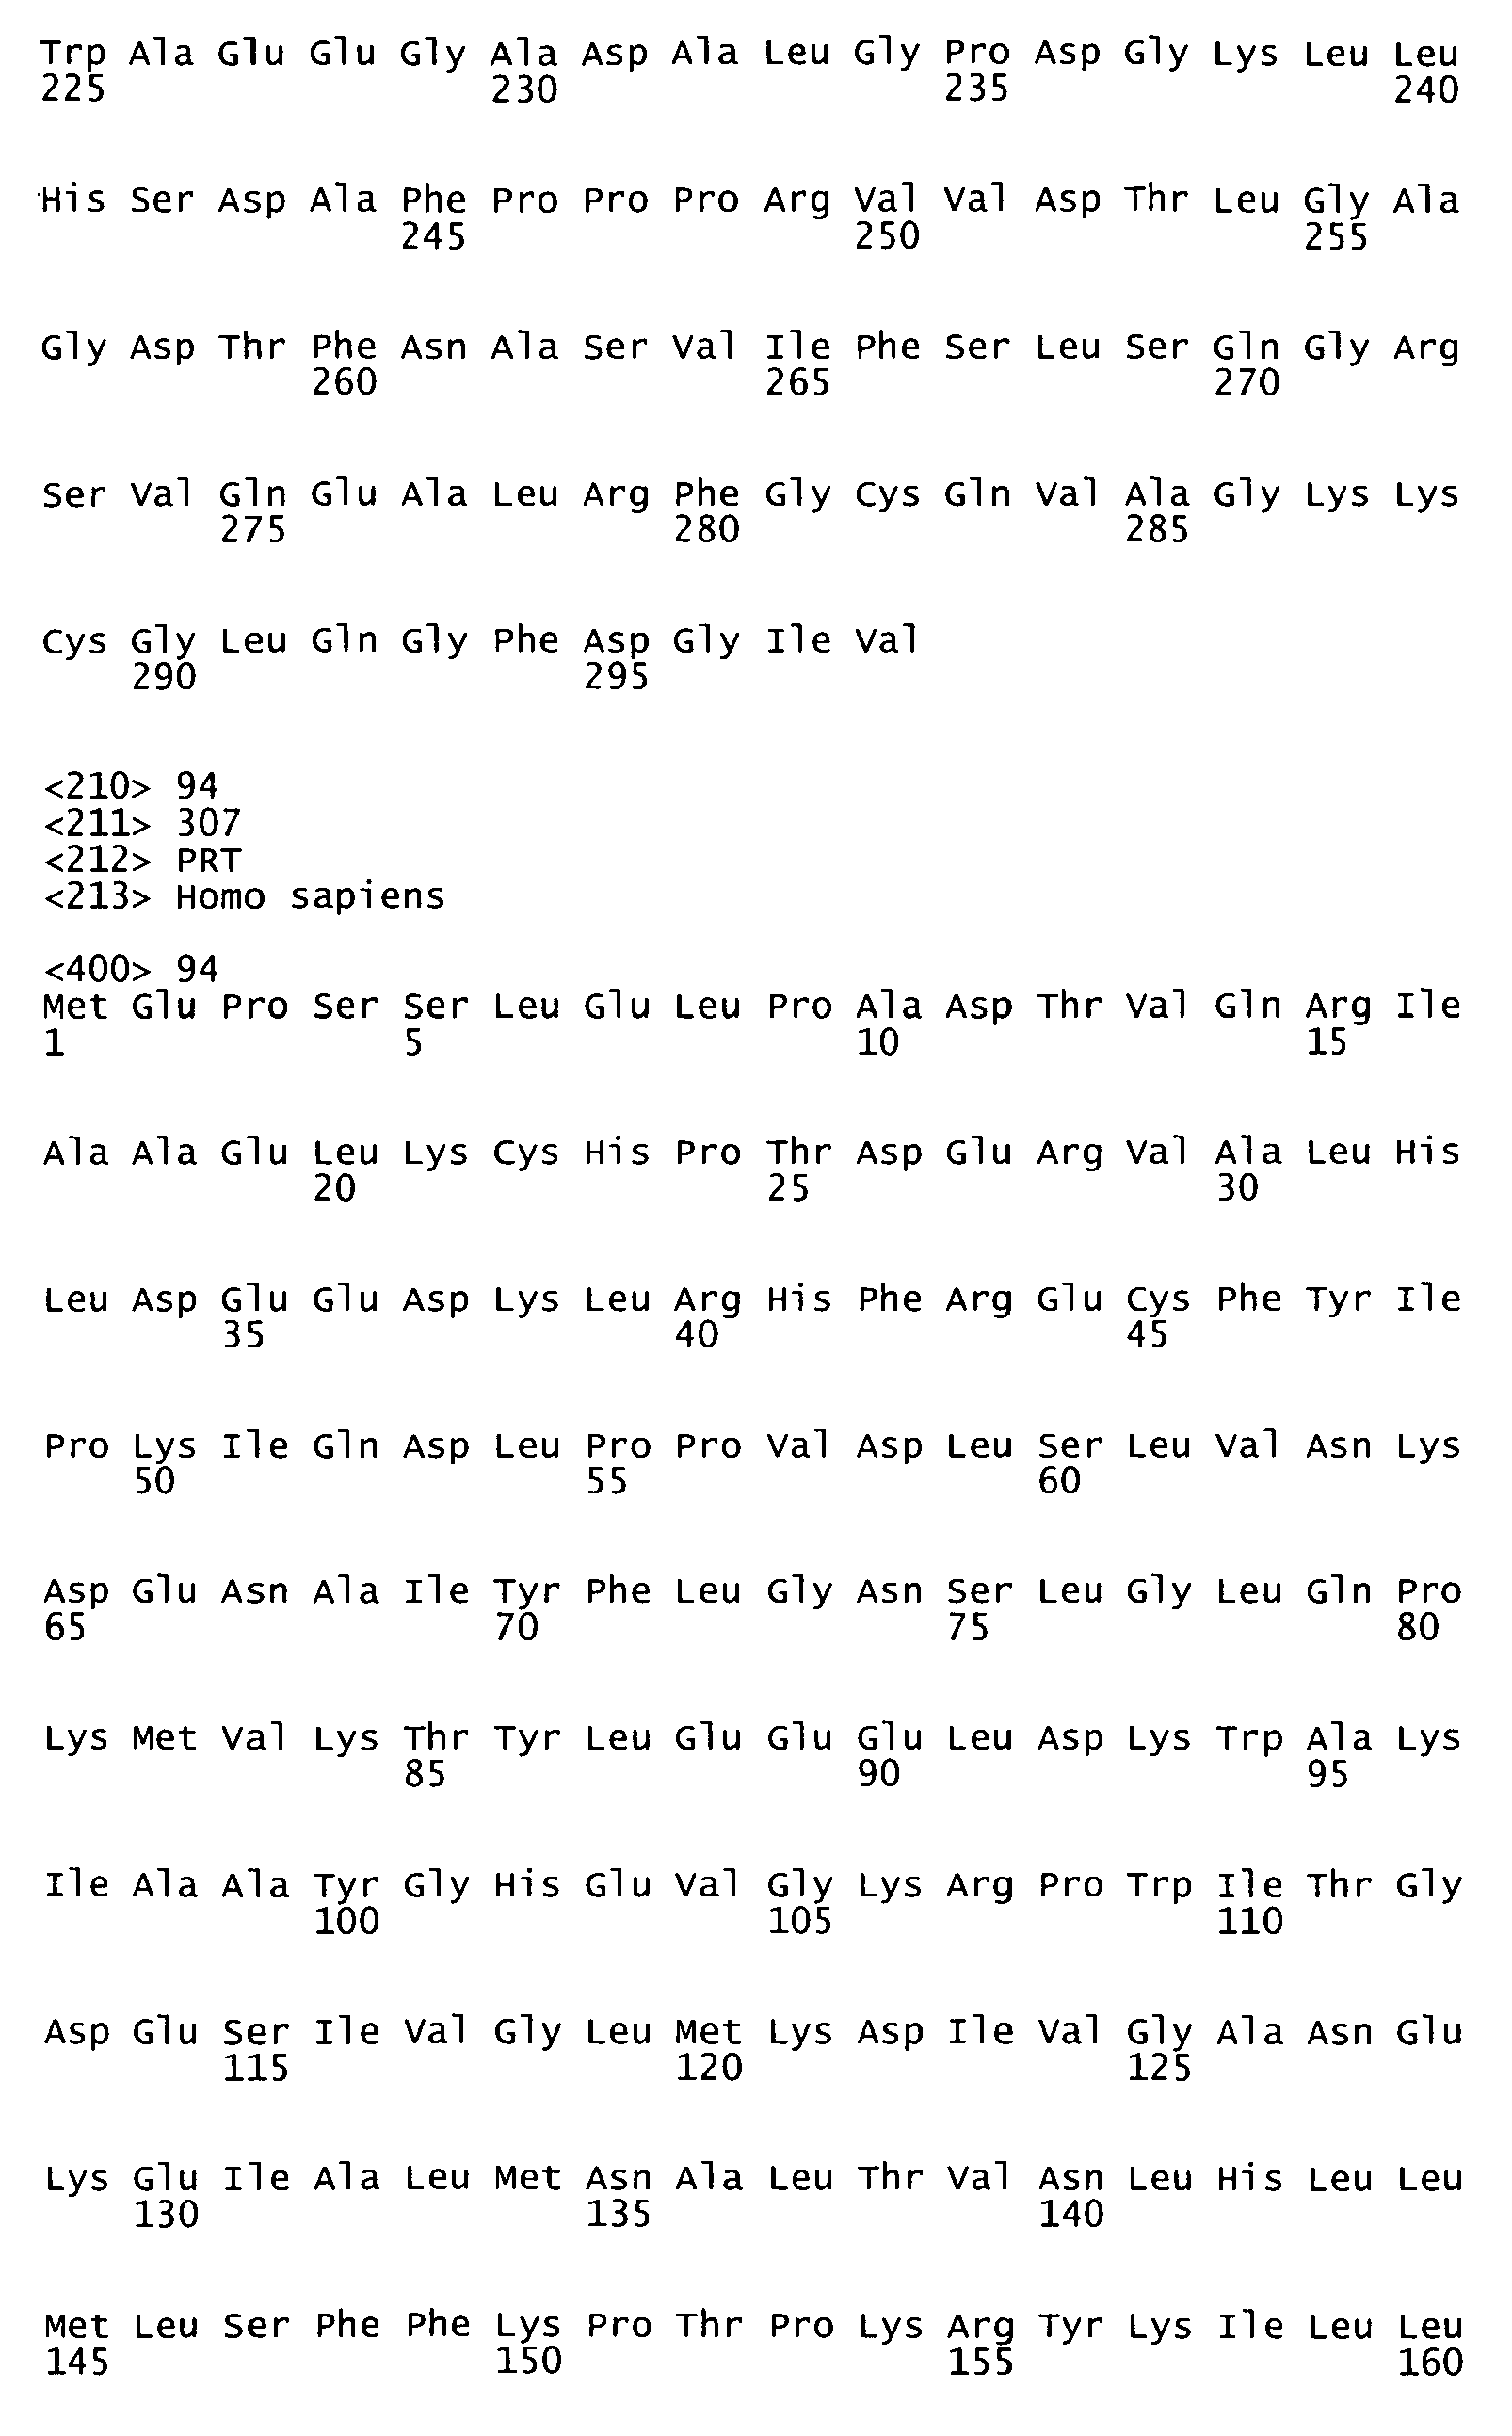


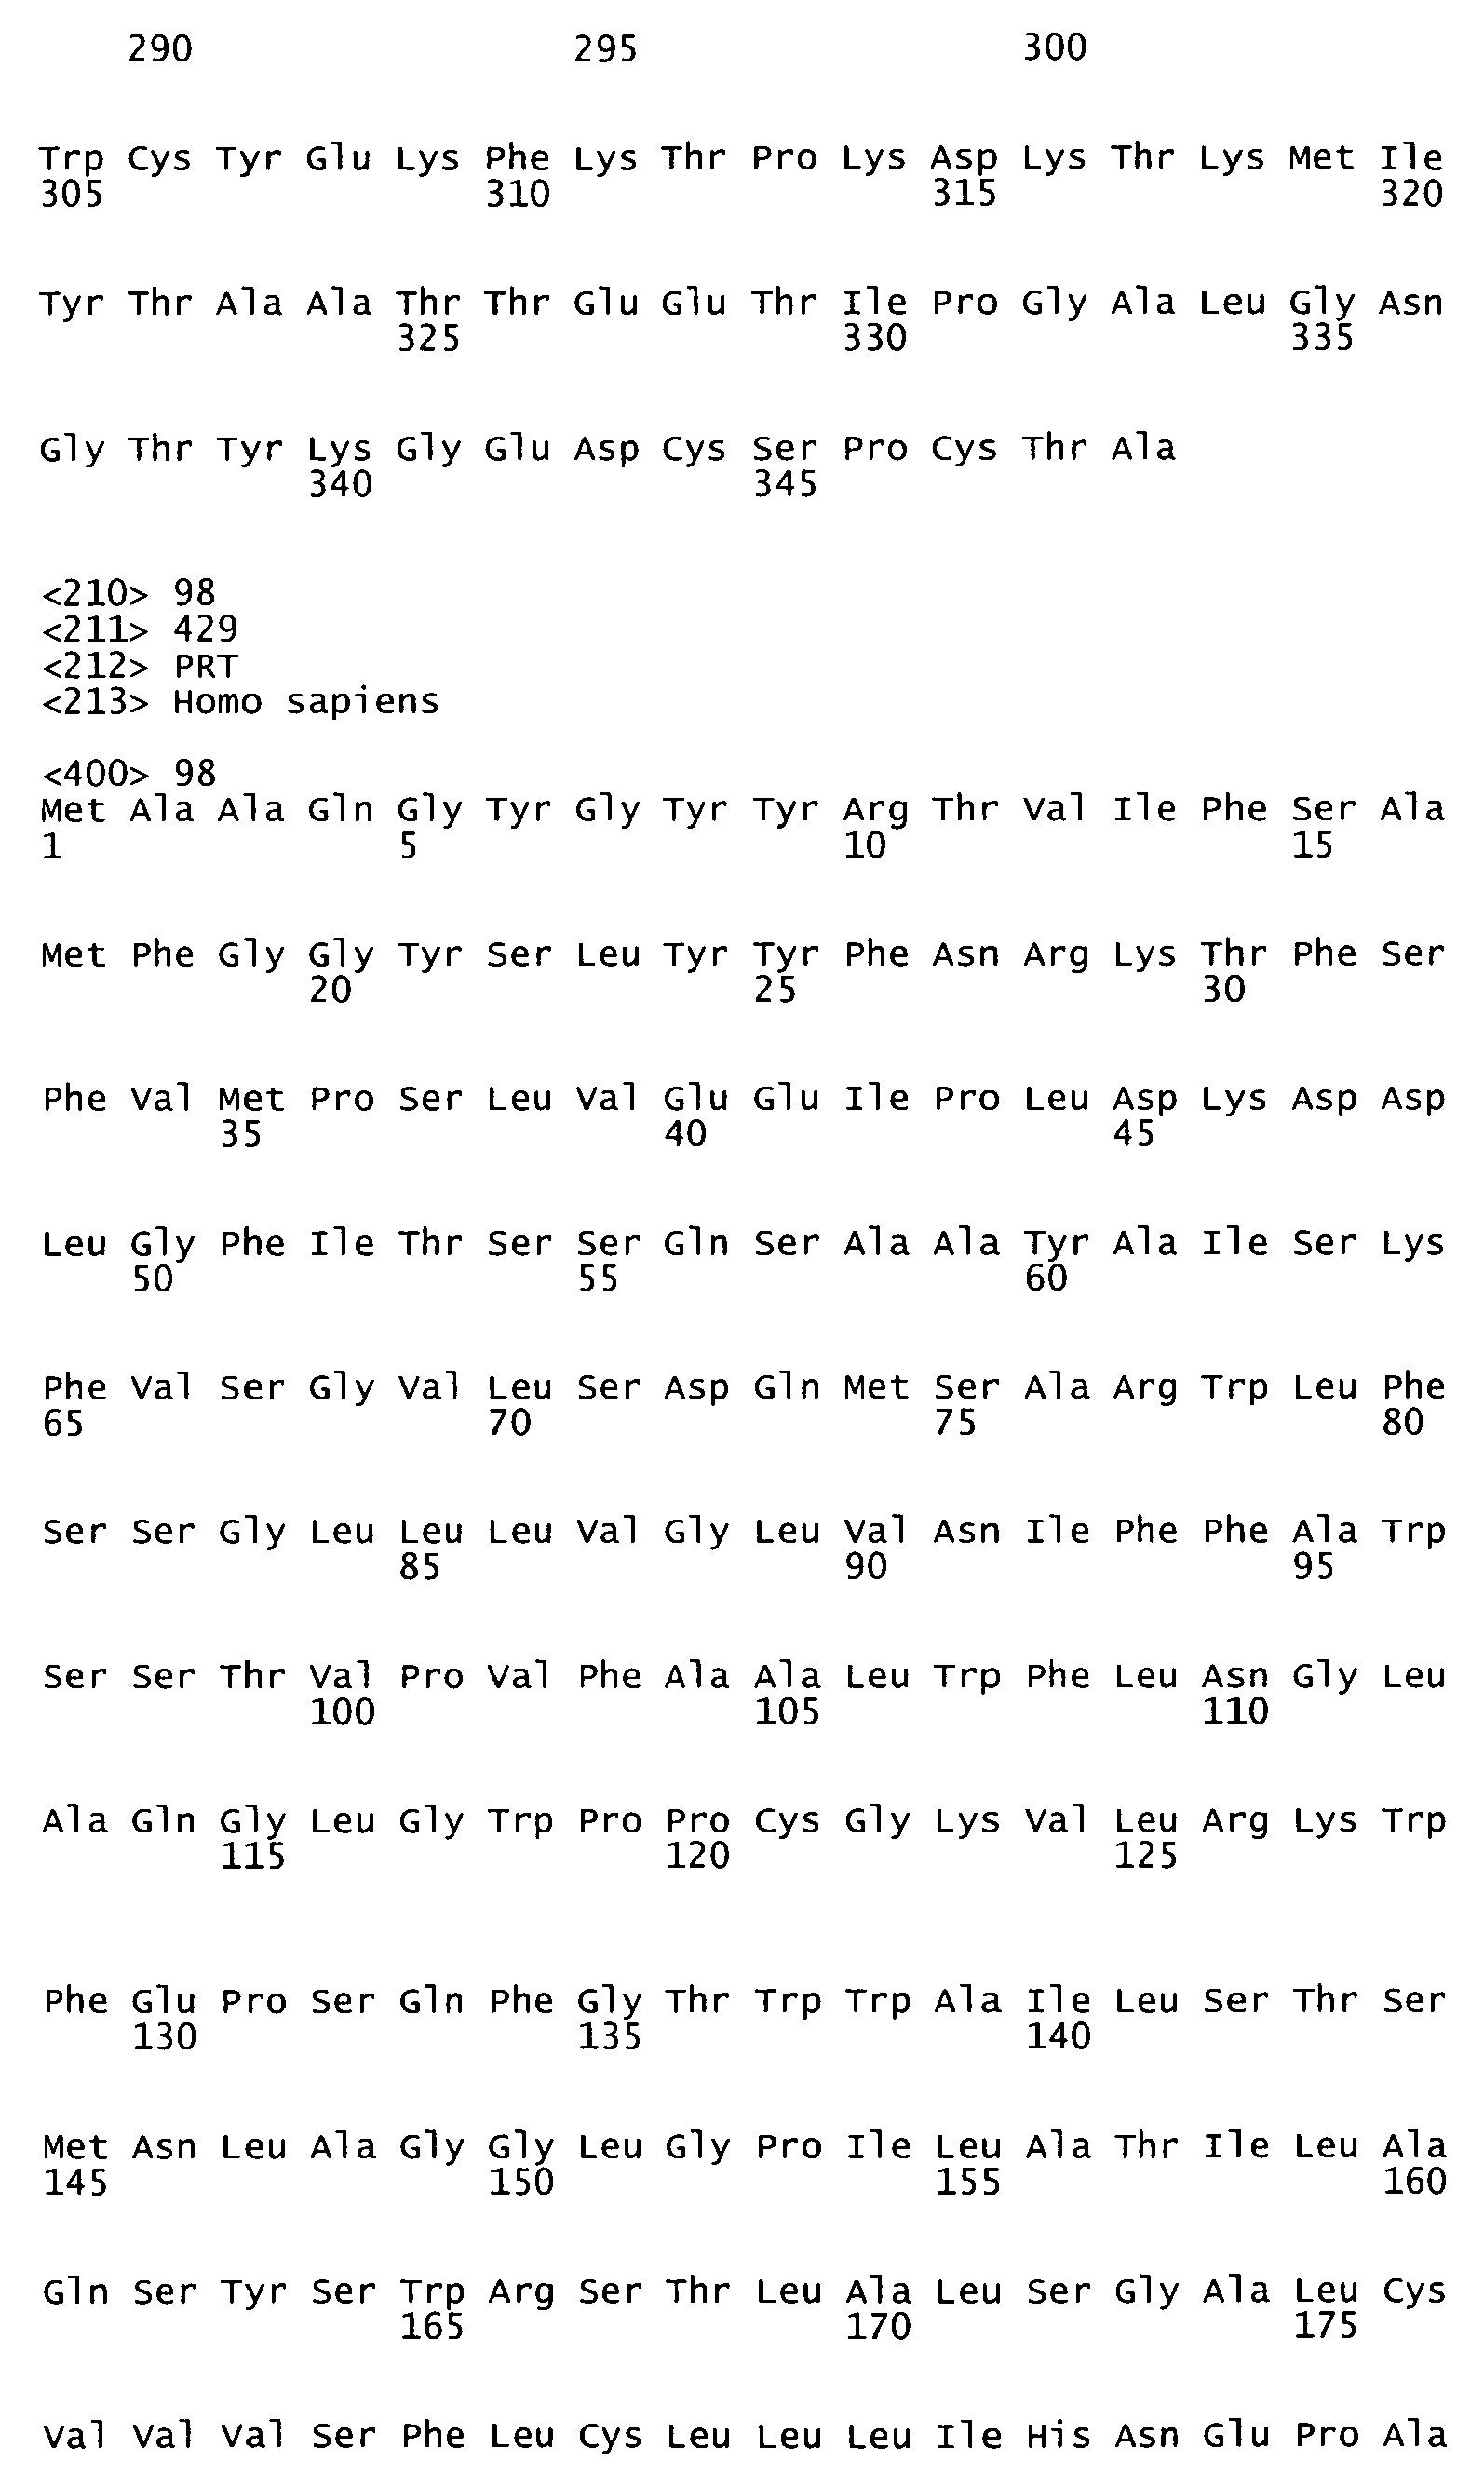


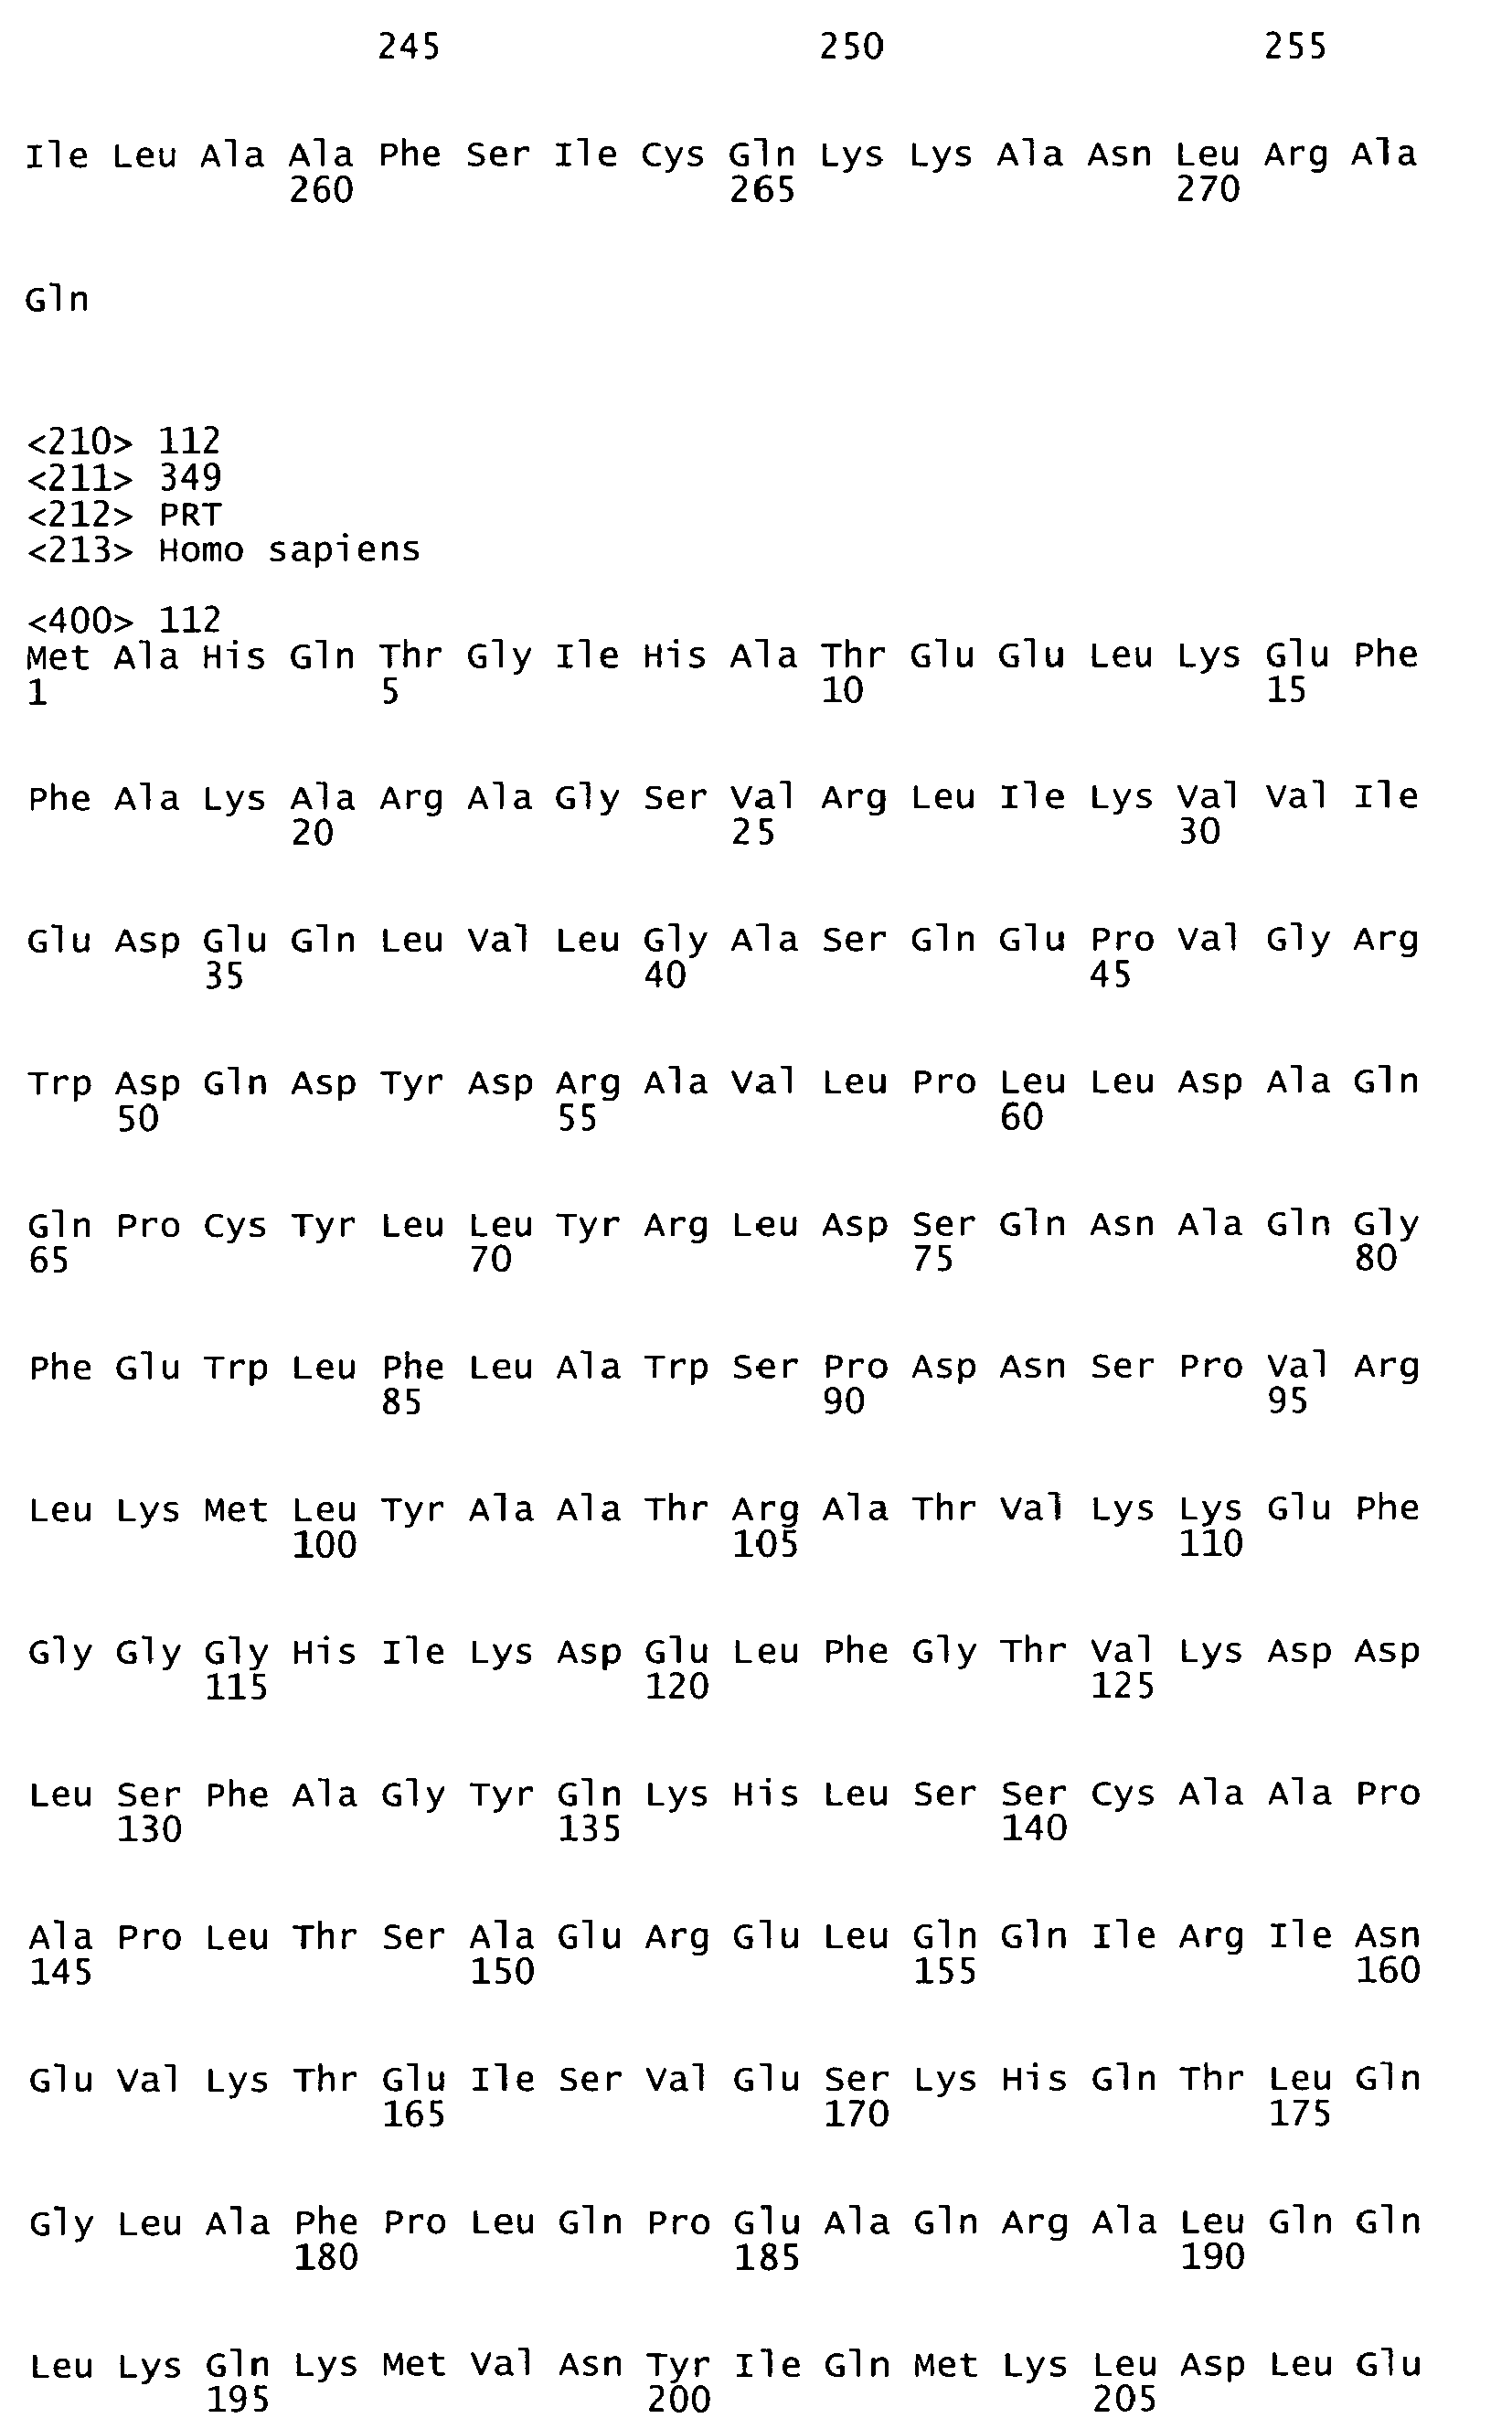


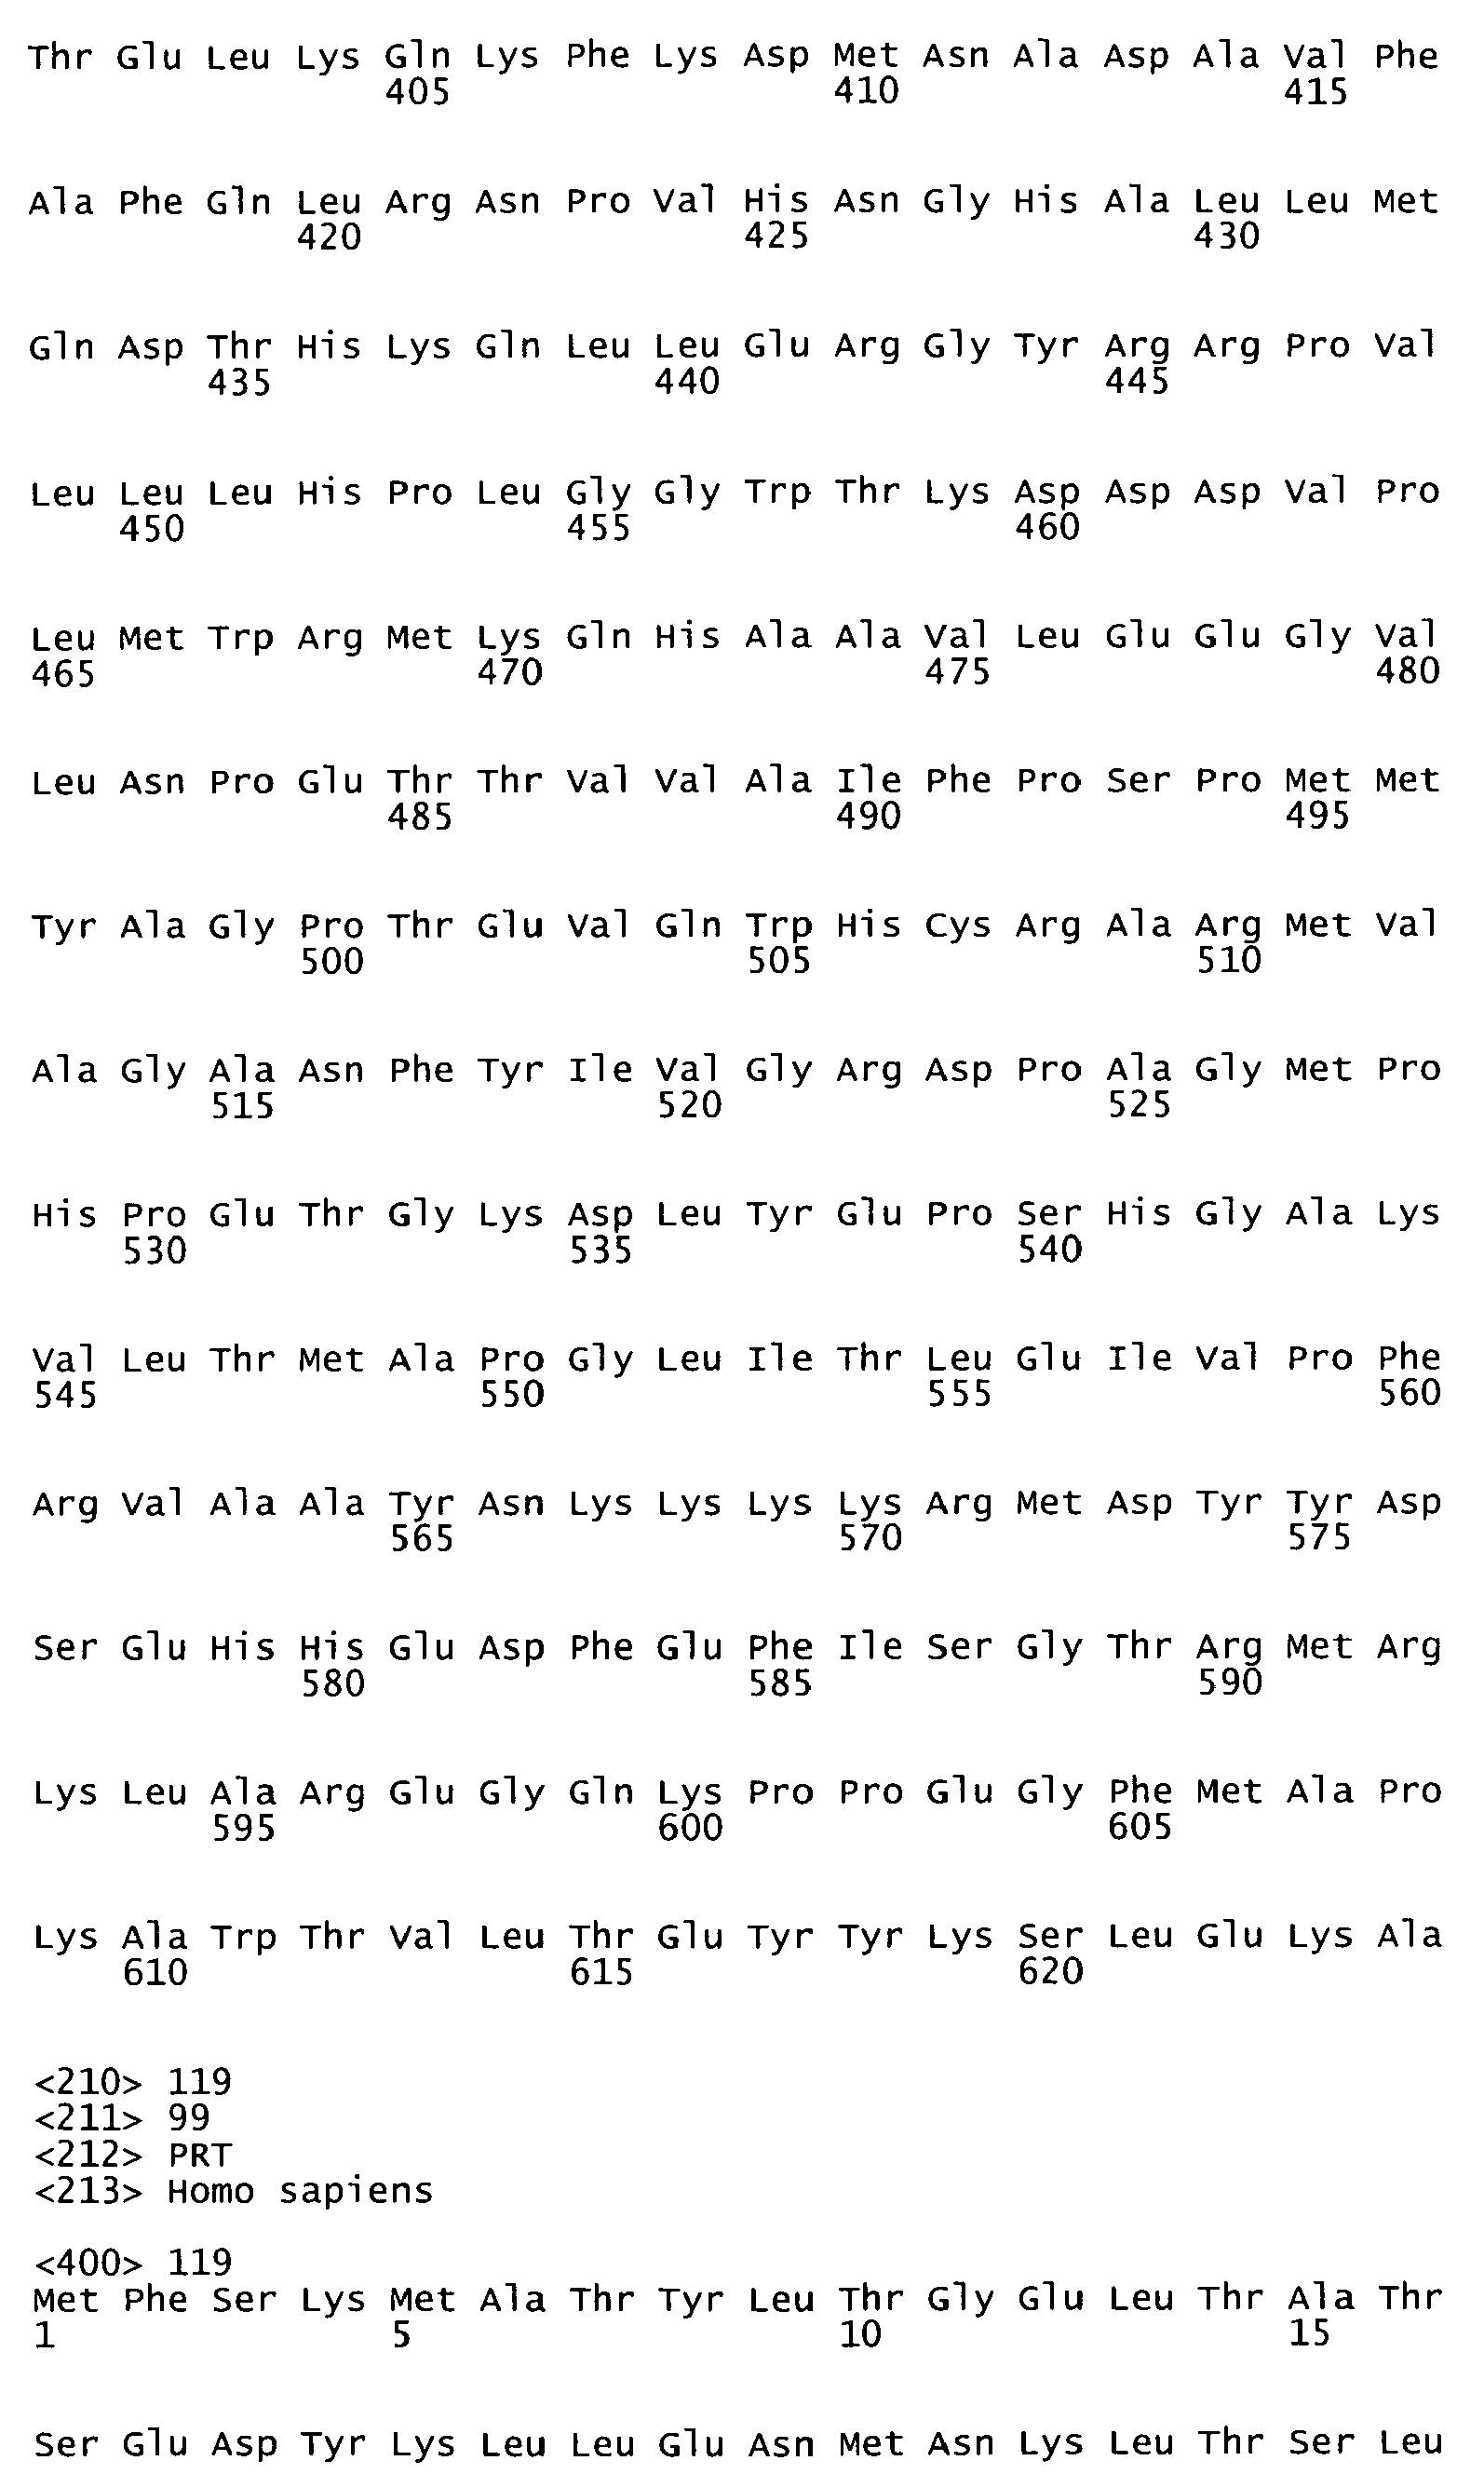


Claims (19)
- An in vitro method for detecting liver fibrosis and/or cirrhosis comprising:assaying a biological sample from a patient for differential expression of at least one gene encoding a protein chosen from SEQ ID NO: 1 - SEQ ID NO: 63 and human orthologs thereof;wherein the differential expression of at least one gene suggests the presence of liver fibrosis and/or cirrhosis.
- The method of claim 1, wherein the human orthologs comprise at least one gene encoding a protein chosen from SEQ ID NO: 64 - SEQ ID NO: 120.
- The method of claim 1, wherein increased expression of at least one gene encoding a protein chosen from SEQ ID NO: 7 - SEQ ID NO: 23 and SEQ ID NO: 42 - SEQ ID NO: 63 and human orthologs thereof suggests the presence of liver fibrosis and/or cirrhosis.
- The method of claim 2, wherein increased expression of at least one gene encoding a protein chosen from SEQ ID NO: 68 - SEQ ID NO: 82 and SEQ ID NO: 100 - SEQ ID NO: 120 suggests the presence of liver fibrosis and/or cirrhosis.
- The method of claim 1, wherein decreased expression of at least one gene encoding a protein chosen from SEQ ID NO: 1 - SEQ ID NO: 6 and SEQ ID NO: 24 - SEQ ID NO: 41 and human orthologs thereof suggests the presence of liver fibrosis and/or cirrhosis.
- The method of claim 2, wherein decreased expression of at least one gene encoding a protein chosen from SEQ ID NO: 64 - SEQ ID NO: 67 and SEQ ID NO: 83 - SEQ ID NO: 99 suggests the presence of liver fibrosis and/or cirrhosis.
- An in vitro method for detecting liver fibrosis and/or cirrhosis comprising:assaying a biological sample from a patient for differential expression of at least one gene encoding a protein from a sequence comprising SEQ ID NO: 1 to SEQ ID NO: 120;wherein the differential expression of at least one gene suggests the presence of liver fibrosis and/or cirrhosis.
- The method of claim 7, wherein the differentially expressed gene encodes a protein that functions in cancer, cell cycle and cell morphology chosen from a sequence comprising SEQ ID NO: 9, SEQ ID NO: 69, SEQ ID NO: 12, SEQ ID NO: 72, SEQ ID NO: 4, SEQ ID NO: 65, SEQ ID NO: 17, SEQ ID NO: 76, SEQ ID NO: 7, SEQ ID NO: 68, SEQ ID NO: 19, SEQ ID NO: 78, SEQ ID NO: 5, SEQ ID NO: 66, SEQ ID NO: 20, SEQ ID NO: 79, SEQ ID NO: 22, SEQ ID NO: 81, SEQ ID NO: 21, and SEQ ID NO: 80.
- The method of claim 7, wherein the differentially expressed gene encodes a protein that functions in lipid metabolism, small molecule biochemistry, organismal injury and abnormalities chosen from a sequence comprising SEQ ID NO: 10, SEQ ID NO: 70, SEQ ID NO: 3, SEQ ID NO: 64, SEQ ID NO: 14, SEQ ID NO: 73, SEQ ID NO: 15 and SEQ ID NO: 74.
- The method of claim 7, wherein the differentially expressed gene encodes a protein that functions in hematological disease, endocrine system development and function, and nervous system development and function comprising SEQ ID NO: 13.
- The method of claim 7, wherein the differentially expressed gene encodes a protein that functions in cancer, cell morphology, dermatological diseases and conditions chosen from sequences comprising SEQ ID NO: 8, SEQ ID NO: 44, SEQ ID NO: 102, SEQ ID NO: 45, SEQ ID NO: 103, SEQ ID NO: 48, SEQ ID NO: 106, SEQ ID NO: 31, SEQ ID NO: 90, SEQ ID NO: 35, SEQ ID NO: 93, SEQ ID NO: 50, SEQ ID NO: 108, SEQ ID NO: 51, SEQ ID NO: 109, SEQ ID NO: 40, and SEQ ID NO: 98.
- The method of claim 7, wherein the differentially expressed gene encodes a protein that functions in lipid metabolism, small molecule biochemistry, molecular transport chosen from sequences comprising SEQ ID NO: 25, SEQ ID NO: 84, SEQ ID NO: 42, SEQ ID NO: 100, SEQ ID NO: 27, SEQ ID NO: 86, SEQ ID NO: 47, SEQ ID NO: 105, SEQ ID NO: 36, SEQ ID NO: 94, SEQ ID NO: 53, SEQ ID NO: 111, SEQ ID NO: 37, SEQ ID NO: 95, SEQ ID NO: 38, SEQ ID NO: 96, and SEQ ID NO: 107.
- The method of claim 7, wherein the differentially expressed gene encodes a protein that functions in cancer, cellular movement, cellular growth and proliferation chosen from sequences comprising SEQ ID NO: 59, SEQ ID NO: 117, SEQ ID NO: 46, SEQ ID NO: 104, SEQ ID NO: 30, SEQ ID NO: 89, SEQ ID NO: 52, SEQ ID NO: 110, SEQ ID NO: 58, SEQ ID NO: 116, SEQ ID NO: 55, SEQ ID NO: 113, SEQ ID NO: 39, SEQ ID NO: 97, SEQ ID NO: 56, SEQ ID NO: 114, SEQ ID NO: 57, and SEQ ID NO: 115.
- A method of identifying a compound that decreases the differential expression of at least one gene encoding a protein chosen from SEQ ID NO: 7 - SEQ ID NO: 23 and SEQ ID NO: 42 - SEQ ID NO: 63 and human orthologs thereof comprising:providing a cell expressing at least one gene encoding a protein chosen from SEQ ID NO: 7 - SEQ ID NO: 23 and SEQ ID NO: 42 - SEQ ID NO: 63 and human orthologs thereof;contacting the cell with a test compound; anddetermining whether the differential expression of the at least one gene is decreased in the presence of the test compound, wherein the decreased differential expression is an indication of halting or reversing liver fibrosis and/or cirrhosis.
- A method of identifying a compound that increases the differential expression of at least one gene encoding a protein chosen from SEQ ID NO: 1 - SEQ ID NO: 6, and SEQ ID NO: 24 - SEQ ID NO: 41 and human orthologs thereof comprising:providing a cell expressing at least one gene encoding a protein chosen from SEQ ID NO: 1 - SEQ ID NO: 6 and SEQ ID NO: 24 - SEQ ID NO: 41 and human orthologs thereof;contacting the cell with a test compound; anddetermining whether the differential expression of the at least one gene is increased in the presence of the test compound, wherein the increased differential expression is an indication of halting or reversing liver fibrosis and/or cirrhosis.
- An in virto method of diagnosing liver fibrosis and/or cirrhosis comprising:determining an amount of at least one protein chosen from SEQ ID NO: 1 to SEQ ID NO: 120 in a first biological sample from a first subject without liver fibrosis and/or cirrhosis and in a second biological sample from a second subject known or suspected of having liver fibrosis and/or cirrhosis;wherein a difference between the amount of said protein present in the first biological sample from said first subject and the amount of said protein present in the second biological sample from said second subject indicates that the second subject has liver fibrosis and/or cirrhosis.
- The method of claim 16, wherein the amount of at least one protein is determined by Western blot or ELISA.
- The method of claim 17, wherein the at least one protein is chosen from SEQ ID NO: 1 to SEQ ID NO: 63.
- The method of claim 17, wherein the at least one protein is chosen from SEQ ID NO: 64 to SEQ ID NO: 120.
Applications Claiming Priority (1)
| Application Number | Priority Date | Filing Date | Title |
|---|---|---|---|
| US76195906P | 2006-01-24 | 2006-01-24 |
Publications (1)
| Publication Number | Publication Date |
|---|---|
| EP1811041A1 true EP1811041A1 (en) | 2007-07-25 |
Family
ID=37913995
Family Applications (1)
| Application Number | Title | Priority Date | Filing Date |
|---|---|---|---|
| EP07001462A Ceased EP1811041A1 (en) | 2006-01-24 | 2007-01-24 | Biomarkers for liver fibrotic injury |
Country Status (5)
| Country | Link |
|---|---|
| US (1) | US7972785B2 (en) |
| EP (1) | EP1811041A1 (en) |
| JP (1) | JP4297942B2 (en) |
| SG (1) | SG134283A1 (en) |
| TW (1) | TW200745556A (en) |
Cited By (9)
| Publication number | Priority date | Publication date | Assignee | Title |
|---|---|---|---|---|
| WO2010079253A2 (en) | 2009-01-09 | 2010-07-15 | Proyecto De Biomedicina Cima, S.L. | Bio-markers for diagnosing fibrosis |
| WO2011152503A1 (en) | 2010-06-02 | 2011-12-08 | 大日本住友製薬株式会社 | Treatment drug for autoimmune diseases and allergic diseases |
| CN102401831A (en) * | 2011-11-14 | 2012-04-04 | 北京正旦国际科技有限责任公司 | Competitive enzyme-linked immunoassay kit for liver cirrhosis and detection method thereof |
| EP2437065A3 (en) * | 2006-08-10 | 2012-08-29 | Barbara Sitek | Biomarker for liver inflammation |
| WO2012054870A3 (en) * | 2010-10-21 | 2013-01-10 | Vertex Pharmaceuticals Incorporated | Biomarkers for hcv infected patients |
| US8916152B2 (en) | 2010-06-14 | 2014-12-23 | Lykera Biomed Sa | S100A4 antibodies and therapeutic uses thereof |
| EP2993475A4 (en) * | 2013-04-30 | 2016-12-21 | Fundación Pública Andaluza Progreso Y Salud | METHOD OF OBTAINING DATA IN THE DIFFERENTIAL DIAGNOSIS OF HEPATIC FIBROSIS |
| CN112143720A (en) * | 2020-11-04 | 2020-12-29 | 河南师范大学 | Blood diagnostic marker CBR1 of idiopathic pulmonary fibrosis and its application in the preparation of diagnostic or prognostic tools |
| CN114790233A (en) * | 2022-04-19 | 2022-07-26 | 浙江大学 | Application of Optineurin in preparation of drugs for diagnosing and treating liver cirrhosis |
Families Citing this family (24)
| Publication number | Priority date | Publication date | Assignee | Title |
|---|---|---|---|---|
| US8193328B2 (en) * | 2005-09-08 | 2012-06-05 | Philadelphia Health & Education Corporation | Identification of modulators of serine protease inhibitor Kazal and their use as anti-cancer and anti-viral agents |
| ES2402142T3 (en) * | 2007-11-02 | 2013-04-29 | Metabolon, Inc. | Biomarkers for fatty liver disease and methods that use them |
| BRPI0919881B1 (en) * | 2008-10-31 | 2021-09-08 | Centocor Ortho Biotech Inc | FRAMEWORK PROTEIN AND ITS GENERATION METHOD, LIBRARY AND ITS CONSTRUCTION METHOD, NUCLEIC ACID MOLECULE, NUCLEIC ACID VECTOR, HOST CELL, COMPOSITION, MEDICAL DEVICE AND MANUFACTURING ARTICLE |
| US9051614B2 (en) | 2009-09-11 | 2015-06-09 | The Chinese University Of Hong Kong | Methods for assessing liver pathologies |
| JP5997134B2 (en) | 2010-04-30 | 2016-09-28 | ヤンセン バイオテツク,インコーポレーテツド | Stable fibronectin domain compositions, methods and uses |
| EP2727520B1 (en) * | 2011-06-29 | 2019-08-21 | Inner Mongolia Furui Medical Science Co., Ltd | Hepatic fibrosis detection apparatus and system |
| BR112014007469B1 (en) | 2011-09-27 | 2022-06-14 | Janssen Biotech, Inc | MANUFACTURING METHOD OF A LIBRARY OF TYPE III FIBRONECTIN MODULE DOMAINS (FN3), LIBRARY AND METHOD TO OBTAIN A PROTEIN FRAMEWORK |
| US20130225428A1 (en) * | 2011-11-30 | 2013-08-29 | Institute For Systems Biology | Liver disease markers |
| US9714284B2 (en) | 2013-07-16 | 2017-07-25 | National Health Research Institutes | Antibodies and method for determining deletions in HBV pre-S2 region |
| CN108271358A (en) * | 2014-12-10 | 2018-07-10 | 财团法人卫生研究院 | Antibody for determining deletion in pre-S2 region of HBV virus and method thereof |
| US20170168055A1 (en) * | 2015-12-11 | 2017-06-15 | Expression Pathology, Inc. | SRM/MRM Assays |
| AU2017217688B2 (en) | 2016-02-10 | 2023-01-19 | Wake Forest University Health Sciences | Model system of liver fibrosis and method of making and using the same |
| EP3432879B1 (en) | 2016-03-22 | 2021-01-06 | Mayo Foundation for Medical Education and Research | Using fatty acid synthase inhibitors to treat fibrosis |
| WO2017210147A1 (en) * | 2016-05-29 | 2017-12-07 | Wei Jia | Liver disease-related biomarkers and methods of use thereof |
| WO2018026442A1 (en) * | 2016-08-01 | 2018-02-08 | The Regents Of The University Of California | Small molecule inhibition for preventing or treating fibrotic diseases |
| EP3554561B1 (en) | 2016-12-14 | 2023-06-28 | Janssen Biotech, Inc. | Cd137 binding fibronectin type iii domains |
| EP3554535A4 (en) | 2016-12-14 | 2020-10-21 | Janssen Biotech, Inc. | Pd-l1 binding fibronectin type iii domains |
| BR112019012154A2 (en) | 2016-12-14 | 2019-11-12 | Janssen Biotech, Inc. | cd8a-binding fibronectin type iii domains |
| US20200245929A1 (en) * | 2017-01-31 | 2020-08-06 | Medical Photonics Co., Ltd. | Lipid measuring apparatus and lipid measuring method |
| US12491255B2 (en) | 2019-10-14 | 2025-12-09 | Aro Biotherapeutics Company | EPCAM binding fibronectin type III domains |
| US11781138B2 (en) | 2019-10-14 | 2023-10-10 | Aro Biotherapeutics Company | FN3 domain-siRNA conjugates and uses thereof |
| WO2021076546A1 (en) | 2019-10-14 | 2021-04-22 | Aro Biotherapeutics Company | Cd71 binding fibronectin type iii domains |
| US12239710B2 (en) | 2021-04-14 | 2025-03-04 | Aro Biotherapeutics Company | FN3 domain-siRNA conjugates and uses thereof |
| IL307582A (en) | 2021-04-14 | 2023-12-01 | Aro Biotherapeutics Company | Cd71 binding fibronectin type iii domains |
Citations (1)
| Publication number | Priority date | Publication date | Assignee | Title |
|---|---|---|---|---|
| EP1150123A1 (en) * | 2000-04-28 | 2001-10-31 | Bayer Aktiengesellschaft | Diagnosis of liver fibrosis with serum marker algorithms |
Family Cites Families (2)
| Publication number | Priority date | Publication date | Assignee | Title |
|---|---|---|---|---|
| US6156501A (en) | 1993-10-26 | 2000-12-05 | Affymetrix, Inc. | Arrays of modified nucleic acid probes and methods of use |
| US7645584B2 (en) * | 2005-04-01 | 2010-01-12 | University Of Florida Research Foundation, Inc. | Biomarkers of liver injury |
-
2007
- 2007-01-23 SG SG200700524-2A patent/SG134283A1/en unknown
- 2007-01-23 US US11/656,389 patent/US7972785B2/en not_active Expired - Fee Related
- 2007-01-23 TW TW096102455A patent/TW200745556A/en unknown
- 2007-01-24 JP JP2007014253A patent/JP4297942B2/en not_active Expired - Fee Related
- 2007-01-24 EP EP07001462A patent/EP1811041A1/en not_active Ceased
Patent Citations (1)
| Publication number | Priority date | Publication date | Assignee | Title |
|---|---|---|---|---|
| EP1150123A1 (en) * | 2000-04-28 | 2001-10-31 | Bayer Aktiengesellschaft | Diagnosis of liver fibrosis with serum marker algorithms |
Non-Patent Citations (7)
| Title |
|---|
| ALA-KOKKO L ET AL: "Gene expression of type I, III and IV collagens in hepatic fibrosis induced by dimethylnitrosamine in the rat.", THE BIOCHEMICAL JOURNAL 15 MAY 1987, vol. 244, no. 1, 15 May 1987 (1987-05-15), pages 75 - 79, XP002430226, ISSN: 0264-6021 * |
| EUROPEAN LIVER FIBROSIS GROUP ROSENBERG ET AL: "Serum markers detect the presence of liver fibrosis: A cohort study", GASTROENTEROLOGY, ELSEVIER, PHILADELPHIA, PA, US, vol. 127, no. 6, December 2004 (2004-12-01), pages 1704 - 1713, XP005313171, ISSN: 0016-5085 * |
| HSU YI-CHAO ET AL: "Increases in fibrosis-related gene transcripts in livers of dimethylnitrosamine-intoxicated rats.", JOURNAL OF BIOMEDICAL SCIENCE 2004 MAY-JUN, vol. 11, no. 3, May 2004 (2004-05-01), pages 408 - 417, XP002430227, ISSN: 1021-7770 * |
| IMAOKA SUSUMU ET AL: "Localization of rat cytochrome P450 in various tissues and comparison of arachidonic acid metabolism by rat P450 with that by human P450 orthologs.", DRUG METABOLISM AND PHARMACOKINETICS DEC 2005, vol. 20, no. 6, December 2005 (2005-12-01), pages 478 - 484, XP002430229, ISSN: 1347-4367 * |
| SHACKEL NICHOLAS A ET AL: "Gene array analysis and the liver.", HEPATOLOGY (BALTIMORE, MD.) DEC 2002, vol. 36, no. 6, December 2002 (2002-12-01), pages 1313 - 1325, XP002430228, ISSN: 0270-9139 * |
| UTSUNOMIYA T ET AL: "A gene-expression signature can quantify the degree of hepatic fibrosis in the rat", JOURNAL OF HEPATOLOGY, MUNKSGAARD INTERNATIONAL PUBLISHERS, COPENHAGEN, DK, vol. 41, no. 3, September 2004 (2004-09-01), pages 399 - 406, XP004542796, ISSN: 0168-8278 * |
| WONG V S ET AL: "Serum hyaluronic acid is a useful marker of liver fibrosis in chronic hepatitis C virus infection.", JOURNAL OF VIRAL HEPATITIS MAY 1998, vol. 5, no. 3, May 1998 (1998-05-01), pages 187 - 192, XP002430230, ISSN: 1352-0504 * |
Cited By (14)
| Publication number | Priority date | Publication date | Assignee | Title |
|---|---|---|---|---|
| EP2437065A3 (en) * | 2006-08-10 | 2012-08-29 | Barbara Sitek | Biomarker for liver inflammation |
| US8535896B2 (en) | 2006-08-10 | 2013-09-17 | Wolff Schmiegel | Biomarkers for inflammation of the liver |
| WO2010079253A2 (en) | 2009-01-09 | 2010-07-15 | Proyecto De Biomedicina Cima, S.L. | Bio-markers for diagnosing fibrosis |
| WO2011152503A1 (en) | 2010-06-02 | 2011-12-08 | 大日本住友製薬株式会社 | Treatment drug for autoimmune diseases and allergic diseases |
| US8858944B2 (en) | 2010-06-02 | 2014-10-14 | Sumitomo Dainippon Pharma Co., Ltd. | Treatment drug for autoimmune diseases and allergic diseases |
| US8916152B2 (en) | 2010-06-14 | 2014-12-23 | Lykera Biomed Sa | S100A4 antibodies and therapeutic uses thereof |
| US9657092B2 (en) | 2010-06-14 | 2017-05-23 | Jose Luis Hernandez Miguez | S100A4 antibodies and therapeutic uses thereof |
| WO2012054870A3 (en) * | 2010-10-21 | 2013-01-10 | Vertex Pharmaceuticals Incorporated | Biomarkers for hcv infected patients |
| CN102401831B (en) * | 2011-11-14 | 2013-10-30 | 北京正旦国际科技有限责任公司 | Competitive enzyme-linked immunosorbent assay kit for liver cirrhosis and assay method therefor |
| CN102401831A (en) * | 2011-11-14 | 2012-04-04 | 北京正旦国际科技有限责任公司 | Competitive enzyme-linked immunoassay kit for liver cirrhosis and detection method thereof |
| EP2993475A4 (en) * | 2013-04-30 | 2016-12-21 | Fundación Pública Andaluza Progreso Y Salud | METHOD OF OBTAINING DATA IN THE DIFFERENTIAL DIAGNOSIS OF HEPATIC FIBROSIS |
| CN112143720A (en) * | 2020-11-04 | 2020-12-29 | 河南师范大学 | Blood diagnostic marker CBR1 of idiopathic pulmonary fibrosis and its application in the preparation of diagnostic or prognostic tools |
| CN114790233A (en) * | 2022-04-19 | 2022-07-26 | 浙江大学 | Application of Optineurin in preparation of drugs for diagnosing and treating liver cirrhosis |
| CN114790233B (en) * | 2022-04-19 | 2024-03-22 | 浙江大学 | Application of Optineurin in preparation of medicines for diagnosing and treating liver cirrhosis |
Also Published As
| Publication number | Publication date |
|---|---|
| US20070184476A1 (en) | 2007-08-09 |
| JP4297942B2 (en) | 2009-07-15 |
| SG134283A1 (en) | 2007-08-29 |
| TW200745556A (en) | 2007-12-16 |
| JP2007252366A (en) | 2007-10-04 |
| US7972785B2 (en) | 2011-07-05 |
Similar Documents
| Publication | Publication Date | Title |
|---|---|---|
| US7972785B2 (en) | Biomarkers for liver fibrotic injury | |
| Barratt et al. | Urine proteomics: the present and future of measuring urinary protein components in disease | |
| EP2333116B1 (en) | Markers of renal transplant rejection and renal damage | |
| KR101032607B1 (en) | Protein marker for diagnosing liver cancer | |
| KR101788414B1 (en) | Biomarker for diagnosis of liver cancer and use thereof | |
| US8039227B2 (en) | Peptide biomarkers predictive of renal function decline and kidney disease | |
| US10345309B2 (en) | Biomarkers for gastric cancer and uses thereof | |
| EP4045912A1 (en) | Apparatuses and methods for detection of pancreatic cancer | |
| US20180238890A1 (en) | Methods and materials for detection, diagnosis and management of ovarian cancer | |
| US8790869B2 (en) | Renal cell carcinoma biomarkers | |
| WO2008074029A2 (en) | Protein profile for osteoarthritis | |
| CN101353696A (en) | Biomarkers of liver fiber damage including liver fibrosis and/or cirrhosis and methods of detecting the same | |
| Su et al. | Global gene expression profiling of dimethylnitrosamine-induced liver fibrosis: from pathological and biochemical data to microarray analysis | |
| EP2286226A2 (en) | Serum markers for type ii diabetes mellitus | |
| US20160169901A1 (en) | Methods for diagnosis of cutaneous t-cell lymphoma | |
| WO2013022789A2 (en) | Compositions and methods for assessing and determining the presence of liver cancer in a mammalian subject | |
| US20020072492A1 (en) | Non-genetic based protein disease markers | |
| KR101859812B1 (en) | Biomarkers to predict TACE treatment efficacy for hepatocellular carcinoma | |
| US20200309780A1 (en) | Plasma biomarker for ovarian cancer | |
| CN113999911A (en) | Product for predicting sensitivity of melanoma immunotherapy drug and application thereof | |
| CN113981092A (en) | Biomarkers for predicting tumor drug sensitivity and related products | |
| US20250116676A1 (en) | Phosphopeptide/phosphoprotein signature predicting basal-like breast cancer recurrence | |
| Di Tommaso et al. | Quantitative enrichment of amyloid precursors refines mass spectrometry-based amyloidosis diagnosis | |
| KR20260070871A (en) | Biomarker composition for early hepatocellular carcinoma diagnosis comprising FBP2 or TCEAL5 | |
| KR20260043982A (en) | Biomarker for identifying histopathological subtypes and predicting prognosis of lung adenocarcinoma, and uses thereof |
Legal Events
| Date | Code | Title | Description |
|---|---|---|---|
| PUAI | Public reference made under article 153(3) epc to a published international application that has entered the european phase |
Free format text: ORIGINAL CODE: 0009012 |
|
| 17P | Request for examination filed |
Effective date: 20070308 |
|
| AK | Designated contracting states |
Kind code of ref document: A1 Designated state(s): AT BE BG CH CY CZ DE DK EE ES FI FR GB GR HU IE IS IT LI LT LU LV MC NL PL PT RO SE SI SK TR |
|
| AX | Request for extension of the european patent |
Extension state: AL BA HR MK RS |
|
| 17Q | First examination report despatched |
Effective date: 20071016 |
|
| AKX | Designation fees paid |
Designated state(s): AT BE BG CH CY CZ DE DK EE ES FI FR GB GR HU IE IS IT LI LT LU LV MC NL PL PT RO SE SI SK TR |
|
| AXX | Extension fees paid |
Extension state: YU Payment date: 20070912 Extension state: MK Payment date: 20070912 Extension state: HR Payment date: 20070912 Extension state: BA Payment date: 20070912 Extension state: AL Payment date: 20070912 |
|
| RAX | Requested extension states of the european patent have changed |
Extension state: RS Payment date: 20070912 Extension state: MK Payment date: 20070912 Extension state: HR Payment date: 20070912 Extension state: BA Payment date: 20070912 Extension state: AL Payment date: 20070912 |
|
| STAA | Information on the status of an ep patent application or granted ep patent |
Free format text: STATUS: THE APPLICATION HAS BEEN REFUSED |
|
| 18R | Application refused |
Effective date: 20110404 |