EP1762178A1 - Ultrasonographic device - Google Patents
Ultrasonographic device Download PDFInfo
- Publication number
- EP1762178A1 EP1762178A1 EP04822049A EP04822049A EP1762178A1 EP 1762178 A1 EP1762178 A1 EP 1762178A1 EP 04822049 A EP04822049 A EP 04822049A EP 04822049 A EP04822049 A EP 04822049A EP 1762178 A1 EP1762178 A1 EP 1762178A1
- Authority
- EP
- European Patent Office
- Prior art keywords
- intensity
- signal
- blood flow
- gray
- flow velocity
- Prior art date
- Legal status (The legal status is an assumption and is not a legal conclusion. Google has not performed a legal analysis and makes no representation as to the accuracy of the status listed.)
- Withdrawn
Links
Images


Classifications
-
- A—HUMAN NECESSITIES
- A61—MEDICAL OR VETERINARY SCIENCE; HYGIENE
- A61B—DIAGNOSIS; SURGERY; IDENTIFICATION
- A61B8/00—Diagnosis using ultrasonic, sonic or infrasonic waves
- A61B8/06—Measuring blood flow
Definitions
- the present invention relates to an ultrasonographic technique and, more particularly, to an ultrasonographic device having the function of detecting blood flow velocity in a living body on the basis of Doppler frequency shift in a reception signal from a subject.
- An ultrasonic diagnostic apparatus transmits an ultrasonic beam from a ultrasonic probe to a subject, and obtains information necessary for diagnosis on the basis of a reception signal from the subject. For example, a Doppler frequency shift in a reception signal is detected and, on the basis of the Doppler frequency shift, the velocity of blood flow can be obtained.
- Such an ultrasonic Doppler apparatus has, as shown in FIG. 9, a probe 1 for transmitting/receiving ultrasonic wave, an interface 5 for operating an ultrasonic diagnostic apparatus, a control unit 4 for controlling the whole system, a pulse/CW transmit signal generator 3 for generating a transmission waveform on the basis of the control unit 4, a transmitter 2 for amplifying a signal generated by the pulse/CW transmit signal generator 3, a pre-amplifier 6 for amplifying a reception signal from the probe, a receive beamformer 7 for selectively emphasizing a signal from a desired location, a Doppler processing unit 8 for detecting a Doppler shift component from the blood flow from a phase output, a digital scan converter (DSC) 10 for displaying an instantaneous frequency component calculated by the processing unit as blood flow waveform data, and a display 11 for displaying an output of the scan converter.
- DSC digital scan converter
- the Doppler processing unit 8 detects the Doppler shift component (Doppler signal). Since the blood flow velocity varies, a Doppler signal obtained includes different frequency components.
- the Doppler processing unit 8 obtains a frequency distribution, that is, blood flow distribution by performing a method such as fast Fourier transform on the Doppler shift component. By sequentially performing the computation, a change with time in the blood flow distribution is displayed. The method provides significant data also from the clinical viewpoint and is widely used.
- the data can be used not only as quantitative data of the maximum blood flow velocity in a predetermined position in a subject but also as data in the case of diagnosing a valvular disease of the heart or the like.
- a time-varying waveform of a velocity distribution of the blood flow from the portion of the valve of the heat By displaying a time-varying waveform of a velocity distribution of the blood flow from the portion of the valve of the heat, backflow at the valve can be determined.
- the shape itself of the time-varying waveform of the blood flow velocity distribution is widely known as data useful for diagnosis.
- the gray scale mapping is a method of displaying a change with time of a blood flow velocity distribution by setting time on the axis of abscissa, velocity on the axis of ordinate, and intensity of a signal as brightness.
- the gray scale mapping is performed on assumption that two peaks basically appear in the intensity of the signal component showing blood flow velocity and the intensity of the noise component.
- signals of low intensity are also included in the signal components, so that the components cannot be separated to the signal component and the noise component on the basis of the intensity. Consequently, when an output of a low-intensity signal is suppressed, the intensity of the signal components becomes partially low, the contour shape of a spectrum waveform is deformed, and a so-called black spot in which a signal drops occurs.
- an object of the present invention is to provide an ultrasonic diagnosis apparatus realizing improved visibility of a contour shape of signal components in an ultrasonic blood flow spectrum display image.
- an ultrasonic diagnostic apparatus of the present invention has the following characteristics.
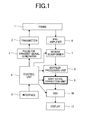
- FIG. 1 shows a configuration example of an ultrasonic diagnostic apparatus as an embodiment of the invention.
- the apparatus has a probe 1 for transmitting/receiving ultrasonic wave to/from a subject (not shown), a control unit 4 for controlling the whole system, a pulse/CW transmit signal generator 3 for generating a transmission waveform on the basis of the control unit 4, a transmitter 2 for amplifying a signal generated by the pulse/CW transmit signal generator 3, a pre-amplifier 6 for amplifying a reception signal from the probe, a receive beamformer 7 for selectively emphasizing a signal from a desired position, a Doppler processing unit 8 for detecting a Doppler shift component from the blood flow from a phase output, a digital scan converter (DSC) 10 for displaying an instantaneous frequency component calculated by the processing unit as blood flow waveform data, and a display 11 for displaying an output of the scan converter.
- a gray-level correction unit 9 is provided to improve visibility of a blood flow spectrum image which is
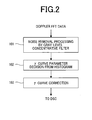
- FIG. 2 is a diagram showing a calculation processing flow executed by the gray-level correction unit 9.
- the intensity correction computing process is constructed by two processes; a process for separating a noise and a signal, and an intensity correcting process for suppressing output intensity equal to or less than a boundary point between the noise and the signal intensity obtained as a result of the separating process.
- Patent Document 1 employs only the intensity correcting process.
- a pre-process of the intensity correcting process a process for separating noise and signal from each other is also employed.
- the two process flows are performed, in a concrete example, by a noise eliminating process 101 using a gray-level concentrative filter, a parameter determining process 102 of a ⁇ curve (intensity correction curve) from a histogram from which noise has been eliminated, and a ⁇ curve correcting process 103, thereby completing the intensity correction computing process.
- FIG. 3 shows concrete calculation process of the noise eliminating process 101 performed by the gray-level concentrative filter.
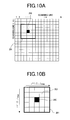
- FIGS. 10A and 10B show image data which is input to the gray-level concentrative filter.
- intensity of a point (focused pixel) 200 at which intensity is calculated in image data is expressed as I 0
- the size of a focused area 201 (area in which a weighting value is calculated) for calculating an output of the intensity is expressed as ixj.
- 202 denotes peripheral pixels of the focus pixel 200 in the area 201 in which a weighting value is calculated.
- step 107 By performing the weighting value calculation on all of the points (step 107), an intensity value is obtained (step 108). After I 0 is shifted in the image and the calculation is executed on all of the points in the image, the gray-level concentrative filter process is finished in step 109.
- FIG. 4A shows the frequency distribution of the intensity difference between pixels in a typical ultrasonic image.
- a Gaussian function (Equation 1) or a polynomial of even-number order can be used.
- w ij exp - 1 ⁇ I ij - I 0 ⁇ 2
- Equation 1 ⁇ denotes half width of a Gaussian value.
- ⁇ is increased, a change in the weighting value decreases relative to a change in intensity.
- sensitivity to a change in intensity decreases.
- An intensity computing process shown by Equation 2 using the weighting function W ij is performed.
- the intensity computing process all of values obtained by multiplying the pixels in the area of calculation with the weighting function are added, and normalization is performed with the total value.
- new image intensity (I' 0 ) in which noise components are suppressed without blurring an image is obtained.
- the application of the weighting function according to the intensity difference is equivalent to two-dimensional filter process of low pass type performed along the edge of a contour shape in an image.
- the gray-level concentrative filter is also called a self-centered filter by the inventors of the present invention by paying attention to the characteristic of the filter. Specifically, a large weight is given to a pixel whose property is close to a focused target pixel, so that feedback is obtained only from pixels close to the target pixel and it is similar to a behavior with self-centered will.
- I 0 ⁇ I ij w ij ⁇ w ij
- FIGS. 5A and 5B show the histogram of original data.
- a distribution of a noise signal having a peak at around 20 in intensity is the largest.
- the peak is hidden in the noise signal distribution, and it is difficult to determine the distribution shape.
- FIG. 5B shows the histogram after the filtering process using the gray-level concentrative filter. The distribution of signal components having the peak at around intensity 25 can be clearly distinguished from the distribution of noise components.
- the filtering process using the gray-level concentrative filter of the present invention is different from the process of simply suppressing a low-intensity component as described in the conventional technique (Patent Document 1).
- Patent Document 1 The value at which the signal distribution and the noise distribution are separated from each other in FIG. 5B is set as Th.
- FIGS. 7A to 7C are provided for comparison between the case of performing the intensity correcting process using a blood flow spectrum image (7b) subjected to the intensity correcting process according to the present invention and the case of performing the intensity correcting process using the known method (c) described in the conventional technique (Patent Document 1).
- FIGS. 7A to 7C show results of reverse videos so that comparison can be made easily.
- the noise component is suppressed more in the method (b) according to the present invention and the known method (c) than the original image shown in FIG. 7A.
- the signal intensity distribution of the method according to the present invention is continuous and it can be recognized that so-called black patch does not occur.
- the effect of the present invention can be recognized not only by comparison in visibility of images but also in the case where a contour is auto-traced.
- FIGS. 8A and 8B are also provided to show comparison between results of performing contour auto-trace on the original image and an image subjected to the image process of the present invention, respectively.
- FIGS. 8A and 8B show results of reverse videos so that comparison can be made easily.
- histograms are always measured in the above description, depending on the performance of a computation circuit of the device, by providing a mechanism for detecting an environmental change, the histogram measurement can be omitted by using the value Th once obtained as long as the environmental change is not detected.
- the environmental change denotes a change in setting of the device or a change in a signal obtaining part.
- the environmental change can be detected by monitoring a representative value indicative of a parameter on the device side such as a statistical parameter such as the frequency of transmission/reception, and the number of sampling points of frequency conversion in the Doppler processing unit, or representative values indicative of statistical parameter of a signal such as an average value of Doppler signals, variance, pulse repetition frequency.
- the parameter ⁇ (the half width of the Gaussian value) may be provided as a key in the interface 5 (FIG. 1).
- a predetermined value may be used as the parameter ⁇ .
- a value with which the signal component peak can be detected on the histogram most excellently may be retrieved and used.
- ⁇ for obtaining the value Th and ⁇ of the gray-level concentration filter use for outputting an image may be the same or different from each other.
- the ultrasonographic device with improved visibility in a contour shape of signal components by suppressing display intensity of a noise component while minimizing the influence on display of the signal component in an ultrasonic blood flow spectrum image can be realized.
- the contour of a spectrum waveform By clarifying the contour of a spectrum waveform, detection of a lesion can be facilitated.
Landscapes
- Health & Medical Sciences (AREA)
- Life Sciences & Earth Sciences (AREA)
- Engineering & Computer Science (AREA)
- Medical Informatics (AREA)
- Biophysics (AREA)
- Nuclear Medicine, Radiotherapy & Molecular Imaging (AREA)
- Pathology (AREA)
- Radiology & Medical Imaging (AREA)
- Hematology (AREA)
- Biomedical Technology (AREA)
- Heart & Thoracic Surgery (AREA)
- Physics & Mathematics (AREA)
- Molecular Biology (AREA)
- Surgery (AREA)
- Animal Behavior & Ethology (AREA)
- General Health & Medical Sciences (AREA)
- Public Health (AREA)
- Veterinary Medicine (AREA)
- Ultra Sonic Daignosis Equipment (AREA)
Abstract
The present invention provides an ultrasonic diagnostic apparatus realizing improved visibility of a contour shape of signal components in an ultrasonic blood flow spectrum display image. The apparatus includes a gray-level correction unit for correcting intensity of an output result of a Doppler processing unit. The Doppler processing unit calculates a Doppler frequency shift in a reception signal output from a receiver and calculates blood flow velocity of a subject on the basis of the Doppler frequency shift. The gray-level correction unit has: a filtering unit for separating a signal and a noise from each other, which are included in a time-varying waveform of the blood flow velocity of the subject obtained by the Doppler processing unit on the basis of continuity on a space defined by the blood flow velocity and time; and a gray-level corrector for performing a gray level correction using, as a parameter, a boundary value between signal intensity and noise intensity obtained by the filtering unit.
Description
- The present invention relates to an ultrasonographic technique and, more particularly, to an ultrasonographic device having the function of detecting blood flow velocity in a living body on the basis of Doppler frequency shift in a reception signal from a subject.
- An ultrasonic diagnostic apparatus transmits an ultrasonic beam from a ultrasonic probe to a subject, and obtains information necessary for diagnosis on the basis of a reception signal from the subject. For example, a Doppler frequency shift in a reception signal is detected and, on the basis of the Doppler frequency shift, the velocity of blood flow can be obtained.
- Such an ultrasonic Doppler apparatus has, as shown in FIG. 9, a
probe 1 for transmitting/receiving ultrasonic wave, aninterface 5 for operating an ultrasonic diagnostic apparatus, acontrol unit 4 for controlling the whole system, a pulse/CWtransmit signal generator 3 for generating a transmission waveform on the basis of thecontrol unit 4, atransmitter 2 for amplifying a signal generated by the pulse/CWtransmit signal generator 3, apre-amplifier 6 for amplifying a reception signal from the probe, areceive beamformer 7 for selectively emphasizing a signal from a desired location, aDoppler processing unit 8 for detecting a Doppler shift component from the blood flow from a phase output, a digital scan converter (DSC) 10 for displaying an instantaneous frequency component calculated by the processing unit as blood flow waveform data, and adisplay 11 for displaying an output of the scan converter. - In such an ultrasonic Doppler apparatus, when ultrasonic wave having a frequency f0 is output from the
probe 1, since blood of the subject flows at predetermined speed, an echo signal obtained by the ultrasonic wave from theprobe 1 reflected by blood cells has been subjected to a frequency shift by the Doppler effect. TheDoppler processing unit 8 detects the Doppler shift component (Doppler signal). Since the blood flow velocity varies, a Doppler signal obtained includes different frequency components. TheDoppler processing unit 8 obtains a frequency distribution, that is, blood flow distribution by performing a method such as fast Fourier transform on the Doppler shift component. By sequentially performing the computation, a change with time in the blood flow distribution is displayed. The method provides significant data also from the clinical viewpoint and is widely used. In particular, the data can be used not only as quantitative data of the maximum blood flow velocity in a predetermined position in a subject but also as data in the case of diagnosing a valvular disease of the heart or the like. By displaying a time-varying waveform of a velocity distribution of the blood flow from the portion of the valve of the heat, backflow at the valve can be determined. The shape itself of the time-varying waveform of the blood flow velocity distribution is widely known as data useful for diagnosis. - Since a Doppler signal is based on a reflection signal from a blood cell having low ultrasonic scattering power, there has been the task of improving a signal-to-noise ratio. Noise exists also in a velocity range in which signals do not inherently exit in the time-varying waveform of the blood flow velocity distribution, and it largely deteriorates visibility of the time-varying waveform of the blood flow velocity distribution. As a method of solving the problem, for example, a method of setting a threshold between an area including many noise components and an area including many signal components at the time of performing gray scale mapping has been proposed (refer to, for example, Published
Japanese Translation of PCT International Publication for Patent Application No. 2002-534185 - The gray scale mapping is performed on assumption that two peaks basically appear in the intensity of the signal component showing blood flow velocity and the intensity of the noise component. In reality, however, signals of low intensity are also included in the signal components, so that the components cannot be separated to the signal component and the noise component on the basis of the intensity. Consequently, when an output of a low-intensity signal is suppressed, the intensity of the signal components becomes partially low, the contour shape of a spectrum waveform is deformed, and a so-called black spot in which a signal drops occurs.
- Therefore, an object of the present invention is to provide an ultrasonic diagnosis apparatus realizing improved visibility of a contour shape of signal components in an ultrasonic blood flow spectrum display image.
- To achieve the object, an ultrasonic diagnostic apparatus of the present invention has the following characteristics.
- (1) An ultrasonic diagnostic apparatus of the present invention has: an ultrasonic probe; a transmitter having a transmission signal generating circuit for generating a ultrasonic wave made by continuous wave or pulse wave and selectively transmitting the ultrasonic wave to a subject via the ultrasonic probe; a receiver for phasing a reception signal received from the subject by the ultrasonic probe; a Doppler processing unit for calculating Doppler frequency shift in the reception signal output from the receiver and calculating blood flow velocity of the subject on the basis of the Doppler frequency shift; a display for displaying a waveform of the blood flow velocity; a controller for controlling the transmitter, the receiver, the Doppler processing unit, and the display; and a gray-level correcting unit for correcting gray level of an output result of the Doppler processing unit, wherein the gray-level correcting unit includes: a filtering unit for separating a signal and a noise from each other, which are included in a time-varying waveform of the blood flow velocity of the subject obtained by the Doppler processing unit on the basis of continuity on a space defined by the blood flow velocity and time; and a gray-level corrector for performing a gray level correction using, as a parameter, aboundaryvaluebetweensignal intensity and noise intensity obtained by the filtering unit.
- (2) In the ultrasonic diagnostic apparatus of (1), the gray-level correction unit is constructed so as to suppress an intensity signal lower than the boundary value in intensity distribution of the signal and the noise.
- (3) In the ultrasonic diagnostic apparatus of (1), the filtering unit has: means for defining a peripheral pixel range of a pixel in image data on the blood flow velocity; and means for determining a weighting function from the difference between the intensity of each of the pixels and the intensity of each of the peripheral pixels, the weighting function has a maximum point at zero, an integral value of an absolute value of the function in the range from negative infinity to positive infinity is finite, and a value obtained by using sum of product of the weighting function and the intensity of each of the peripheral pixels as intensity of a pixel in image data on the blood flow velocity is used as signal intensity of a result of the filtering process.
- (4) An ultrasonic diagnostic apparatus of the present invention includes: an ultrasonic probe; a transmitter having a transmission signal generating circuit for generating a ultrasonic wave made by continuous wave or pulse wave and selectively transmitting the ultrasonic wave to a subject via the ultrasonic probe; a receiver for phasing a reception signal received from the subject by the ultrasonic probe; a Doppler processing unit for calculating Doppler frequency shift in the reception signal output from the receiver and calculating blood flowvelocity of the subject on the basis of the Doppler frequency shift; a display for displaying a waveform of the blood flow velocity; a controller for controlling the transmitter, the receiver, the Doppler processing unit, and the display; and a gray-level correcting unit for correcting gray level of an output result of the Doppler processing unit, wherein the gray-level correcting unit separates a signal and a noise from each other which are included in a time-varying waveform of the blood flow velocity of the subject obtained by the Doppler processing unit on the basis of a statistical property, and performs an intensity correction by suppressing output intensity equal to or lower than a boundary point between signal intensity and noise intensity obtained as a result of the filtering process.
- (5) In the ultrasonic diagnostic apparatus in any of (1) to (4), the separating process includes a process for separating the signal and the noise as peaks on a histogram from each other.
- According to the present invention, in an ultrasonic blood flow spectrum display image, by suppressing intensity of noise components while minimizing the influence on display of signal components, visibility of the contour shape of the signal components is improved.
-
- FIG. 1 is a diagram illustrating a configuration example of an ultrasonic diagnostic apparatus according to an embodiment of the present invention.
- FIG. 2 is a diagram showing an intensity correcting computing process flow according to the invention.
- FIG. 3 is a diagram showing a process flow of a gray-level concentrative filter in FIG. 2.
- FIGS. 4A and 4B are diagrams illustrating the shapes of the frequency distribution of intensity difference and the weighting function.
- FIGS. 5A and 5B are diagrams illustrating histograms before and after a gray-level concentrative filter process in the invention.
- FIG. 6 is a diagram showing an intensity correction curve in the invention.
- FIGS. 7A, 7B, and 7C are diagrams showing an original image, a blood flow spectrum image subjected to the intensity correcting process of the invention, and an image obtained by the conventional method, respectively.
- FIGS. 8A and 8B are diagrams showing a result of performing contour auto trace on the original image, and a result of performing contour auto trace on the blood flow spectrum image according to the present invention.
- FIG. 9 is a diagram illustrating the configuration of a conventional ultrasonic diagnostic apparatus.
- FIGS. 10A and 10B are diagrams showing image data which is input to the gray-level concentrative filter.
- An embodiment of the present invention will be described in detail hereinbelow with reference to the drawings.
- FIG. 1 shows a configuration example of an ultrasonic diagnostic apparatus as an embodiment of the invention. The apparatus has a
probe 1 for transmitting/receiving ultrasonic wave to/from a subject (not shown), acontrol unit 4 for controlling the whole system, a pulse/CWtransmit signal generator 3 for generating a transmission waveform on the basis of thecontrol unit 4, atransmitter 2 for amplifying a signal generated by the pulse/CWtransmit signal generator 3, a pre-amplifier 6 for amplifying a reception signal from the probe, areceive beamformer 7 for selectively emphasizing a signal from a desired position, aDoppler processing unit 8 for detecting a Doppler shift component from the blood flow from a phase output, a digital scan converter (DSC) 10 for displaying an instantaneous frequency component calculated by the processing unit as blood flow waveform data, and adisplay 11 for displaying an output of the scan converter. Particularly, in the present invention, a gray-level correction unit 9 is provided to improve visibility of a blood flow spectrum image which is output to thedisplay 11. - FIG. 2 is a diagram showing a calculation processing flow executed by the gray-
level correction unit 9. The intensity correction computing process is constructed by two processes; a process for separating a noise and a signal, and an intensity correcting process for suppressing output intensity equal to or less than a boundary point between the noise and the signal intensity obtained as a result of the separating process. The above-described conventional technique (Patent Document 1) employs only the intensity correcting process. In the present invention, as a pre-process of the intensity correcting process, a process for separating noise and signal from each other is also employed. - The two process flows are performed, in a concrete example, by a
noise eliminating process 101 using a gray-level concentrative filter, aparameter determining process 102 of a γ curve (intensity correction curve) from a histogram from which noise has been eliminated, and a γcurve correcting process 103, thereby completing the intensity correction computing process. - FIG. 3 shows concrete calculation process of the
noise eliminating process 101 performed by the gray-level concentrative filter. FIGS. 10A and 10B show image data which is input to the gray-level concentrative filter. - In FIGS. 10A and 10B, intensity of a point (focused pixel) 200 at which intensity is calculated in image data is expressed as I0, and the size of a focused area 201 (area in which a weighting value is calculated) for calculating an output of the intensity is expressed as ixj. The larger the size is, the more the gray-level concentrative filter is effective, however, the computation speed decreases only by the amount. 202 denotes peripheral pixels of the
focus pixel 200 in thearea 201 in which a weighting value is calculated. In place of enlargement of the size ixj of the focusedarea 201, it is also effective to increase efficiency of computation by performing a process of reducing the number of sampling points by decimation prior to the process of the gray-level concentration filter and increasing the number of sampling points to the original number by interpolation after the process. The number of re-sampling points of the decimation, "i" and "j", and the shape of a weighting function are determined in aparameter setting step 104 in FIG. 3. The position of a pixel of calculation and the pixels in the range determined by "i" and "j" are set instep 105, and a weighting value is calculated instep 105 on the basis of the weighting function which will be described later. By performing the weighting value calculation on all of the points (step 107), an intensity value is obtained (step 108). After I0 is shifted in the image and the calculation is executed on all of the points in the image, the gray-level concentrative filter process is finished instep 109. - The weighting function will be described with reference to FIGS. 4A and 4B. FIG. 4A shows the frequency distribution of the intensity difference between pixels in a typical ultrasonic image. In contrast, as a function in which the weighting value monotonously decreases as the difference between I0 and Iij increases, as shown in FIG. 4B, a Gaussian function (Equation 1) or a polynomial of even-number order can be used.

- In
Equation 1, α denotes half width of a Gaussian value. When the half width, that is, α is increased, a change in the weighting value decreases relative to a change in intensity. As a result, sensitivity to a change in intensity decreases. - An intensity computing process shown by
Equation 2 using the weighting function Wij is performed. In the intensity computing process, all of values obtained by multiplying the pixels in the area of calculation with the weighting function are added, and normalization is performed with the total value. As a result, new image intensity (I'0) in which noise components are suppressed without blurring an image is obtained. The application of the weighting function according to the intensity difference is equivalent to two-dimensional filter process of low pass type performed along the edge of a contour shape in an image. - The gray-level concentrative filter is also called a self-centered filter by the inventors of the present invention by paying attention to the characteristic of the filter. Specifically, a large weight is given to a pixel whose property is close to a focused target pixel, so that feedback is obtained only from pixels close to the target pixel and it is similar to a behavior with self-centered will.

- The histograms of a signal before and after the filtering process with the gray-level concentrative filter will be compared with each other by using FIGS. 5A and 5B. FIG. 5A shows the histogram of original data. A distribution of a noise signal having a peak at around 20 in intensity is the largest. There is a signal distribution on the higher intensity side. However, the peak is hidden in the noise signal distribution, and it is difficult to determine the distribution shape. On the other hand, FIG. 5B shows the histogram after the filtering process using the gray-level concentrative filter. The distribution of signal components having the peak at around intensity 25 can be clearly distinguished from the distribution of noise components. It shows that the filtering process using the gray-level concentrative filter of the present invention is different from the process of simply suppressing a low-intensity component as described in the conventional technique (Patent Document 1). In the case of giving a unique intensity output to an intensity input, signals are not separated while forming peaks. The value at which the signal distribution and the noise distribution are separated from each other in FIG. 5B is set as Th. For example, the value can be determined as Th = (M1+M2)/2 where M1 denotes the maximum value of the signal distribution and M2 denotes the maximum value of the noise distribution.
- Intensity correction is performed by using the value Th and a γ curve shown in FIG. 6. FIGS. 7A to 7C are provided for comparison between the case of performing the intensity correcting process using a blood flow spectrum image (7b) subjected to the intensity correcting process according to the present invention and the case of performing the intensity correcting process using the known method (c) described in the conventional technique (Patent Document 1). FIGS. 7A to 7C show results of reverse videos so that comparison can be made easily.
- The noise component is suppressed more in the method (b) according to the present invention and the known method (c) than the original image shown in FIG. 7A. When the signal areas are compared with each other, the signal intensity distribution of the method according to the present invention is continuous and it can be recognized that so-called black patch does not occur. The effect of the present invention can be recognized not only by comparison in visibility of images but also in the case where a contour is auto-traced.
- FIGS. 8A and 8B are also provided to show comparison between results of performing contour auto-trace on the original image and an image subjected to the image process of the present invention, respectively. FIGS. 8A and 8B show results of reverse videos so that comparison can be made easily.
- In the result of performing the contour auto-trace on the original image (FIG. 8A), a deviation occurs between the contour of the signal component distribution and the result of auto trace. In the result of auto-trace after the process of the present invention (FIG. 8B), it is understood that the contour of the signal component distribution and the auto trace result match each other extremely.
- Although histograms are always measured in the above description, depending on the performance of a computation circuit of the device, by providing a mechanism for detecting an environmental change, the histogram measurement can be omitted by using the value Th once obtained as long as the environmental change is not detected. The environmental change denotes a change in setting of the device or a change in a signal obtaining part. The environmental change can be detected by monitoring a representative value indicative of a parameter on the device side such as a statistical parameter such as the frequency of transmission/reception, and the number of sampling points of frequency conversion in the Doppler processing unit, or representative values indicative of statistical parameter of a signal such as an average value of Doppler signals, variance, pulse repetition frequency. By simplifying the histogram measurement, a real-time process can be performed in a small circuit-scale.
- The parameter α (the half width of the Gaussian value) may be provided as a key in the interface 5 (FIG. 1). As the parameter α, a predetermined value may be used. A value with which the signal component peak can be detected on the histogram most excellently may be retrieved and used. Further, α for obtaining the value Th and α of the gray-level concentration filter use for outputting an image may be the same or different from each other.
- As described in detail above, according to the present invention, the ultrasonographic device with improved visibility in a contour shape of signal components by suppressing display intensity of a noise component while minimizing the influence on display of the signal component in an ultrasonic blood flow spectrum image can be realized. By clarifying the contour of a spectrum waveform, detection of a lesion can be facilitated.
Claims (5)
- An ultrasonic diagnostic apparatus comprising:an ultrasonic probe;a transmitter having a transmission signal generating circuit for generating a ultrasonic wave made by continuous wave or pulse wave and selectively transmitting the ultrasonic wave to a subject via the ultrasonic probe;a receiver for phasing a reception signal received from the subject by the ultrasonic probe;a Doppler processing unit for calculating Doppler frequency shift in the reception signal output from the receiver and calculating blood flow velocity of the subject on the basis of the Doppler frequency shift;a display for displaying a waveform of the blood flow velocity;a controller for controlling the transmitter, the receiver, the Doppler processing unit, and the display; anda gray-level correcting unit for correcting gray level of an output result of the Doppler processing unit,wherein the gray-level correcting unit includes: a filtering unit for separating a signal and a noise from each other, which are included in a time-varying waveform of the blood flow velocity of the subject obtained by the Doppler processing unit on the basis of continuity on a space defined by the blood flow velocity and time; and a gray-level corrector for performing a gray level correction using, as a parameter, a boundary value between signal intensity and noise intensity obtained by the filtering unit.
- The ultrasonic diagnostic apparatus according to claim 1, wherein the gray-level correction unit is constructed so as to suppress an intensity signal lower than the boundary value in intensity distribution of the signal and the noise.
- The ultrasonic diagnostic apparatus according to claim 1, wherein the filtering unit has: means for defining a peripheral pixel range of a pixel in image data on the blood flow velocity; and means for determining a weighting function from the difference between the intensity of each of the pixels and the intensity of each of the peripheral pixels,
the weighting function has a maximum point at zero,
an integral value of an absolute value of the function in the range from negative infinity to positive infinity is finite, and
a value obtained by using sum of product of the weighting function and the intensity of each of the peripheral pixels as intensity of a pixel in image data on the blood flow velocity is used as signal intensity of a result of the filtering process. - An ultrasonic diagnostic apparatus comprising:an ultrasonic probe;a transmitter having a transmission signal generating circuit for generating a ultrasonic wave made by continuous wave or pulse wave and selectively transmitting the ultrasonic wave to a subject via the ultrasonic probe;a receiver for phasing a reception signal received from the subject by the ultrasonic probe;a Doppler processing unit for calculating Doppler frequency shift in the reception signal output from the receiver and calculating blood flow velocity of the subject on the basis of the Doppler frequency shift;a display for displaying a waveform of the blood flow velocity;a controller for controlling the transmitter, the receiver, the Doppler processing unit, and the display; anda gray-level correcting unit for correcting gray level of an output result of the Doppler processing unit,wherein the gray-level correcting unit separates a signal and a noise from each other which are included in a time-varying waveform of the blood flow velocity of the subject obtained by the Doppler processing unit on the basis of a statistical property, and performs an intensity correction by suppressing output intensity equal to or lower than a boundary point between signal intensity and noise intensity obtained as a result of the filtering process.
- The ultrasonic diagnostic apparatus according to claim 1 or 4, wherein the separating process includes a process of separating the signal and the noise as peaks on a histogram from each other.
Applications Claiming Priority (2)
| Application Number | Priority Date | Filing Date | Title |
|---|---|---|---|
| JP2004155662 | 2004-05-26 | ||
| PCT/JP2004/016631 WO2005115248A1 (en) | 2004-05-26 | 2004-11-10 | Ultrasonographic device |
Publications (2)
| Publication Number | Publication Date |
|---|---|
| EP1762178A1 true EP1762178A1 (en) | 2007-03-14 |
| EP1762178A4 EP1762178A4 (en) | 2009-07-15 |
Family
ID=35450619
Family Applications (1)
| Application Number | Title | Priority Date | Filing Date |
|---|---|---|---|
| EP04822049A Withdrawn EP1762178A4 (en) | 2004-05-26 | 2004-11-10 | Ultrasonographic device |
Country Status (5)
| Country | Link |
|---|---|
| US (1) | US8353836B2 (en) |
| EP (1) | EP1762178A4 (en) |
| JP (1) | JP4996247B2 (en) |
| CN (1) | CN100531674C (en) |
| WO (1) | WO2005115248A1 (en) |
Families Citing this family (20)
| Publication number | Priority date | Publication date | Assignee | Title |
|---|---|---|---|---|
| US8036856B2 (en) * | 2005-12-01 | 2011-10-11 | General Electric Company | Method and apparatus for automatically adjusting spectral doppler gain |
| US7804736B2 (en) * | 2006-03-30 | 2010-09-28 | Aloka Co., Ltd. | Delay controller for ultrasound receive beamformer |
| KR100977367B1 (en) * | 2009-10-28 | 2010-08-20 | (주)메디슨 | Three dimension pulsed wave spectrum ultrasonic diagnostic apparatus and three dimension pulsed wave spectrum data generate method |
| CN101849841B (en) * | 2010-06-10 | 2013-03-13 | 复旦大学 | Method of Suppressing Clutter in Ultrasound Color Flow Imaging Based on Geometric Filter |
| EP2599440B1 (en) * | 2010-11-11 | 2018-08-22 | Olympus Corporation | Ultrasonic observation device, method for operating ultrasonic observation device, and operation program for ultrasonic observation device |
| JP5438066B2 (en) | 2011-05-25 | 2014-03-12 | 日立アロカメディカル株式会社 | Ultrasonic image processing apparatus and program |
| CN102805649B (en) * | 2011-06-03 | 2016-03-23 | 深圳迈瑞生物医疗电子股份有限公司 | A kind of color ultrasound image method and device |
| JP5497821B2 (en) * | 2012-03-16 | 2014-05-21 | 国立大学法人 東京大学 | Fluid flow velocity detection device and program |
| US9874580B2 (en) * | 2012-06-05 | 2018-01-23 | Newsouth Innovations Pty Limited | Method and system for determining a velocity of a relative movement between an object and a fluidal medium |
| JP2014018392A (en) * | 2012-07-18 | 2014-02-03 | Toshiba Corp | Ultrasonic diagnostic apparatus |
| US20140336510A1 (en) * | 2013-05-08 | 2014-11-13 | Siemens Medical Solutions Usa, Inc. | Enhancement in Diagnostic Ultrasound Spectral Doppler Imaging |
| JP5750181B1 (en) * | 2014-03-31 | 2015-07-15 | 日立アロカメディカル株式会社 | Ultrasonic diagnostic equipment |
| JP5837641B2 (en) * | 2014-04-08 | 2015-12-24 | 日立アロカメディカル株式会社 | Ultrasonic diagnostic equipment |
| JP6265933B2 (en) * | 2015-03-05 | 2018-01-24 | 富士フイルム株式会社 | Acoustic wave diagnostic apparatus and control method thereof |
| WO2016176855A1 (en) * | 2015-05-07 | 2016-11-10 | 深圳迈瑞生物医疗电子股份有限公司 | Blood flow imaging method and system |
| KR102030568B1 (en) * | 2015-12-23 | 2019-10-10 | 지멘스 메디컬 솔루션즈 유에스에이, 인크. | Ultrasound system and method of displaying doppler spectrum image |
| CN105708495B (en) * | 2016-01-26 | 2018-08-17 | 飞依诺科技(苏州)有限公司 | Ultrasonic color blood flow imaging boundary processing method and system |
| CN111050659B (en) * | 2017-08-23 | 2023-06-02 | 皇家飞利浦有限公司 | Fetal Movement Detection Method Based on Doppler Ultrasonic Signal |
| CN113924044A (en) * | 2019-04-18 | 2022-01-11 | 加利福尼亚州立大学董事会 | System and method for continuous non-invasive ultrasound monitoring of blood vessels and central organs |
| JP7453040B2 (en) * | 2020-04-01 | 2024-03-19 | 富士フイルムヘルスケア株式会社 | Ultrasonic imaging device and image processing device |
Family Cites Families (15)
| Publication number | Priority date | Publication date | Assignee | Title |
|---|---|---|---|---|
| JPS5897347A (en) * | 1981-12-03 | 1983-06-09 | 株式会社東芝 | Ultrasonic diagnostic apparatus |
| JPS61181449A (en) * | 1985-02-08 | 1986-08-14 | 富士通株式会社 | Blood flow speed measuring apparatus |
| US4967753A (en) * | 1987-04-10 | 1990-11-06 | Cardiometrics, Inc. | Apparatus, system and method for measuring spatial average velocity and/or volumetric flow of blood in a vessel |
| JP2916219B2 (en) | 1990-06-19 | 1999-07-05 | 富士通株式会社 | Ultrasound diagnostic equipment |
| US5271404A (en) * | 1992-06-25 | 1993-12-21 | Cardiometrics, Inc. | Method and apparatus for processing signal data to form an envelope on line |
| JP3892538B2 (en) * | 1997-07-18 | 2007-03-14 | 株式会社東芝 | Ultrasonic Doppler diagnostic device |
| US6135962A (en) | 1998-12-01 | 2000-10-24 | General Electric Company | Method and apparatus for adaptive filtering by counting acoustic sample zeroes in ultrasound imaging |
| US6142943A (en) | 1998-12-30 | 2000-11-07 | General Electric Company | Doppler ultrasound automatic spectrum optimization |
| JP3366872B2 (en) | 1999-03-18 | 2003-01-14 | アロカ株式会社 | Ultrasound diagnostic equipment |
| JP2000262820A (en) | 1999-03-19 | 2000-09-26 | Mitsubishi Paper Mills Ltd | Air purifying filter |
| US6500125B1 (en) * | 2000-03-30 | 2002-12-31 | Ge Medical Systems Global Technology Company, Llc | Ultrasound b/color priority threshold calculation |
| KR100381874B1 (en) * | 2000-07-08 | 2003-04-26 | 주식회사 메디슨 | An ultrasonic diagnostic apparatus and method for measuring blood flow velocities using doppler effect |
| JP4130114B2 (en) * | 2002-10-09 | 2008-08-06 | 株式会社日立メディコ | Ultrasonic imaging apparatus and ultrasonic signal processing method |
| JP2006520619A (en) * | 2003-02-13 | 2006-09-14 | コーニンクレッカ フィリップス エレクトロニクス エヌ ヴィ | Flow spectrogram synthesized from ultrasonic color flow Doppler information |
| US6733454B1 (en) * | 2003-02-26 | 2004-05-11 | Siemens Medical Solutions Usa, Inc. | Automatic optimization methods and systems for doppler ultrasound imaging |
-
2004
- 2004-11-10 US US11/597,325 patent/US8353836B2/en not_active Expired - Fee Related
- 2004-11-10 EP EP04822049A patent/EP1762178A4/en not_active Withdrawn
- 2004-11-10 WO PCT/JP2004/016631 patent/WO2005115248A1/en not_active Ceased
- 2004-11-10 CN CNB200480043105XA patent/CN100531674C/en not_active Expired - Fee Related
- 2004-11-10 JP JP2006513802A patent/JP4996247B2/en not_active Expired - Fee Related
Also Published As
| Publication number | Publication date |
|---|---|
| US20090163816A1 (en) | 2009-06-25 |
| JP4996247B2 (en) | 2012-08-08 |
| US8353836B2 (en) | 2013-01-15 |
| CN100531674C (en) | 2009-08-26 |
| CN1960677A (en) | 2007-05-09 |
| WO2005115248A1 (en) | 2005-12-08 |
| JPWO2005115248A1 (en) | 2008-03-27 |
| EP1762178A4 (en) | 2009-07-15 |
Similar Documents
| Publication | Publication Date | Title |
|---|---|---|
| US8353836B2 (en) | Ultrasonographic device for performing luminance correction | |
| US6277075B1 (en) | Method and apparatus for visualization of motion in ultrasound flow imaging using continuous data acquisition | |
| US6618493B1 (en) | Method and apparatus for visualization of motion in ultrasound flow imaging using packet data acquisition | |
| EP1188068B1 (en) | Method and apparatus for flash suppression in two-dimensional ultrasound imaging | |
| EP1005834B1 (en) | Method and apparatus for automatic doppler angle estimation in ultrasound imaging | |
| EP2479587B1 (en) | Ultrasonic diagnosis apparatus | |
| EP1832894A2 (en) | System and method for automatic gain compensation based on image processing | |
| EP1793343B1 (en) | Image processing system and method of enhancing the quality of an ultrasound image | |
| CN101766497A (en) | Method for processing signal of sound spectrogram image and system therefor | |
| EP4061234B1 (en) | Reduction of reverberation artifacts in ultrasound images and associated devices, systems, and methods | |
| US8951199B2 (en) | Ultrasonic diagnostic apparatus that performs gain control based on offset patterns of pixel brightness | |
| JP5054361B2 (en) | Automatic adjustment of spectral Doppler gain in ultrasound systems | |
| US20220413136A1 (en) | Ultrasound imaging device and method of generating color doppler image | |
| EP0996002A2 (en) | Method and apparatus for edge enhancement in ultrasound imaging | |
| US6500125B1 (en) | Ultrasound b/color priority threshold calculation | |
| JP5103887B2 (en) | Video processing system and method for adjusting gain of color flow video | |
| EP2199827B1 (en) | Clutter signal filtering for Doppler signal | |
| EP1060406B1 (en) | Ultrasound color flow display optimization by adjustment of threshold using sampling | |
| US20250127480A1 (en) | Ultrasonic diagnostic apparatus and image processing method | |
| EP1006369B1 (en) | Method and apparatus for adaptive filtering by counting acoustic sample zeroes in ultrasound imaging | |
| US20260060638A1 (en) | Ultrasonic diagnostic apparatus, control method of ultrasonic diagnostic apparatus, and non-transitory computer readable medium | |
| US20250325254A1 (en) | Ultrasonic diagnostic apparatus and image processing apparatus | |
| Tafsast et al. | Comparative Analysis of Semi-Adaptive Beamforming Algorithms for Ultrasound Localization Microscopy |
Legal Events
| Date | Code | Title | Description |
|---|---|---|---|
| PUAI | Public reference made under article 153(3) epc to a published international application that has entered the european phase |
Free format text: ORIGINAL CODE: 0009012 |
|
| 17P | Request for examination filed |
Effective date: 20061220 |
|
| AK | Designated contracting states |
Kind code of ref document: A1 Designated state(s): DE FR GB IT NL |
|
| DAX | Request for extension of the european patent (deleted) | ||
| RBV | Designated contracting states (corrected) |
Designated state(s): DE FR GB IT NL |
|
| A4 | Supplementary search report drawn up and despatched |
Effective date: 20090617 |
|
| 17Q | First examination report despatched |
Effective date: 20100107 |
|
| STAA | Information on the status of an ep patent application or granted ep patent |
Free format text: STATUS: THE APPLICATION IS DEEMED TO BE WITHDRAWN |
|
| 18D | Application deemed to be withdrawn |
Effective date: 20150602 |