EP1735616B1 - Method for the in vitro determination of cellular uptake of exogenous and endogenous substances using nmr shift agents and the magic angle nmr technique - Google Patents
Method for the in vitro determination of cellular uptake of exogenous and endogenous substances using nmr shift agents and the magic angle nmr technique Download PDFInfo
- Publication number
- EP1735616B1 EP1735616B1 EP05728189A EP05728189A EP1735616B1 EP 1735616 B1 EP1735616 B1 EP 1735616B1 EP 05728189 A EP05728189 A EP 05728189A EP 05728189 A EP05728189 A EP 05728189A EP 1735616 B1 EP1735616 B1 EP 1735616B1
- Authority
- EP
- European Patent Office
- Prior art keywords
- exo
- exogenous
- nmr
- substance
- marker
- Prior art date
- Legal status (The legal status is an assumption and is not a legal conclusion. Google has not performed a legal analysis and makes no representation as to the accuracy of the status listed.)
- Expired - Lifetime
Links
- 239000000126 substance Substances 0.000 title claims abstract description 100
- 238000000034 method Methods 0.000 title claims abstract description 89
- 230000004700 cellular uptake Effects 0.000 title claims abstract description 62
- 238000000338 in vitro Methods 0.000 title claims abstract description 22
- 230000001413 cellular effect Effects 0.000 claims abstract description 30
- 238000005259 measurement Methods 0.000 claims abstract description 21
- 238000005004 MAS NMR spectroscopy Methods 0.000 claims abstract description 19
- 238000011835 investigation Methods 0.000 claims abstract description 10
- 239000003550 marker Substances 0.000 claims description 53
- 239000000523 sample Substances 0.000 claims description 44
- 210000004027 cell Anatomy 0.000 claims description 34
- 238000005481 NMR spectroscopy Methods 0.000 claims description 19
- 150000002602 lanthanoids Chemical group 0.000 claims description 15
- 239000003795 chemical substances by application Substances 0.000 claims description 13
- 239000003814 drug Substances 0.000 claims description 13
- 229910052747 lanthanoid Inorganic materials 0.000 claims description 13
- 210000000056 organ Anatomy 0.000 claims description 11
- 239000002872 contrast media Substances 0.000 claims description 9
- 229940079593 drug Drugs 0.000 claims description 8
- VNWKTOKETHGBQD-UHFFFAOYSA-N methane Chemical compound C VNWKTOKETHGBQD-UHFFFAOYSA-N 0.000 claims description 8
- 239000002537 cosmetic Substances 0.000 claims description 7
- 238000000449 magic angle spinning nuclear magnetic resonance spectrum Methods 0.000 claims description 7
- 229910021645 metal ion Inorganic materials 0.000 claims description 7
- 238000002560 therapeutic procedure Methods 0.000 claims description 7
- 239000012472 biological sample Substances 0.000 claims description 6
- 239000002253 acid Substances 0.000 claims description 5
- 238000003384 imaging method Methods 0.000 claims description 5
- 229910052751 metal Inorganic materials 0.000 claims description 5
- 239000002184 metal Substances 0.000 claims description 5
- HHLZCENAOIROSL-UHFFFAOYSA-N 2-[4,7-bis(carboxymethyl)-1,4,7,10-tetrazacyclododec-1-yl]acetic acid Chemical compound OC(=O)CN1CCNCCN(CC(O)=O)CCN(CC(O)=O)CC1 HHLZCENAOIROSL-UHFFFAOYSA-N 0.000 claims description 4
- KCXVZYZYPLLWCC-UHFFFAOYSA-N EDTA Chemical compound OC(=O)CN(CC(O)=O)CCN(CC(O)=O)CC(O)=O KCXVZYZYPLLWCC-UHFFFAOYSA-N 0.000 claims description 4
- 241001465754 Metazoa Species 0.000 claims description 4
- QPCDCPDFJACHGM-UHFFFAOYSA-N N,N-bis{2-[bis(carboxymethyl)amino]ethyl}glycine Chemical compound OC(=O)CN(CC(O)=O)CCN(CC(=O)O)CCN(CC(O)=O)CC(O)=O QPCDCPDFJACHGM-UHFFFAOYSA-N 0.000 claims description 4
- 150000001875 compounds Chemical class 0.000 claims description 4
- CVSVTCORWBXHQV-UHFFFAOYSA-N creatine Chemical compound NC(=[NH2+])N(C)CC([O-])=O CVSVTCORWBXHQV-UHFFFAOYSA-N 0.000 claims description 4
- 239000003344 environmental pollutant Substances 0.000 claims description 4
- 239000003337 fertilizer Substances 0.000 claims description 4
- 239000002778 food additive Substances 0.000 claims description 4
- 235000013373 food additive Nutrition 0.000 claims description 4
- 229960003330 pentetic acid Drugs 0.000 claims description 4
- 239000000575 pesticide Substances 0.000 claims description 4
- 231100000719 pollutant Toxicity 0.000 claims description 4
- 239000002699 waste material Substances 0.000 claims description 4
- 210000004102 animal cell Anatomy 0.000 claims description 3
- 239000003086 colorant Substances 0.000 claims description 3
- 210000005260 human cell Anatomy 0.000 claims description 3
- 150000002739 metals Chemical class 0.000 claims description 3
- 229910052757 nitrogen Inorganic materials 0.000 claims description 3
- 239000003755 preservative agent Substances 0.000 claims description 3
- 125000002924 primary amino group Chemical group [H]N([H])* 0.000 claims description 3
- 239000000047 product Substances 0.000 claims description 3
- OEIYJWYTUDFZBH-UHFFFAOYSA-N 2-[2-[2-[bis(carboxymethyl)amino]ethyl-(carboxymethyl)amino]ethyl-(carboxymethyl)amino]-3-phenylmethoxypropanoic acid Chemical compound OC(=O)CN(CC(O)=O)CCN(CC(=O)O)CCN(CC(O)=O)C(C(O)=O)COCC1=CC=CC=C1 OEIYJWYTUDFZBH-UHFFFAOYSA-N 0.000 claims description 2
- FDSYTWVNUJTPMA-UHFFFAOYSA-N 2-[3,9-bis(carboxymethyl)-3,6,9,15-tetrazabicyclo[9.3.1]pentadeca-1(15),11,13-trien-6-yl]acetic acid Chemical compound C1N(CC(O)=O)CCN(CC(=O)O)CCN(CC(O)=O)CC2=CC=CC1=N2 FDSYTWVNUJTPMA-UHFFFAOYSA-N 0.000 claims description 2
- QTBSBXVTEAMEQO-UHFFFAOYSA-M Acetate Chemical compound CC([O-])=O QTBSBXVTEAMEQO-UHFFFAOYSA-M 0.000 claims description 2
- BVKZGUZCCUSVTD-UHFFFAOYSA-L Carbonate Chemical compound [O-]C([O-])=O BVKZGUZCCUSVTD-UHFFFAOYSA-L 0.000 claims description 2
- KRKNYBCHXYNGOX-UHFFFAOYSA-K Citrate Chemical compound [O-]C(=O)CC(O)(CC([O-])=O)C([O-])=O KRKNYBCHXYNGOX-UHFFFAOYSA-K 0.000 claims description 2
- JVTAAEKCZFNVCJ-UHFFFAOYSA-M Lactate Chemical compound CC(O)C([O-])=O JVTAAEKCZFNVCJ-UHFFFAOYSA-M 0.000 claims description 2
- OFOBLEOULBTSOW-UHFFFAOYSA-L Malonate Chemical compound [O-]C(=O)CC([O-])=O OFOBLEOULBTSOW-UHFFFAOYSA-L 0.000 claims description 2
- 229910019142 PO4 Inorganic materials 0.000 claims description 2
- WDLRUFUQRNWCPK-UHFFFAOYSA-N Tetraxetan Chemical compound OC(=O)CN1CCN(CC(O)=O)CCN(CC(O)=O)CCN(CC(O)=O)CC1 WDLRUFUQRNWCPK-UHFFFAOYSA-N 0.000 claims description 2
- 239000007983 Tris buffer Substances 0.000 claims description 2
- XSQUKJJJFZCRTK-UHFFFAOYSA-N Urea Chemical compound NC(N)=O XSQUKJJJFZCRTK-UHFFFAOYSA-N 0.000 claims description 2
- 150000001413 amino acids Chemical class 0.000 claims description 2
- 230000003851 biochemical process Effects 0.000 claims description 2
- 239000004202 carbamide Substances 0.000 claims description 2
- 150000001720 carbohydrates Chemical class 0.000 claims description 2
- 235000014633 carbohydrates Nutrition 0.000 claims description 2
- OEYIOHPDSNJKLS-UHFFFAOYSA-N choline Chemical compound C[N+](C)(C)CCO OEYIOHPDSNJKLS-UHFFFAOYSA-N 0.000 claims description 2
- 229960001231 choline Drugs 0.000 claims description 2
- 229960003624 creatine Drugs 0.000 claims description 2
- 239000006046 creatine Substances 0.000 claims description 2
- BJAJDJDODCWPNS-UHFFFAOYSA-N dotp Chemical compound O=C1N2CCOC2=NC2=C1SC=C2 BJAJDJDODCWPNS-UHFFFAOYSA-N 0.000 claims description 2
- 229960001484 edetic acid Drugs 0.000 claims description 2
- 235000013305 food Nutrition 0.000 claims description 2
- 125000000267 glycino group Chemical group [H]N([*])C([H])([H])C(=O)O[H] 0.000 claims description 2
- 239000004009 herbicide Substances 0.000 claims description 2
- 239000003446 ligand Substances 0.000 claims description 2
- 230000001575 pathological effect Effects 0.000 claims description 2
- NBIIXXVUZAFLBC-UHFFFAOYSA-K phosphate Chemical compound [O-]P([O-])([O-])=O NBIIXXVUZAFLBC-UHFFFAOYSA-K 0.000 claims description 2
- 239000010452 phosphate Substances 0.000 claims description 2
- 231100000027 toxicology Toxicity 0.000 claims description 2
- 238000009920 food preservation Methods 0.000 claims 1
- BSYNRYMUTXBXSQ-UHFFFAOYSA-N Aspirin Chemical compound CC(=O)OC1=CC=CC=C1C(O)=O BSYNRYMUTXBXSQ-UHFFFAOYSA-N 0.000 description 55
- 229960001138 acetylsalicylic acid Drugs 0.000 description 37
- 238000001228 spectrum Methods 0.000 description 28
- 239000011550 stock solution Substances 0.000 description 10
- 230000000694 effects Effects 0.000 description 9
- 238000011282 treatment Methods 0.000 description 9
- 230000003993 interaction Effects 0.000 description 8
- 210000001519 tissue Anatomy 0.000 description 8
- 230000005291 magnetic effect Effects 0.000 description 7
- 239000012528 membrane Substances 0.000 description 7
- 230000003834 intracellular effect Effects 0.000 description 6
- 230000005298 paramagnetic effect Effects 0.000 description 6
- 239000000243 solution Substances 0.000 description 6
- 238000004364 calculation method Methods 0.000 description 5
- 238000012986 modification Methods 0.000 description 5
- 230000004048 modification Effects 0.000 description 5
- 238000000425 proton nuclear magnetic resonance spectrum Methods 0.000 description 5
- 230000001988 toxicity Effects 0.000 description 5
- 231100000419 toxicity Toxicity 0.000 description 5
- TVZRAEYQIKYCPH-UHFFFAOYSA-N 3-(trimethylsilyl)propane-1-sulfonic acid Chemical compound C[Si](C)(C)CCCS(O)(=O)=O TVZRAEYQIKYCPH-UHFFFAOYSA-N 0.000 description 4
- 238000011161 development Methods 0.000 description 4
- 238000000655 nuclear magnetic resonance spectrum Methods 0.000 description 4
- HEMHJVSKTPXQMS-UHFFFAOYSA-M Sodium hydroxide Chemical compound [OH-].[Na+] HEMHJVSKTPXQMS-UHFFFAOYSA-M 0.000 description 3
- 238000005119 centrifugation Methods 0.000 description 3
- 210000003722 extracellular fluid Anatomy 0.000 description 3
- 238000005534 hematocrit Methods 0.000 description 3
- 238000004008 high resolution magic-angle spinning Methods 0.000 description 3
- 238000001727 in vivo Methods 0.000 description 3
- 210000002977 intracellular fluid Anatomy 0.000 description 3
- 239000011159 matrix material Substances 0.000 description 3
- 238000002428 photodynamic therapy Methods 0.000 description 3
- 238000002360 preparation method Methods 0.000 description 3
- 241000894007 species Species 0.000 description 3
- 235000013311 vegetables Nutrition 0.000 description 3
- XLYOFNOQVPJJNP-UHFFFAOYSA-N water Substances O XLYOFNOQVPJJNP-UHFFFAOYSA-N 0.000 description 3
- 238000004051 1H MAS NMR Methods 0.000 description 2
- IJGRMHOSHXDMSA-UHFFFAOYSA-N Atomic nitrogen Chemical compound N#N IJGRMHOSHXDMSA-UHFFFAOYSA-N 0.000 description 2
- 229910052692 Dysprosium Inorganic materials 0.000 description 2
- 238000009825 accumulation Methods 0.000 description 2
- 238000004458 analytical method Methods 0.000 description 2
- 125000004429 atom Chemical group 0.000 description 2
- 230000008901 benefit Effects 0.000 description 2
- 210000004369 blood Anatomy 0.000 description 2
- 239000008280 blood Substances 0.000 description 2
- 239000013626 chemical specie Substances 0.000 description 2
- 238000005384 cross polarization magic-angle spinning Methods 0.000 description 2
- 238000001514 detection method Methods 0.000 description 2
- 230000004069 differentiation Effects 0.000 description 2
- 238000009826 distribution Methods 0.000 description 2
- KBQHZAAAGSGFKK-UHFFFAOYSA-N dysprosium atom Chemical compound [Dy] KBQHZAAAGSGFKK-UHFFFAOYSA-N 0.000 description 2
- 210000003743 erythrocyte Anatomy 0.000 description 2
- 238000002474 experimental method Methods 0.000 description 2
- 239000013020 final formulation Substances 0.000 description 2
- 150000002611 lead compounds Chemical class 0.000 description 2
- 239000007788 liquid Substances 0.000 description 2
- 125000002496 methyl group Chemical group [H]C([H])([H])* 0.000 description 2
- 239000002405 nuclear magnetic resonance imaging agent Substances 0.000 description 2
- 230000000144 pharmacologic effect Effects 0.000 description 2
- 238000001394 phosphorus-31 nuclear magnetic resonance spectrum Methods 0.000 description 2
- 238000004321 preservation Methods 0.000 description 2
- 238000002203 pretreatment Methods 0.000 description 2
- 238000012216 screening Methods 0.000 description 2
- 230000035945 sensitivity Effects 0.000 description 2
- OKTJSMMVPCPJKN-UHFFFAOYSA-N Carbon Chemical compound [C] OKTJSMMVPCPJKN-UHFFFAOYSA-N 0.000 description 1
- 238000000685 Carr-Purcell-Meiboom-Gill pulse sequence Methods 0.000 description 1
- YZCKVEUIGOORGS-OUBTZVSYSA-N Deuterium Chemical compound [2H] YZCKVEUIGOORGS-OUBTZVSYSA-N 0.000 description 1
- 238000004435 EPR spectroscopy Methods 0.000 description 1
- PXGOKWXKJXAPGV-UHFFFAOYSA-N Fluorine Chemical compound FF PXGOKWXKJXAPGV-UHFFFAOYSA-N 0.000 description 1
- 229910052688 Gadolinium Inorganic materials 0.000 description 1
- DGAQECJNVWCQMB-PUAWFVPOSA-M Ilexoside XXIX Chemical compound C[C@@H]1CC[C@@]2(CC[C@@]3(C(=CC[C@H]4[C@]3(CC[C@@H]5[C@@]4(CC[C@@H](C5(C)C)OS(=O)(=O)[O-])C)C)[C@@H]2[C@]1(C)O)C)C(=O)O[C@H]6[C@@H]([C@H]([C@@H]([C@H](O6)CO)O)O)O.[Na+] DGAQECJNVWCQMB-PUAWFVPOSA-M 0.000 description 1
- 208000037273 Pathologic Processes Diseases 0.000 description 1
- OAICVXFJPJFONN-UHFFFAOYSA-N Phosphorus Chemical group [P] OAICVXFJPJFONN-UHFFFAOYSA-N 0.000 description 1
- 230000009471 action Effects 0.000 description 1
- 239000004480 active ingredient Substances 0.000 description 1
- 239000003146 anticoagulant agent Substances 0.000 description 1
- 229940127219 anticoagulant drug Drugs 0.000 description 1
- 238000013459 approach Methods 0.000 description 1
- 230000031018 biological processes and functions Effects 0.000 description 1
- 210000000601 blood cell Anatomy 0.000 description 1
- ZOXJGFHDIHLPTG-IGMARMGPSA-N boron-11 atom Chemical compound [11B] ZOXJGFHDIHLPTG-IGMARMGPSA-N 0.000 description 1
- 238000009924 canning Methods 0.000 description 1
- 229910052799 carbon Inorganic materials 0.000 description 1
- 210000000170 cell membrane Anatomy 0.000 description 1
- 230000008859 change Effects 0.000 description 1
- 238000004040 coloring Methods 0.000 description 1
- 238000004624 confocal microscopy Methods 0.000 description 1
- 150000004696 coordination complex Chemical class 0.000 description 1
- 230000006378 damage Effects 0.000 description 1
- 230000001419 dependent effect Effects 0.000 description 1
- 229910052805 deuterium Inorganic materials 0.000 description 1
- 238000003745 diagnosis Methods 0.000 description 1
- 201000010099 disease Diseases 0.000 description 1
- 208000037265 diseases, disorders, signs and symptoms Diseases 0.000 description 1
- 238000004090 dissolution Methods 0.000 description 1
- 238000012362 drug development process Methods 0.000 description 1
- 235000013399 edible fruits Nutrition 0.000 description 1
- 238000000804 electron spin resonance spectroscopy Methods 0.000 description 1
- 230000008030 elimination Effects 0.000 description 1
- 238000003379 elimination reaction Methods 0.000 description 1
- 238000005516 engineering process Methods 0.000 description 1
- 230000005284 excitation Effects 0.000 description 1
- -1 for example Substances 0.000 description 1
- UIWYJDYFSGRHKR-UHFFFAOYSA-N gadolinium atom Chemical compound [Gd] UIWYJDYFSGRHKR-UHFFFAOYSA-N 0.000 description 1
- 229910001385 heavy metal Inorganic materials 0.000 description 1
- BHEPBYXIRTUNPN-UHFFFAOYSA-N hydridophosphorus(.) (triplet) Chemical compound [PH] BHEPBYXIRTUNPN-UHFFFAOYSA-N 0.000 description 1
- 229910052739 hydrogen Inorganic materials 0.000 description 1
- 150000002431 hydrogen Chemical class 0.000 description 1
- 239000001257 hydrogen Substances 0.000 description 1
- 230000001939 inductive effect Effects 0.000 description 1
- 230000010354 integration Effects 0.000 description 1
- 230000002452 interceptive effect Effects 0.000 description 1
- 150000002697 manganese compounds Chemical class 0.000 description 1
- 230000007246 mechanism Effects 0.000 description 1
- 230000037353 metabolic pathway Effects 0.000 description 1
- 230000004060 metabolic process Effects 0.000 description 1
- 239000002207 metabolite Substances 0.000 description 1
- 238000004452 microanalysis Methods 0.000 description 1
- 238000001208 nuclear magnetic resonance pulse sequence Methods 0.000 description 1
- 230000009054 pathological process Effects 0.000 description 1
- 230000007170 pathology Effects 0.000 description 1
- 239000008188 pellet Substances 0.000 description 1
- 230000010412 perfusion Effects 0.000 description 1
- 230000035699 permeability Effects 0.000 description 1
- 229910052698 phosphorus Inorganic materials 0.000 description 1
- 239000011574 phosphorus Substances 0.000 description 1
- 230000008569 process Effects 0.000 description 1
- 239000002534 radiation-sensitizing agent Substances 0.000 description 1
- 230000009467 reduction Effects 0.000 description 1
- 238000000926 separation method Methods 0.000 description 1
- 210000002966 serum Anatomy 0.000 description 1
- 229910052708 sodium Inorganic materials 0.000 description 1
- 239000011734 sodium Substances 0.000 description 1
- 239000001509 sodium citrate Substances 0.000 description 1
- NLJMYIDDQXHKNR-UHFFFAOYSA-K sodium citrate Chemical compound O.O.[Na+].[Na+].[Na+].[O-]C(=O)CC(O)(CC([O-])=O)C([O-])=O NLJMYIDDQXHKNR-UHFFFAOYSA-K 0.000 description 1
- 239000007787 solid Substances 0.000 description 1
- 238000009987 spinning Methods 0.000 description 1
- 239000000725 suspension Substances 0.000 description 1
- 238000012360 testing method Methods 0.000 description 1
- 229940124597 therapeutic agent Drugs 0.000 description 1
- 239000011800 void material Substances 0.000 description 1
- 238000005406 washing Methods 0.000 description 1
- 239000002023 wood Substances 0.000 description 1
Images



Classifications
-
- G—PHYSICS
- G01—MEASURING; TESTING
- G01N—INVESTIGATING OR ANALYSING MATERIALS BY DETERMINING THEIR CHEMICAL OR PHYSICAL PROPERTIES
- G01N24/00—Investigating or analyzing materials by the use of nuclear magnetic resonance, electron paramagnetic resonance or other spin effects
- G01N24/08—Investigating or analyzing materials by the use of nuclear magnetic resonance, electron paramagnetic resonance or other spin effects by using nuclear magnetic resonance
Definitions
- the present invention relates to a method for the in vitro quantitative determination of the cellular uptake of exogenous or endogenous substances by means of magnetic resonance techniques.
- Said method is particularly advantageous as it can be applied, substantially, to all types of samples including, for instance, human or animal cells, cells culture(s), tissue and organ cells, vegetal cells (including wood and fruits), part of trunks, leaves and food cells of both animal or vegetal origin.
- the possibility of determining the cellular uptake by derma cells may provide important data for the development of new cosmetic products possessing high performance and low collateral effects.
- the determination of the cellular uptake of EXOs can be useful to assess the exposure of vegetables to dangerous chemical products and, also, to get information about their preservation and care (see, as an example, the determination of the cellular uptake of EXOs by the trees of the big forests).
- this kind of determination is of utmost importance as it may provide important information for pharmaceutically active ingredients per se, for instance including effectiveness, bio-availability or toxicity thereof.
- cellular uptake represents one of the milestones on which the whole drug development process is based, starting from the identification of a lead compound, up to the final formulation of the drug ready for administration to human and/or animal beings.
- cellular uptake may also concern compounds which are void of any pharmacological property per se but, once administered, specifically accumulate into human or animal cells, its measurement is particularly important also in the field of diagnostics wherein cellular uptake is closely related to tissue and/or organ specificity of the CAs being used.
- the capability of obtaining reliable cellular-uptake measurements may represent the starting point for the development of new contrast agents able, for instance, to provide high contrast imaging at lower dosages.
- Radio-sensitizers to be used in PDT and NCT.
- cellular uptake provides for the accumulation of a given substance in the intra-cellular compartment.
- its determination effectively provides a mean to quantify the amount of said substance being entered into the cell.
- organ uptake provides for the accumulation of a given substance in the organ as a whole, it does not correspond, or necessarily correspond, to the mean cellular uptake. This is because a given substance may accumulate into the organ, for instance in its extra-cellular compartments, as a consequence of possible binding effects or interactions with the molecules being present on the external layer of the cellular membrane.
- the known methods being used in the determination of the cellular uptake of exogenous or endogenous substances may be conveniently grouped into two main categories: those requiring sample treatment (group A) and those not requiring sample treatment (Group B).
- Group A In principle, the methods belonging to this group can be used to measure the cellular uptake of all types of EXOs and ENDOs in any type of cell or tissue sample.
- the said methods usually enable to determine the total content of a given substance without differentiating on how this same substance is partitioned in the various CCs.
- the pre-treatment may consist in the separation of the cells from the extra-cellular fluid by means of several washing steps and subsequent centrifugation. This treatment can dramatically change the concentrations at equilibrium and break cells, or a relevant portion of them, with consequent perfusion of the intra-cellular fluid, or part of it, into the extra-cellular compartment.
- the cellular uptake of heavy metals including, for example, paramagnetic metals, free metal ions and metal complexes thereof, may be all determined by using this technique.
- EXO is a paramagnetic metal complex
- some known methods based on ESR spectroscopy (1) or MAS-NMR spectroscopy (2,3) may be used.
- the paramagnetic metal is gadolinium, in particular, the cellular uptake measurement can be also derived from the enhancement of the contrast in MR imaging (4).
- the above MAS-NMR technique has been applied to the determination of the permeability of human blood cells by Magnetic Resonance Imaging Contrast Agents (MRI-CAs), particularly polyamino polycarboxylic Gd based contrast agents.
- MRI-CAs Magnetic Resonance Imaging Contrast Agents
- This method comprises the use of a lanthanide complex able to produce a clearly detectable lanthanide induced shift (LIS) and a very weak relaxation (line broadening) on NMR signals of intra- and extra-cellular water protons.
- LIS clearly detectable lanthanide induced shift
- the rationale for this method relies on the complete isostructurality between the Gd-contrast agents (CA), which intra- or extra-cellular concentration has to be determined, and the lanthanide complex acting as shift agents (LIS agent).
- CA Gd-contrast agents
- LIS agent lanthanide complex acting as shift agents
- the cellular uptake measurement can be carried out through the observation of the line broadening of phosphorus signal in ATP 31 P-NMR spectra (5).
- MECM technique (6,7) can be used.
- ENDOs usually contain several organic chromophores, this technique may only find application in a limited number of situations.
- a method for the in vitro determination of cellular uptake of exogenous or endogenous substances in a cell sample comprises:
- cellular compartment is herewith intended to include every portion of the cell being delimitated by a membrane.
- exogenous substance we intend every substance not naturally occurring in a biological sample, that is to say not resulting from a natural biological process, also including pathological processes.
- Non limiting examples of exogenous substances according to the invention may thus include exogenous organic substances and exogenous metals or metal ions which NMR signals can be observed.
- Preferred exogenous substances according to the invention include, for instance, drugs for human and veterinary use, diagnostic and therapeutics agents, contrast agents for imaging techniques, radio-sensitizers for photodynamic and neutron capture therapy, pesticides including herbicides, fertilizers, food additives, preservatives, cosmetics, colorants, waste products, pollutants, and chemicals in general.
- exogenous substances are drugs and therapeutic agents, contrast agents for imaging techniques, radio-sensitizers for photodynamic and neutron capture therapy, pesticides, fertilizers, food additives, colorants, waste products, pollutants, and cosmetics.
- endogenous substance includes every substance resulting from normal or pathological biochemical processes of cells and tissues.
- Non-limiting examples of endogenous substances according to the invention may thus include any compound from natural metabolic pathways such as, for instance, natural carbohydrates, urea, lactate, citrate, acetate, carbonate, malonate, choline, creatine, phosphate, piruvate and natural amino acids.
- the present invention relates to a method for the in vitro determination of cellular uptake of exogenous substances (EXOs).
- the method of the invention enables the "non-invasive" measurement of the cellular uptake of a variety of substances in a wide range of in vitro samples, either in liquid or semisolid media, including strips of tissues or organs and even organs as a whole.
- non-invasive we rely to the fact that the in vitro sample is not treated or pre-treated or, alternatively, that any needed treatment or manipulation is particularly light and, hence, does not produce modifications of the concentration of the chemical species at equilibrium or modifications of the processes governing the cellular uptake.
- the method of the invention presents the remarkable advantage that the sample maintains as intact all of its biological functionalities.
- the measurement of a parameter directly linked to the absolute concentration of the analysed exogenous or endogenous substance in the different CCs guarantees high reliability and reproducibility of the obtained data, thus replacing the need for a large number of in vivo tests.
- the sensitivity of the measurements is the one typical for NMR spectroscopy: micromolar concentrations are required when medium strength magnetic fields are used and even sub-micromolar concentrations may suffice when high magnetic fields and cryogenic technology for probeheads are used.
- NMR spectra can be acquired in few minutes and, in addition, the experimental conditions being first tuned for the cellular uptake of a given substance may be conveniently adopted for determining the cellular uptake of other substances. This is because the experimental conditions are mainly dependent from the type of sample under consideration and, to a lesser extent, from the type of substance being tested.
- the method of the invention allows easy and fast measurements as well as a high level of standardization because, apart from not requiring complex sample treatment, it is based on a single technique that comprises MAS-NMR spectroscopy in combination with lanthanide SA.
- EXOs exogenous substances
- ENDOs endogenous substances
- the method of the invention comprises applying the so-called MAS-NMR spectroscopy in combination with Shift agents (SAs).
- SAs Shift agents
- MAS-NMR spectroscopy we mean the totality of pulse sequences which can be utilized to acquire NMR spectra with probehead designed for NMR measures with sample in fast spinning at the so-called "Magic Angle”.
- the combined application of MAS-NMR spectroscopy is the "tool" that consents an enlarged and, at the same time, efficacious use of the SAs as per the method of the invention to measure the cellular uptake of a wide range of substances, in a number of different in vitro samples, so making the method of the invention of general applicability.
- ENDO in the intra- and extra- CCs, are both detectable and well separated, to allow a reliable measure of their areas wherein this means that no overlapping can exist. Moreover, the said signals must be due to the 100% of the EXO (or ENDO) in the sample.
- the combined use of MAS technique according to the method of the invention allows an almost total cancellation of CSA and DDI effects that are generally responsible of the strong line width broadening. Accordingly, it allows the registration of NMR spectra having very sharp line widths, that, as above said, is the condition for a successful enlarged use of a SAs, i.e., of the general applicability of the method of the invention.
- the LIS effect of the EXO NMR signal is the consequence of the sole and direct interaction between SA and EXO, that is to say LIS effect only arises from a dipole-dipole interactions between SA and EXO and its magnitude decays with the square of the distance between SA and the substance interacting with it.
- the presence of the SA may only determine a shift of the NMR signal of a substance when this same substance is very close to the SA, i.e. when both EXO and SA stay in the same cellular compartment.
- the measured LIS is a quantity directly linked to the absolute concentration of the analysed EXO in the different CCs, and its value is proportional to the ratio between the EXO and
- BMS could give rise to LIS across the cellular membrane separating the different cellular compartments, i.e. a LIS effect would also exist between SA and EXO substances not staying in the same cellular compartment.
- MAS technique allows for a complete elimination of any anisotropic component of Bulk Magnetic Susceptibility shift and thus provides for an induced shift only when due to a direct interaction occurring between SA and EXO staying in the same CC.
- the EXO NMR signals may remain unchanged or, alternatively, may undergo to LIS. Then, in the case of EXO unshifted signals, EXO itself stays in CCs not shared or anyway occupied by the SA; on the contrary, in the case of EXO shifted signals, EXO occupies the same CCs of SA. Based on that, a direct measurement of the cellular uptake of the EXO may be thus obtained.
- step (1) above is carried out by:
- all of the substances containing a paramagnetic nucleus may suitably act as SA according to the method of the invention.
- SA including a lanthanide metal ion.
- lanthanide complexes wherein the ligand is selected from the group consisting of: EDTA (ethylenediaminetetracetic acid); PCTA (3,6,9,15-tetraazabicyclo-[9.3.1]-pentadeca-1(15)11,13-triene-3,6,9-tris (methane phosphonic) acid); BOPTA ((4RS)-[4-carboxy-5,8,11-tris (carboxymethyl)-1-phenyl-2-oxa-5,8,11-triazatridecan-13-oic acid]) or derivatives thereof; DTPA (diethylenetriamine pentaacetic acid) or derivatives thereof; DOTA (1,4,7,10-tetraazocyclo-dodecane-N,N',N",N"-tetraacetic acid) or derivatives thereof; DO3A (1,4,7,10-tetra azacyclododecane-1,4,7-triacetic acid) or derivative
- Preferred metal ions of the lanthanide group include: Ce 3+ ; Pr 3+ ; Nd 3+ ; Pm 3+ ; Sm 3+ ; Eu 3+ ; Tb 3+ ; Dy 3+ ; Ho 3+ ; Er 3+ ; Tm 3+ ; Yb 3+ .
- nucleus combination and its selection we intend the most suitable nucleus, among those of the EXO substance, being capable of providing an easily detectable EXO NMR signal and an equally easily detectable induced shift on that signal, by the action of the SA. Accordingly, preferred nuclei as per the method of the invention, are those allowing an easy detection of the EXO NMR signal by use of MAS-NMR technique.
- preferred nuclei when exogenous substances under investigation are available in a suitable isotopically enriched form, preferred nuclei may thus include 13 C and 15 N.
- preferred nuclei may include those which are not present in the natural biological samples such as fluorine-19, deuterium, and boron-11.
- SAs and nuclei combinations inducing the largest LIS EXO signals are those most suitable for use with the EXO under investigation.
- Said largest LIS EXO signal/s hereinafter referred to as marker EXO signal/s, has/have to be considered as preferred according to the invention.
- suitable SA for measuring EXO cellular uptake should be able to induce the largest LIS EXO signal of at least one of the EXO NMR signals (the marker EXO signal).
- SAs distributing in one Cellular Compartment only have to be considered as preferred because allowing easy calculations.
- step (2) above is carried out by:
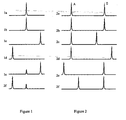
- the MAS-NMR spectra can show different situations, as per the enclosed Figures 1-3 (a detailed explanation of all of the enclosed figures is also reported before the experimental section).
- Trace a shows a marker EXO signal (in this case it is a single, one component signal) recorded in the absence of SA.
- Trace a shows a marker EXO signal having two (or many) components, in the absence of SA. These components may be due to the presence of the EXO in different CCs or to the fact that the EXO has two marker EXO signals, for example as a consequence of two different chemical specie such as isomers or conformers, or because of the possible interaction with endogenous substances, membrane and the like.
- step (b) it has been established that SA only stays in the extra-cellular compartment (o)
- EXO CCSA EXO O
- EXO CC ⁇ SA EXO i
- step (b) it has been found that SA only stays in the intra-cellular compartment (i)
- EXO CCSA EXO i
- FXO CC ⁇ SA EXO O .
- Trace a shows a marker EXO signal showing two (in general many) components in the absence of SA.
- the determination of the EXO compartmental concentration as per step (3) of the method of the invention is carried out according to the following possible situations.
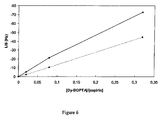
- the value of ⁇ EXO may be determined trough the graph of LIS EXO vs. ⁇ EXO . From [EXO CC ⁇ SA ], by knowing the volume of the CC, the amount of EXO CC ⁇ SA may be obtained.
- the said graph can be obtained by acquiring a series of MAS-NMR spectra of the known EXO under investigation in a medium as similar as possible to the one of the in vitro sample such as, for instance, a physiological solution or plasma, and by using different known [SA]. At each variation of [SA]/[EXO], LIS EXO signal is then measured.
- the method of the invention may be advantageously used in a variety of fields such as, for insctance:
- Figures 1 to 4 represent MAS-NMR spectra as per the method of the invention, in a variety of situations. More in particular,
- a given SA distributes into three different CCs (hereinafter named as CC1, and CC2) and three shifted marker EXO signals exist.
- the values of [SA CC1 ] [SA CC2 ] are known from previous step (b) of the method of the invention.
- the values of LIS EXO CC1 , and LIS ExO CC2 signals can be measured and by the graphs of LIS EXO signal vs. ⁇ EXO , the corresponding values of ⁇ EXO CC1 , ⁇ EXO CC2 , are obtained.
- the areas A 1 and A 2 of the two marker EXO signals can be measured by integration of the NMR spectrum.
- EXO Acetylsalicylic acid
- SA Dy-BOPTA (Dy is the symbol of Dysprosium, one of the lanthanides known as shift agent).
- the nucleus used to determine Acetylsalicylic acid cellular uptake is the proton.
- the in vitro determination has been performed on HRBC obtained by human blood treated as described below.
- Centrifugation the employed centrifuge was HERAEUS SEPATECH OMNIFUGE 2 ORS, rotor model 3360. Centrifugation was done at 2109 g (equivalent to 3500 rpm) at 4°C for 15 minutes.
- Dy-BOPTA stock solution a 0.1 M stock solution of Dy-BOPTA was used in all of the measurement to obtain the suitable [SA].
- Acetylsalicylic acid stock solution a 1M stock solution of ASA containing 0.1 M of DSS (as internal standard for quantitative determination), was used in all of the measurements.
- the solution was prepared by dissolving 180.16 mg of ASA and 23,63 mg of DSS in 200ul of H2O, adding NaOH 2N until dissolution, lowering, if necessary, the pH to 7 with HCl 1N, then filling the volume to 1 ml. In this way two forms of ASA are generated that are below indicated as A and B.
- Acetylsalicylic acid in HRBC a sample containing 1 ml of HRBC (80% hematocrit), 100 ⁇ moles of acetylsalicylic acid (i.e. 100 ⁇ l of acetylsalicylic acid stock solution) and 8 ⁇ moles of Dy-BOPTA (i.e. 80 ⁇ l of Dy-BOPTA stock solution) was employed to measure the uptake of acetylsalicylic acid in HRBC.
- Dy-BOPTA employed in the present experiment has been selected from other Dysprosium chelates as preferred SA because it is known from the literature that it does not penetrate into HRBC (2).
- Proton spectra have been employed to determine acetylsalicylic acid cellular uptake, because 1 H is the sole nucleus present in acetylsalicylic acid having a high NMR sensitivity.
- the 1 H NMR spectra of acetylsalicylic acid in water showed two signals (A and B), in correspondence to the methyl group, as per the enclosed Figure 5 . This case is similar to the one shown in Figure 2 trace a . Both of the two signals are marker EXO signals.
- a e B into intra- and extra-cellular compartments, respectively.
- Acetylsalicylic acid corresponding to the unshifted marker EXO signals is
- ACETYLSALICYLIC ACID CC ⁇ SA i.e. acetylsalicylic acid in the intra-cellular compartment.
- acetylsalicylic acid corresponding to the shifted marker EXO signals is ACETYLSALICYLIC ACID CCSA , i.e. acetylsalicylic acid in the extra-cellular compartment.
- the ratio between the areas of the two sets of peaks directly gives the ratio between acetylsalicylic acid in the two cellular compartments for each type A and B. Since the volume of the two cellular compartments can be calculated, it is possible to obtain the absolute amounts of acetylsalicylic acid in the two cellular compartments.
Landscapes
- Physics & Mathematics (AREA)
- High Energy & Nuclear Physics (AREA)
- Health & Medical Sciences (AREA)
- Life Sciences & Earth Sciences (AREA)
- Chemical & Material Sciences (AREA)
- Analytical Chemistry (AREA)
- Biochemistry (AREA)
- General Health & Medical Sciences (AREA)
- General Physics & Mathematics (AREA)
- Immunology (AREA)
- Pathology (AREA)
- Investigating Or Analysing Materials By Optical Means (AREA)
- Investigating Or Analysing Biological Materials (AREA)
- Other Investigation Or Analysis Of Materials By Electrical Means (AREA)
Abstract
Description
- The present invention relates to a method for the in vitro quantitative determination of the cellular uptake of exogenous or endogenous substances by means of magnetic resonance techniques.
- Said method is particularly advantageous as it can be applied, substantially, to all types of samples including, for instance, human or animal cells, cells culture(s), tissue and organ cells, vegetal cells (including wood and fruits), part of trunks, leaves and food cells of both animal or vegetal origin.
- For sake of clarity and conciseness, a list of the abbreviations/acronyms most frequently used within the present description is herewith enclosed.
- ASA
- Aetilsalycilic acid
- BMS
- Bulk Magnetic Susceptibility
- CA/s
- Contrast Agent/Agents
- CC/s
- Cellular Compartment/Compartments
- CC≠SA
- Cellular compartment in which the SA is not present
- CCSA
- Cellular compartment in which the SA is present
- CP-MAS
- Cross Polarization Magic-Angle-Spinning
- CSA
- Chemical Shift Anisotropy
- DDI
- Dipole-Dipole Interaction
- DSS
- 2,2-dimethyl-2-silapentane-5-sulfonate
- ENDO/s
- Endogenous naturally occurring substance/substances
- ESR
- Electron Spin Resonance
- EXO/s
- Exogenous substance/substances
- EXOo
- EXO substance present in extra-cellular compartment
- EXOi
- EXO substance present in intra-cellular compartment
- HRBC
- Human Red Blood Cells
- HR-MAS
- High Resolution Magic-Angle-Spinning
- LIS
- Lanthanide Induced Shift
- LISENDO
- Lanthanide Induced Shift of Endogenous substance (signal/signals)
- LISEXO
- Lanthanide Induced Shift of Exogenous substance (signal/signals)
- LISo
- Lanthanide Induced Shift for substance in the extra-cellular compartment
- LISi
- Lanthanide Induced Shift for substance in the intra-cellular compartment
- MAS-NMR
- Magic-Angle-Spinning Nuclear Magnetic Resonance
- MECM
- Multi-photon Excitation Confocal Microscopy
- MR
- Magnetic Resonance
- NCT
- Neutron Capture Therapy
- PDT
- Photodynamic Therapy
- SA/s
- Shift Agent/Agents
- SEM
- Scanning Electronic Microscope
- ρENDO
- [SA]/[ENDO], i.e. it represents the ratio: SA concentration to ENDO concentration
- ρEXO
- [SA]/[EXO], i.e. it represents the ratio: SA concentration to EXO concentration
- [ ]
- molar concentration
- [a]
- molar concentration of substance a
- Bibliographic references included in the description by means of numbers in brackets are also reported in the paragraph entitled "References".
- It is well-known in the art that the quantitative determination of cellular uptake may provide valuable data and information concerning, for instance, bio-availability, effectiveness, resistance and toxicity, of a variety of exogenous or endogenous substances.
- In the field of cosmetics, for instance, the possibility of determining the cellular uptake by derma cells may provide important data for the development of new cosmetic products possessing high performance and low collateral effects.
- In botanics, likewise, the determination of the cellular uptake of EXOs can be useful to assess the exposure of vegetables to dangerous chemical products and, also, to get information about their preservation and care (see, as an example, the determination of the cellular uptake of EXOs by the trees of the big forests).
- When considering the medical field, in addition, this kind of determination is of utmost importance as it may provide important information for pharmaceutically active ingredients per se, for instance including effectiveness, bio-availability or toxicity thereof.
- In this respect, cellular uptake represents one of the milestones on which the whole drug development process is based, starting from the identification of a lead compound, up to the final formulation of the drug ready for administration to human and/or animal beings.
- Moreover, as cellular uptake may also concern compounds which are void of any pharmacological property per se but, once administered, specifically accumulate into human or animal cells, its measurement is particularly important also in the field of diagnostics wherein cellular uptake is closely related to tissue and/or organ specificity of the CAs being used.
- According to this latter aspect, as tissue/organ specificity is usually connected with both effectiveness and toxicity of these CAs, the capability of obtaining reliable cellular-uptake measurements may represent the starting point for the development of new contrast agents able, for instance, to provide high contrast imaging at lower dosages.
- Substantial analogous considerations apply for radio-sensitizers to be used in PDT and NCT.
- Despite the fact that cellular uptake and organ uptake can be somehow confused, they relate to two different kinds of uptake.
- In this respect, cellular uptake provides for the accumulation of a given substance in the intra-cellular compartment. As such, its determination effectively provides a mean to quantify the amount of said substance being entered into the cell.
- On the other side, as organ uptake provides for the accumulation of a given substance in the organ as a whole, it does not correspond, or necessarily correspond, to the mean cellular uptake. This is because a given substance may accumulate into the organ, for instance in its extra-cellular compartments, as a consequence of possible binding effects or interactions with the molecules being present on the external layer of the cellular membrane.
- From all of the above, there is the need of a robust and reliable method for the in vitro measurement or determination of the cellular uptake of exogenous or endogenous substances in a variety of samples.
- In this respect, it should be clear to the skilled person that the said method should find general applicability and preferably rely on the quantitative determination of a given parameter directly linked to the cellular uptake per se, so as to provide a direct measurement of it.
- In addition, it should not require sample manipulation so as to avoid as much as possible changes in the concentration of the species at equilibrium or modifications of the functionality of the cellular membrane and of its integrity.
- According to our knowledge, the methods currently known in the art do not fulfil all of these requirements.
- The known methods being used in the determination of the cellular uptake of exogenous or endogenous substances may be conveniently grouped into two main categories: those requiring sample treatment (group A) and those not requiring sample treatment (Group B).
- Group A In principle, the methods belonging to this group can be used to measure the cellular uptake of all types of EXOs and ENDOs in any type of cell or tissue sample.
- The said methods usually enable to determine the total content of a given substance without differentiating on how this same substance is partitioned in the various CCs.
- These methods are based, essentially, on chemical and chemico-physical analytical techniques requiring a sample pre-treatment, aimed to separate the intra-cellular fluid from the rest of the sample, which may vary according to the technique being used and to the type of sample being tested.
- Anyway, whichever the treatment is, it generally produces modifications of the cellular system with consequent changes in the concentration of the species present in the cellular compartments at equilibrium, and/or changes of the mechanisms governing the transport of substances across the cellular membrane. Despite any possible misleading result, these effects may thus contribute to render the sample under analysis no more representative of the reality.
- When cells are cultured in liquid phrase, for instance, the pre-treatment may consist in the separation of the cells from the extra-cellular fluid by means of several washing steps and subsequent centrifugation. This treatment can dramatically change the concentrations at equilibrium and break cells, or a relevant portion of them, with consequent perfusion of the intra-cellular fluid, or part of it, into the extra-cellular compartment.
- On the other hand, when cells are cultured on semisolid or solid matrix, an even worst situation can occur because of the vigorous treatment needed to free the cells from the matrix itself. Under these conditions, changes of the concentrations of the species at equilibrium and modifications of cellular membrane functionality and integrity, during sample preparation, are almost inevitable.
- The above is even more evident in the case of cell agglomerates or strips of tissues wherein treatments may be particularly drastic and invasive as they are directed to obtain isolated cells through tissutal matrix destruction.
- Because of the above drawbacks, the determination of the cellular uptake according to the methods of group A do not appear to provide a reliable representation of the cellular uptake occurred in the original, untreated sample.
- Group B Despite the fat that these methods have the common advantage of not requiring the above sample treatments, they are applicable to a few specific substances only. In fact, if the EXO (or ENDO) under determination is a substance containing atoms different from those naturally occurring inside the cells, that is atoms other than hydrogen, carbon, nitrogen, sodium and the like, its concentration inside the cell may be determined by use of a Scanning Electronic Microscope combined with micro-analysis, according to known techniques. However, as most of EXOs and ENDOs are organic molecules, their cellular uptake cannot be measured in this way.
- On the contrary, the cellular uptake of heavy metals including, for example, paramagnetic metals, free metal ions and metal complexes thereof, may be all determined by using this technique.
- If the EXO is a paramagnetic metal complex, some known methods based on ESR spectroscopy (1) or MAS-NMR spectroscopy (2,3) may be used. When the paramagnetic metal is gadolinium, in particular, the cellular uptake measurement can be also derived from the enhancement of the contrast in MR imaging (4).
- The above MAS-NMR technique has been applied to the determination of the permeability of human blood cells by Magnetic Resonance Imaging Contrast Agents (MRI-CAs), particularly polyamino polycarboxylic Gd based contrast agents. This method comprises the use of a lanthanide complex able to produce a clearly detectable lanthanide induced shift (LIS) and a very weak relaxation (line broadening) on NMR signals of intra- and extra-cellular water protons. The rationale for this method relies on the complete isostructurality between the Gd-contrast agents (CA), which intra- or extra-cellular concentration has to be determined, and the lanthanide complex acting as shift agents (LIS agent). In other words, as both CA and LIS agent are supposed to show a very similar behaviour (because of their isostructurality), the actual determinations of where the LIS agent is, i.e. its exact intra- or extra-cellular concentration, are deemed to substantially correspond to where the CA would be and to the CA intra- or extra-cellular concentration, respectively.
- As formerly indicated, however, the above method only provides for the determination of the cellular uptake of paramagnetic complexes and, hence, it cannot be applied to the determination of any different substance.
- If the EXO is a manganese compound, the cellular uptake measurement can be carried out through the observation of the line broadening of phosphorus signal in ATP 31P-NMR spectra (5).
- If the EXO under examination provides for a fluorescent spectrum well distinguishable from those produced by naturally occurring substances, i.e. endogenous substances inside the sample, MECM technique (6,7) can be used. However, as ENDOs usually contain several organic chromophores, this technique may only find application in a limited number of situations.
- In the case of some endogenous organic metabolites (11), water (12) and free metal ion substances, for instance Na+, K+, Li+ and the like, a method based on SAs and NMR techniques (8,9,10) has been used to measure the concentration ratio between intra- and extra-cellular content. Nevertheless, despite the fact that the said concentration ratio is known to be related to the cellular uptake, the above method cannot quantify the single compartmental concentration of these substances.
- Moreover, as it does not imply the use of MAS technique, it is not able to address the problems related to the presence of Chemical shift anisotropy, Dipole-Dipole Interactions and BMS as well as problems deriving from any possible overlapping between nuclei signals normally occurring into biological samples and from an incomplete differentiation of the signal with respect to the spectrum base line, i.e. an incomplete "NMR visibility" of the signal.
- From all of the above, it appears that the reliability of the obtained measures according to the methods of Group B is insufficient in most of the cases. Importantly, no standardized methodologies can be considered for the methods of group B as too many variables apply including, for instance, the nature of the sample, its handling and the substance under investigation.
- Moreover, known in vitro methods of both groups A and B appear to be time consuming and thus imply high costs, mainly because of the huge amount of work needed for the tuning of the method and/or for sample preparation.
- Alternative approaches for instance comprising the in vivo determination of cellular uptake have been also disclosed. In this respect, although in vivo data are currently considered the "gold standard", their reliability is not yet doubt-free as given experiments have shown relevant drawbacks due to long experimental times, high costs mainly due to animals stabling and handling and, also, ethical issues.
- Therefore, there is still the need for a reliable and fast method of general applicability enabling the determination of the cellular-uptake for a wide number of substances, in a variety of samples.
- We have now found a method for assessing the cellular uptake of exogenous or endogenous substances that, advantageously, does not present any of the aforementioned drawbacks.
- Therefore, it is a first object of the present invention a method for the in vitro determination of cellular uptake of exogenous or endogenous substances in a cell sample, which method comprises:
- A method for the in vitro determination of cellular uptake of exogenous or endogenous substances in a cell sample, which method comprises:
- 1) selecting a suitable shift agent (SA) and nucleus combination for the measurement of cellular uptake of the exogenous or endogenous substance under investigation, through MAS-NMR spectroscopy;
- 2) determining the cellular compartment/s (CC/s) in which said exogenous or endogenous substance distributes, through MAS-NMR spectroscopy, wherein determination is carry out by:
- 2a) acquiring the MAS-NMR spectrum of the in vitro sample containing the exogenous or endogenous substance under investigation and determining the markerEXO or markerENDO signal/s;
- 2b) adding a suitable amount of the selected SA to the above in vitro sample, so as to induce a significant LIS of markerEXO or of markerENDO signal/s, and re-acquiring the same MAS-NMR spectrum; and
- 2c) comparing the markerEXO or the markerENDO signal/s of steps (2a) and (2b) and determining in which Cellular Compartment the exogenous or endogenous substance is present;
and - 3) measuring the compartmental concentration of the said exogenous or
- In the present description, unless otherwise provided, with the term cellular uptake of a given substance we intend the quantisation of the amount of substance entered into the cell, that is to say penetrated into the cell across the cell membrane, independently from its stay in one or more of the cellular compartments.
- Unless otherwise indicated, the term "cellular compartment" is herewith intended to include every portion of the cell being delimitated by a membrane.
- In the present description, unless otherwise provided, with the term exogenous substance we intend every substance not naturally occurring in a biological sample, that is to say not resulting from a natural biological process, also including pathological processes.
- Non limiting examples of exogenous substances according to the invention may thus include exogenous organic substances and exogenous metals or metal ions which NMR signals can be observed.
- Preferred exogenous substances according to the invention include, for instance, drugs for human and veterinary use, diagnostic and therapeutics agents, contrast agents for imaging techniques, radio-sensitizers for photodynamic and neutron capture therapy, pesticides including herbicides, fertilizers, food additives, preservatives, cosmetics, colorants, waste products, pollutants, and chemicals in general.
- Even more preferred exogenous substances are drugs and therapeutic agents, contrast agents for imaging techniques, radio-sensitizers for photodynamic and neutron capture therapy, pesticides, fertilizers, food additives, colorants, waste products, pollutants, and cosmetics.
- Unless otherwise indicated, in the present description the term endogenous substance includes every substance resulting from normal or pathological biochemical processes of cells and tissues. Non-limiting examples of endogenous substances according to the invention may thus include any compound from natural metabolic pathways such as, for instance, natural carbohydrates, urea, lactate, citrate, acetate, carbonate, malonate, choline, creatine, phosphate, piruvate and natural amino acids.
- According to a preferred embodiment, the present invention relates to a method for the in vitro determination of cellular uptake of exogenous substances (EXOs).
- The method of the invention enables the "non-invasive" measurement of the cellular uptake of a variety of substances in a wide range of in vitro samples, either in liquid or semisolid media, including strips of tissues or organs and even organs as a whole.
- In the present description, unless otherwise provided, with the term "non-invasive" we rely to the fact that the in vitro sample is not treated or pre-treated or, alternatively, that any needed treatment or manipulation is particularly light and, hence, does not produce modifications of the concentration of the chemical species at equilibrium or modifications of the processes governing the cellular uptake.
- As a result, the method of the invention presents the remarkable advantage that the sample maintains as intact all of its biological functionalities.
- In addition, the measurement of a parameter directly linked to the absolute concentration of the analysed exogenous or endogenous substance in the different CCs guarantees high reliability and reproducibility of the obtained data, thus replacing the need for a large number of in vivo tests.
- Moreover, the sensitivity of the measurements is the one typical for NMR spectroscopy: micromolar concentrations are required when medium strength magnetic fields are used and even sub-micromolar concentrations may suffice when high magnetic fields and cryogenic technology for probeheads are used. And also, NMR spectra can be acquired in few minutes and, in addition, the experimental conditions being first tuned for the cellular uptake of a given substance may be conveniently adopted for determining the cellular uptake of other substances. This is because the experimental conditions are mainly dependent from the type of sample under consideration and, to a lesser extent, from the type of substance being tested.
- Accordingly, the method of the invention allows easy and fast measurements as well as a high level of standardization because, apart from not requiring complex sample treatment, it is based on a single technique that comprises MAS-NMR spectroscopy in combination with lanthanide SA.
- For a better understanding of the invention, the following technical details are now given.
- For ease of reference, they are specifically addressed to the exogenous substances (EXOs) only but they are applicable as well to the endogenous substances (ENDOs).
- As formerly indicated, the method of the invention comprises applying the so-called MAS-NMR spectroscopy in combination with Shift agents (SAs).
- With the term MAS-NMR spectroscopy we mean the totality of pulse sequences which can be utilized to acquire NMR spectra with probehead designed for NMR measures with sample in fast spinning at the so-called "Magic Angle".
- The combined application of MAS-NMR spectroscopy, in particular, is the "tool" that consents an enlarged and, at the same time, efficacious use of the SAs as per the method of the invention to measure the cellular uptake of a wide range of substances, in a number of different in vitro samples, so making the method of the invention of general applicability.
- The use of a SA for cellular uptake measurements, in fact, is based on and may only be advantageously applied when the signals of interest, corresponding to the given EXO (or
- ENDO) in the intra- and extra- CCs, are both detectable and well separated, to allow a reliable measure of their areas wherein this means that no overlapping can exist. Moreover, the said signals must be due to the 100% of the EXO (or ENDO) in the sample.
- This means that the whole signal has to be completely detectable, "visible", with respect the spectrum base line.
- The combined use of MAS technique according to the method of the invention allows an almost total cancellation of CSA and DDI effects that are generally responsible of the strong line width broadening. Accordingly, it allows the registration of NMR spectra having very sharp line widths, that, as above said, is the condition for a successful enlarged use of a SAs, i.e., of the general applicability of the method of the invention.
- Moreover, the use of MAS technique as per the present invention consents an almost complete reduction of the undetectable signal amount, that is to say of the "not visible"
- NMR signal, so providing for an improved reliability of obtained results.
- Importantly, according to the method of the invention the LIS effect of the EXO NMR signal is the consequence of the sole and direct interaction between SA and EXO, that is to say LIS effect only arises from a dipole-dipole interactions between SA and EXO and its magnitude decays with the square of the distance between SA and the substance interacting with it.
- In other words, in the method of the invention the presence of the SA may only determine a shift of the NMR signal of a substance when this same substance is very close to the SA, i.e. when both EXO and SA stay in the same cellular compartment. In this case, the measured LIS is a quantity directly linked to the absolute concentration of the analysed EXO in the different CCs, and its value is proportional to the ratio between the EXO and
- SA concentrations, hereinafter indicated as ρEXO=[SA]/[EXO].
- However, as the above equation, as said, correctly applies only when the observed LIS effect is only due to a direct dipole-dipole interactions occurring between SA and EXO staying in the same cellular compartment, it is necessary that any anisotropic component of Bulk Magnetic Susceptibility (BMS) must be totally cancelled.
- As reported in the literature (13-16), in fact, BMS could give rise to LIS across the cellular membrane separating the different cellular compartments, i.e. a LIS effect would also exist between SA and EXO substances not staying in the same cellular compartment.
- The use of MAS technique according to the method of the invention allows for a complete elimination of any anisotropic component of Bulk Magnetic Susceptibility shift and thus provides for an induced shift only when due to a direct interaction occurring between SA and EXO staying in the same CC.
- Moreover, as above said, by means of MAS technique the NMR lineshape in biological samples results much sharper than that in spectra obtained without MAS, thus allowing for a better differentiation between signals and optimal detection of LIS induced by SA on the EXO signals.
- From all of the above, after the addition of SA to the sample, the EXO NMR signals may remain unchanged or, alternatively, may undergo to LIS. Then, in the case of EXO unshifted signals, EXO itself stays in CCs not shared or anyway occupied by the SA; on the contrary, in the case of EXO shifted signals, EXO occupies the same CCs of SA. Based on that, a direct measurement of the cellular uptake of the EXO may be thus obtained.
- Interestingly, whether unshifted and shifted EXO NMR signals exist in the same sample, the ratio between the areas of both signals directly provides for the distribution ratio of the EXO between the CCs, thus allowing a direct measurement of the EXO cellular uptake.
- According to the method of the invention, step (1) above is carried out by:
- a) identifying a set of possible SA candidates for said SA and nucleus combination, on the basis of the LIS produced on at least one NMR signal belonging to said EXO;
- b) identifying a set of possible candidates for said SA, on the basis of the CC/s in which they distribute; and
- c) selecting said SA and nucleus combination, on the basis of the information gathered from steps (a) and (b).
- In principle, all of the substances containing a paramagnetic nucleus may suitably act as SA according to the method of the invention. Particularly preferred, however, are SA including a lanthanide metal ion.
- Even more preferred are lanthanide complexes wherein the ligand is selected from the group consisting of: EDTA (ethylenediaminetetracetic acid); PCTA (3,6,9,15-tetraazabicyclo-[9.3.1]-pentadeca-1(15)11,13-triene-3,6,9-tris (methane phosphonic) acid); BOPTA ((4RS)-[4-carboxy-5,8,11-tris (carboxymethyl)-1-phenyl-2-oxa-5,8,11-triazatridecan-13-oic acid]) or derivatives thereof; DTPA (diethylenetriamine pentaacetic acid) or derivatives thereof; DOTA (1,4,7,10-tetraazocyclo-dodecane-N,N',N",N""-tetraacetic acid) or derivatives thereof; DO3A (1,4,7,10-tetra azacyclododecane-1,4,7-triacetic acid) or derivatives thereof; DOTP (1,4,7,10-tetraazacyclododecane-1,4,7,10-tetrakis (methane phosphonic) acid or derivatives thereof; ([3β(R),5β,12α]-3-[[4-[bis[2-bis(carboxymethyl)amino]-ethyl]amino]-4-carboxy-1-oxobutyl]amino]-12-hydroxycholan-24-oic acid).
- Preferred metal ions of the lanthanide group include: Ce3+; Pr3+; Nd3+; Pm3+; Sm3+; Eu3+; Tb3+; Dy3+; Ho3+; Er3+; Tm3+; Yb3+.
- When referring to nucleus combination and its selection we intend the most suitable nucleus, among those of the EXO substance, being capable of providing an easily detectable EXO NMR signal and an equally easily detectable induced shift on that signal, by the action of the SA. Accordingly, preferred nuclei as per the method of the invention, are those allowing an easy detection of the EXO NMR signal by use of MAS-NMR technique.
- Usually, proton and phosphorous do not represent the better choice as 1H-NMR and 31P-NMR spectra of biological samples frequently show strong overcrowding and peaks overlapping, due to various interfering substances naturally occurring in the sample.
- As an example, when exogenous substances under investigation are available in a suitable isotopically enriched form, preferred nuclei may thus include 13C and 15N.
- More generally, however, preferred nuclei may include those which are not present in the natural biological samples such as fluorine-19, deuterium, and boron-11.
- To identify the most suitable set of SAs and nuclei combination for the quantitative determination of the cellular uptake of a given EXO, the said EXO is dissolved in D2O and, by employing a variety of combinations of different SAs with different nuclei and by varying the ratio ρEXO = [SA]/[EXO], LISEXO signals are thus measured.
- SAs and nuclei combinations inducing the largest LISEXO signals are those most suitable for use with the EXO under investigation. Said largest LISEXO signal/s, hereinafter referred to as markerEXO signal/s, has/have to be considered as preferred according to the invention.
- To carry out the method of the invention it is necessary to know with a high degree of precision, at priori or by experimental measures, the concentration of SA into the different Cellular Compartments (i.e., [SA]CC).
- If experimental measurements are required, any one of the methods known in the art and concerning paramagnetic complexes can be used (see, as a reference, any of the aforementioned methods listed in Group B).
- When using the method based on MAS-NMR spectroscopy (2,3), in particular, all of the steps 1-3 of the method of the invention may be experimentally carried out by using this same technique.
- In principle, suitable SA for measuring EXO cellular uptake should be able to induce the largest LISEXO signal of at least one of the EXO NMR signals (the markerEXO signal). Although not mandatory, SAs distributing in one Cellular Compartment only have to be considered as preferred because allowing easy calculations. By combining the results obtained from previous steps (a) and (b) it is thus possible to select the optimal SA and nucleus combination. Frequently, however, the chosen combination may just represent the best compromise among the different indications resulting from steps (a) and (b).
- According to the method of the invention, step (2) above is carried out by:
- d) acquiring the MAS-NMR spectrum of the in vitro sample containing the EXO under investigation and determining the markerEXO signal/s;
- e) adding a suitable amount of the selected SA to the above in vitro sample, so as to induce a significant LIS of markerEXO signal/s, and re-acquiring the same MAS-NMR spectrum; and
- f) comparing the markerEXO signal/s of steps (d) and (e) and determining in which Cellular Compartment the EXO is present.
- The MAS-NMR spectra can show different situations, as per the enclosed
Figures 1-3 (a detailed explanation of all of the enclosed figures is also reported before the experimental section). - The use of a preferred SA staying in one of the CCs only is represented in
Figures 1 and 2 . - Trace a shows a markerEXO signal (in this case it is a single, one component signal) recorded in the absence of SA.
- Following the addition of SA:
- the markerEXO signal remains unchanged (trace b). In this case all of EXO stays in a CC different from that in which SA stays, i.e. all of the EXO is EXOCC≠SA;
- the markerEXO signal remains as a single peak but shifts with respect to the original position (traces c or d). In this case the EXO and SA stay in the same CC, i.e. all of the EXO is EXOCCSA;
- the markerEXO signal splits in at least two components (traces e or f). The EXO corresponding to the shifted signal is EXOCCSA whilst the EXO corresponding to the unshifted signal is EXOCC≠SA. The ratio between the areas of the two signals is proportional to the ratio between [EXOCCSA] and [EXOCC≠SA].
- It is worth noting that situations corresponding to trace e or f may appear as per the situation of trace b. This may happen when the LIS of markerEXO signal is too small, i.e. insufficient to separate the EXOCCSA signal from the one due to the EXOCC≠SA.
- Therefore, in the case of spectra like the one of trace b, it may be convenient to add an additional amount of SA to the sample, so as to check the optional existence of two or more overlapping signals.
- Trace a shows a markerEXO signal having two (or many) components, in the absence of SA. These components may be due to the presence of the EXO in different CCs or to the fact that the EXO has two markerEXO signals, for example as a consequence of two different chemical specie such as isomers or conformers, or because of the possible interaction with endogenous substances, membrane and the like.
- Following the addition of SA:
- each markerEXO signal remains unchanged (trace b). In this case the EXO stays in CCs different from that where SA stays, i.e. all of the EXO is EXOCC≠SA;
- some markerEXO signals remain unchanged whilst other shift: signal A shifts while signal B remain unchanged (trace c and d) or vice-versa (traces e and f). In this case the shifted signals correspond to EXOCCSA whilst the other correspond to EXOCC≠SA;
- all of the markerEXO signals shift. In this case all of the EXO is EXOCCSA.
- It is worth noting that situations corresponding to trace c-f may appear as per the situation of trace b. This may happen when the LIS of markerEXO signal is too small, i.e. insufficient to separate the EXOCCSA signal from the one due to the EXOCC≠SA.
- Therefore, in the case of spectra like the one of trace b, it may be convenient to add an additional amount of SA to the sample, so as to check the optional existence of two or more overlapping signals.
- From all of the above, if in step (b) it has been established that SA only stays in the extra-cellular compartment (o), it is possible to affirm that EXOCCSA= EXOO and EXOCC≠SA = EXOi . Vice-versa, if in step (b) it has been found that SA only stays in the intra-cellular compartment (i), it is possible to affirm that EXOCCSA= EXOi and FXOCC≠SA = EXOO.
- The use of a preferred SA being shared among many compartments is reported in
figures 3 and 4 . - Trace a shows a markerEXO signal, showing only one component, in the absence of SA. Following the addition of SA:
- the markerEXO signal remains unchanged (trace b). In this case the EXO stays in one or more CC/s anyway different from the one where SA stays. The EXO is all EXOCC≠SA;
- the markerEXO signal shifts (traces c - d). In this case the EXO is all EXOCCSA; and SA stays in one CC only (or in different CCs in case markerEXO are isochronous);
- the markerEXO signal shifts and the peak marked with an asterisk (*) remains unshifted (traces e -f). In this case the shifted signals correspond to EXOCCSA and signal (*) correspond to EXOCC≠SA;
- the markerEXO signal splits into two or more components and peak (*) remains unshifted (traces g - h). In this case the shifted signals correspond to EXOCCSA and signal (*) corresponds to EXOCC≠SA.
- Trace a shows a markerEXO signal showing two (in general many) components in the absence of SA.
- Following the addition of SA:
- the markerEXO signals remain unchanged (trace b). In this case the EXO stays in one or more CC different from that where SA stays. The EXO is all EXOCC≠SA;
- one signal remains unchanged whilst the other shifts (trace c, d, e, f). It may also occur that the shifted signal splits into two or more components. The shifted signals correspond to EXOCCSA and the unshifted signal corresponds to EXOCC≠SA;
- all of the signals shift (trace g, h). In this case all of the EXO is EXOCCSA.
- Since the CCs where SA distributes are known, upon comparison between the markerEXO signal/s in the absence and in the presence of SA, the CC/s where EXO stays may be also determined.
- The determination of the EXO compartmental concentration as per step (3) of the method of the invention is carried out according to the following possible situations.
- if all of the EXO is EXOCC≠SA (as per
Figures 1 b; 2b; 3b; 4b), [EXOCC≠SA] is obtained by considering the amount of EXO being added to the sample and the volume of the CC where EXO stays [CC is known from former step (b)]. - The values of [EXOCC≠SA] may also be determined by use of the equation ρEXO = [SA]/[EXO], because [SA]CC can be known. The value of ρEXO may be determined trough the graph of LISEXO vs. ρEXO. From [EXOCC≠SA], by knowing the volume of the CC, the amount of EXOCC≠SA may be obtained.
- The said graph can be obtained by acquiring a series of MAS-NMR spectra of the known EXO under investigation in a medium as similar as possible to the one of the in vitro sample such as, for instance, a physiological solution or plasma, and by using different known [SA]. At each variation of [SA]/[EXO], LISEXO signal is then measured.
- if all of the EXO is EXOCCSA and SA stays in one CC only (as per
Figures 1 c; 1d; 2c; 2d), the two methods just disclosed for the determination of [EXOCC≠SA] may also be suitably applied for the determination of [EXOCCSA] and the amount of EXOCCSA. - if EXO is partitioned as EXOCCSA and EXOCC≠SA, SA stays in one CC only (as per
Figures 1 e; 1f; 2e; 2f) and the amount of EXO added to the sample is known, the ratio between the area of the peaks, corresponding to EXOCCSA and EXOCC≠SA, just supplies the ratio [EXOCCSA]/[EXOCC≠SA]. In this case, if the volume of at least one of the CCs is know, the amounts of [EXOCCSA] and [EXOCC≠SA] result thus determined. On the contrary, if CCs volumes are not know, [EXOCCSA] can be determined as described in the previous case, by using LISEXO signal vs. ρEXO and, consequently, also [EXOCC≠SA] results to be determined. - if EXO and SA distribute into more than one CC (as per
Figures 3c-3h; 4c-4h ), the possibility of determining all of the EXO compartmental concentrations may require additional stoichiometric calculations which complexity may vary for the different situations, depending from the availability of some or all of the CC volumes and the number of CCs where SA and EXO distribute. In any case, by means of LISEXO signal vs. pEXO graph, the values of the EXO compartmental concentrations can be calculated. To sum up, step (3) of the method of the invention is carried out by taking into account the CC/s where EXO stay, the volume/s of said CC/s, the value/s of the area/s under the markerEXO signal/s, the calculated ρEXO for every CC in which EXO stays, and by solving the system of equations connecting these parameters. - This situation is disclosed, in more details, in the subsequent experimental section (see example 1).
- The method of the invention may be advantageously used in a variety of fields such as, for insctance:
- in medicine, for the screening of bio-availability, effectiveness, resistance and toxicity of exogenous substances including, for example, drugs for human and veterinary use, diagnostic contrast agents and radio-sensitizer for photodynamic and neutron capture therapy as well as in diagnosis and care of diseases and in drugs therapy follow-up and o for the study of metabolism related to pathologies and thereof care.
- in the pharmacological field, for the screening and development of drugs starting, for example, from the identification of a lead compound up to the final formulation of the drug;
- in toxicology, to assess the cellular uptake and, hence, the exposure to chemicals, in particular of pesticides, fertilizer, pollutants and waste products;
- in the consumer field, to determine the cellular uptake of exogenous substances such as, food additives, artificial colourings and preservatives;
- in cosmetics, to determine the cellular uptake of compounds by derma cells and, more in general, for the development of new products endowed with better performance and lower collateral effects;
- in diagnostics, to assess the tissue and/or organ specificity of the used CAs wherein said values are usually connected both with effectiveness and toxicity of these substances;
- in pharmacokinetics, to assess and study the kinetic parameters governing the cellular uptake;
- in botanics, to determine the exposure of vegetables to dangerous chemical products and, also, in the preservation and care of the vegetables themselves.
-
Figures 1 to 4 represent MAS-NMR spectra as per the method of the invention, in a variety of situations. More in particular, - Figure 1
- represents a markerEXO signal showing a single peak in the absence of SA. Trace a: spectrum in the absence of SA; trace b - f: spectra in the presence of SA staying in one CC only.
- Figure 2
- represents a markerEXO signal showing more than one peak, in the absence of SA. Trace a: spectrum in the absence of SA; trace b - f: spectra in the presence of SA staying in one CC only.
- Figure 3
- represents a markerEXO signal showing a single peak, in the absence of SA. Trace a: spectrum in the absence of SA; trace b -h: spectra in the presence of SA staying in more than one cellular compartments.
- Figure 4
- represents a markerEXO signal showing more than one peak, in the absence of SA. Trace a: spectrum in the absence of SA; trace b - h: spectra in the presence of SA staying in more than one cellular compartments.
- Figure 5
- represents the 1H NMR spectrum of acetylsalicylic acid in D2O.
- Figure 6
- represents the graph of LISACETYLSALICYLIC ACID vs. ρACETYLSALICYLIC ACID = [Dy-BOPTA]/[ACETYLSALICYLIC ACID]
- Figure 7
- represents the 1H MAS-NMR spectrum of acetylsalicylic acid in HRBC suspension. Trace a: spectrum of HRBC; trace b: same sample of trace a but after addition of acetylsalicylic acid (100 µl, 1M stock solution); trace c: same sample of trace b but after addition of Dy-BOPTA (80 µl, 0.1M stock solution).
- With the aim of better illustrating the present invention, without posing any limitation to it, the following examples are now given.
- A given SA distributes into three different CCs (hereinafter named as CC1, and CC2) and three shifted markerEXO signals exist. The values of [SACC1] [SACC2] are known from previous step (b) of the method of the invention.
- From NMR-MAS spectra the values of LISEXO CC1, and LISExO CC2 signals can be measured and by the graphs of LISEXO signal vs. ρEXO, the corresponding values of ρEXO CC1, ρEXO CC2, are obtained. Moreover, the areas A1 and A2 of the two markerEXO signals can be measured by integration of the NMR spectrum. Being [SACC] known, it is possible to determine the [EXOCC] by the following set of equations:


- To solve the system, it is necessary to calculate all of the possible combinations and verify which [EXOs] are congruent with both sets of
equations 1 and 2. - To better clarify what above reported, this same example is also expressed through numerical values.
- Let us suppose to have the compartmental distribution reported in Table 1 and to label the two different compartments as 1 and 2. The experimental data are:
- from the measured LIS: ρ1 = 0.02; ρ2 = 0.093
- from previous step (b): [SACC1] = 0.2; [SACC2] = 1.4;
- from MAS-NMR spectra calculation of the areas provides for:
- A1 = 100; A2 =150.66
- From these values it is possible to calculate (by equation set 1) all of the possible values of [SACC]/ρEXO i.e. [EXOCC], in the three compartments (see values reported in Table 2).
- From these [EXOs] values it is possible to calculate all of the values of the left terms of equation set 2, for all of the possible combinations (see data reported in Table 3). Then, it is possible to calculate the right terms of equation set 2, for all of the possible combinations, by using the experimental values of the signal areas (see data reported in Table 4).
Table 1 SA EXO ρ signal area [SA CC1] 0.2 10 0.02 100 [SA CC2] 1.4 15 0.093 150 Total added mM of SA = 1.6, total added mM of EXO = 25. Table 2 [SACC1] [SACC2] ρ1 [EXOCC1] = 10.00 [EXOCC2] = 70.00 ρ2 [EXOCC1] = 2.15 [EXOCC2] =15.00 Table 3 [EXOCC1]/[EXOCC2] 0.14 0.67 0.03 0.14 Table 4 A1 A2 A1 -- 1.50 A2 0.67 -- - The value reported in Tables 3 which fit with this in Table 4, are highlighted in bold characters. They correspond to:
- [EXOC1]/[EXOC2] = 0.67 obtained by [EXOC1]=10 and [EXOC2] =15
- A1/A2 = 0.67 obtained by A1 = 100 and A2 = 150
- therefore: [EXOC1]=10; [EXOC2] = 15;
- AC1 = 100; AC2 = 150
- Accordingly, the solution of the system has allowed the calculation of the values of [EXOCC1] and [EXOCC2].
- In this example, EXO = Acetylsalicylic acid; SA = Dy-BOPTA (Dy is the symbol of Dysprosium, one of the lanthanides known as shift agent).
- The nucleus used to determine Acetylsalicylic acid cellular uptake is the proton.
- The in vitro determination has been performed on HRBC obtained by human blood treated as described below.
- Centrifugation: the employed centrifuge was HERAEUS SEPATECH OMNIFUGE 2 ORS, rotor model 3360. Centrifugation was done at 2109 g (equivalent to 3500 rpm) at 4°C for 15 minutes.
- Living HRBC preparation: human blood (to which sodium citrate has been added as an anticoagulant) was centrifuged. After that, HRBC pellets were separated from serum and white cell interface, carefully obtaining a solution of red cells free of white cells; accordingly, red cells with 80% hematocrit were obtained.
- Dy-BOPTA stock solution: a 0.1 M stock solution of Dy-BOPTA was used in all of the measurement to obtain the suitable [SA].
- Acetylsalicylic acid stock solution: a 1M stock solution of ASA containing 0.1 M of DSS (as internal standard for quantitative determination), was used in all of the measurements.
- The solution was prepared by dissolving 180.16 mg of ASA and 23,63 mg of DSS in 200ul of H2O, adding NaOH 2N until dissolution, lowering, if necessary, the pH to 7 with HCl 1N, then filling the volume to 1 ml. In this way two forms of ASA are generated that are below indicated as A and B.
- Acetylsalicylic acid in HRBC: a sample containing 1 ml of HRBC (80% hematocrit), 100 µmoles of acetylsalicylic acid (i.e. 100 µl of acetylsalicylic acid stock solution) and 8 µmoles of Dy-BOPTA (i.e. 80 µl of Dy-BOPTA stock solution) was employed to measure the uptake of acetylsalicylic acid in HRBC.
- Proton 1H NMR spectra: all the 1H NMR spectra have been aquired on a Bruker AMX 600 SB spectrometer at the frequency of 600.13 MHz. A multinuclear HR-MAS probehead with double bearing and 4 mm rotor with 12 µl spherical insert have been employed. Experimental conditions were: sample rotating speed = 3500 Hz; spectra width =12,000 Hz (c.a. 20 ppm); time domain data points = 128 K; number of scans = 16; pulse length = 11.7 µs; recycle delay = 10 s; CPMG sequence ; Fourier Transform by 0.5 Hz of enhancement multiplication function, sample temperature = 25°C.
- Dy-BOPTA employed in the present experiment has been selected from other Dysprosium chelates as preferred SA because it is known from the literature that it does not penetrate into HRBC (2).
- Proton spectra have been employed to determine acetylsalicylic acid cellular uptake, because 1H is the sole nucleus present in acetylsalicylic acid having a high NMR sensitivity. The 1H NMR spectra of acetylsalicylic acid in water showed two signals (A and B), in correspondence to the methyl group, as per the enclosed
Figure 5 . This case is similar to the one shown inFigure 2 trace a. Both of the two signals are markerEXO signals. - The calculated graph of LISACETYLSALICYLIC ACID vs. ρACETYLSALICYLIC ACID = [Dy-BOPTA]/[ACETYLSALICYLIC ACID] is reported in
Figure 6 , for both the markerEXO signals. - The measurement of cellular uptake of acetylsalicylic acid by HRBC was calculated from the spectra reported in the enclosed
Figure 7 . - Firstly, the 1H NMR-MAS spectrum of HRBC was aquired (
Figure 7 - trace a) in the absence of either acetylsalicylic acid (EXO) or of Dy-BOPTA (SA). - Then, 100 µl of acetylsalicylic acid 1M stock solution were added and the spectrum repeated (
Figure 7 - trace b). In spectrum of trace b the two components for each signal A and B of the methyl group of acetylsalicylic acid were well visible, i.e. four peaks exist in the proton MAS-NMR spectrum. The splitting of signals A and B induces to suppose that the molecules of acetylsalicylic acid in the extra- and intra-cellular compartments are in magnetically different environments, i.e. the four observed signals corresponded to signals - A e B into intra- and extra-cellular compartments, respectively.
- Lastly, 80 µl of Dy-BOPTA stock solution were also added to the sample and the spectrum were again re-aquired (
Figure 7 - trace c). At this time the four peaks showed a larger difference in their chemical shift with respect to trace b. Two components resulted unshifted with respect to the original markerEXO signals while the other two components were shifted. - Acetylsalicylic acid corresponding to the unshifted markerEXO signals is
- ACETYLSALICYLIC ACIDCC≠SA, i.e. acetylsalicylic acid in the intra-cellular compartment.
- On the contrary, acetylsalicylic acid corresponding to the shifted markerEXO signals is ACETYLSALICYLIC ACIDCCSA, i.e. acetylsalicylic acid in the extra-cellular compartment.
- The ratio between the areas of the two sets of peaks, directly gives the ratio between acetylsalicylic acid in the two cellular compartments for each type A and B. Since the volume of the two cellular compartments can be calculated, it is possible to obtain the absolute amounts of acetylsalicylic acid in the two cellular compartments.
- Data:
- Peak area of markerEXO(A)i =5.84
- Peak area of markerEXO(A)o = 88.28
- Peak area of markerEXO(B)i; =11.13
- Peak area of markerEXO(B)o = 45.50
- Volume of intracellular fluid = 0.8 ml
(because 1 ml of HRBC with 80% hematocrit were used) - Volume of extracellular fluid = 0.2 ml + 0.1 ml + 0.08 ml = 0.38 ml
(0.2 ml = extracellular fluid in HRBC; 0.1 ml = volume of added acetylsalicylic acid solution; 0.08 ml = volume of added SA solution) - Total of added acetylsalicylic acid= 100 µmoles
-
- µmoles acetylsalicylic acidi(A) = 5.84 x 100/(5.84+88.28+11.13+45.50) = 3.87
- µmoles acetylsalicylic acido(A) = 88.28 x 100/(5.84+88.28+11.13+45.50) = 58.56
- µmoles acetylsalicylic acidi(B) = 11.13 x 100/(5.84+88.28+11.13+45.50) = 7.38
- µmoles acetylsalicylic acido(B) = 45.50 x 100/(5.84+88.28+11.13+45.50) = 30.19
- concentration of acetylsalicylic acidi(A) = 3.87 / 0.8 = 4.83 mM
- concentration of acetylsalicylic acido(A) = 58.56 / 0.38 = 154.10 mM
- concentration of acetylsalicylic acidi(B) = 7.38 / 0.8 = 9.22 mM
- concentration of acetylsalicylic acido(A) = 30.19 / 0.38 = 79.44 mM
- [acetylsalicylic acid]o/ [acetylsalicylic acid]i(A) = 154.10 / 4.83 = 31.90
- [acetylsalicylic acid]o/ [acetylsalicylic acid]i(B) = 79.44 / 9.22 = 8.61
- From all the above, the cellular uptake of the acetylsalicylic acid is:
- % of cellular uptake of acetylsalicylic acid A = 4.83 x 100 / (4.83 + 154.10) = 3.04 %
- % of cellular uptake of acetylsalicylic acid B = 9.22 x 100 / (9.22 + 79.44) = 10.40 %
- % of cellular uptake of total acetylsalicylic acid = (4.83 + 9.22) / (4.83 + 154.10 + 9.22 + 79.44) = 5.67 %
-
- 1. Zaplatin N., Baker K. A., Kleinhans. F. W., Effectiveness and Toxicity of Several DTPA Broadening gents for Biological ESR Spectroscopy, J. Magn. Res. Ser. B 110, 249 - 254 (1996).
- 2. Calabi L., Alfieri G., Biondi L., De Miranda M., Paleari L., Ghelli S. - Application of high resolution magic angle spinning NMR spectroscopy to define the cell up-taking of MRI Contrast Agents J. Magn. Reson. 156, 222-229 (2002).
- 3. Calabi L., Paleari L., Biondi L., Linati L., De Miranda M., Ghelli S., Application of 1H and 23Na Magic Angle Spinning NMR Spectroscopy to define the HRBC up-taking of MRI contrast agents, accepted on J. Magn. Reson. 164, 28-34 (2003).
- 4. Artemov D, Solaiyappan M, Bhujwalla ZM, Magnetic resonance pharmacoangiography to detect and predict chemotherapy delivery to solid tumors, Cancer Res 61:7, 3039-44 (2001).
- 5. Colet J. M., Vander Elst L, Muller RN, Dynamic evaluation of the hepatic uptake and clearance of manganese-based MRI contrast agents: a 31P NMR study on the isolated and perfused rat liver. J Magn. Reson. Imaging 8:3 663-9 (1998).
- 6. Chirico G., Cannone F., Olivini F., Beretta S., Baldini G., Diaspro A., Robello M., "A combined confocal and spectroscopic TPE architecture for the identification of single fluorescent molecules", SPIE proc., Multiphoton Microscopy in the Biomedical Sciences, A. Periasamy, P.T.C. So, Eds., vol.4262, p.407-413 (2001).
- 7. Chirico G., Cannone F., Beretta S., Baldini G., Diaspro A., "Single Molecules Studies By Means Of The Two-Photon Fluorescence Distribution", Microsc.Res.Tech., (2001) 55:359-364.
- 8. Degani H., Elgavish G. A., Ionic Permeabilities of Membranes, FEBS Lett. 90(2), 357-360 (1978).
- 9. Gupta R. K., Gupta P., Direct Observation of Resolved Resonances from Intra- and Extracellular Sodium-23 Ions in NMR Studies of Intact Cells and Tissues Using Dysprosium(III)tripoly phosphate as Paramagnetic Shift Reagent, J. Magn. Reson. 47, 344- 350 (1982).
- 10. Miller S. K., Chu W. J., Pohost G. M., Elgavish G. A., Improvement of Spectral Resolution in Shift-Reagent-Aided 23Na NMR Spectroscopy in the Isolated Perfused Rat Heart System, Magn. Reson. Med. 20, 184-195 (1991).
- 11. Aime S, Botta M, Mainero V, Terreno E., Separation of intra- and extracellular lactate NMR signals using a lanthanide shift reagent. Magn Reason Med 47:1 10-3 (2002).
- 12. Humpfer E., Spraul M., Nicholson A. W., Nicholson J. K., and Lindon J. C., Direct Observation of Resolved intra- and extracellular Water Signals in Intact Human Red Blood Cells Using 1H MAS NMR Spectroscopy, Magn. Res. Med. 38, 334 - 336 (1997).
- 13. Springer C. S. Jr., Physicochemical Principles Influencing Magnetopharmaceuticals in "NMR in Physiology and Biomedicine" (R.J. Gillies, ed.), pp. 75-99, Academic Press Inc., Orlando (1994).
- 14. Live D. H., and Chan S. I., Bulk Susceptibility Corrections in Nuclear Magnetic Resonance Experiment Using Superconducting Solenois, Anal. Chem. 42(7), 791-792 (1970).
- 15. Pályka, W. Huang, and C. S. Springer Jr., The Effects of Bulk Magnetic Susceptibility in NMR, Bull. Magn. Reson. 17,46 - 53 (1995).
- 16. Shachar-Hill Y., Berfroy D. E., Pfeffer P. E., and Ratcliffe R. G., Using Bulk Magnetic Susceptibility to Resolve Internal and External Signals in the NMR Spectra of Plant Tissues, J. Magn. Reson. 127,17- 25 (1997).
Claims (13)
- A method for the in vitro determination of cellular uptake of exogenous or endogenous substances in a cell sample, which method comprises:1) selecting a suitable shift agent (SA) and nucleus combination for the measurement of cellular uptake of the exogenous or endogenous substance under investigation, through MAS-NMR spectroscopy;2) determining the cellular compartment/s (CC/s) in which said exogenous or endogenous substance distributes, through MAS-NMR spectroscopy, wherein determination is carry out by:2a) acquiring the MAS-NMR spectrum of the in vitro sample containing the exogenous or endogenous substance under investigation and determining the markerEXO or markerENDO signal/s;2b) adding a suitable amount of the selected SA to the above in vitro sample, so as to induce a significant LIS of markerEXO or of markerENDO signal/s, and re-acquiring the same MAS-NMR spectrum; and2c) comparing the markerEXO or the markerENDO signal/s of steps (2a) and (2b) and determining in which Cellular Compartment the exogenous or endogenous substance is present; and3) measuring the compartmental concentration of the said exogenous or endogenous substance.
- A method according to claim 1 wherein step 1) is carried out by:1a) identifying a set of possible SA candidates for said SA and nucleus combination, on the basis of the LIS produced on at least one NMR signal belonging to said exogenous or endogenous substance;1b) identifying a set of possible candidates for said SA, on the basis of the CC/s in which they distribute; and1c) selecting said SA and nucleus combination, on the basis of the information gathered from steps (1a) and (1b).
- A method according to claim 1 for the in vitro determination of cellular uptake of exogenous substances.
- A method according to claim 3 wherein the exogenous substance is any substance not naturally occurring in a biological sample.
- A method according to claim 4 wherein the exogenous substance comprises exogenous organic substances or exogenous metals or metal ions which NMR signals can be observed.
- A method according to claim 5 wherein the exogenous substance is selected from the group consisting of: drugs for human and veterinary use, diagnostic and therapeutics agents, contrast agents for imaging techniques, radio-sensitizers for photodynamic and neutron capture therapy, pesticides, herbicides, fertilizers, food additives, preservatives, cosmetics, colorants, waste products, pollutants, and chemicals.
- A method according to claim 1 wherein the endogenous substance comprises any substance resulting from normal or pathological biochemical processes of cells and tissues.
- A method according to claim 7 wherein the endogenous substance is selected from the group consisting of natural carbohydrates, urea, lactate, citrate, acetate, carbonate, malonate, choline, creatine, phosphate, piruvate and natural amino acids.
- A method according to any previous claim wherein the SA is selected from compounds containing a metal ion of the lanthanide group including: Ce3+; Pr3+; Nd3+; Pm3+; Sm3+; Eu3+; Tb3+; Dy3+; Ho3+; Er3+; Tm3+; and Yb3+.
- A method according to claim 9 wherein the SA comprises lanthanide complexes of ligands selected from: EDTA (ethylenediaminetetracetic acid); PCTA (3,6,9,15-tetraazabicyclo-[9.3.1]-pentadeca-1(15)11,13-triene-3,6,9-tris (methane phosphonic) acid); BOPTA ((4RS)-[4-carboxy-5,8,11-tris (carboxymethyl)-1-phenyl-2-oxa-5,8,11-triazatridecan-13-oic acid]) or derivatives thereof; DTPA (diethylenetriamine pentaacetic acid) or derivatives thereof; DOTA (1,4,7,10-tetraazocyclo-dodecane-N,N',N",N" "-tetraacetic acid) or derivatives thereof; DO3A (1,4,7,10-tetra azacyclododecane-1,4,7-triacetic acid) or derivatives thereof; DOTP (1,4,7,10-tetraazacyclododecane-1,4,7,10-tetrakis (methane phosphonic) acid or derivatives thereof; and ([3β(R),5β,12α]-5-[[4-[bis[2-bis(carboxymethyl)amino]-4-carboxy-1-oxobutyl]amino]-12-hydroxycholan-24-oic acid).
- A method according to any previous claim wherein the cell sample is selected from human or animal cells, cells cultures, tissues and organ cells, vegetal cells, part of trunks, leaves and food cells of both animal or vegetal origin.
- The method of claim 1 for use in the fields of medicine, diagnostics, photodynamic and neutron capture therapy, pharmacology and pharmacokinetics, toxicology, cosmetics, food preservation, and botanics.
- Use of the method according to any one of the preceding claims for the determination of the kinetic parameters of cellular uptake.
Priority Applications (1)
| Application Number | Priority Date | Filing Date | Title |
|---|---|---|---|
| EP05728189A EP1735616B1 (en) | 2004-03-26 | 2005-03-22 | Method for the in vitro determination of cellular uptake of exogenous and endogenous substances using nmr shift agents and the magic angle nmr technique |
Applications Claiming Priority (3)
| Application Number | Priority Date | Filing Date | Title |
|---|---|---|---|
| EP04007388A EP1586899A1 (en) | 2004-03-26 | 2004-03-26 | Method for in vitro determination of cellular uptake of exogenous substances by means of shift agents and magic angle spinning nuclear magnetic resonance |
| EP05728189A EP1735616B1 (en) | 2004-03-26 | 2005-03-22 | Method for the in vitro determination of cellular uptake of exogenous and endogenous substances using nmr shift agents and the magic angle nmr technique |
| PCT/EP2005/003058 WO2005093409A1 (en) | 2004-03-26 | 2005-03-22 | Method for the in vitro determination of cellular uptake of exogenous and endogenous substances using nmr shift agents and the magic angle nmr technique |
Publications (2)
| Publication Number | Publication Date |
|---|---|
| EP1735616A1 EP1735616A1 (en) | 2006-12-27 |
| EP1735616B1 true EP1735616B1 (en) | 2009-09-02 |
Family
ID=34924536
Family Applications (2)
| Application Number | Title | Priority Date | Filing Date |
|---|---|---|---|
| EP04007388A Withdrawn EP1586899A1 (en) | 2004-03-26 | 2004-03-26 | Method for in vitro determination of cellular uptake of exogenous substances by means of shift agents and magic angle spinning nuclear magnetic resonance |
| EP05728189A Expired - Lifetime EP1735616B1 (en) | 2004-03-26 | 2005-03-22 | Method for the in vitro determination of cellular uptake of exogenous and endogenous substances using nmr shift agents and the magic angle nmr technique |
Family Applications Before (1)
| Application Number | Title | Priority Date | Filing Date |
|---|---|---|---|
| EP04007388A Withdrawn EP1586899A1 (en) | 2004-03-26 | 2004-03-26 | Method for in vitro determination of cellular uptake of exogenous substances by means of shift agents and magic angle spinning nuclear magnetic resonance |
Country Status (5)
| Country | Link |
|---|---|
| US (1) | US20080003632A1 (en) |
| EP (2) | EP1586899A1 (en) |
| AT (1) | ATE441856T1 (en) |
| DE (1) | DE602005016385D1 (en) |
| WO (1) | WO2005093409A1 (en) |
Families Citing this family (1)
| Publication number | Priority date | Publication date | Assignee | Title |
|---|---|---|---|---|
| CN111474201A (en) * | 2020-04-09 | 2020-07-31 | 集美大学 | Internal standard liquid for analyzing metabolites in biological body fluid and application thereof |
Family Cites Families (1)
| Publication number | Priority date | Publication date | Assignee | Title |
|---|---|---|---|---|
| US6057092A (en) * | 1998-08-31 | 2000-05-02 | Trellis Bioinformatics, Inc. | Cellular transport detection method |
-
2004
- 2004-03-26 EP EP04007388A patent/EP1586899A1/en not_active Withdrawn
-
2005
- 2005-03-22 EP EP05728189A patent/EP1735616B1/en not_active Expired - Lifetime
- 2005-03-22 US US10/591,965 patent/US20080003632A1/en not_active Abandoned
- 2005-03-22 AT AT05728189T patent/ATE441856T1/en not_active IP Right Cessation
- 2005-03-22 WO PCT/EP2005/003058 patent/WO2005093409A1/en not_active Ceased
- 2005-03-22 DE DE602005016385T patent/DE602005016385D1/en not_active Expired - Lifetime
Also Published As
| Publication number | Publication date |
|---|---|
| EP1586899A1 (en) | 2005-10-19 |
| DE602005016385D1 (en) | 2009-10-15 |
| ATE441856T1 (en) | 2009-09-15 |
| EP1735616A1 (en) | 2006-12-27 |
| US20080003632A1 (en) | 2008-01-03 |
| WO2005093409A1 (en) | 2005-10-06 |
Similar Documents
| Publication | Publication Date | Title |
|---|---|---|
| García-Martín et al. | Mapping extracellular pH in rat brain gliomas in vivo by H magnetic resonance spectroscopic imaging: comparison with maps of metabolites | |
| Beckonert et al. | High-resolution magic-angle-spinning NMR spectroscopy for metabolic profiling of intact tissues | |
| Birka et al. | Diagnosis of nephrogenic systemic fibrosis by means of elemental bioimaging and speciation analysis | |
| Landis et al. | Determination of the MRI contrast agent concentration time course in vivo following bolus injection: effect of equilibrium transcytolemmal water exchange | |
| Kegeles et al. | In vivo neurochemistry of the brain in schizophrenia as revealed by magnetic resonance spectroscopy | |
| US8773126B2 (en) | Nuclear magnetic resonance measuring method using an isotope-labeled compound | |
| Böll et al. | Clinically approved MRI contrast agents as imaging labels for a porous iron‐based MOF nanocarrier: a systematic investigation in a clinical MRI setting | |
| EP2171436B1 (en) | A method for detecting a target substance by nuclear magnetic resonance | |
| Hundshammer et al. | Hyperpolarized amino acid derivatives as multivalent magnetic resonance pH sensor molecules | |
| Palaniappan et al. | Molecular sensing using hyperpolarized xenon NMR spectroscopy | |
| Renault et al. | Slow-spinning low-sideband HR-MAS NMR spectroscopy: delicate analysis of biological samples | |
| Babailov et al. | NMR thermosensing properties on binuclear triple-decker complexes of terbium (III) and dysprosium (III) with 15-crown-5-phthalocyanine | |
| Herynek et al. | Low-molecular-weight paramagnetic 19F contrast agents for fluorine magnetic resonance imaging | |
| Hutchison et al. | Measurement of intracellular sodium with NMR methods | |
| Prost | Magnetic resonance spectroscopy | |
| Ferrauto et al. | Chemical exchange saturation transfer (CEST) contrast agents | |
| Komoroski | Applications of 7Li NMR in biomedicine | |
| Calabi et al. | Application of high-resolution magic-angle spinning NMR spectroscopy to define the cell uptake of MRI contrast agents | |
| Cao‐Pham et al. | Combined endogenous MR biomarkers to assess changes in tumor oxygenation induced by an allosteric effector of hemoglobin | |
| van Zijl et al. | Diffusion spectroscopy in living systems | |
| US20080003632A1 (en) | Method for the In Vitro Determination of Cellular Uptake of Exogenous and Endogenous Substances Using Nmr Shift Agents and the Magic Angle Nmr Technique | |
| Chen et al. | Resolution of creatine and phosphocreatine 1H signals in isolated human skeletal muscle using HR‐MAS 1H NMR | |
| Ramani et al. | Another approach to protons with constricted mobility in white matter: pilot studies using wideline and high-resolution NMR spectroscopy | |
| Miller et al. | Shift-reagent-aided 23Na NMR spectroscopy in cellular, tissue, and whole-organ systems | |
| Dastrù et al. | Contrast agents and mechanisms |
Legal Events
| Date | Code | Title | Description |
|---|---|---|---|
| PUAI | Public reference made under article 153(3) epc to a published international application that has entered the european phase |
Free format text: ORIGINAL CODE: 0009012 |
|
| 17P | Request for examination filed |
Effective date: 20061004 |
|
| AK | Designated contracting states |
Kind code of ref document: A1 Designated state(s): AT BE BG CH CY CZ DE DK EE ES FI FR GB GR HU IE IS IT LI LT LU MC NL PL PT RO SE SI SK TR |
|
| DAX | Request for extension of the european patent (deleted) | ||
| 17Q | First examination report despatched |
Effective date: 20080916 |
|
| GRAP | Despatch of communication of intention to grant a patent |
Free format text: ORIGINAL CODE: EPIDOSNIGR1 |
|
| GRAS | Grant fee paid |
Free format text: ORIGINAL CODE: EPIDOSNIGR3 |
|
| GRAA | (expected) grant |
Free format text: ORIGINAL CODE: 0009210 |
|
| AK | Designated contracting states |
Kind code of ref document: B1 Designated state(s): AT BE BG CH CY CZ DE DK EE ES FI FR GB GR HU IE IS IT LI LT LU MC NL PL PT RO SE SI SK TR |
|
| REG | Reference to a national code |
Ref country code: CH Ref legal event code: EP |
|
| REG | Reference to a national code |
Ref country code: IE Ref legal event code: FG4D |
|
| REF | Corresponds to: |
Ref document number: 602005016385 Country of ref document: DE Date of ref document: 20091015 Kind code of ref document: P |
|
| PG25 | Lapsed in a contracting state [announced via postgrant information from national office to epo] |
Ref country code: FI Free format text: LAPSE BECAUSE OF FAILURE TO SUBMIT A TRANSLATION OF THE DESCRIPTION OR TO PAY THE FEE WITHIN THE PRESCRIBED TIME-LIMIT Effective date: 20090902 Ref country code: LT Free format text: LAPSE BECAUSE OF FAILURE TO SUBMIT A TRANSLATION OF THE DESCRIPTION OR TO PAY THE FEE WITHIN THE PRESCRIBED TIME-LIMIT Effective date: 20090902 Ref country code: SE Free format text: LAPSE BECAUSE OF FAILURE TO SUBMIT A TRANSLATION OF THE DESCRIPTION OR TO PAY THE FEE WITHIN THE PRESCRIBED TIME-LIMIT Effective date: 20090902 |
|
| NLV1 | Nl: lapsed or annulled due to failure to fulfill the requirements of art. 29p and 29m of the patents act | ||
| LTIE | Lt: invalidation of european patent or patent extension |
Effective date: 20090902 |
|
| PG25 | Lapsed in a contracting state [announced via postgrant information from national office to epo] |
Ref country code: SI Free format text: LAPSE BECAUSE OF FAILURE TO SUBMIT A TRANSLATION OF THE DESCRIPTION OR TO PAY THE FEE WITHIN THE PRESCRIBED TIME-LIMIT Effective date: 20090902 Ref country code: PL Free format text: LAPSE BECAUSE OF FAILURE TO SUBMIT A TRANSLATION OF THE DESCRIPTION OR TO PAY THE FEE WITHIN THE PRESCRIBED TIME-LIMIT Effective date: 20090902 Ref country code: NL Free format text: LAPSE BECAUSE OF FAILURE TO SUBMIT A TRANSLATION OF THE DESCRIPTION OR TO PAY THE FEE WITHIN THE PRESCRIBED TIME-LIMIT Effective date: 20090902 |
|
| PG25 | Lapsed in a contracting state [announced via postgrant information from national office to epo] |
Ref country code: CY Free format text: LAPSE BECAUSE OF FAILURE TO SUBMIT A TRANSLATION OF THE DESCRIPTION OR TO PAY THE FEE WITHIN THE PRESCRIBED TIME-LIMIT Effective date: 20090902 |
|
| PG25 | Lapsed in a contracting state [announced via postgrant information from national office to epo] |
Ref country code: CZ Free format text: LAPSE BECAUSE OF FAILURE TO SUBMIT A TRANSLATION OF THE DESCRIPTION OR TO PAY THE FEE WITHIN THE PRESCRIBED TIME-LIMIT Effective date: 20090902 Ref country code: RO Free format text: LAPSE BECAUSE OF FAILURE TO SUBMIT A TRANSLATION OF THE DESCRIPTION OR TO PAY THE FEE WITHIN THE PRESCRIBED TIME-LIMIT Effective date: 20090902 Ref country code: ES Free format text: LAPSE BECAUSE OF FAILURE TO SUBMIT A TRANSLATION OF THE DESCRIPTION OR TO PAY THE FEE WITHIN THE PRESCRIBED TIME-LIMIT Effective date: 20091213 Ref country code: PT Free format text: LAPSE BECAUSE OF FAILURE TO SUBMIT A TRANSLATION OF THE DESCRIPTION OR TO PAY THE FEE WITHIN THE PRESCRIBED TIME-LIMIT Effective date: 20100104 Ref country code: EE Free format text: LAPSE BECAUSE OF FAILURE TO SUBMIT A TRANSLATION OF THE DESCRIPTION OR TO PAY THE FEE WITHIN THE PRESCRIBED TIME-LIMIT Effective date: 20090902 Ref country code: IS Free format text: LAPSE BECAUSE OF FAILURE TO SUBMIT A TRANSLATION OF THE DESCRIPTION OR TO PAY THE FEE WITHIN THE PRESCRIBED TIME-LIMIT Effective date: 20100102 |
|
| PG25 | Lapsed in a contracting state [announced via postgrant information from national office to epo] |
Ref country code: SK Free format text: LAPSE BECAUSE OF FAILURE TO SUBMIT A TRANSLATION OF THE DESCRIPTION OR TO PAY THE FEE WITHIN THE PRESCRIBED TIME-LIMIT Effective date: 20090902 |
|
| PG25 | Lapsed in a contracting state [announced via postgrant information from national office to epo] |
Ref country code: AT Free format text: LAPSE BECAUSE OF FAILURE TO SUBMIT A TRANSLATION OF THE DESCRIPTION OR TO PAY THE FEE WITHIN THE PRESCRIBED TIME-LIMIT Effective date: 20090902 Ref country code: BE Free format text: LAPSE BECAUSE OF FAILURE TO SUBMIT A TRANSLATION OF THE DESCRIPTION OR TO PAY THE FEE WITHIN THE PRESCRIBED TIME-LIMIT Effective date: 20090902 |
|
| PLBE | No opposition filed within time limit |
Free format text: ORIGINAL CODE: 0009261 |
|
| STAA | Information on the status of an ep patent application or granted ep patent |
Free format text: STATUS: NO OPPOSITION FILED WITHIN TIME LIMIT |
|
| PG25 | Lapsed in a contracting state [announced via postgrant information from national office to epo] |
Ref country code: DK Free format text: LAPSE BECAUSE OF FAILURE TO SUBMIT A TRANSLATION OF THE DESCRIPTION OR TO PAY THE FEE WITHIN THE PRESCRIBED TIME-LIMIT Effective date: 20090902 |
|
| 26N | No opposition filed |
Effective date: 20100603 |
|
| PG25 | Lapsed in a contracting state [announced via postgrant information from national office to epo] |
Ref country code: GR Free format text: LAPSE BECAUSE OF FAILURE TO SUBMIT A TRANSLATION OF THE DESCRIPTION OR TO PAY THE FEE WITHIN THE PRESCRIBED TIME-LIMIT Effective date: 20091203 Ref country code: MC Free format text: LAPSE BECAUSE OF NON-PAYMENT OF DUE FEES Effective date: 20100331 |
|
| PG25 | Lapsed in a contracting state [announced via postgrant information from national office to epo] |
Ref country code: IE Free format text: LAPSE BECAUSE OF NON-PAYMENT OF DUE FEES Effective date: 20100322 |
|
| PGFP | Annual fee paid to national office [announced via postgrant information from national office to epo] |
Ref country code: IT Payment date: 20120323 Year of fee payment: 8 |
|
| PG25 | Lapsed in a contracting state [announced via postgrant information from national office to epo] |
Ref country code: LU Free format text: LAPSE BECAUSE OF NON-PAYMENT OF DUE FEES Effective date: 20100322 Ref country code: HU Free format text: LAPSE BECAUSE OF FAILURE TO SUBMIT A TRANSLATION OF THE DESCRIPTION OR TO PAY THE FEE WITHIN THE PRESCRIBED TIME-LIMIT Effective date: 20100303 Ref country code: BG Free format text: LAPSE BECAUSE OF FAILURE TO SUBMIT A TRANSLATION OF THE DESCRIPTION OR TO PAY THE FEE WITHIN THE PRESCRIBED TIME-LIMIT Effective date: 20090902 |
|
| PG25 | Lapsed in a contracting state [announced via postgrant information from national office to epo] |
Ref country code: TR Free format text: LAPSE BECAUSE OF FAILURE TO SUBMIT A TRANSLATION OF THE DESCRIPTION OR TO PAY THE FEE WITHIN THE PRESCRIBED TIME-LIMIT Effective date: 20090902 |
|
| PGFP | Annual fee paid to national office [announced via postgrant information from national office to epo] |
Ref country code: FR Payment date: 20130405 Year of fee payment: 9 Ref country code: GB Payment date: 20130327 Year of fee payment: 9 Ref country code: DE Payment date: 20130327 Year of fee payment: 9 Ref country code: CH Payment date: 20130325 Year of fee payment: 9 |
|
| REG | Reference to a national code |
Ref country code: DE Ref legal event code: R119 Ref document number: 602005016385 Country of ref document: DE |
|
| REG | Reference to a national code |
Ref country code: CH Ref legal event code: PL |
|
| GBPC | Gb: european patent ceased through non-payment of renewal fee |
Effective date: 20140322 |
|
| REG | Reference to a national code |
Ref country code: DE Ref legal event code: R119 Ref document number: 602005016385 Country of ref document: DE Effective date: 20141001 |
|
| REG | Reference to a national code |
Ref country code: FR Ref legal event code: ST Effective date: 20141128 |
|
| PG25 | Lapsed in a contracting state [announced via postgrant information from national office to epo] |
Ref country code: LI Free format text: LAPSE BECAUSE OF NON-PAYMENT OF DUE FEES Effective date: 20140331 Ref country code: FR Free format text: LAPSE BECAUSE OF NON-PAYMENT OF DUE FEES Effective date: 20140331 Ref country code: CH Free format text: LAPSE BECAUSE OF NON-PAYMENT OF DUE FEES Effective date: 20140331 Ref country code: GB Free format text: LAPSE BECAUSE OF NON-PAYMENT OF DUE FEES Effective date: 20140322 Ref country code: DE Free format text: LAPSE BECAUSE OF NON-PAYMENT OF DUE FEES Effective date: 20141001 |
|
| PG25 | Lapsed in a contracting state [announced via postgrant information from national office to epo] |
Ref country code: IT Free format text: LAPSE BECAUSE OF NON-PAYMENT OF DUE FEES Effective date: 20140322 |