EP1643447A1 - Method and system for CT reconstruction with pre-correction - Google Patents
Method and system for CT reconstruction with pre-correction Download PDFInfo
- Publication number
- EP1643447A1 EP1643447A1 EP05255628A EP05255628A EP1643447A1 EP 1643447 A1 EP1643447 A1 EP 1643447A1 EP 05255628 A EP05255628 A EP 05255628A EP 05255628 A EP05255628 A EP 05255628A EP 1643447 A1 EP1643447 A1 EP 1643447A1
- Authority
- EP
- European Patent Office
- Prior art keywords
- detector
- correction
- sinogram data
- ray
- data
- Prior art date
- Legal status (The legal status is an assumption and is not a legal conclusion. Google has not performed a legal analysis and makes no representation as to the accuracy of the status listed.)
- Granted
Links
Images




Classifications
-
- G—PHYSICS
- G06—COMPUTING OR CALCULATING; COUNTING
- G06T—IMAGE DATA PROCESSING OR GENERATION, IN GENERAL
- G06T5/00—Image enhancement or restoration
- G06T5/10—Image enhancement or restoration using non-spatial domain filtering
-
- G—PHYSICS
- G06—COMPUTING OR CALCULATING; COUNTING
- G06T—IMAGE DATA PROCESSING OR GENERATION, IN GENERAL
- G06T12/00—Tomographic reconstruction from projections
- G06T12/10—Image preprocessing, e.g. calibration, positioning of sources or scatter correction
-
- G—PHYSICS
- G06—COMPUTING OR CALCULATING; COUNTING
- G06T—IMAGE DATA PROCESSING OR GENERATION, IN GENERAL
- G06T12/00—Tomographic reconstruction from projections
- G06T12/20—Inverse problem, i.e. transformations from projection space into object space
-
- G—PHYSICS
- G06—COMPUTING OR CALCULATING; COUNTING
- G06T—IMAGE DATA PROCESSING OR GENERATION, IN GENERAL
- G06T2211/00—Image generation
- G06T2211/40—Computed tomography
- G06T2211/421—Filtered back projection [FBP]
Definitions
- the present invention relates generally to computed tomography (CT) systems, and more particularly to a CT industrial inspection system and method for generating high-resolution CT images using pre-correction techniques.
- CT computed tomography
- CT coordinate measuring machines
- CMM coordinate measuring machines
- laser-based profilometry can measure external surfaces with high accuracy, but cannot measure internal features unless the part is cut open.
- CMM and laser-based profilometry can measure external surfaces with high accuracy, but cannot measure internal features unless the part is cut open.
- CT is one of the more versatile of the measurement/inspection systems for revealing both the internal and external structures of industrial parts in a non-destructive manner.
- the potential industrial applications of CT include reverse engineering, rapid prototyping, quality assurance, casting simulation & validation, tire development, first article inspection, ceramic porosity inspection, process validation, parts qualification and defect detection, to name a few.
- improved inspection accuracy of industrial CT is desirable, for widespread applications thereof.
- CT has not been optimized for capturing detailed external surface features, which can be crucial for capturing the design intent.
- the factors affecting CT accuracy in this regard include (among other aspects) beam-hardening, partial volume effect, scattering and off-focal radiation.
- FBP filtered backprojection
- iterative reconstruction techniques have been employed to correct system imperfections such as focal spot size, detector point spread (PSF) function, detector time lag, non-linear partial volume error, scatter, beam hardening etc. Iterative reconstruction techniques are based on different mathematical principles, such as the statistical approach of maximum likelihood, and the least squares approach, for example. These techniques permit the incorporation of a dedicated forward model of the data acquisition. Typically, in an iterative reconstruction approach, the reconstructed image is incrementally updated using the differences between the initial projection measurements and the forward projection model.
- PSF detector point spread
- a method for reconstructing image data from measured sinogram data acquired from a CT system is provided.
- the CT system is configured for industrial imaging.
- the method includes pre-processing the measured sinogram data.
- the pre-processing includes performing a beam hardening correction on the measured sinogram data and performing a detector point spread function (PSF) correction and a detector lag correction on the measured sinogram data.
- PSD detector point spread function
- the pre-processed sinogram data is reconstructed to generate the image data.
- a CT system for reconstructing image data from measured sinogram data.
- the CT system is configured for industrial imaging.
- the system includes an X-ray source configured to project polychromatic X-ray beams through an object and a detector configured to produce electrical signals in response to received X-ray beams from the source.
- the system further includes a system controller configured to process the electrical signals to generate the measured sinogram data.
- the system controller is further configured to pre-process the measured sinogram data. Pre-processing the measured sinogram data includes performing a beam hardening correction; a detector point spread function (PSF) correction and a detector lag correction on the measured sinogram data.
- PSF detector point spread function
- a CT system configured for industrial imaging.
- industrial imaging refers to the imaging of both the internal and external structures of industrial parts in a non-destructive manner.
- industrial X-ray CT provides rapid three-dimensional measurement for imaging both external and internal features.
- a CT reconstruction method that provides for improved image quality, in which pre-correction techniques are applied to projection data measurements prior to image reconstruction. Thereby, a more accurately calculated image projection (or sinogram) is used to reconstruct the image of the object.
- the reconstruction method in accordance with the present technique, achieves high resolution while reducing the reconstruction time.
- the CT system 10 includes a scanner 12.
- the scanner 12 is formed of a support structure and internally containing one or more stationary or rotational, distributed sources of X-ray radiation (not shown in Fig. 1) and one or more stationary or rotational digital detectors (not shown in Fig. 1).
- the scanner 12 is configured to receive a table 14 or other support for an object to be scanned. The table 14 can be moved through an aperture in the scanner 12 to appropriately position the subject in an imaging volume or scanning plane during imaging sequences.
- the CT system 10 further includes a radiation source controller 16, a table controller 18 and a data acquisition controller 20, which may all function under the direction of a system controller 22.
- the radiation source controller 16 regulates timing for discharges of X-ray radiation which is directed from points around the scanner 12 toward a detector element on an opposite side thereof, as discussed below.
- the radiation source controller 16 may trigger one or more emitters in a distributed X-ray source at each instant in time for measuring multiple projection data.
- the X-ray radiation source controller 16 may trigger emission of radiation in sequences so as to collect adjacent or non-adjacent measurements of projection data around the scanner 12.
- data acquisition controller 20 coupled to detector elements as described below receives signals from the detector elements and processes the signals for storage and later image reconstruction.
- source controller 16 may also direct rotation of a gantry on which the distributed source or sources are mounted.
- Table controller 18, then, serves to appropriately position the table and subject thereon in a plane in which the radiation is emitted, or generally within a volume to be imaged. The table may be displaced between imaging sequences or during certain imaging sequences, depending upon the imaging protocol employed.
- data acquisition controller 20 may also direct rotation of a gantry on which the detector or detectors are mounted.
- system controller 22 generally regulates the operation of the radiation source controller 16, the table controller 18 and the data acquisition controller 20.
- the system controller 22 may thus cause radiation source controller 16 to trigger emission of X-ray radiation, as well as to coordinate such emissions during imaging sequences defined by the system controller.
- the system controller 22 may also regulate movement of the table 14 in coordination with such emission so as to collect projection data corresponding to volumes of particular interest, or in various modes of imaging, such as helical acquisition modes.
- system controller 22 may further be configured to coordinate rotation of a gantry on which, either the source(s), detector(s), or both are mounted in the case of rotating CT geometries or arrangements.
- the system controller 22 also receives data acquired by the data acquisition controller 20 and coordinates storage and processing of the data.
- the system controller 22 is configured to pre-process the projection data measurements.
- the projection data measurements are sometimes referred to as a sinogram.
- the pre-processing includes performing a beam hardening correction on the sinogram data and performing a detector point spread function (PSF) correction and a detector lag correction on the sinogram data.
- PSD detector point spread function
- the system controller 22 is further configured to reconstruct the pre-processed sinogram data to generate the image.
- controllers may be defined by hardware circuitry, firmware or software.
- the particular protocols for imaging sequences will generally be defined by code executed by the system controllers.
- initial processing, conditioning, filtering, and other operations required on the projection data acquired by the scanner 12 may be performed in one or more of the components depicted in Fig. 1.
- detector elements will produce analog signals representative of depletion of a charge in photodiodes positioned at locations corresponding to elements of the detector used for data acquisition. Such analog signals are converted to digital signals by electronics within the scanner, and are transmitted to the data acquisition controller 20.
- Partial processing may occur at this point, and the signals are ultimately transmitted to the system controller for further filtering and processing.
- image reconstruction may be accomplished by application specific integrated circuits residing in the system controller 22, by algorithms executed on the system controller 22, or by remote systems that can access the same data stored in memory device 26.
- system controller 22 is also coupled to an operator interface 24 and to one or more memory devices 26.
- the operator interface may be integral with the system controller 22, and will generally include an operator workstation for initiating imaging sequences, controlling such sequences, and manipulating projection data acquired during imaging sequences.
- the memory devices 26 may be local to the imaging system, or may be partially or completely remote from the system. Thus, memory devices 26 may include local, magnetic or optical memory, or local or remote repositories for measured data for reconstruction. Moreover, the memory devices may be configured to receive raw, partially processed or fully processed projection data for reconstruction.
- System controller 22 or operator interface 24, or any remote systems and workstations may include software for image processing and reconstruction. Therefore, some or all of the image processing may be performed remotely by additional computing resources based upon raw or partially processed image data. As will be appreciated by those skilled in the art, such processing of CT projection data may be performed by a number of mathematical algorithms and techniques.
- a remote interface 28 may be included in the system for transmitting data from the imaging system to such remote processing stations or memory devices.
- Fig. 2 is an illustration of the scanner 12, shown in Fig. 1, with an exemplary X-ray source and a detector array.
- the scanner 12 includes a gantry 29.
- the gantry 29 is illustrated with a source of radiation 30, typically an X-ray tube, and a detector array 46.
- the X-ray source 30 projects an X-ray beam toward the detector array 46.
- the detector array 46 is generally formed by a number of detector elements, which sense the X-rays that pass through and around an object of interest. Each detector element produces an electrical signal that represents the intensity of the X-ray beam at the position of the element at the time the beam strikes the detector.
- the gantry 29 is rotated around an object of interest so that a number of radiographic views may be collected by the system controller 22 shown in Fig. 1.
- an image or slice is computed which may incorporate, in certain modes, less or more than 360 degrees of projection data, to formulate an image.
- the image may be further collimated to desired dimensions, for example, using either lead shutters in front of the X-ray source 30 and different detector apertures.
- the collimator typically defines the size and shape of the X-ray beam that emerges from the X-ray source 30.
- the detector 46 collects data of the attenuated X-ray beams.
- the present technique is not limited to data collected on any particular type of scanner.
- the technique may be applied to data collected via a scanner in which an X-ray source and a detector are effectively stationary and an object is rotated, or in which the detector is stationary but an X-ray source rotates.
- the data could originate in a scanner in which both the X-ray source and detector are stationary, as where the X-ray source is distributed and can generate X-rays at different locations as will be described in greater detail with respect to Fig. 3.
- generally circular scan geometries are discussed, other geometries may be envisioned as well.
- Fig. 3 is a diagrammatical representation of an exemplary distributed X-ray source of a type that may be employed in the CT system 10 of Fig. 1.
- the distributed X-ray source 30 may include a series of electron beam emitters 32 that are coupled to radiation source controller 16 shown in Fig. 1, and are triggered by the source controller during operation of the scanner.
- the electron beam emitters 32 are positioned adjacent to a distributed target 34.
- the electron beam emitters 32 may emit electron beams 36 toward target 34.
- the target 34 which may, for example, be a tungsten rail or element, emits X-ray radiation, as indicated at reference numeral 38, upon impact of the electron beams.
- X-rays In reflection mode, X-rays are meant to be produced primarily on the same side of the target as where the electrons impact. In transmission mode, X-rays are produced at the opposite side of the target.
- the X-ray beams 38 are directed, then toward a collimator 40, which is generally opaque to the X-ray radiation, but which includes openings or apertures 42.
- the apertures 42 may be fixed in dimension, or may be adjustable. Apertures 42 permit a portion of the X-ray beams to penetrate through the collimator to form collimated beams 44 that will be directed to the imaging volume of the scanner, through the subject of interest, and that will impact detector elements on an opposite side of the scanner.
- the individual X-ray sources in the distributed source may emit various types and shapes of X-ray beams. These may include, for example, fan-shaped beams, cone-shaped beams, and beams of various cross-sectional geometries.
- the various components comprising the distributed X-ray source may also vary.
- the emission devices may be one of many available electron emission devices, for example, thermionic emitters, carbon-based emitters, photo emitters, ferroelectric emitters, laser diodes, monolithic semiconductors, etc.
- Fig. 4 is a diagrammatical representation of a portion of a detector that may be employed by the CT system 10 of Fig. 1.
- the detector arrangement may be generally similar to detectors used in conventional rotational CT systems.
- the detector may be extended around a greater portion or the entire inner surface of the scanner in certain embodiments.
- Each detector may be comprised of detector elements with varying resolution to satisfy a particular imaging application.
- the detector 46 includes a series of detector elements 48 and associated signal processing circuitry 50. These detector elements may be of one, two or more sizes, resulting in different spatial resolution characteristics in different portions of the measured projection data.
- Exemplary detector elements include an array of photodiodes and associated thin film transistors.
- X-ray radiation impacting the detectors is converted to lower energy photons by a scintillator and these photons impact the photodiodes. A charge maintained across the photodiodes is thus depleted, and the transistors may be controlled to recharge the photodiodes and thus measure the depletion of the charge.
- the signal processing circuitry 50 By sequentially measuring the charge depletion in the various photodiodes, each of which corresponds to a pixel in the collected data for each acquisition, data is collected that indirectly encodes radiation attenuation at each of the detector pixel locations.
- This data is processed by the signal processing circuitry 50, which will generally convert the analog depletion signals to digital values, perform any necessary filtering, and transmit the acquired data to the system controller 22 of the imaging system 10 in Fig. 1 as described above.
- a detector configuration comprised of scintillation material and storage diodes any suitable detector for measuring X-rays may be used with the present technique.
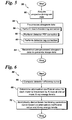
- Fig. 5 is a flowchart 52 depicting exemplary logic including exemplary steps for reconstructing image data from measured sinogram data acquired by the CT system 10 of Fig. 1.
- the projection data measurements are acquired from the CT system 10.
- the term "projection data measurements” also refers to a sinogram.
- the measured sinogram data is pre-processed.
- pre-processing the measured sinogram data in step 56 further includes performing a beam hardening correction on the measured sinogram data in step 58, performing a detector point spread function (PSF) correction in step 60 and performing a detector lag correction in step 62 on the measured sinogram data as will be described in greater detail below.
- PSF detector point spread function
- step 64 the pre-processed sinogram data is reconstructed to generate image data.
- a filtered back-projection technique is used to reconstruct the image data. The following paragraphs, describe the beam hardening correction process, the detector point spread function (PSF) correction process and the detector lag correction process in greater detail.
- conventional X-ray sources for CT imaging typically comprise rotating anode tubes (or X-ray tubes) that possess polychromatic spectrums. That is, the X-ray photons emitted from such X-ray tubes do not all possess the same X-ray energy levels.
- attenuation processes in matter are typically energy dependent. Non-uniform attenuation of different energies results in the preferential depletion of X-rays in energy ranges with higher attenuation coefficients.
- X-rays in energy ranges that are more easily attenuated are referred to as soft X-rays while those in ranges that are more penetrating are referred to as hard X-rays.
- Beam hardening is the process of selective removal of soft X-rays from an X-ray beam. As these X-rays are removed, the beam becomes progressively harder or alternatively more penetrating.
- the amount of beam hardening typically depends on the initial X-ray spectrum as well as on the composition of the material traversed. In general, for a pre-determined initial X-ray spectrum and tissue type, the process of beam hardening represents a monotonic increase in beam hardness as a function of material thickness traversed. As a result of beam hardening, the effective attenuation coefficient of a material depends on the thickness of material traversed. This effect causes beam-hardening artifacts in CT images. As will be appreciated, beam-hardening artifacts, if uncorrected, create a cupping effect, or a reduction of the reconstructed attenuation coefficient toward the center of the object being imaged.
- a flowchart 58 depicting exemplary steps for performing beam-hardening correction.
- a detector efficiency curve associated with the CT system 10 of Fig. 1 is initially computed. Then, the computed detector efficiency curve is used to correct the X-ray source spectrum as described below.
- the X-ray source spectrum is a measure of the distribution of X ray intensity as a function of energy. The exact nature of the distribution depends on the manner in which the X-rays are generated.
- the X-ray source spectrum is scaled by the detector efficiency curve, d(E) to obtain a corrected X-ray source spectrum.
- Fig. 7 is an illustration of an original X-ray source spectrum and the corrected X-ray source spectrum.
- an attenuation coefficient value for each material traversed by X-rays, at one or more X-ray energy levels is determined.
- the mass attenuation coefficient value denoted by ⁇ /p (where ⁇ denotes the attenuation value and p denotes the density) is determined for each material.
- the mass attenuation coefficient p/p and the mass energy absorption coefficient, denoted by ⁇ en / ⁇ are basic quantities used to compute the penetration and the energy deposition by photons (which may comprise, for example, X-rays, or bremsstrahlung) in biological, shielding and other such materials.
- the mass attenuation coefficients, p/p, for each material is determined. Further, the mass attenuation coefficient ⁇ / ⁇ at one or more energy levels is precomputed based upon a material composition and an X-ray source profile as follows.
- the values for the mass attenuation co-efficient, ⁇ i / ⁇ i , and the mass energy-absorption coefficient, ⁇ en / ⁇ , as a function of photon energy, for various elements may be pre-determined.
- the fractions by weight may also be pre-determined.
- interpolation is performed.
- the composition of Helium (H) and Oxygen (O) have fraction by weights of 0.111898 and 0.888102 respectively.
- Fig. 8 is an illustration of the resultant mass attenuation coefficients for a range of photon energies.
- Fig. 8 indicates the mass attenuation coefficients ⁇ water and the mass energy-absorption coefficient ( ⁇ en / ⁇ ) for water.
- a beam hardening correction curve is analytically derived based on the mass attenuation coefficient at the one or more X-ray energy levels and the corrected X-ray source spectrum obtained in step 66. More specifically, in accordance with the present embodiment, the beam hardening correction curve is analytically derived based on attenuation resulting from beam hardening for an X-ray path length.
- ⁇ (E) represents the incident X-ray spectrum probability distribution
- ⁇ M(E) denotes the absorption co-efficients for a material M at an energy level E
- I represent the total incident and transmitted intensities, respectively.
- the effective absorption co-efficient ⁇ eff is a scaling factor for the corrected sinogram, thereby enabling the choice of positive numbers for ⁇ eff .
- the values of P bh and p are computed for each path length S.
- the integration in equation (5) is implemented as a summation so that equation (5) is a function of the path length S.
- a look-up table or a plot as shown in Fig 9 below is generated, that includes all possible P bh and p pairs.
- the corrected sinogram is then generated when each attenuation value at the measured sinogram is replaced with the corresponding p value using this analytical relationship between p and P bh .
- Fig. 9 is an illustration of an analytically derived beam hardening correction curve. As indicated in Fig. 9, the measured sinogram value is represented by the x-axis and the corrected sinogram values correspond to the y-axis. In accordance with a particular embodiment, an optimization of the derived beam hardening correction curve is further performed based on one or more tuning parameters. Exemplary tuning parameters include an X-ray energy level value, an X-ray spectrum energy bin number, and a path length discretization number. As used herein, the X-ray spectrum energy bin number refers to the discretization level number associated with X-ray energy and the path length discretization number refers the quantization level number associated with the path length.
- an X-ray spectrum energy bin number of 10 means that the total range of possible X-ray energies is divided in 10 subintervals.
- a path length discretization number equal to 100 means that a path length range, such as, for example, between 0cm to 100cm would be quantized by 100, into 100 sub-intervals of 1cm.
- a finer discretization of the X-ray spectrum energy bin number and the path length discretization number leads to a better simulation but requires more computational time. Further, optimization of the X-ray spectrum energy bin number and the path length discretization number may also be performed to achieve faster results with a smaller error.
- a detector point spread function (PSF) correction and a detector lag correction is performed on the measured sinogram data.
- performing the detector PSF correction and the detector lag correction includes deconvolving the measured sinogram data along one or more detector rows and detector view directions as will be described in greater detail below.
- the detector lag and the detector PSF typically cause azimuthal and radial blur in the image domain, respectively.
- the detector time lag occurs from the fact that if a solid-state detector is exposed to X-ray photons for a period time and is then quickly switched off, the input X-ray and the detector reading does not reach a zero value immediately.
- the CT gantry speed or rotating table speed is faster than the decay rate of the solid state material, then the detector reading at each projection view is affected from the detector readings from past projection views. This, in turn, causes the azimuthal blur in the reconstruction image.
- the detector PSF is typically used to access the spatial resolution of an imaging system.
- the detector lag and the detector PSF correction is used to obtain the ideal X-ray intensity, x from the detector reading, y by deconvolving, H.
- an iterative deconvolution algorithm is applied to the measured sinogram data, to optimally correct the detector PSF and detector time lag.
- the iterative deconvolution algorithm is formulated as a nonlinear optimization problem as will be described in greater detail below.
- a disadvantage of the least square solution, obtained using (10) is that the above least square solution does not take into consideration, the non-negative value for the resultant estimate of the intensity X ⁇ .
- a truncation to zero for the negative values may be computed, but such a direct inversion applied to equation (10) may result in an erroneous reconstruction.
- a novel iterative deconvolution algorithm is applied, to the measured sinogram data.
- the iterative deconvolution algorithm optimally corrects the detector PSF and detector time lag. Since, in general, the raw projection data should have a positive intensity, conventional deconvolution techniques that use linear filters (such as a Weiner filter, for example) are not optimal in nature.
- the deconvolution problem is formulated as a non-linear optimization problem. The optimization problem results in an accurate deconvolution of the detector PSF and detector time lag.
- the optimization problem depicted in equation (12) is solved without the use of any additional constraints.
- the optimization problem may be solved using any standard non-linear optimization method such as for example, gradient search.
- an optimization problem that is solved without the use of additional constraints has a low associated computational cost.
- the embodiments illustrated and described above provide a technique for reconstructing image data acquired from an imaging system.
- the beam hardening correction technique described above may be used for a plurality of materials without any tedious and expensive calibration procedures and provides a very accurate correction when combined with detector PSF and detector time lag correction.
- the proposed PSF and time lag correction technique though iterative in nature, has negligible computational complexity as compared to iterative reconstruction techniques, since the iteration is performed in the measurement domain without resorting to computationally expensive forward and backprojections. For example, if 5 ⁇ 15 iterations are needed to get a reconstruction image by using a certain iterative reconstruction technique, 5-15 times the number of forward and backprojections would typically need to be performed.
- the total time needed for reconstruction will be 10 ⁇ 30 T bp using an iterative reconstruction method.
- the pre-correction step performed in accordance with the present technique requires one correction step and one back projection step to be performed. Therefore, the total computation time is equal to T bp + pre-correction time.
- the pre-correction time is known to be smaller than T bp
- the total computation time for pre-correction is lesser than twice the value of T bp , which is a considerable improvement over the existing iterative reconstruction techniques.
- the resultant reconstructed CT image with pre-correction in accordance with the present technique achieves high image quality with minimal increments to computational time as compared to conventional filtered back-projection techniques.
Landscapes
- Physics & Mathematics (AREA)
- General Physics & Mathematics (AREA)
- Engineering & Computer Science (AREA)
- Theoretical Computer Science (AREA)
- Analysing Materials By The Use Of Radiation (AREA)
- Apparatus For Radiation Diagnosis (AREA)
Abstract
Description
- The present invention, relates generally to computed tomography (CT) systems, and more particularly to a CT industrial inspection system and method for generating high-resolution CT images using pre-correction techniques.
- In present date industrial inspection processes, different types of measurement systems are available such as CT, coordinate measuring machines (CMM) and laser-based profilometry. Each inspection modality has its own advantages and disadvantages associated therewith. Modalities such as CMM and laser-based profilometry can measure external surfaces with high accuracy, but cannot measure internal features unless the part is cut open. To date, CT is one of the more versatile of the measurement/inspection systems for revealing both the internal and external structures of industrial parts in a non-destructive manner. The potential industrial applications of CT include reverse engineering, rapid prototyping, quality assurance, casting simulation & validation, tire development, first article inspection, ceramic porosity inspection, process validation, parts qualification and defect detection, to name a few. However, improved inspection accuracy of industrial CT is desirable, for widespread applications thereof.
- For example, in the area of reverse engineering, CT has not been optimized for capturing detailed external surface features, which can be crucial for capturing the design intent. The factors affecting CT accuracy in this regard include (among other aspects) beam-hardening, partial volume effect, scattering and off-focal radiation. Thus, in order to improve CT inspection accuracy, more effective methods are needed for removing the effects of these artifacts. In the area of CT image reconstruction, filtered backprojection (FBP) is a common technique because of its fast computation and ease of implementation. However, because FBP oversimplifies the CT data acquisition into an ideal Radon transform (i.e., Fan Beam transform, cone beam transform or any other transform depending on the particular acquisition geometry), the reconstructed image suffers from artifacts such as beam hardening and partial volume as discussed above.
- In order to improve image quality, iterative reconstruction techniques have been employed to correct system imperfections such as focal spot size, detector point spread (PSF) function, detector time lag, non-linear partial volume error, scatter, beam hardening etc. Iterative reconstruction techniques are based on different mathematical principles, such as the statistical approach of maximum likelihood, and the least squares approach, for example. These techniques permit the incorporation of a dedicated forward model of the data acquisition. Typically, in an iterative reconstruction approach, the reconstructed image is incrementally updated using the differences between the initial projection measurements and the forward projection model.
- Although iterative reconstruction techniques significantly improve image quality, the computational complexity associated with iterative reconstruction is highly intensive, as these techniques require multiple applications of computationally expensive forward and backprojections. Hence, iterative methods are not yet widely used in CT. Accordingly, it is desirable to be able to provide a technique for capturing both internal and external features of an object to be inspected and a technique that improves the image quality of reconstructed images without a significant increase in computation time.
- Embodiments of the present invention address this and other needs. In one embodiment, a method for reconstructing image data from measured sinogram data acquired from a CT system is provided. The CT system is configured for industrial imaging. The method includes pre-processing the measured sinogram data. The pre-processing includes performing a beam hardening correction on the measured sinogram data and performing a detector point spread function (PSF) correction and a detector lag correction on the measured sinogram data. The pre-processed sinogram data is reconstructed to generate the image data.
- In another embodiment, a CT system for reconstructing image data from measured sinogram data is provided. The CT system is configured for industrial imaging. The system includes an X-ray source configured to project polychromatic X-ray beams through an object and a detector configured to produce electrical signals in response to received X-ray beams from the source. The system further includes a system controller configured to process the electrical signals to generate the measured sinogram data. The system controller is further configured to pre-process the measured sinogram data. Pre-processing the measured sinogram data includes performing a beam hardening correction; a detector point spread function (PSF) correction and a detector lag correction on the measured sinogram data. The system controller then reconstructs the pre-processed sinogram data to generate the image data.
- The invention will now be described in greater detail, by way of example, with reference to the drawings, in which:-
- Fig. 1 is a diagrammatical representation of an exemplary CT system;
- Fig. 2 is an illustration of the CT scanner, shown in Fig. 1, with an exemplary X-ray source and a detector array;
- Fig. 3 is a diagrammatical representation of an exemplary distributed source for use with a system of the type illustrated in Fig. 1;
- Fig. 4 is a diagrammatical representation of a portion of detector for use with the system illustrated in Fig. 1;
- Fig. 5 is a flowchart depicting exemplary logic including exemplary steps for reconstructing image data from measured sinogram data acquired by the CT system of Fig. 1;
- Fig. 6 is a flowchart depicting exemplary steps for performing beam-hardening correction;
- Fig. 7 is an illustration of an original X-ray source spectrum and a corrected X-ray source spectrum;
- Fig. 8 is an illustration of the resultant mass attenuation co-efficients obtained for a range of photon energies; and
- Fig. 9 is an illustration of an analytically derived beam hardening correction curve.
- Disclosed herein, is a CT system configured for industrial imaging. As used herein, "industrial imaging" refers to the imaging of both the internal and external structures of industrial parts in a non-destructive manner. As will be appreciated by those skilled in the art, industrial X-ray CT provides rapid three-dimensional measurement for imaging both external and internal features. Disclosed herein, is a CT reconstruction method that provides for improved image quality, in which pre-correction techniques are applied to projection data measurements prior to image reconstruction. Thereby, a more accurately calculated image projection (or sinogram) is used to reconstruct the image of the object. In addition, the reconstruction method, in accordance with the present technique, achieves high resolution while reducing the reconstruction time.
- Turning now to the drawings, referring first to Fig. 1, a computed tomography (CT) system is illustrated and designated generally by
reference numeral 10. In the illustrated embodiment, the computed tomography (CT)system 10 is designed to acquire, pre-process and reconstruct image data in accordance with the present technique as will be described in greater detail below. TheCT system 10 includes ascanner 12. For the exemplary embodiment of FIG. 1, thescanner 12 is formed of a support structure and internally containing one or more stationary or rotational, distributed sources of X-ray radiation (not shown in Fig. 1) and one or more stationary or rotational digital detectors (not shown in Fig. 1). For the exemplary embodiment of FIG. 1, thescanner 12 is configured to receive a table 14 or other support for an object to be scanned. The table 14 can be moved through an aperture in thescanner 12 to appropriately position the subject in an imaging volume or scanning plane during imaging sequences. - For the exemplary embodiment of FIG. 1, the
CT system 10 further includes aradiation source controller 16, atable controller 18 and adata acquisition controller 20, which may all function under the direction of asystem controller 22. Theradiation source controller 16 regulates timing for discharges of X-ray radiation which is directed from points around thescanner 12 toward a detector element on an opposite side thereof, as discussed below. In the case of stationary CT arrangements, theradiation source controller 16 may trigger one or more emitters in a distributed X-ray source at each instant in time for measuring multiple projection data. In certain arrangements, for example, the X-rayradiation source controller 16 may trigger emission of radiation in sequences so as to collect adjacent or non-adjacent measurements of projection data around thescanner 12. Many such projection data may be collected in an examination sequence, anddata acquisition controller 20, coupled to detector elements as described below receives signals from the detector elements and processes the signals for storage and later image reconstruction. In configurations described below in which one or more sources are rotational,source controller 16 may also direct rotation of a gantry on which the distributed source or sources are mounted.Table controller 18, then, serves to appropriately position the table and subject thereon in a plane in which the radiation is emitted, or generally within a volume to be imaged. The table may be displaced between imaging sequences or during certain imaging sequences, depending upon the imaging protocol employed. Moreover, in configurations described below in which one or more detectors or detector segments are rotational,data acquisition controller 20 may also direct rotation of a gantry on which the detector or detectors are mounted. - For the exemplary embodiment of FIG. 1,
system controller 22 generally regulates the operation of theradiation source controller 16, thetable controller 18 and thedata acquisition controller 20. Thesystem controller 22 may thus causeradiation source controller 16 to trigger emission of X-ray radiation, as well as to coordinate such emissions during imaging sequences defined by the system controller. Thesystem controller 22 may also regulate movement of the table 14 in coordination with such emission so as to collect projection data corresponding to volumes of particular interest, or in various modes of imaging, such as helical acquisition modes. Moreover,system controller 22 may further be configured to coordinate rotation of a gantry on which, either the source(s), detector(s), or both are mounted in the case of rotating CT geometries or arrangements. Thesystem controller 22 also receives data acquired by thedata acquisition controller 20 and coordinates storage and processing of the data. As will be described in greater detail below, in accordance with the present technique, thesystem controller 22 is configured to pre-process the projection data measurements. The projection data measurements are sometimes referred to as a sinogram. The pre-processing includes performing a beam hardening correction on the sinogram data and performing a detector point spread function (PSF) correction and a detector lag correction on the sinogram data. Thesystem controller 22 is further configured to reconstruct the pre-processed sinogram data to generate the image. - It should be borne in mind that the controllers, and indeed various circuitry described herein, may be defined by hardware circuitry, firmware or software. The particular protocols for imaging sequences, for example, will generally be defined by code executed by the system controllers. Moreover, initial processing, conditioning, filtering, and other operations required on the projection data acquired by the
scanner 12 may be performed in one or more of the components depicted in Fig. 1. For example, as described below, detector elements will produce analog signals representative of depletion of a charge in photodiodes positioned at locations corresponding to elements of the detector used for data acquisition. Such analog signals are converted to digital signals by electronics within the scanner, and are transmitted to thedata acquisition controller 20. Partial processing may occur at this point, and the signals are ultimately transmitted to the system controller for further filtering and processing. In the same manner, image reconstruction may be accomplished by application specific integrated circuits residing in thesystem controller 22, by algorithms executed on thesystem controller 22, or by remote systems that can access the same data stored inmemory device 26. - For the exemplary embodiment of FIG. 1,
system controller 22 is also coupled to anoperator interface 24 and to one ormore memory devices 26. The operator interface may be integral with thesystem controller 22, and will generally include an operator workstation for initiating imaging sequences, controlling such sequences, and manipulating projection data acquired during imaging sequences. Thememory devices 26 may be local to the imaging system, or may be partially or completely remote from the system. Thus,memory devices 26 may include local, magnetic or optical memory, or local or remote repositories for measured data for reconstruction. Moreover, the memory devices may be configured to receive raw, partially processed or fully processed projection data for reconstruction. -
System controller 22 oroperator interface 24, or any remote systems and workstations, may include software for image processing and reconstruction. Therefore, some or all of the image processing may be performed remotely by additional computing resources based upon raw or partially processed image data. As will be appreciated by those skilled in the art, such processing of CT projection data may be performed by a number of mathematical algorithms and techniques. Aremote interface 28 may be included in the system for transmitting data from the imaging system to such remote processing stations or memory devices. - Fig. 2 is an illustration of the
scanner 12, shown in Fig. 1, with an exemplary X-ray source and a detector array. Referring to Fig. 2, thescanner 12 includes agantry 29. Thegantry 29 is illustrated with a source ofradiation 30, typically an X-ray tube, and adetector array 46. In a typical operation, theX-ray source 30 projects an X-ray beam toward thedetector array 46. Thedetector array 46 is generally formed by a number of detector elements, which sense the X-rays that pass through and around an object of interest. Each detector element produces an electrical signal that represents the intensity of the X-ray beam at the position of the element at the time the beam strikes the detector. Furthermore, thegantry 29 is rotated around an object of interest so that a number of radiographic views may be collected by thesystem controller 22 shown in Fig. 1. Thus, an image or slice is computed which may incorporate, in certain modes, less or more than 360 degrees of projection data, to formulate an image. The image may be further collimated to desired dimensions, for example, using either lead shutters in front of theX-ray source 30 and different detector apertures. As will be appreciated by those skilled in the art, the collimator typically defines the size and shape of the X-ray beam that emerges from theX-ray source 30. Thus, as theX-ray source 30 and thedetector 46 rotate, thedetector 46 collects data of the attenuated X-ray beams. - Although in the present discussion reference is made to a CT scanning system in which a source and detector rotate on a gantry arrangement, it should be borne in mind that the present technique is not limited to data collected on any particular type of scanner. For example, the technique may be applied to data collected via a scanner in which an X-ray source and a detector are effectively stationary and an object is rotated, or in which the detector is stationary but an X-ray source rotates. Further, the data could originate in a scanner in which both the X-ray source and detector are stationary, as where the X-ray source is distributed and can generate X-rays at different locations as will be described in greater detail with respect to Fig. 3. Similarly, although generally circular scan geometries are discussed, other geometries may be envisioned as well.
- Fig. 3 is a diagrammatical representation of an exemplary distributed X-ray source of a type that may be employed in the
CT system 10 of Fig. 1. As shown in Fig. 3, in an exemplary implementation, the distributedX-ray source 30 may include a series ofelectron beam emitters 32 that are coupled toradiation source controller 16 shown in Fig. 1, and are triggered by the source controller during operation of the scanner. Theelectron beam emitters 32 are positioned adjacent to a distributedtarget 34. Upon triggering by the source controller, theelectron beam emitters 32 may emitelectron beams 36 towardtarget 34. Thetarget 34, which may, for example, be a tungsten rail or element, emits X-ray radiation, as indicated atreference numeral 38, upon impact of the electron beams. In reflection mode, X-rays are meant to be produced primarily on the same side of the target as where the electrons impact. In transmission mode, X-rays are produced at the opposite side of the target. The X-ray beams 38 are directed, then toward acollimator 40, which is generally opaque to the X-ray radiation, but which includes openings orapertures 42. Theapertures 42 may be fixed in dimension, or may be adjustable.Apertures 42 permit a portion of the X-ray beams to penetrate through the collimator to form collimatedbeams 44 that will be directed to the imaging volume of the scanner, through the subject of interest, and that will impact detector elements on an opposite side of the scanner. - A number of alternative configurations for emitters or distributed sources may, of course, be envisaged. Moreover, the individual X-ray sources in the distributed source may emit various types and shapes of X-ray beams. These may include, for example, fan-shaped beams, cone-shaped beams, and beams of various cross-sectional geometries. Similarly, the various components comprising the distributed X-ray source may also vary. The emission devices may be one of many available electron emission devices, for example, thermionic emitters, carbon-based emitters, photo emitters, ferroelectric emitters, laser diodes, monolithic semiconductors, etc. Although a distributed source configuration has been discussed in detail here, any combination of one or more rotating-anode, stationary-anode, or distributed X-ray sources may be utilized in the
CT system 10. - Fig. 4 is a diagrammatical representation of a portion of a detector that may be employed by the
CT system 10 of Fig. 1. The detector arrangement may be generally similar to detectors used in conventional rotational CT systems. The detector may be extended around a greater portion or the entire inner surface of the scanner in certain embodiments. Each detector may be comprised of detector elements with varying resolution to satisfy a particular imaging application. In general, thedetector 46 includes a series ofdetector elements 48 and associatedsignal processing circuitry 50. These detector elements may be of one, two or more sizes, resulting in different spatial resolution characteristics in different portions of the measured projection data. Exemplary detector elements include an array of photodiodes and associated thin film transistors. X-ray radiation impacting the detectors is converted to lower energy photons by a scintillator and these photons impact the photodiodes. A charge maintained across the photodiodes is thus depleted, and the transistors may be controlled to recharge the photodiodes and thus measure the depletion of the charge. By sequentially measuring the charge depletion in the various photodiodes, each of which corresponds to a pixel in the collected data for each acquisition, data is collected that indirectly encodes radiation attenuation at each of the detector pixel locations. This data is processed by thesignal processing circuitry 50, which will generally convert the analog depletion signals to digital values, perform any necessary filtering, and transmit the acquired data to thesystem controller 22 of theimaging system 10 in Fig. 1 as described above. Although a detector configuration comprised of scintillation material and storage diodes is mentioned, any suitable detector for measuring X-rays may be used with the present technique. - Fig. 5 is a flowchart 52 depicting exemplary logic including exemplary steps for reconstructing image data from measured sinogram data acquired by the
CT system 10 of Fig. 1. In step 54, the projection data measurements are acquired from theCT system 10. As used herein, the term "projection data measurements" also refers to a sinogram. Instep 56, the measured sinogram data is pre-processed. For the exemplary embodiment illustrated in Fig. 5, pre-processing the measured sinogram data instep 56 further includes performing a beam hardening correction on the measured sinogram data instep 58, performing a detector point spread function (PSF) correction instep 60 and performing a detector lag correction instep 62 on the measured sinogram data as will be described in greater detail below. Instep 64, the pre-processed sinogram data is reconstructed to generate image data. In a specific embodiment of the present technique, a filtered back-projection technique is used to reconstruct the image data. The following paragraphs, describe the beam hardening correction process, the detector point spread function (PSF) correction process and the detector lag correction process in greater detail. - As will be appreciated by those skilled in the art, conventional X-ray sources for CT imaging typically comprise rotating anode tubes (or X-ray tubes) that possess polychromatic spectrums. That is, the X-ray photons emitted from such X-ray tubes do not all possess the same X-ray energy levels. Moreover, attenuation processes in matter are typically energy dependent. Non-uniform attenuation of different energies results in the preferential depletion of X-rays in energy ranges with higher attenuation coefficients. In general, X-rays in energy ranges that are more easily attenuated are referred to as soft X-rays while those in ranges that are more penetrating are referred to as hard X-rays.
- Beam hardening is the process of selective removal of soft X-rays from an X-ray beam. As these X-rays are removed, the beam becomes progressively harder or alternatively more penetrating. The amount of beam hardening typically depends on the initial X-ray spectrum as well as on the composition of the material traversed. In general, for a pre-determined initial X-ray spectrum and tissue type, the process of beam hardening represents a monotonic increase in beam hardness as a function of material thickness traversed. As a result of beam hardening, the effective attenuation coefficient of a material depends on the thickness of material traversed. This effect causes beam-hardening artifacts in CT images. As will be appreciated, beam-hardening artifacts, if uncorrected, create a cupping effect, or a reduction of the reconstructed attenuation coefficient toward the center of the object being imaged.
- In order to appreciate the benefits provided by embodiments of the present technique, reference is made to Figure 6 in which there is shown, a
flowchart 58 depicting exemplary steps for performing beam-hardening correction. Referring to Fig. 6, instep 66, a detector efficiency curve associated with theCT system 10 of Fig. 1 is initially computed. Then, the computed detector efficiency curve is used to correct the X-ray source spectrum as described below. As will be appreciated by those skilled in the art, the X-ray source spectrum is a measure of the distribution of X ray intensity as a function of energy. The exact nature of the distribution depends on the manner in which the X-rays are generated. The X-ray spectrum for a given X-ray source may be obtained by measurement, from the X-ray source supplier or may be determined through simulation. Further, in accordance with the present embodiment, the detector efficiency curve is computed as follows:
where E is the energy dependent attenuation co-efficient for the detector material, thkness, is the thickness of the detector material and µ is the attenuation. The X-ray source spectrum is scaled by the detector efficiency curve, d(E) to obtain a corrected X-ray source spectrum. Fig. 7 is an illustration of an original X-ray source spectrum and the corrected X-ray source spectrum. - In
step 68, an attenuation coefficient value for each material traversed by X-rays, at one or more X-ray energy levels is determined. In particular, the mass attenuation coefficient value, denoted by µ/p (where µ denotes the attenuation value and p denotes the density) is determined for each material. As will be appreciated by those skilled in the art, the mass attenuation coefficient p/p and the mass energy absorption coefficient, denoted by µen/ρ are basic quantities used to compute the penetration and the energy deposition by photons (which may comprise, for example, X-rays, or bremsstrahlung) in biological, shielding and other such materials. In accordance with this embodiment, to correct beam hardening effects, the mass attenuation coefficients, p/p, for each material is determined. Further, the mass attenuation coefficient µ/ρ at one or more energy levels is precomputed based upon a material composition and an X-ray source profile as follows. - As will be appreciated by those skilled in the art, the mass attenuation coefficient µ/ρ of a compound or a mixture of elements may be calculated by taking the weighted sum of the mass attenuation coefficients for each element, where a weight is assigned according to the fraction of the element contributing to the compound. Then, the mass absorption co-efficient may be obtained using the formula:

where wi is the fraction by weight of the ith atomic constituent. Furthermore, as will be appreciated by those skilled in the art, the values for the mass attenuation co-efficient, µi/ρi, and the mass energy-absorption coefficient, µen/ρ, as a function of photon energy, for various elements may be pre-determined. In addition, the fractions by weight may also be pre-determined. In accordance with the present embodiment, to obtain the µi/ρi values at all the absorption edges of all constituent elements, interpolation is performed. For example, in the case of a constituent element such as liquid water, the composition of Helium (H) and Oxygen (O) have fraction by weights of 0.111898 and 0.888102 respectively. Accordingly, the corresponding mass attenuation co-efficient was water is computed as follows:
- Fig. 8 is an illustration of the resultant mass attenuation coefficients for a range of photon energies. In particular, Fig. 8 indicates the mass attenuation coefficients µwater and the mass energy-absorption coefficient (µen/ρ) for water. To obtain the absorption co-efficients, µwater, for each X-ray energy level, the mass attenuation co-efficient (µ/ρ)water is multiplied with its density. (ρwater = 1)
- In
step 70, a beam hardening correction curve is analytically derived based on the mass attenuation coefficient at the one or more X-ray energy levels and the corrected X-ray source spectrum obtained instep 66. More specifically, in accordance with the present embodiment, the beam hardening correction curve is analytically derived based on attenuation resulting from beam hardening for an X-ray path length. In particular, a summation of one or more intensity values over the one or more X-ray energy levels is performed, wherein each X-ray energy level has a corresponding mass attenuation coefficient as follows:
where Ω(E) represents the incident X-ray spectrum probability distribution, µM(E) denotes the absorption co-efficients for a material M at an energy level E, and 10 and I represent the total incident and transmitted intensities, respectively. The beam hardening correction curve is then analytically generated based on the attenuation resulting from beam hardening and a linearized projection for the X-ray path length S by taking the logarithm of equation (4) as follows:
- It may be noted that equation (5) is a non-linear equation. Since, the basic assumption for the filtered backprojection in CT reconstruction is the linear integral equation from Lambert-Beers law, the main purpose of the beam hardening correction is therefore to linearize equation (5), so that filtered backprojection may be applied to the sinogram data for reconstruction without artifacts. In one embodiment of the present invention, this is accomplished by performing a linearization around the effective absorption coefficient µeff, as follows

where µ eff = µ(E eff) is computed for a user defined energy level E eff. Since, both Pbh and p are both functions of the path length for a fixed material, in accordance with embodiments of the present technique, a look up table between Pbh and p is created by eliminating the path length S as an argument. Then, the corrected sinogram after beam hardening correction is given by:
- As may be observed from equation (7), the effective absorption co-efficient µ eff is a scaling factor for the corrected sinogram, thereby enabling the choice of positive numbers for µ eff. Referring again to equations (5) and (6), the values of Pbh and p are computed for each path length S. The integration in equation (5) is implemented as a summation so that equation (5) is a function of the path length S. After calculating the pbh and p values associated with all possible values of the path length S, either a look-up table or a plot as shown in Fig 9 below, is generated, that includes all possible Pbh and p pairs. The corrected sinogram is then generated when each attenuation value at the measured sinogram is replaced with the corresponding p value using this analytical relationship between p and Pbh.
- Fig. 9 is an illustration of an analytically derived beam hardening correction curve. As indicated in Fig. 9, the measured sinogram value is represented by the x-axis and the corrected sinogram values correspond to the y-axis. In accordance with a particular embodiment, an optimization of the derived beam hardening correction curve is further performed based on one or more tuning parameters. Exemplary tuning parameters include an X-ray energy level value, an X-ray spectrum energy bin number, and a path length discretization number. As used herein, the X-ray spectrum energy bin number refers to the discretization level number associated with X-ray energy and the path length discretization number refers the quantization level number associated with the path length. For example, an X-ray spectrum energy bin number of 10 means that the total range of possible X-ray energies is divided in 10 subintervals. Similarly, a path length discretization number equal to 100 means that a path length range, such as, for example, between 0cm to 100cm would be quantized by 100, into 100 sub-intervals of 1cm. A finer discretization of the X-ray spectrum energy bin number and the path length discretization number leads to a better simulation but requires more computational time. Further, optimization of the X-ray spectrum energy bin number and the path length discretization number may also be performed to achieve faster results with a smaller error.
- Referring again to Fig. 5, in
steps - As will be appreciated by those skilled in the art, the detector lag and the detector PSF typically cause azimuthal and radial blur in the image domain, respectively. The detector time lag occurs from the fact that if a solid-state detector is exposed to X-ray photons for a period time and is then quickly switched off, the input X-ray and the detector reading does not reach a zero value immediately. Moreover, if the CT gantry speed or rotating table speed is faster than the decay rate of the solid state material, then the detector reading at each projection view is affected from the detector readings from past projection views. This, in turn, causes the azimuthal blur in the reconstruction image.
- The detector PSF is typically used to access the spatial resolution of an imaging system. The detector PSF generally originates from the scintillator behavior for the incident X-ray. This results in an X-Ray spread over several detector elements, which is characterized as the detector PSF. Since the PSF is across each detector element at each incident projection view, the PSF is referred to as a view angle invariant characteristic. Mathematically, the measurement from the detector which incorporates this characteristics is denoted by:

where y denotes the detector reading, x is the incident X-ray intensity, n denotes the noise and H denotes the convolution operator due to the detector lag and the detector PSF. In accordance with embodiments of the present technique, the convolution operator H is composed of two separable filters in detector view and detector row directions and is indicated as follows:
where h and g denote the blur due to detector lag and detector PSF respectively. - Referring to equation (8), in accordance with the present embodiment, the detector lag and the detector PSF correction is used to obtain the ideal X-ray intensity, x from the detector reading, y by deconvolving, H. In particular, an iterative deconvolution algorithm is applied to the measured sinogram data, to optimally correct the detector PSF and detector time lag. The iterative deconvolution algorithm is formulated as a nonlinear optimization problem as will be described in greater detail below.
- Referring again, to equation (8), again, the least square solution for equation (8) is obtained by the following equation:

where the superscript, T denotes the transpose, and + is the generalized inverse. As is known by those skilled in the art, a disadvantage of the least square solution, obtained using (10) is that the above least square solution does not take into consideration, the non-negative value for the resultant estimate of the intensity X̂. To obtain a non-negative estimate, a truncation to zero for the negative values may be computed, but such a direct inversion applied to equation (10) may result in an erroneous reconstruction. Therefore, in accordance with the present technique, a novel iterative deconvolution algorithm is applied, to the measured sinogram data. As mentioned above, the iterative deconvolution algorithm optimally corrects the detector PSF and detector time lag. Since, in general, the raw projection data should have a positive intensity, conventional deconvolution techniques that use linear filters (such as a Weiner filter, for example) are not optimal in nature. In accordance with embodiments of the present technique, the deconvolution problem is formulated as a non-linear optimization problem. The optimization problem results in an accurate deconvolution of the detector PSF and detector time lag. The optimization problem is formulated as follows:
where


- It may be noted that for any real number s, the expression x = exp(-s) cannot be negative. Therefore, in accordance with the present embodiment, the optimization problem depicted in equation (12) is solved without the use of any additional constraints. Also, since the solution to s may be any real number, the optimization problem may be solved using any standard non-linear optimization method such as for example, gradient search. As will be appreciated by those skilled in the art, an optimization problem that is solved without the use of additional constraints has a low associated computational cost. In contrast, more sophisticated algorithms exist that specifically deal with constraint problems, but come with a high associated computational cost.
- The embodiments illustrated and described above, provide a technique for reconstructing image data acquired from an imaging system. The beam hardening correction technique described above may be used for a plurality of materials without any tedious and expensive calibration procedures and provides a very accurate correction when combined with detector PSF and detector time lag correction. In addition, the proposed PSF and time lag correction technique, though iterative in nature, has negligible computational complexity as compared to iterative reconstruction techniques, since the iteration is performed in the measurement domain without resorting to computationally expensive forward and backprojections. For example, if 5~15 iterations are needed to get a reconstruction image by using a certain iterative reconstruction technique, 5-15 times the number of forward and backprojections would typically need to be performed. Assuming that the time required for one back-projection is Tbp and forward projection costs the same as back-projection, the total time needed for reconstruction will be 10~30 Tbp using an iterative reconstruction method. On the contrary, the pre-correction step performed in accordance with the present technique, requires one correction step and one back projection step to be performed. Therefore, the total computation time is equal to Tbp + pre-correction time. In view of the fact that the pre-correction time is known to be smaller than Tbp, the total computation time for pre-correction is lesser than twice the value of Tbp, which is a considerable improvement over the existing iterative reconstruction techniques. Furthermore, the resultant reconstructed CT image with pre-correction in accordance with the present technique achieves high image quality with minimal increments to computational time as compared to conventional filtered back-projection techniques.
Claims (10)
- A method for reconstructing image data from measured sinogram data acquired from a Computed Tomography (CT) system (10), the method comprising:pre-processing the measured sinogram data, wherein the pre-processing comprises performing a beam hardening correction on the measured sinogram data and performing a detector point spread function (PSF) correction and a detector lag correction on the measured sinogram data; andreconstructing the pre-processed sinogram data to generate the image data,wherein the CT system (10) is configured for industrial imaging.
- The method of claim 1, wherein performing the beam hardening correction on the measured sinogram data comprises:computing a detector efficiency curve associated with the CT system (10);scaling an X-ray source spectrum by the detector efficiency curve to obtain a corrected X-ray source spectrum;determining an attenuation coefficient value for each material traversed by at least one X-ray, at one or more X-ray energy levels, wherein the attenuation coefficient value at the one or more X-ray energy levels is precomputed based upon a material composition and an X-ray source profile; andanalytically deriving a beam hardening correction curve based on the attenuation coefficient value at the one or more X-ray energy levels and the corrected X-ray source spectrum.
- The method of claim 2, wherein analytically deriving the beam hardening correction curve further comprises analytically deriving an attenuation value resulting from beam hardening for an X-ray path length, based on a summation of one or more intensity values over the one or more X-ray energy levels, wherein each X-ray energy level has a corresponding attenuation coefficient value, and wherein the beam hardening correction curve is analytically derived based on the attenuation value resulting from beam hardening and a linearized projection for the X-ray path length.
- The method of claim 2, further comprising performing an optimization of the beam hardening correction curve based on one or more tuning parameters, wherein the tuning parameters comprise at least one of an X-ray energy level, an X-ray spectrum energy bin number and a path length discretization number.
- The method of claim 1, wherein performing the detector PSF correction and the detector lag correction comprises deconvolving the measured sinogram data along one or more detector rows and detector view directions, and wherein performing the detector PSF correction and detector lag correction further comprises applying an iterative deconvolution algorithm to the measured sinogram data.
- A method for reconstructing image data from measured sinogram data acquired from a Computed Tomography (CT) system (10), the method comprising:pre-processing the sinogram data, wherein the pre-processing comprises performing a detector point spread function (PSF) correction and a detector lag correction on the measured sinogram data, and wherein the detector PSF correction and the detector lag correction comprises deconvolving the measured sinogram data along one or more detector rows and detector view directions; andreconstructing the pre-processed sinogram data to generate the image data, wherein the CT system (10) is adapted for industrial imaging.
- The method of claim 6, wherein performing the detector PSF correction and the detector lag correction further comprises applying an iterative deconvolution algorithm to the measured sinogram data, wherein the iterative deconvolution algorithm is formulated as a nonlinear optimization problem.
- The method of claim 6, wherein the pre-processed sinogram data is filtered and backprojected to generate reconstructed image data.
- A computed tomography (CT) system (10) for reconstructing image data from measured sinogram data, the computed tomography system comprising:an X-ray source (30) configured to project a plurality of polychromatic X-ray beams (38) through an object;a detector (46) configured to produce a plurality of electrical signals in response to a plurality of X-ray beams (38) received from the source;(30) anda system controller (22) configured to process the plurality of electrical signals to generate the measured sinogram data, wherein the system controller (22) is further configured to pre-process the measured sinogram data to perform a beam hardening correction on the measured sinogram data, wherein the system controller (22) is further configured to perform a detector point spread function (PSF) correction and a detector lag correction on the measured sinogram data and wherein the system controller (22) is further configured to reconstruct the pre-processed sinogram data to generate the image data,wherein the CT system (10) is adapted for industrial imaging.
- The computed tomography system of claim 9, wherein the system controller (22) is configured to perform the detector PSF correction and the detector lag correction by a deconvolution of the measured sinogram data along one or more detector rows and detector view directions, by applying an iterative deconvolution algorithm to the measured sinogram data, wherein the iterative deconvolution algorithm is formulated as a nonlinear optimization problem.
Applications Claiming Priority (1)
| Application Number | Priority Date | Filing Date | Title |
|---|---|---|---|
| US10/955,623 US7215732B2 (en) | 2004-09-30 | 2004-09-30 | Method and system for CT reconstruction with pre-correction |
Publications (2)
| Publication Number | Publication Date |
|---|---|
| EP1643447A1 true EP1643447A1 (en) | 2006-04-05 |
| EP1643447B1 EP1643447B1 (en) | 2007-12-12 |
Family
ID=35447174
Family Applications (1)
| Application Number | Title | Priority Date | Filing Date |
|---|---|---|---|
| EP05255628A Expired - Lifetime EP1643447B1 (en) | 2004-09-30 | 2005-09-14 | Method and system for CT reconstruction with pre-correction |
Country Status (4)
| Country | Link |
|---|---|
| US (1) | US7215732B2 (en) |
| EP (1) | EP1643447B1 (en) |
| JP (1) | JP4656413B2 (en) |
| DE (1) | DE602005003738T2 (en) |
Cited By (1)
| Publication number | Priority date | Publication date | Assignee | Title |
|---|---|---|---|---|
| US20240046534A1 (en) * | 2021-04-16 | 2024-02-08 | Shanghai United Imaging Healthcare Co., Ltd. | Systems and methods for imaging |
Families Citing this family (43)
| Publication number | Priority date | Publication date | Assignee | Title |
|---|---|---|---|---|
| US7208717B2 (en) * | 2002-10-16 | 2007-04-24 | Varian Medical Systems Technologies, Inc. | Method and apparatus for correcting excess signals in an imaging system |
| US7376255B2 (en) * | 2004-06-23 | 2008-05-20 | General Electric Company | System and method for image reconstruction |
| US7251306B2 (en) * | 2004-11-17 | 2007-07-31 | General Electric Company | Methods, apparatus, and software to facilitate iterative reconstruction of images |
| DE102005019572A1 (en) * | 2005-04-27 | 2006-11-09 | Siemens Ag | Method for evaluating and displaying X-ray projection images and X-ray screening device |
| DE102005028225A1 (en) * | 2005-06-17 | 2007-05-24 | Siemens Ag | Apparatus and method for computed tomography |
| DE102005028216A1 (en) * | 2005-06-17 | 2006-12-28 | Siemens Ag | Computer tomography medical examination device comprises radiation source, detector, data memory, and evaluation unit connected downstream of detector for correcting radiation hardening of projection image |
| CA2625089A1 (en) * | 2005-10-06 | 2007-04-19 | Imaging Sciences International, Inc. | Scatter correction |
| US7298812B2 (en) * | 2006-03-31 | 2007-11-20 | General Electric Company | Image-based material decomposition |
| JP4614001B2 (en) * | 2006-04-13 | 2011-01-19 | 株式会社島津製作所 | Three-dimensional quantitative method using transmitted X-ray |
| JP2008073342A (en) * | 2006-09-22 | 2008-04-03 | Konica Minolta Medical & Graphic Inc | Radiographic image capturing system and radiographic image capturing method |
| DE102006046047A1 (en) * | 2006-09-28 | 2008-04-03 | Siemens Ag | Method for combining beam hardening and scattered radiation adjustment in x-ray-computer-tomography of heterogeneous objects, involves moving x-ray source around object |
| US7551708B2 (en) * | 2007-02-07 | 2009-06-23 | General Electric Company | Method of iterative reconstruction for energy discriminating computed tomography systems |
| WO2008103435A1 (en) * | 2007-02-22 | 2008-08-28 | Indiana University Research & Technology Corporation | Imaging resolution recovery techniques |
| US8045776B2 (en) * | 2007-03-06 | 2011-10-25 | General Electric Company | Geometry-dependent filtering in CT method and apparatus |
| JP5076240B2 (en) * | 2008-02-05 | 2012-11-21 | 富士フイルム株式会社 | Imaging apparatus, imaging method, and program |
| US20110158492A1 (en) | 2008-06-27 | 2011-06-30 | Jarisch Wolfram R | High efficiency computed tomography |
| US8660330B2 (en) | 2008-06-27 | 2014-02-25 | Wolfram Jarisch | High efficiency computed tomography with optimized recursions |
| US8194820B2 (en) * | 2009-02-06 | 2012-06-05 | The Board Of Trustees Of The Leland Stanford Junior University | Optimal weights for measuring spectral x-ray data |
| CN101533098B (en) * | 2009-04-08 | 2011-08-03 | 西北工业大学 | Method for reducing noise in hardening correction of CT beam |
| US8655033B2 (en) * | 2009-10-28 | 2014-02-18 | General Electric Company | Iterative reconstruction |
| US9123156B2 (en) | 2010-10-14 | 2015-09-01 | Hitachi Medical Corporation | X-ray CT apparatus and image reconstruction method |
| JP5922892B2 (en) * | 2011-08-26 | 2016-05-24 | Ntn株式会社 | Rolling body inspection method and rolling body manufacturing method |
| EP2792303A4 (en) * | 2011-12-18 | 2015-08-05 | Nat Univ Corp Kyoto Univ | MOTION TRACKING TOMODENSITOMETRY IMAGE PROCESSING METHOD AND MOTION TRACKING MOTION THOMODENSITOMETRY IMAGE PROCESSING DEVICE |
| US9460494B2 (en) | 2012-02-03 | 2016-10-04 | The Research Foundation For The State University Of New York | Methods and systems for inverse problem reconstruction and application to ECT reconstruction |
| JP5883689B2 (en) * | 2012-03-14 | 2016-03-15 | 株式会社日立製作所 | X-ray imaging apparatus and X-ray imaging method |
| JP6031339B2 (en) | 2012-11-21 | 2016-11-24 | 富士フイルム株式会社 | Perspective image density correction method, nondestructive inspection method, and image processing apparatus |
| KR101527656B1 (en) * | 2013-12-12 | 2015-06-10 | 한국과학기술원 | Method and system for interpolating point spread function using nongrid image registration in medical image |
| US9415546B2 (en) * | 2014-01-29 | 2016-08-16 | Xerox Corporation | System and method for controlling material drop volume in three dimensional object printing |
| US9351697B2 (en) | 2014-03-04 | 2016-05-31 | General Electric Company | Method and system for dimensional analysis of an object |
| KR101783001B1 (en) * | 2015-01-20 | 2017-09-28 | 삼성전자주식회사 | Tomography imaging appratus and method |
| CN104751429B (en) * | 2015-01-27 | 2018-02-02 | 南方医科大学 | A kind of low dosage power spectrum CT image processing methods based on dictionary learning |
| CN106353828B (en) * | 2015-07-22 | 2018-09-21 | 清华大学 | The method and apparatus that checked property body weight is estimated in safe examination system |
| WO2017019554A1 (en) * | 2015-07-24 | 2017-02-02 | Photo Diagnostic Systems, Inc. | Method and apparatus for performing multi-energy (including dual energy) computed tomography (ct) imaging |
| KR101850871B1 (en) * | 2015-08-26 | 2018-04-23 | 주식회사 디알텍 | Method for processing radiography image and radiography system |
| KR101717433B1 (en) * | 2015-09-01 | 2017-03-17 | 연세대학교 산학협력단 | The beam-hardening correction method in X-ray CT |
| CN108242066B (en) * | 2016-12-26 | 2023-04-14 | 通用电气公司 | Spatial resolution enhancement device and method for CT image and CT imaging system |
| US10475214B2 (en) * | 2017-04-05 | 2019-11-12 | General Electric Company | Tomographic reconstruction based on deep learning |
| US10573030B2 (en) | 2017-04-07 | 2020-02-25 | Photo Diagnostic Systems, Inc. | Method for artifact reduction using monoenergetic data in computed tomography |
| US10426424B2 (en) | 2017-11-21 | 2019-10-01 | General Electric Company | System and method for generating and performing imaging protocol simulations |
| DE102018103714A1 (en) * | 2018-02-20 | 2019-08-22 | Volume Graphics Gmbh | Method for determining errors of parameters derived from digital object representations |
| EP3571997B1 (en) | 2018-05-23 | 2022-11-23 | Siemens Healthcare GmbH | Method and device for determining the weight of a patient and/or a body mass index |
| WO2020202617A1 (en) * | 2019-03-29 | 2020-10-08 | 富士フイルム株式会社 | Image processing apparatus, radiograph photographing system, image processing method, and image processing program |
| CN114152637B (en) * | 2022-02-07 | 2022-04-26 | 东莞市志橙半导体材料有限公司 | A kind of hard silicon carbide material punching detection device and method |
Citations (1)
| Publication number | Priority date | Publication date | Assignee | Title |
|---|---|---|---|---|
| EP0487243A2 (en) * | 1990-11-19 | 1992-05-27 | General Electric Company | Computed tomography |
Family Cites Families (18)
| Publication number | Priority date | Publication date | Assignee | Title |
|---|---|---|---|---|
| JPS63147440A (en) * | 1986-12-12 | 1988-06-20 | 横河メディカルシステム株式会社 | Deconvolution processing method of x-ray tomographic imaging apparatus |
| US5099505A (en) * | 1990-07-02 | 1992-03-24 | Varian Associates | Method for increasing the accuracy of a radiation therapy apparatus |
| AU646068B2 (en) * | 1990-07-02 | 1994-02-03 | Varian Medical Systems, Inc. | Computed tomography apparatus using image intensifier detector |
| US5359638A (en) * | 1992-03-30 | 1994-10-25 | General Electric Company | Method for recursive filtering residual afterglow from previous computed tomography scans |
| US5878108A (en) * | 1995-11-30 | 1999-03-02 | Hitachi Medical Corporation | Method for generating X-ray image and apparatus therefor |
| US5774521A (en) * | 1996-07-08 | 1998-06-30 | Cedars-Sinai Medical Center | Regularization technique for densitometric correction |
| US6067342A (en) * | 1997-10-30 | 2000-05-23 | Analogic Corporation | Digital filmless X-ray projection imaging system and method |
| US6928182B1 (en) * | 1998-10-15 | 2005-08-09 | Kui Ming Chui | Imaging |
| US6285799B1 (en) * | 1998-12-15 | 2001-09-04 | Xerox Corporation | Apparatus and method for measuring a two-dimensional point spread function of a digital image acquisition system |
| US6345113B1 (en) * | 1999-01-12 | 2002-02-05 | Analogic Corporation | Apparatus and method for processing object data in computed tomography data using object projections |
| EP1072861B1 (en) * | 1999-05-10 | 2006-05-10 | GE Inspection Technologies GmbH | Method for measuring the wall thickness of a tubular object |
| US6421409B1 (en) * | 2000-02-02 | 2002-07-16 | Ut-Battelle Llc | Ultra-high resolution computed tomography imaging |
| CN101422372B (en) * | 2000-02-18 | 2013-06-12 | 威廉博蒙特医院 | Cone-beam computerized tomography with a flat-panel imager |
| JP3837495B2 (en) * | 2002-02-28 | 2006-10-25 | 独立行政法人産業技術総合研究所 | Optical imaging system |
| US6850589B2 (en) * | 2002-03-27 | 2005-02-01 | Agilent Technologies, Inc. | Tomography of curved surfaces |
| US7254209B2 (en) * | 2003-11-17 | 2007-08-07 | General Electric Company | Iterative CT reconstruction method using multi-modal edge information |
| US7376255B2 (en) * | 2004-06-23 | 2008-05-20 | General Electric Company | System and method for image reconstruction |
| US7203267B2 (en) * | 2004-06-30 | 2007-04-10 | General Electric Company | System and method for boundary estimation using CT metrology |
-
2004
- 2004-09-30 US US10/955,623 patent/US7215732B2/en not_active Expired - Fee Related
-
2005
- 2005-09-14 EP EP05255628A patent/EP1643447B1/en not_active Expired - Lifetime
- 2005-09-14 DE DE602005003738T patent/DE602005003738T2/en not_active Expired - Lifetime
- 2005-09-22 JP JP2005274871A patent/JP4656413B2/en not_active Expired - Fee Related
Patent Citations (1)
| Publication number | Priority date | Publication date | Assignee | Title |
|---|---|---|---|---|
| EP0487243A2 (en) * | 1990-11-19 | 1992-05-27 | General Electric Company | Computed tomography |
Non-Patent Citations (4)
| Title |
|---|
| IDRIS A. ELBAKRI: "Statistical Reconstruction Algorithms for Polyenergetic X-ray Computed Tomography", 2003, PHD THESIS, UNIVERSITY OF MICHIGAN, UNIVERSITY OF MICHIGAN, XP002359012 * |
| JIANG HSIEH: "Computed Tomography", 2003, SPIE PRESS, BELLINGHAM, WASHINGTON, USA, ISBN: 0-8194-4425-1, XP002359011 * |
| LA RIVIERE P J: "Penalized-likelihood sinogram restoration for CT artifact correction", NUCLEAR SCIENCE SYMPOSIUM CONFERENCE RECORD, 2004 IEEE ROME, ITALY 16-22 OCT. 2004, PISCATAWAY, NJ, USA,IEEE, 16 October 2004 (2004-10-16), pages 3303 - 3307, XP010819392, ISBN: 0-7803-8700-7 * |
| SIEWERDSEN J H ET AL: "Cone-beam computed tomography with a flat-panel imager: Effects of image lag", MEDICAL PHYSICS, AMERICAN INSTITUTE OF PHYSICS. NEW YORK, US, vol. 26, no. 12, December 1999 (1999-12-01), pages 2635 - 2647, XP012010679, ISSN: 0094-2405 * |
Cited By (1)
| Publication number | Priority date | Publication date | Assignee | Title |
|---|---|---|---|---|
| US20240046534A1 (en) * | 2021-04-16 | 2024-02-08 | Shanghai United Imaging Healthcare Co., Ltd. | Systems and methods for imaging |
Also Published As
| Publication number | Publication date |
|---|---|
| JP4656413B2 (en) | 2011-03-23 |
| DE602005003738D1 (en) | 2008-01-24 |
| JP2006105975A (en) | 2006-04-20 |
| EP1643447B1 (en) | 2007-12-12 |
| DE602005003738T2 (en) | 2008-12-04 |
| US20060067461A1 (en) | 2006-03-30 |
| US7215732B2 (en) | 2007-05-08 |
Similar Documents
| Publication | Publication Date | Title |
|---|---|---|
| EP1643447B1 (en) | Method and system for CT reconstruction with pre-correction | |
| CN101138501B (en) | Method and system for generating a multi-spectral image of an object | |
| US7376255B2 (en) | System and method for image reconstruction | |
| CN101158653B (en) | A Scattering Measurement and Calibration Method for Cone Beam CT System | |
| CN103987320B (en) | X-ray CT device and scattered X-ray correction method | |
| US7386088B2 (en) | Method and system for iterative image reconstruction | |
| US10902650B2 (en) | X-ray beam-hardening correction in tomographic reconstruction using the Alvarez-Macovski attenuation model | |
| Reiter et al. | SimCT: a simulation tool for X-ray imaging | |
| US20140218362A1 (en) | Monte carlo modeling of field angle-dependent spectra for radiographic imaging systems | |
| US20080165920A1 (en) | Method and apparatus for reduction of metal artifacts in ct imaging | |
| Bhatia et al. | Scattering correction using continuously thickness-adapted kernels | |
| Wiegert et al. | Model based scatter correction for cone-beam computed tomography | |
| Banjak | X-ray computed tomography reconstruction on non-standard trajectories for robotized inspection | |
| JP2022113115A (en) | Beam hardening calibration method, x-ray ct apparatus and beam hardening calibration program | |
| Stolfi et al. | Error sources | |
| Schörner et al. | Comparison between beam-stop and beam-hole array scatter correction techniques for industrial X-ray cone-beam CT | |
| US20100080339A1 (en) | Modeling of the point-spread-function in single-pinhole and multi-pinhole spect reconstruction | |
| US12131409B2 (en) | Calibration method for a spectral computerized tomography system | |
| US7801266B2 (en) | Method for speeding up the scattered radiation correction in a computed tomography system | |
| US12076173B2 (en) | System and method for controlling errors in computed tomography number | |
| US7676074B2 (en) | Systems and methods for filtering data in a medical imaging system | |
| US7385200B2 (en) | Re-binning method for nuclear medicine imaging devices | |
| Li et al. | Improved Circular Edge Analysis Method for Measuring the Focus Size and Shape in High-Energy Electron Accelerator | |
| Alsaffar et al. | Multi-Material Blind Beam Hardening Correction Based on Non-Linearity Adjustment of Projections | |
| JP2024078263A (en) | Correction device, method and program |
Legal Events
| Date | Code | Title | Description |
|---|---|---|---|
| PUAI | Public reference made under article 153(3) epc to a published international application that has entered the european phase |
Free format text: ORIGINAL CODE: 0009012 |
|
| AK | Designated contracting states |
Kind code of ref document: A1 Designated state(s): AT BE BG CH CY CZ DE DK EE ES FI FR GB GR HU IE IS IT LI LT LU LV MC NL PL PT RO SE SI SK TR |
|
| AX | Request for extension of the european patent |
Extension state: AL BA HR MK YU |
|
| 17P | Request for examination filed |
Effective date: 20061005 |
|
| 17Q | First examination report despatched |
Effective date: 20061108 |
|
| AKX | Designation fees paid |
Designated state(s): DE FR GB |
|
| GRAP | Despatch of communication of intention to grant a patent |
Free format text: ORIGINAL CODE: EPIDOSNIGR1 |
|
| GRAS | Grant fee paid |
Free format text: ORIGINAL CODE: EPIDOSNIGR3 |
|
| GRAA | (expected) grant |
Free format text: ORIGINAL CODE: 0009210 |
|
| AK | Designated contracting states |
Kind code of ref document: B1 Designated state(s): DE FR GB |
|
| REG | Reference to a national code |
Ref country code: GB Ref legal event code: FG4D |
|
| REF | Corresponds to: |
Ref document number: 602005003738 Country of ref document: DE Date of ref document: 20080124 Kind code of ref document: P |
|
| ET | Fr: translation filed | ||
| PLBE | No opposition filed within time limit |
Free format text: ORIGINAL CODE: 0009261 |
|
| STAA | Information on the status of an ep patent application or granted ep patent |
Free format text: STATUS: NO OPPOSITION FILED WITHIN TIME LIMIT |
|
| 26N | No opposition filed |
Effective date: 20080915 |
|
| PGFP | Annual fee paid to national office [announced via postgrant information from national office to epo] |
Ref country code: DE Payment date: 20130927 Year of fee payment: 9 |
|
| PGFP | Annual fee paid to national office [announced via postgrant information from national office to epo] |
Ref country code: FR Payment date: 20130919 Year of fee payment: 9 Ref country code: GB Payment date: 20130927 Year of fee payment: 9 |
|
| REG | Reference to a national code |
Ref country code: DE Ref legal event code: R119 Ref document number: 602005003738 Country of ref document: DE |
|
| GBPC | Gb: european patent ceased through non-payment of renewal fee |
Effective date: 20140914 |
|
| REG | Reference to a national code |
Ref country code: FR Ref legal event code: ST Effective date: 20150529 |
|
| PG25 | Lapsed in a contracting state [announced via postgrant information from national office to epo] |
Ref country code: GB Free format text: LAPSE BECAUSE OF NON-PAYMENT OF DUE FEES Effective date: 20140914 Ref country code: DE Free format text: LAPSE BECAUSE OF NON-PAYMENT OF DUE FEES Effective date: 20150401 |
|
| PG25 | Lapsed in a contracting state [announced via postgrant information from national office to epo] |
Ref country code: FR Free format text: LAPSE BECAUSE OF NON-PAYMENT OF DUE FEES Effective date: 20140930 |