EP1608786B1 - Genomic profiling of regulatory factor binding sites - Google Patents
Genomic profiling of regulatory factor binding sites Download PDFInfo
- Publication number
- EP1608786B1 EP1608786B1 EP04758363A EP04758363A EP1608786B1 EP 1608786 B1 EP1608786 B1 EP 1608786B1 EP 04758363 A EP04758363 A EP 04758363A EP 04758363 A EP04758363 A EP 04758363A EP 1608786 B1 EP1608786 B1 EP 1608786B1
- Authority
- EP
- European Patent Office
- Prior art keywords
- gene
- seq
- database
- binding sites
- regulatory
- Prior art date
- Legal status (The legal status is an assumption and is not a legal conclusion. Google has not performed a legal analysis and makes no representation as to the accuracy of the status listed.)
- Expired - Lifetime
Links
- 230000027455 binding Effects 0.000 title claims abstract description 101
- 230000001105 regulatory effect Effects 0.000 title claims abstract description 90
- 108090000623 proteins and genes Proteins 0.000 claims abstract description 105
- 238000000034 method Methods 0.000 claims abstract description 58
- 238000013507 mapping Methods 0.000 claims abstract description 12
- 108091028043 Nucleic acid sequence Proteins 0.000 claims abstract description 9
- 241000282414 Homo sapiens Species 0.000 claims description 91
- 102000040945 Transcription factor Human genes 0.000 claims description 13
- 108091023040 Transcription factor Proteins 0.000 claims description 13
- 239000011159 matrix material Substances 0.000 claims description 10
- 238000011144 upstream manufacturing Methods 0.000 claims description 10
- 238000012216 screening Methods 0.000 claims description 9
- 238000011160 research Methods 0.000 claims description 5
- 230000002103 transcriptional effect Effects 0.000 claims description 5
- 238000007877 drug screening Methods 0.000 claims description 3
- 238000012910 preclinical development Methods 0.000 claims description 3
- 238000010200 validation analysis Methods 0.000 claims description 3
- 238000005457 optimization Methods 0.000 claims description 2
- 241000251539 Vertebrata <Metazoa> Species 0.000 claims 1
- 108020004414 DNA Proteins 0.000 description 66
- 238000013518 transcription Methods 0.000 description 19
- 230000035897 transcription Effects 0.000 description 19
- 101100351017 Mus musculus Pax4 gene Proteins 0.000 description 18
- 102100024026 Transcription factor E2F1 Human genes 0.000 description 12
- 210000001519 tissue Anatomy 0.000 description 12
- 108010045171 Cyclic AMP Response Element-Binding Protein Proteins 0.000 description 11
- 102000005636 Cyclic AMP Response Element-Binding Protein Human genes 0.000 description 11
- 238000013515 script Methods 0.000 description 11
- 102100037060 Forkhead box protein D3 Human genes 0.000 description 10
- 102100035134 Forkhead box protein J2 Human genes 0.000 description 10
- 101001029308 Homo sapiens Forkhead box protein D3 Proteins 0.000 description 10
- 101150051296 foxj2 gene Proteins 0.000 description 10
- 108010083123 CDX2 Transcription Factor Proteins 0.000 description 9
- 102000006277 CDX2 Transcription Factor Human genes 0.000 description 9
- 102100041001 Forkhead box protein I1 Human genes 0.000 description 9
- 101000892875 Homo sapiens Forkhead box protein I1 Proteins 0.000 description 9
- 108010038661 Hepatocyte Nuclear Factor 3-alpha Proteins 0.000 description 8
- 102000010818 Hepatocyte Nuclear Factor 3-alpha Human genes 0.000 description 8
- 108010087745 Hepatocyte Nuclear Factor 3-beta Proteins 0.000 description 7
- 102000009094 Hepatocyte Nuclear Factor 3-beta Human genes 0.000 description 7
- 210000000349 chromosome Anatomy 0.000 description 7
- 102000007354 PAX6 Transcription Factor Human genes 0.000 description 6
- 108010032788 PAX6 Transcription Factor Proteins 0.000 description 6
- 238000004458 analytical method Methods 0.000 description 6
- 230000014509 gene expression Effects 0.000 description 6
- 101100518995 Caenorhabditis elegans pax-3 gene Proteins 0.000 description 5
- 102100023580 Cyclic AMP-dependent transcription factor ATF-4 Human genes 0.000 description 5
- 108700039691 Genetic Promoter Regions Proteins 0.000 description 5
- 101000905743 Homo sapiens Cyclic AMP-dependent transcription factor ATF-4 Proteins 0.000 description 5
- 101000931493 Mus musculus Forkhead box protein F1 Proteins 0.000 description 5
- 101100518997 Mus musculus Pax3 gene Proteins 0.000 description 5
- 101000667988 Xenopus laevis Homeobox protein vent1 Proteins 0.000 description 5
- 238000011161 development Methods 0.000 description 5
- 230000018109 developmental process Effects 0.000 description 5
- 102100023319 Dihydrolipoyl dehydrogenase, mitochondrial Human genes 0.000 description 4
- 102100027570 Forkhead box protein Q1 Human genes 0.000 description 4
- 101710088110 Forkhead box protein Q1 Proteins 0.000 description 4
- 102100038073 General transcription factor II-I Human genes 0.000 description 4
- 101710144827 General transcription factor II-I Proteins 0.000 description 4
- 102100028092 Homeobox protein Nkx-3.1 Human genes 0.000 description 4
- 101000578249 Homo sapiens Homeobox protein Nkx-3.1 Proteins 0.000 description 4
- 108010032036 Interferon Regulatory Factor-7 Proteins 0.000 description 4
- 102100038070 Interferon regulatory factor 7 Human genes 0.000 description 4
- 108010084438 Oncogene Protein v-maf Proteins 0.000 description 4
- 101150058731 STAT5A gene Proteins 0.000 description 4
- 102100024481 Signal transducer and activator of transcription 5A Human genes 0.000 description 4
- 210000004027 cell Anatomy 0.000 description 4
- 101150005734 CREB1 gene Proteins 0.000 description 3
- 102100023374 Forkhead box protein M1 Human genes 0.000 description 3
- 101000907578 Homo sapiens Forkhead box protein M1 Proteins 0.000 description 3
- 239000003999 initiator Substances 0.000 description 3
- 210000003205 muscle Anatomy 0.000 description 3
- 230000008569 process Effects 0.000 description 3
- 102000004169 proteins and genes Human genes 0.000 description 3
- 102000037983 regulatory factors Human genes 0.000 description 3
- 108091008025 regulatory factors Proteins 0.000 description 3
- 102100035416 Forkhead box protein O4 Human genes 0.000 description 2
- 101000877683 Homo sapiens Forkhead box protein O4 Proteins 0.000 description 2
- 108700009124 Transcription Initiation Site Proteins 0.000 description 2
- 239000011230 binding agent Substances 0.000 description 2
- 208000037265 diseases, disorders, signs and symptoms Diseases 0.000 description 2
- 108020004999 messenger RNA Proteins 0.000 description 2
- 230000001225 therapeutic effect Effects 0.000 description 2
- 108091035707 Consensus sequence Proteins 0.000 description 1
- 230000004568 DNA-binding Effects 0.000 description 1
- 102000028526 Dihydrolipoamide Dehydrogenase Human genes 0.000 description 1
- 108010028127 Dihydrolipoamide Dehydrogenase Proteins 0.000 description 1
- 108010063774 E2F1 Transcription Factor Proteins 0.000 description 1
- 108010033714 Maf Transcription Factors Proteins 0.000 description 1
- 101100518987 Mus musculus Pax1 gene Proteins 0.000 description 1
- 108010057466 NF-kappa B Proteins 0.000 description 1
- 102000003945 NF-kappa B Human genes 0.000 description 1
- 102000009572 RNA Polymerase II Human genes 0.000 description 1
- 108010009460 RNA Polymerase II Proteins 0.000 description 1
- 108091081021 Sense strand Proteins 0.000 description 1
- 238000013459 approach Methods 0.000 description 1
- 230000015572 biosynthetic process Effects 0.000 description 1
- 230000001276 controlling effect Effects 0.000 description 1
- 201000010099 disease Diseases 0.000 description 1
- 238000007876 drug discovery Methods 0.000 description 1
- 239000003596 drug target Substances 0.000 description 1
- 230000000694 effects Effects 0.000 description 1
- 239000003623 enhancer Substances 0.000 description 1
- 230000006870 function Effects 0.000 description 1
- 238000005259 measurement Methods 0.000 description 1
- 230000007246 mechanism Effects 0.000 description 1
- 238000002493 microarray Methods 0.000 description 1
- 238000012986 modification Methods 0.000 description 1
- 230000004048 modification Effects 0.000 description 1
- 102000039446 nucleic acids Human genes 0.000 description 1
- 108020004707 nucleic acids Proteins 0.000 description 1
- 150000007523 nucleic acids Chemical class 0.000 description 1
- 238000012827 research and development Methods 0.000 description 1
- 230000004044 response Effects 0.000 description 1
- 239000007787 solid Substances 0.000 description 1
- 241000894007 species Species 0.000 description 1
- 238000002560 therapeutic procedure Methods 0.000 description 1
Images




Classifications
-
- G—PHYSICS
- G16—INFORMATION AND COMMUNICATION TECHNOLOGY [ICT] SPECIALLY ADAPTED FOR SPECIFIC APPLICATION FIELDS
- G16B—BIOINFORMATICS, i.e. INFORMATION AND COMMUNICATION TECHNOLOGY [ICT] SPECIALLY ADAPTED FOR GENETIC OR PROTEIN-RELATED DATA PROCESSING IN COMPUTATIONAL MOLECULAR BIOLOGY
- G16B20/00—ICT specially adapted for functional genomics or proteomics, e.g. genotype-phenotype associations
-
- G—PHYSICS
- G16—INFORMATION AND COMMUNICATION TECHNOLOGY [ICT] SPECIALLY ADAPTED FOR SPECIFIC APPLICATION FIELDS
- G16B—BIOINFORMATICS, i.e. INFORMATION AND COMMUNICATION TECHNOLOGY [ICT] SPECIALLY ADAPTED FOR GENETIC OR PROTEIN-RELATED DATA PROCESSING IN COMPUTATIONAL MOLECULAR BIOLOGY
- G16B20/00—ICT specially adapted for functional genomics or proteomics, e.g. genotype-phenotype associations
- G16B20/30—Detection of binding sites or motifs
-
- C—CHEMISTRY; METALLURGY
- C12—BIOCHEMISTRY; BEER; SPIRITS; WINE; VINEGAR; MICROBIOLOGY; ENZYMOLOGY; MUTATION OR GENETIC ENGINEERING
- C12Q—MEASURING OR TESTING PROCESSES INVOLVING ENZYMES, NUCLEIC ACIDS OR MICROORGANISMS; COMPOSITIONS OR TEST PAPERS THEREFOR; PROCESSES OF PREPARING SUCH COMPOSITIONS; CONDITION-RESPONSIVE CONTROL IN MICROBIOLOGICAL OR ENZYMOLOGICAL PROCESSES
- C12Q1/00—Measuring or testing processes involving enzymes, nucleic acids or microorganisms; Compositions therefor; Processes of preparing such compositions
- C12Q1/68—Measuring or testing processes involving enzymes, nucleic acids or microorganisms; Compositions therefor; Processes of preparing such compositions involving nucleic acids
- C12Q1/6876—Nucleic acid products used in the analysis of nucleic acids, e.g. primers or probes
- C12Q1/6883—Nucleic acid products used in the analysis of nucleic acids, e.g. primers or probes for diseases caused by alterations of genetic material
-
- G—PHYSICS
- G16—INFORMATION AND COMMUNICATION TECHNOLOGY [ICT] SPECIALLY ADAPTED FOR SPECIFIC APPLICATION FIELDS
- G16B—BIOINFORMATICS, i.e. INFORMATION AND COMMUNICATION TECHNOLOGY [ICT] SPECIALLY ADAPTED FOR GENETIC OR PROTEIN-RELATED DATA PROCESSING IN COMPUTATIONAL MOLECULAR BIOLOGY
- G16B30/00—ICT specially adapted for sequence analysis involving nucleotides or amino acids
-
- G—PHYSICS
- G16—INFORMATION AND COMMUNICATION TECHNOLOGY [ICT] SPECIALLY ADAPTED FOR SPECIFIC APPLICATION FIELDS
- G16B—BIOINFORMATICS, i.e. INFORMATION AND COMMUNICATION TECHNOLOGY [ICT] SPECIALLY ADAPTED FOR GENETIC OR PROTEIN-RELATED DATA PROCESSING IN COMPUTATIONAL MOLECULAR BIOLOGY
- G16B50/00—ICT programming tools or database systems specially adapted for bioinformatics
-
- G—PHYSICS
- G16—INFORMATION AND COMMUNICATION TECHNOLOGY [ICT] SPECIALLY ADAPTED FOR SPECIFIC APPLICATION FIELDS
- G16B—BIOINFORMATICS, i.e. INFORMATION AND COMMUNICATION TECHNOLOGY [ICT] SPECIALLY ADAPTED FOR GENETIC OR PROTEIN-RELATED DATA PROCESSING IN COMPUTATIONAL MOLECULAR BIOLOGY
- G16B50/00—ICT programming tools or database systems specially adapted for bioinformatics
- G16B50/20—Heterogeneous data integration
Definitions
- the present invention relates generally to methods that provide profiles of regulatory factor binding sites of all the known genes, and more particularly to methods for identifying and characterizing regulatory factors binding sites in order to develop systematical analysis on identified binding sites for further therapeutic strategies development.
- TFs transcription factors
- the transcription starting site is the position where its' mRNA starts to be transcribed from DNA by RNA polymerase II.
- the gene regulatory region is associated and bound by certain regulatory factors. These bound factors together with other transcription proteins formed a transcription complex that can initialize the transcription process. More specifically, this typically includes the transcription factor binding sites that are the short consensus genomic sequences.
- One of the most important regulatory regions is the core promoter usually located immediately before or flanking TSS. Thus, identifying TSS is important to define the transcription regulatory region for each gene.
- TSS transcription starting site
- the present invention retrieved all the full-length genes from various public available databases (such as, NCBI refseq, NIH MGC consortium, DBTSS database of Japan, and so on) and then mapped these gene's TSSs on the most updated Human Genome Working Draft (such as Assembly version July, 2003, or NCBI build 34). Then it defined the most upstream TSS for each gene by comparing all the possible TSSs generated by mapping the position of this gene.
- the transcription regulatory region (TRR), such as core promoter regions were defined based on the most 5' TSS positions, and their corresponding genomic sequences were retrieved from most updated human genome for further analysis.
- the profiled TRR for all the known genes were stored in a database for further drug-target related statistic analysis and for further therapeutic strategies development.
- an object of the present invention is to provide improved methods for genomic-profiling regulatory factor binding sites.
- methods for profiling regulatory factor binding sites employ genome-wide probability mapping relative to profiled binding sites.
- Yet another object of the present invention is to provide improved methods for biomedical research.
- a further object of the present invention is to provide improved methods for preclinical development.
- Still another object of the present invention is to provide improved methods for drug screening applications.
- Another object of the present invention is to provide improved methods for target discovering and target validation.
- Yet another object of the present invention is to provide improved methods for profiling of a regulatory region.
- a further object of the present invention is to provide improved methods for building the genome or tissue wide connections between regulatory profilings of different genes.
- the present invention relates to a method for profiling regulatory factor binding sites, comprising locating and retrieving a complete and most 5' full-length gene for mapping the regulatory regions of said gene to a human genome; retrieving genomic sequences from the human genome for the gene regulatory region comprising the sequence about 200-300 bases upstream of the transcriptional start site (TSS) and the sequence about 50-100 bases downstream of the TSS; screening DNA sequence information of the retrieved gene regulatory region for the purpose of identifying putative regulatory factor binding sites; creating a conservation score for each putative regulatory factor binding site; profiling the putative regulatory factor binding sites of the gene; collecting profiles including transcription factor binding site sequence information and the conservation score in a database; and computationally generating all the possible transcriptional decoys for profiled regulatory factor binding sites.
- TSS transcriptional start site
- the present invention provides methods for genome wide profiling regulatory factor binder sites.
- regulatory factor binder sites include but are not limited to, sequence AGGGGACTTTCCCA (SEQ ID NO 1) as the binding sites for transcription factor NF-kappa B; sequence TTTGGCGG (SEQ ID NO 2) as the binding sites for transcription factor E2F-1, and the like.
- genomic sequences of gene regulatory regions are retrieved and are mapped to human genome. Based on the mapped genes, the most 5 prime position of TSS for each gene is identified and the corresponding regulatory region for the gene is identified. DNA sequence information for each retrieved gene regulatory region is screened to identify putative regulatory factor binding sites. The putative regulatory factor binding sites are then profiled.
- Information retrieved from the database can be utilized for a variety of different purposes and applications including but not limited to, biomedical research, pre-clinical development, drug screening applications, target discovering and target validation, profiling of a regulatory region, building the genome or tissue wide connections between regulatory profilings of different genes, understanding the genome or tissue background of various known transcription profiling understanding the genome or tissue background of various known transcription profiling, and the like.
- probability mapping is applied to the identified binding sites.
- the probability mapping describes the identification of existences of a specific transcription regulatory factor binding sites, such as all the putative E2F-1 sites, in the regulatory region of all the genes or in the genes that expressed in certain tissue or cell.
- the probability mapping tells how many genes are possibly transcription-regulated by a specific regulatory factor. It also indicates that how much biological system wide, genome wide, cell wide, or tissue wide, effect a specific regulator factor could have. This information is very useful for bio-medical research based therapeutic method development.
- a full-length gene is mapped for purposes of mapping gene regulatory regions. It will be appreciated that for purposes of this specification, full length extends to the length of the gene. This can cause a slight shift of the genomic position of the transcription start sites of the different versions of the same gene. In one embodiment, all of the available full-length gene is used in a comparison in order to obtain the most 5' TSS. Based on the most 5' TSS, the regulatory regions of genes are defined and the genomic sequences of gene regulatory regions are retrieved. DNA sequence information is screened for each retrieved gene regulatory region to identify putative regulatory factor binding sites. The putative regulatory factor binding sites are mapped to the human genome.
- Full-length genes are retrieved to provide sequences information for retrieved genes.
- the retrieved genes can be mapped to a recently updated human genome using a tool provided by a public available UCSC genome browser databases, self-developed scripts, and the like.
- the transcription start site is mapped.
- the TSS is mapped by taking the most 5' TSS of each gene after comparing all available TSS's for the gene, illustrated in Figure 2 .
- a genomic sequence of a regulatory region can be retrieved for each retrieved gene with the most 5' TSS from the most updated human genome.
- the 5' regulatory region is the sequences upstream of the TSS and downstream of the TSS.
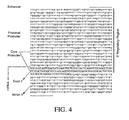
- the gene regulatory regions include but are not limit to, the core promoter region, the upstream enhancer region, a downstream regulatory region, and the like, as illustrated in Figure 4 .
- Methods of the invention retrieve genomic sequences comprising a core promoter region including 200-300 bases upstream and about 50-100 bases downstream of the TSS.
- Corresponding sequences relative to TSS can be cut and stored.
- the corresponding sequences relative to TSS can be cut and stored with the use of self-developed scripts from genomic sequences based on a specific release, older, updated and future releases, including but not limited to the UCSC genome browser, NCBI genome database, the Ensembl database, other genomic sequence databases and the like.
- the DNA sequence information is screened using a MATCH program that is licensed from TRANSFAC database.
- the DNA sequence information screening can include selecting the TF matrix, scores of matrix similarity, scores of core similarity, and the like.
- Cut-off may be applied to reduce the false positive and false negative matching during screening.
- a genomic or tissue-specific frequency of each binding site and can be determined.
- the frequency can be the existence of specific TF binding sites in regulatory regions of at least one of, (i) all the genes genome wide, (ii) all the genes specific cell wide, (iii) all the genes specific-tissue wide, (iv) all the genes specific-defined.
- the frequency can be the existence of specific TF binding sites in regulatory regions of tissue specific genes.
- the frequency can also be considered with a conservation score or an expression level score.
- the identified binding sites can be considered differently based on their corresponding conservation score or their corresponding gene expression level. For example, a binding site with higher conservation score or the corresponding gene with higher expression level could play a more significant role than those with lower scores.
- the conservation score for each binding site is created.
- the conservation score is selected to cover regions where the TF binding sites are identified as well as any other measurements that indicate conservation levels between the two species including but not limited to mouse and human.
- the position of each binding site can be determined. The position can be based on a human genome working draft. The position is a converted position in a human genome working draft. As more sequence pieces are added, the total length for each chromosome grows. This shifts the position reading for each base on the chromosome. However, the position can be easily converted and the relative position of a regulatory region to the position of the gene remains unchanged.
- the genome position of a start and end can be determined. A distance of each binding site to the TSS can be determined.
- the distance is relative to a number of bases between a binding site and the TSS.
- the distance is that of the last base between defined binding sites to the base of TSS's 23 base. In this example, there are 23 bases between these two specific bases.
- the 5 prime regulatory sequences from most updated Human Genome Working Draft are retrieved for all the available genes using self developed computer scripts and programs. These retrieved sequences include but not limited to 250-base 5 prime upstream and 50-base 3 prime downstream of TSS for each gene.
- All the regulatory region sequences can be analyzed using well-characterized transcription factor binding consensus sequence patterns (or, position weighted matrix) created by licensed TRANSFAC databases (TRANSFAC professional 6.3 version, Wingender et al., Nucleic Acids Res. 29,281).
- TRANSFAC databases TRANSFAC professional 6.3 version, Wingender et al., Nucleic Acids Res. 29,281.
- the sites with high score matching with binding matrix will be selected. These sites include their positions in the genome (relative to specific genome assemble version) and their lengths and their synergism information with flanking sites.
- mice All the binding sites result from above are further analyzed by comparing their conservation scores with mouse.
- the mouse genome and relative conservation information will be retrieved from public available NCBI and UCSC genome databases, and the conservation comparison with human transcription factor binding sites will be done using self-generated scripts and programs.
- the resulted transcription factor binding site sequences information from above include their genomic positions (start, end), length, distant to TSS of each gene, and the flanking regions (include but not limit to 10-base both 5 prime and 3 prime) will be deposited into a database.
- the related reference links such as gene name, function, annotation, et al are also added.
- All the possible transcription decoys are computational generated based on the database.
- the decoys can further be experimentally screened by using high-throughput methods, such as oligo-array, capillary-electrophoresis, et al for binding efficiency optimization. All the optimized decoy information will be deposited into the database.
- the partial information in the database can be used in future versions of the database.
- Profiles of the regulatory regions of genes include but are not limited to, (i) probability mapping of each regulatory factor binding site, (ii) target genes identification for each known regulatory factor; (iii) statistic analysis of regulatory factor binding profiles of genes identified from various differential expressed genes, and the like.
- a length of each binding site is determined. Sequence information about regions adjacent to the binding site can also be determined. Again by illustration and without limitation, one example is agcgtcagaAGGGGACTTTCCCaagagaggccgaga, (SEQ ID NO 3) with the small case base letters flanking the core binding sites, in upper case.
- binding sites Co-existence information of other binding sites can also be ascertained.
- the transcription machinery usually requires the formation of the complex by several different transcription related proteins and includes the several different DNA binding factors.
- the binding sites are profiled for a regulatory region of the gene and often more than one binding site is identified from a single region.
- the number of binding sites can be, by way of example, fifteen to twenty from a single region.
- the cluster of the binding sites and their positions can be determined.
- the present application also describes a data structure tangibly stored on a computer readable medium that includes a database with the profiled identified binding site information.
- the database includes a core table with identifiers, binding sites and the like.
- Binding site information includes but is not limited to, sequence, length, position, direction, frequency, and the like.
- One supporting table includes TSS position of all genes.
- a sequence table provides the sequences of regulatory regions of genes. Additional support tables include but are not limited to frequency of TF, target genes of TF for each TF, and the like.
- All of the tables are linked by one or more identifiers.
- several instead of one perl CGI script are used to reach and search the database and then display the corresponding information.
- a web-browser interface is provided.
- the database is searchable by a variety of different means, including but not limited to gene identifiers, gene symbol, or self-developed identifiers and the like.
- Gene identifiers can be selected from the NCBI database, which can be a, Unigene Cluster ID, LoucsLink ID, international approved gene symbols, and the like.
- the database includes genomic frequencies information for TF, and can be sorted by at least a TF name or TF frequencies.
- the TF frequencies can include genome frequencies and tissue specific frequencies.
- the database contains the profiles of regulatory factor binding sites for all the known genes (about 15,450 total).
- one gene (symbol: DLD, dihydrolipoamide dehydrogenase) is used to briefly show how the database is built.
- FIG 2 three different versions of full-length mRNA sequences can be retrieved from NCBI database (refseq), MGC database (MGC), Japan DBTSS database (DBTSS), and the like.
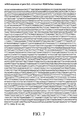
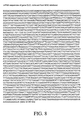
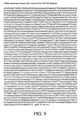
- the completely sequences for gene DLD retrieved from refseq database is listed in Figure 7 (SEQ ID NO 59), and the one retrieved from MGC is listed in Figure 8 (SEQ ID NO 60), and the one retrieved from DBTSS is listed in Figure 9 (SEQ ID NO 61).
- the retrieved genes are mapped to a recently updated human genome.
- a self-developed script is used to fetch the above retrieved sequence to UCSC genome browser database to map their genomic position.
- the retrieved different version of gene DLD are mapped to the recently updated human genome using a tool provided by at least one of public available UCSC genome browser databases.
- mapping positions are retrieved using self-developed script from the above referenced UCSC genome browser database.
- the summary result of mapping is listed in table 1.
- the full length gene DLD sequence from NCBI refseq database was mapped to the human genome working draft (released June 2002 by UCSC genome browser) at the chromosome 7 sense strand or positive strand, starting at the chromosome position of 106015510, ending at the chromosome position of 106044308.
- Table 1 name chromosome strand start end DLD from refseq 7 + 106015510 106044308 DLD from MGC 7 + 106015541 106044089 DLD from DBTSS 7 + 106015488 106044308
- the TSS is mapped by making the most 5-prime TSS of each gene after comparing all available TSS'S for the gene.
- this mapping is facilitated by using self-generated script.
- gene DLD since it is located on "+" strand of chromosome 7.
- the start position 106015488 is taken as the most 5' position for TSS of gene DLD.
- a genomic sequence of a regulatory region for each retrieved gene with the most 5'TSS is retrieved from the most updated human genome.
- the 5' regulatory region is the sequences upstream of the TSS and downstream of the TSS. More specifically, for gene DLD, the regulatory region or core promoter region is the sequence includes 200-300 bases upstream and the sequence about 50-100 bases downstream of the TSS. Therefore, the corresponding sequences relative to TSS of gene DLD are cut and stored with the use of self-developed scripts from at least one of the UCSC genome browser or NCBI genome database.
- the stored sequence for gene DLD is listed in Figure 10 (SEQ ID NO 62).
- the stored sequence for regulatory region of gene DLD is screened using a match program.
- the MATCH program is the sequence-analyzing tool embedded inside the licensed TRANSFAC database. The analysis is done with the proper setting for both the scores of matrix similarity and scores of core similarity in order to reduce the false positive and false negative matching during screening.
- the result of the screening for the regulatory region of gene DLD is shown in table 2 where the positions of identified binding sites are listed.
- Table 2 position strand core score matrix score sequences TF name 3 (+) 1 0.964 tgaacttgTCACGctttactg (SEQ ID NO 4) Pax-3 5 (-) 0.796 0.779 aacttgtcacgCTTTActgtc (SEQ ID NO 5) Pax-4 6 (+) 1 0.886 acttgTCACGctttactgtcg (SEQ ID NO 6) Pax-6 6 (+) 0.977 0.761 acttgTCACGctttactgtcg (SEQ ID NO 7) Pax-4 24 (+) 0.994 0.972 tCGATAatg (SEQ ID NO 8) Lmo2 complex 25 (-) 0.951 0.963 cgataatgtgCATTAagc (SEQ ID NO 9) Cart-1 25 (+) 0.951 0.952 cgaTAATGtgcattaagc (SEQ ID NO 10) Cart-1 34 (+) 0.896 0.772 gcaTTAAG
- a genomic or tissue specific frequency of each binding site is determined.
- the frequency is the existence of specific TF binding sites in regulatory regions of all the genes or tissue specific genes. After analysis of the regulatory region of all the genes, the frequency or probability of existence of TF binding sites is easy established. Some of these frequencies information are listed for gene DLD in table 3: Table 3: TF name left position right position distance (base) to TSS genomic frequency Pax-3 106015239 106015259 -249 0.426259226 Pax-4 106015241 106015261 -247 0.96109025 Pax-6 106015242 106015262 -246 0.112003108 Pax-4 106015242 106015262 -246 0.96109025 Lmo2complex 106015260 106015268 -228 0.120419526 Cart-1 106015261 106015278 -227 0.020134663 Cart-1 106015261 106015278 -227 0.020134663 Cdc5 106015270 106015281 -218 0.360481678 Cdx-2 106015284 106015297 -204 0.2
- the conservation scores for whole genome comparison between human and mouse are retrieved from UCSC genome browser database.
- the conservation score is selected to cover regions where the TF binding sites are identified.
- the conservation scores for the TF binding sites identified in the regulatory region of gene DLD are listed in table 4.
- Table 4 TF name core sequences start position end position distance to TSS conserveati on score Pax-3 tgaacttgTCACGctttactg (SEQ ID NO 4) 106015239 106015259 -249 0.426 Pax-4 aacttgtcacgCTTTActgtc (SEQ ID NO 5) 106015241 106015261 -247 0.3552 Pax-6 acttgTCACGctttactgtcg (SEQ ID NO 6) 106015242 106015262 -246 0.3552 Pax-4 acttgTCACGctttactgtcg (SEQ ID NO 7) 106015242 106015262 -246 0.3552 Lmo2complex t
- Table 5 Cluster ID Core sequences left position right position Transcription Factor(s) Cdc5;Cart-1;Cart-1;Lmo2compIex ;Pax- 1 106015239 106015281 4;Pax-6;Pax-4;Pax-3; STATSA(homotetramer);N KX3A;IRF- 7;HNF-3alpha;Cdx;-2;HFH-3;HFH-8;HFH- 1;FOXD3;Freac-7;XFD-2;HNF- 3alpha;FOX04;FOXJ2;HN F-3beta;HFH- 3;FOXD3;Xvent-1;FOXJ2;HNF-3beta;Cdx- 2 106015284 106015331 2; 3 agcattcccaccacca (SEQ ID NO 53) 106015359
- Binding profiles are collected in the database.
- Table 6 TF name core score matrix score core sequences left position right position distance (base) to TSS genomic frequency conservation score Pax-3 1 0.964 tgaacttaTCACGctttactg (SEQ ID NO 63) 106015239 106015259 -249 0.426259226 0.426 Pax-4 0.796 0.779 aacttgtcacgCTTTActgtc (SEQ ID NO 5) 106015241 106015261 -247 0.96109025 0.3552 Pax-6 1 0.886 acttgTCACGctttactgtcg (SEQ ID NO 6) 106015242 106015262 -246 0.112003108 0.3552 Pax-4 0.977 0.761 acttgTCACGctttactgtcg (SEQ ID NO 7) 106015242 106015262 -246 0.96109025 0.3552 L
- the database is searchable by gene identifiers.
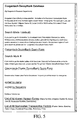
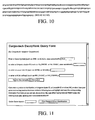
- Figure 11 illustrates a screen shot of a query form that can be used with the database.
- Figure 12 illustrates a screen shot of a database query result
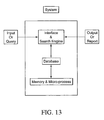
- the present application also describes a computer implemented system for displaying the profiled regulatory factor binding sites.
- the system includes the database, a user interface that includes one or more selectable user inputs, an input device operable by a user, and a display for displaying at least one output in response to the profiled identified binding sites.
- Examples of outputs include but are not limited to, gene name, identifier, identified TF binding site, TF names, genomic positions, length, distance, conservation score, binding scores, frequencies information, and binding sites sequences.
- Examples of inputs includes, the gene identifiers, such as gene symbols, unigene cluster ID, or locuslink ID, and the like.
- the system also includes a memory, a microprocessor, data files, scripts, supporting available software, including but not limited to MS windows, red hat linux, Apache HTTP sever, Perl compiler program, and the like.
Landscapes
- Life Sciences & Earth Sciences (AREA)
- Physics & Mathematics (AREA)
- Health & Medical Sciences (AREA)
- Engineering & Computer Science (AREA)
- Bioinformatics & Cheminformatics (AREA)
- Biophysics (AREA)
- Chemical & Material Sciences (AREA)
- Biotechnology (AREA)
- General Health & Medical Sciences (AREA)
- Bioinformatics & Computational Biology (AREA)
- Evolutionary Biology (AREA)
- Medical Informatics (AREA)
- Spectroscopy & Molecular Physics (AREA)
- Theoretical Computer Science (AREA)
- Proteomics, Peptides & Aminoacids (AREA)
- Analytical Chemistry (AREA)
- Genetics & Genomics (AREA)
- Molecular Biology (AREA)
- Bioethics (AREA)
- Databases & Information Systems (AREA)
- Organic Chemistry (AREA)
- Zoology (AREA)
- Wood Science & Technology (AREA)
- Pathology (AREA)
- Microbiology (AREA)
- Immunology (AREA)
- Biochemistry (AREA)
- General Engineering & Computer Science (AREA)
- Information Retrieval, Db Structures And Fs Structures Therefor (AREA)
- Measuring Or Testing Involving Enzymes Or Micro-Organisms (AREA)
- Management, Administration, Business Operations System, And Electronic Commerce (AREA)
- Image Generation (AREA)
- Image Processing (AREA)
- Electrotherapy Devices (AREA)
Abstract
Description
- The present invention relates generally to methods that provide profiles of regulatory factor binding sites of all the known genes, and more particularly to methods for identifying and characterizing regulatory factors binding sites in order to develop systematical analysis on identified binding sites for further therapeutic strategies development.
- Altering gene expression level has become an important and efficient approach to address the human disorders. The expression level of each gene is controlled by the transcription machinery, in which some specific proteins called transcription factors (TFs) bind to the regulatory region of the gene, and in turn to initialize the transcription processes. Thus, the corresponding TFs and their binding sites on gene regulatory region can play the essential role in controlling the transcription level of gene. Therefore, transcription factors and their related transcription mechanisms have become the "hot" spots in modem bio-medical research and development efforts.
- For each gene, the transcription starting site (TSS) is the position where its' mRNA starts to be transcribed from DNA by RNA polymerase II. During this process, the gene regulatory region is associated and bound by certain regulatory factors. These bound factors together with other transcription proteins formed a transcription complex that can initialize the transcription process. More specifically, this typically includes the transcription factor binding sites that are the short consensus genomic sequences. One of the most important regulatory regions is the core promoter usually located immediately before or flanking TSS. Thus, identifying TSS is important to define the transcription regulatory region for each gene. Currently, many specific researches and developments focus their efforts on the specific TFs and corresponding binding sites, which provided many solid data but still failed to meet the large requirement of the development of genomic-related biomedical needs. To meet the fast growing transcription factors related drug discovery business and challenge, it is very important to identify all putative regulatory factors and characterize their corresponding binding sites in genome. Especially, with the finish of human genome project and occurrences of large amount of disease-related gene expression data (such as microarray-based data), the genome wide profiling of regulatory factor binding sites become urgent
- The present invention retrieved all the full-length genes from various public available databases (such as, NCBI refseq, NIH MGC consortium, DBTSS database of Japan, and so on) and then mapped these gene's TSSs on the most updated Human Genome Working Draft (such as Assembly version July, 2003, or NCBI build 34). Then it defined the most upstream TSS for each gene by comparing all the possible TSSs generated by mapping the position of this gene. The transcription regulatory region (TRR), such as core promoter regions were defined based on the most 5' TSS positions, and their corresponding genomic sequences were retrieved from most updated human genome for further analysis. The profiled TRR for all the known genes were stored in a database for further drug-target related statistic analysis and for further therapeutic strategies development.
- Accordingly, an object of the present invention is to provide improved methods for genomic-profiling regulatory factor binding sites.
- In another object of the present invention, methods for profiling regulatory factor binding sites, are provided that employ genome-wide probability mapping relative to profiled binding sites.
- Yet another object of the present invention is to provide improved methods for biomedical research.
- A further object of the present invention is to provide improved methods for preclinical development.
- Still another object of the present invention is to provide improved methods for drug screening applications.
- Another object of the present invention is to provide improved methods for target discovering and target validation.
- Yet another object of the present invention is to provide improved methods for profiling of a regulatory region.
- A further object of the present invention is to provide improved methods for building the genome or tissue wide connections between regulatory profilings of different genes.
- Still a further object of the present invention is to provide improved methods for understanding the genome or tissue or cell background of various known transcription profiling. In first aspect, the present invention relates to a method for profiling regulatory factor binding sites, comprising
locating and retrieving a complete and most 5' full-length gene for mapping the regulatory regions of said gene to a human genome;
retrieving genomic sequences from the human genome for the gene regulatory region comprising the sequence about 200-300 bases upstream of the transcriptional start site (TSS) and the sequence about 50-100 bases downstream of the TSS;
screening DNA sequence information of the retrieved gene regulatory region for the purpose of identifying putative regulatory factor binding sites;
creating a conservation score for each putative regulatory factor binding site;
profiling the putative regulatory factor binding sites of the gene;
collecting profiles including transcription factor binding site sequence information and the conservation score in a database; and
computationally generating all the possible transcriptional decoys for profiled regulatory factor binding sites. -
-
Figure 1 is a flow chart illustrating a method for profiling regulatory factor binding sites. -
Figure 2 is a flow chart that described how to define the transcription regulatory region of a gene (example Gene X). -
Figure 3 is a flow chart illustrating calculating the frequency of TF binding sites. -
Figure 4 illustrates that the core promoter region can include 200-300 bases upstream and about 50-100 bases downstream of the TSS. -
Figure 5 is a description of one embodiment of a structure of a database. -
Figure 6 is a flow chart illustrating theFigure 5 database. -
Figure 7 lists the complete sequences for gene DLD retrieved from the refseq database (SEQ ID NO 59). -
Figure 8 lists the complete sequences for gene DLD retrieved from the MGC database (SEQ ID NO 60). -
Figure 9 lists the complete sequences for gene DLD retrieved from the DBTSS database (SEQ ID NO 61). -
Figure 10 lists the stored sequence for gene DLD (SEQ ID NO 62). -
Figure 11 is a screen shot of a query form that can be used with theFigure 7 database. -
Figure 12 is a screen shot of one embodiment of a database query result from theFigure 5 database. -
Figure 13 illustrates one embodiment of a system for displaying profiled regulatory factor binding sites. - In various embodiments, the present invention provides methods for genome wide profiling regulatory factor binder sites. Examples of regulatory factor binder sites include but are not limited to, sequence AGGGGACTTTCCCA (SEQ ID NO 1) as the binding sites for transcription factor NF-kappa B; sequence TTTGGCGG (SEQ ID NO 2) as the binding sites for transcription factor E2F-1, and the like.
- Referring to the flow charts of
Figures 1 and2 , in one embodiment of the present invention, genomic sequences of gene regulatory regions are retrieved and are mapped to human genome. Based on the mapped genes, the most 5 prime position of TSS for each gene is identified and the corresponding regulatory region for the gene is identified. DNA sequence information for each retrieved gene regulatory region is screened to identify putative regulatory factor binding sites. The putative regulatory factor binding sites are then profiled. - Information retrieved from the database can be utilized for a variety of different purposes and applications including but not limited to, biomedical research, pre-clinical development, drug screening applications, target discovering and target validation, profiling of a regulatory region, building the genome or tissue wide connections between regulatory profilings of different genes, understanding the genome or tissue background of various known transcription profiling understanding the genome or tissue background of various known transcription profiling, and the like.
- Referring to
Figure 3 , probability mapping is applied to the identified binding sites. The probability mapping describes the identification of existences of a specific transcription regulatory factor binding sites, such as all the putative E2F-1 sites, in the regulatory region of all the genes or in the genes that expressed in certain tissue or cell. The probability mapping tells how many genes are possibly transcription-regulated by a specific regulatory factor. It also indicates that how much biological system wide, genome wide, cell wide, or tissue wide, effect a specific regulator factor could have. This information is very useful for bio-medical research based therapeutic method development. - In another embodiment of the present invention a full-length gene is mapped for purposes of mapping gene regulatory regions. It will be appreciated that for purposes of this specification, full length extends to the length of the gene. This can cause a slight shift of the genomic position of the transcription start sites of the different versions of the same gene. In one embodiment, all of the available full-length gene is used in a comparison in order to obtain the most 5' TSS. Based on the most 5' TSS, the regulatory regions of genes are defined and the genomic sequences of gene regulatory regions are retrieved. DNA sequence information is screened for each retrieved gene regulatory region to identify putative regulatory factor binding sites. The putative regulatory factor binding sites are mapped to the human genome.
- Full-length genes are retrieved to provide sequences information for retrieved genes. The retrieved genes can be mapped to a recently updated human genome using a tool provided by a public available UCSC genome browser databases, self-developed scripts, and the like. In one embodiment, the transcription start site is mapped. In one embodiment, the TSS is mapped by taking the most 5' TSS of each gene after comparing all available TSS's for the gene, illustrated in
Figure 2 . - A genomic sequence of a regulatory region can be retrieved for each retrieved gene with the most 5' TSS from the most updated human genome. The 5' regulatory region is the sequences upstream of the TSS and downstream of the TSS. In various embodiments, the gene regulatory regions include but are not limit to, the core promoter region, the upstream enhancer region, a downstream regulatory region, and the like, as illustrated in
Figure 4 . Methods of the invention retrieve genomic sequences comprising a core promoter region including 200-300 bases upstream and about 50-100 bases downstream of the TSS. - Corresponding sequences relative to TSS can be cut and stored. The corresponding sequences relative to TSS can be cut and stored with the use of self-developed scripts from genomic sequences based on a specific release, older, updated and future releases, including but not limited to the UCSC genome browser, NCBI genome database, the Ensembl database, other genomic sequence databases and the like.
- In one embodiment, the DNA sequence information is screened using a MATCH program that is licensed from TRANSFAC database. The DNA sequence information screening can include selecting the TF matrix, scores of matrix similarity, scores of core similarity, and the like.
- Cut-off may be applied to reduce the false positive and false negative matching during screening. A genomic or tissue-specific frequency of each binding site and can be determined. The frequency can be the existence of specific TF binding sites in regulatory regions of at least one of, (i) all the genes genome wide, (ii) all the genes specific cell wide, (iii) all the genes specific-tissue wide, (iv) all the genes specific-defined. The frequency can be the existence of specific TF binding sites in regulatory regions of tissue specific genes. Additionally, the frequency can also be considered with a conservation score or an expression level score. By way of illustration, and without limitation, the identified binding sites can be considered differently based on their corresponding conservation score or their corresponding gene expression level. For example, a binding site with higher conservation score or the corresponding gene with higher expression level could play a more significant role than those with lower scores.
- In methods of the invention, The conservation score for each binding site is created. The conservation score is selected to cover regions where the TF binding sites are identified as well as any other measurements that indicate conservation levels between the two species including but not limited to mouse and human. The position of each binding site can be determined. The position can be based on a human genome working draft. The position is a converted position in a human genome working draft. As more sequence pieces are added, the total length for each chromosome grows. This shifts the position reading for each base on the chromosome. However, the position can be easily converted and the relative position of a regulatory region to the position of the gene remains unchanged. The genome position of a start and end can be determined. A distance of each binding site to the TSS can be determined. The distance is relative to a number of bases between a binding site and the TSS. By way of illustration, and without limitation, in one embodiment the distance is that of the last base between defined binding sites to the base of TSS's 23 base. In this example, there are 23 bases between these two specific bases.
- In one embodiment of the present invention, based on the positions of most 5 prime TSSs, the 5 prime regulatory sequences from most updated Human Genome Working Draft are retrieved for all the available genes using self developed computer scripts and programs. These retrieved sequences include but not limited to 250-
base 5 prime upstream and 50-base 3 prime downstream of TSS for each gene. - All the regulatory region sequences can be analyzed using well-characterized transcription factor binding consensus sequence patterns (or, position weighted matrix) created by licensed TRANSFAC databases (TRANSFAC professional 6.3 version, Wingender et al., Nucleic Acids Res. 29,281). The sites with high score matching with binding matrix will be selected. These sites include their positions in the genome (relative to specific genome assemble version) and their lengths and their synergism information with flanking sites.
- All the binding sites result from above are further analyzed by comparing their conservation scores with mouse. The mouse genome and relative conservation information will be retrieved from public available NCBI and UCSC genome databases, and the conservation comparison with human transcription factor binding sites will be done using self-generated scripts and programs.
- The resulted transcription factor binding site sequences information from above, include their genomic positions (start, end), length, distant to TSS of each gene, and the flanking regions (include but not limit to 10-base both 5 prime and 3 prime) will be deposited into a database. The related reference links such as gene name, function, annotation, et al are also added.
- In methods of the present invention, All the possible transcription decoys are computational generated based on the database. The decoys can further be experimentally screened by using high-throughput methods, such as oligo-array, capillary-electrophoresis, et al for binding efficiency optimization. All the optimized decoy information will be deposited into the database. The partial information in the database can be used in future versions of the database.
- Profiles of the regulatory regions of genes include but are not limited to, (i) probability mapping of each regulatory factor binding site, (ii) target genes identification for each known regulatory factor; (iii) statistic analysis of regulatory factor binding profiles of genes identified from various differential expressed genes, and the like.
- In one embodiment, a length of each binding site is determined. Sequence information about regions adjacent to the binding site can also be determined. Again by illustration and without limitation, one example is agcgtcagaAGGGGACTTTCCCaagagaggccgaga, (SEQ ID NO 3) with the small case base letters flanking the core binding sites, in upper case.
- Co-existence information of other binding sites can also be ascertained. The transcription machinery usually requires the formation of the complex by several different transcription related proteins and includes the several different DNA binding factors. When the present invention, the binding sites are profiled for a regulatory region of the gene and often more than one binding site is identified from a single region. The number of binding sites can be, by way of example, fifteen to twenty from a single region. The cluster of the binding sites and their positions can be determined.
- Referring now to
Figures 5 and6 , the present application also describes a data structure tangibly stored on a computer readable medium that includes a database with the profiled identified binding site information. The database includes a core table with identifiers, binding sites and the like. Binding site information includes but is not limited to, sequence, length, position, direction, frequency, and the like. One supporting table includes TSS position of all genes. A sequence table provides the sequences of regulatory regions of genes. Additional support tables include but are not limited to frequency of TF, target genes of TF for each TF, and the like. - All of the tables are linked by one or more identifiers. In one embodiment, several instead of one perl CGI script are used to reach and search the database and then display the corresponding information. A web-browser interface is provided.
- The database is searchable by a variety of different means, including but not limited to gene identifiers, gene symbol, or self-developed identifiers and the like. Gene identifiers can be selected from the NCBI database, which can be a, Unigene Cluster ID, LoucsLink ID, international approved gene symbols, and the like.
- In oneexample, the database includes genomic frequencies information for TF, and can be sorted by at least a TF name or TF frequencies. The TF frequencies can include genome frequencies and tissue specific frequencies. In one specific example, the database contains the profiles of regulatory factor binding sites for all the known genes (about 15,450 total).
- By way of illustration, and without limitation, one gene (symbol: DLD, dihydrolipoamide dehydrogenase) is used to briefly show how the database is built.
- As illustrated in
Figure 2 , three different versions of full-length mRNA sequences can be retrieved from NCBI database (refseq), MGC database (MGC), Japan DBTSS database (DBTSS), and the like. The completely sequences for gene DLD retrieved from refseq database is listed inFigure 7 (SEQ ID NO 59), and the one retrieved from MGC is listed inFigure 8 (SEQ ID NO 60), and the one retrieved from DBTSS is listed inFigure 9 (SEQ ID NO 61). - A self-developed script is used to fetch the above retrieved sequence to UCSC genome browser database to map their genomic position. The retrieved different version of gene DLD are mapped to the recently updated human genome using a tool provided by at least one of public available UCSC genome browser databases.
- The mapped positions are retrieved using self-developed script from the above referenced UCSC genome browser database. The summary result of mapping is listed in table 1. For example, the full length gene DLD sequence from NCBI refseq database was mapped to the human genome working draft (released June 2002 by UCSC genome browser) at the
chromosome 7 sense strand or positive strand, starting at the chromosome position of 106015510, ending at the chromosome position of 106044308.Table 1: name chromosome strand start end DLD from refseq 7 + 106015510 106044308 DLD from MGC 7 + 106015541 106044089 DLD from DBTSS 7 + 106015488 106044308 - Referring again to
Figure 2 , this mapping is facilitated by using self-generated script. For gene DLD, since it is located on "+" strand ofchromosome 7. Thestart position 106015488 is taken as the most 5' position for TSS of gene DLD. - The 5' regulatory region is the sequences upstream of the TSS and downstream of the TSS. More specifically, for gene DLD, the regulatory region or core promoter region is the sequence includes 200-300 bases upstream and the sequence about 50-100 bases downstream of the TSS. Therefore, the corresponding sequences relative to TSS of gene DLD are cut and stored with the use of self-developed scripts from at least one of the UCSC genome browser or NCBI genome database. The stored sequence for gene DLD is listed in
Figure 10 (SEQ ID NO 62). - The MATCH program is the sequence-analyzing tool embedded inside the licensed TRANSFAC database. The analysis is done with the proper setting for both the scores of matrix similarity and scores of core similarity in order to reduce the false positive and false negative matching during screening. The result of the screening for the regulatory region of gene DLD is shown in table 2 where the positions of identified binding sites are listed.
Table 2: position strand core score matrix score sequences TF name 3 (+) 1 0.964 tgaacttgTCACGctttactg (SEQ ID NO 4) Pax-3 5 (-) 0.796 0.779 aacttgtcacgCTTTActgtc (SEQ ID NO 5) Pax-4 6 (+) 1 0.886 acttgTCACGctttactgtcg (SEQ ID NO 6) Pax-6 6 (+) 0.977 0.761 acttgTCACGctttactgtcg (SEQ ID NO 7) Pax-4 24 (+) 0.994 0.972 tCGATAatg (SEQ ID NO 8) Lmo2 complex 25 (-) 0.951 0.963 cgataatgtgCATTAagc (SEQ ID NO 9) Cart-1 25 (+) 0.951 0.952 cgaTAATGtgcattaagc (SEQ ID NO 10) Cart-1 34 (+) 0.896 0.772 gcaTTAAGcaaa (SEQ ID NO 11) Cdc5 48 (+) 1 0.806 ctagtTTTATttgt (SEQ ID NO 12) Cdx-2 50 (-) 0.96 0.937 agtttTATTTgtttattt (SEQ ID NO 13) FOXJ2 50 (+) 1 0.952 agtttTATTTgttta (SEQ ID NO 14) HNF-3 beta 51 (+) 1 0.938 gttttATTTGttt (SEQ ID NO 15) Xvent-1 52 (+) 0.948 0.926 ttTTATTtgttt (SEQ ID NO 16) FOXD3 52 (+) 0.981 0.98 tttTATTTgttta (SEQ ID NO 17) HFH-3 54 (-) 1 0.982 ttattTGTTTatttcatc (SEQ ID NO 18) FOXJ2 54 (+) 1 0.926 aattTGTTTatttc (SEQ ID NO 19) HNF-3 beta 55 (-) 1 0.947 tatttgTTTATttc (SEQ ID NO 20) XFD-2 55 (-) 1 0.983 tatttgTTTATttcat (SEQ ID NO 21) Freac-7 55 (-) 1 0.996 tattTGTTTat (SEQ ID NO 22) FOXO4 55 (+) 0.972 0.97 TATTTgtttat (SEQ ID NO 23) HNF-3 alpha 56 (+) 1 0.834 atttgTTTATttca (SEQ ID NO 24) Cdx-2 56 (+) 1 0.971 attTGTITatttc (SEQ ID NO 25) HFH-3 56 (+) 1 0.986 attTGTTTatttc (SEQ ID NO 26) HFH-8 56 (+) 1 0.963 atttGTTTAttt (SEQ ID NO 27) HFH-1 56 (+) 1 0.958 atTTGTTtattt (SEQ ID NO 28) FOXD3 59 (+) 1 0.919 TGTTTatttca (SEQ ID NO 29) HNF-3alpha 60 (-) 0.85 0.878 gtttatttcatCTTCTaa (SEQ ID NO 30) IRF-7 72 (+) 1 0.964 ttctAAGTAtaa (SEQ ID NO 31) NKX3A 72 (+) 0.824 0.873 ttctaAGTATaagaatacattgta (SEQ ID NO 32) STAT5A (homotetramer) 123 (-) 1 0.962 agcaTTCCCacca (SEQ ID NO 33) lk-1 123 (-) 1 0.927 agcaTTCCCacca (SEQ ID NO 34) lk-3 147 (-) 0.813 0.869 gCGACAaa (SEQ ID NO 35) E2F 154 (-) 0.789 0.755 agccctgcgctCCTTAcgaca (SEQ ID NO 36) Pax-4 202 (-) 0.96 0.925 gcctCGTGCg (SEQ ID NO 37) USF 222 (+) 1 0.934 gcgggCCAATcg (SEQ ID NO 38) CCAATbox 234 (-) 0.788 0.784 cgctgctcccgGGTGAtgacg (SEQ ID NO 39) Pax-4 237 (-) 0.964 0.902 tgctcccgggTGATGacgtag (SEQ ID NO 40) Muscle initiator sequence-20 244 (+) 0.91 0.839 gggtGATGAcgtaggctgc (SEQ ID NO 41) v-Maf 246 (+) 1 0.991 gtgaTGACGtag (SEQ ID NO 42) CREB 248 (+) 1 0.881 gaTGACGtaggc (SEQ ID NO 43) ATF4 248 (+) 1 0.954 gaTGACGtaggc (SEQ ID NO 44) CREB 250 (+) 0.973 0.951 tgacGTAGG (SEQ ID NO 45) TFII-I 250 (+) 1 0.971 tGACGtag (SEQ ID NO 46) CREB 277 (+) 1 0.97 aGGGAGgg (SEQ ID NO 47) MAZ 290 (+) 1 0.999 cTTGGCgg (SEQ ID NO 48) E2F-1 290 (+) 0.964 0.916 ctTGGCGg (SEQ ID NO 49) E2F-1 290 (+) 0.984 0.897 ctTGGCGg (SEQ ID NO 50) E2F - The frequency is the existence of specific TF binding sites in regulatory regions of all the genes or tissue specific genes. After analysis of the regulatory region of all the genes, the frequency or probability of existence of TF binding sites is easy established. Some of these frequencies information are listed for gene DLD in table 3:
Table 3: TF name left position right position distance (base) to TSS genomic frequency Pax-3 106015239 106015259 -249 0.426259226 Pax-4 106015241 106015261 -247 0.96109025 Pax-6 106015242 106015262 -246 0.112003108 Pax-4 106015242 106015262 -246 0.96109025 Lmo2complex 106015260 106015268 -228 0.120419526 Cart-1 106015261 106015278 -227 0.020134663 Cart-1 106015261 106015278 -227 0.020134663 Cdc5 106015270 106015281 -218 0.360481678 Cdx-2 106015284 106015297 -204 0.259031464 FOXJ2 106015286 106015303 -202 0.167875178 HNF-3beta 106015286 106015300 -202 0.23688981 Xvent-1 106015287 106015299 -201 0.678946005 HFH-3 106015288 106015300 -200 0.066942898 FOXD3 106015288 106015299 -200 0.653632008 FOXJ2 106015290 106015307 -198 0.167875178 HNF-3beta 106015290 106015304 -198 0.23688981 FOXO4 106015291 106015301 -197 0.10785964 XFD-2 106015291 106015304 -197 0.033665674 Freac-7 106015291 106015306 -197 0.076718892 HNF-3alpha 106015291 106015301 -197 0.312184384 HFH-1 106015292 106015303 -196 0.01657387 HFH-3 106015292 106015304 -196 0.066942898 HFH-8 106015292 106015304 -196 0.020652596 FOXD3 106015292 106015303 -196 0.653632008 Cdx-2 106015292 106015305 -196 0.259031464 HNF-3alpha 106015295 106015305 -193 0.312184384 IRF-7 106015296 106015313 -192 0.206914411 NKX3A 106015308 106015319 -180 0.02233588 STAT5A(homotetramer) 106015308 106015331 -180 0.02926324 lk-1 106015359 106015371 -129 0.149682766 lk-3 106015359 106015371 -129 0.019875696 E2F 106015383 106015390 -105 0.566230739 Pax-4 106015390 106015410 -98 0.96109025 USF 106015438 106015447 -50 0.781561569 CCAATbox 106015458 106015469 -30 0.288488929 Pax-4 106015470 106015490 -18 0.96109025 Muscleinitiator sequence-20 106015473 106015493 -15 0.29004273 v-Maf 106015480 106015498 -8 0.233458501 CREB 106015482 106015493 -6 0.308429367 CREB 106015484 106015495 -4 0.308429367 ATF4 106015484 106015495 -4 0.142172731 TFII-I 106015486 106015494 -2 0.949177781 CREB 106015486 106015493 -2 0.308429367 MAZ 106015513 106015520 25 1.118477276 E2F 106015526 106015533 38 0.566230739 E2F-1 106015526 106015533 38 0.901268937 E2F-1 106015526 106015533 38 0.901268937 - The conservation scores for whole genome comparison between human and mouse are retrieved from UCSC genome browser database. The conservation score is selected to cover regions where the TF binding sites are identified. The conservation scores for the TF binding sites identified in the regulatory region of gene DLD are listed in table 4.
Table 4: TF name core sequences start position end position distance to TSS Conservati on score Pax-3 tgaacttgTCACGctttactg (SEQ ID NO 4) 106015239 106015259 -249 0.426 Pax-4 aacttgtcacgCTTTActgtc (SEQ ID NO 5) 106015241 106015261 -247 0.3552 Pax-6 acttgTCACGctttactgtcg (SEQ ID NO 6) 106015242 106015262 -246 0.3552 Pax-4 acttgTCACGctttactgtcg (SEQ ID NO 7) 106015242 106015262 -246 0.3552 Lmo2complex tCGATAatg (SEQ ID NO 8) 106015260 106015268 -228 0.06 Cart-1 cgaTAATGtgcattaagc (SEQ ID NO 10) 106015261 106015278 -227 0.06 Cart-1 cgataatgtgCATTAagc (SEQ ID NO 9) 106015261 106015278 -227 0.06 Cdc5 gcaTTAAGcaaa (SEQ ID NO 11) 106015270 106015281 -218 0.064 Cdx-2 ctagtTTTATttgt (SEQ ID NO 12) 106015284 106015297 -204 0.11 FOXJ2 agtttTATTTgtttattt (SEQ ID NO 13) 106015286 106015303 -202 0.162 HNF-3beta agtttTATTTgttta (SEQ ID NO 14) 106015286 106015300 -202 0.162 Xvent-1 gttttATTTGttt (SEQ ID NO 15) 106015287 106015299 -201 0.1226666 67 HFH-3 tttTATTTgttta (SEQ ID NO 17) 106015288 106015300 -200 0.162 FOXD3 ttTTATTtgttt (SEQ ID NO 16) 106015288 106015299 -200 0.1226666 67 FOXJ2 ttattTGTTTatttcatc (SEQ ID NO 18) 106015290 106015307 -198 0.286 HNF-3beta ttattTGTTTatttc (SEQ ID NO 19) 1060T5290 106015304 -198 0.192 FOX04 tattTGTTTat (SEQ ID NO 22) 106015291 106015301 -197 0.192 XFD-2 tatttgTTTATttc (SEQ ID NO 20) 106015291 106015304 -197 0.192 Freac-7 tatttgTTTATttcat (SEQ ID NO 21) 106575291 106015306 -197 0.286 HNF-3alpha TATTTgtttat (SEQ ID NO 23) 106015291 106015301 -197 0.192 HFH-1 atttGTTTAttt (SEQ ID NO 27) 106015292 106015303 -196 0.192 HFH-3 attTGTTTatttc (SEQ ID NO 25) 106015292 106015304 -196 0.192 HFH-8 attTGTTTatttc (SEQ ID NO 26) 106015292 106015304 -196 0.192 FOXD3 atTTGTTtattt (SEQ ID NO 28) 106015292 106015303 -196 0.192 Cdx-2 atttgTTTATttca (SEQ ID NO 24) 1060T5292 106015305 -196 0.286 HNF-3alpha TGTTTatttca (SEQ ID NO 29) 106015295 106015305 -193 0.3573333 33 IRF-7 gtttatttcatCTTCTaa (SEQ ID NO 30) 106015296 106015313 -192 0.41 NKX3A ttctAAGTAtaa (SEQ ID NO 31) 106015308 106015319 -180 0.624 STAT5A (homotetra mer) 
106015308 106015331 -180 0.5506666 67 lk-1 agcaTTCCCacca (SEQ ID NO 33) 106015359 106015371 -129 0.394 lk-3 agcaTTCCCacca (SEQ ID NO 34) 106015359 106015371 -129 0.394 E2F gCGACAaa (SEQ ID NO 35) 106015383 106015390 -105 0.6746666 67 Pax-4 
106015390 106015410 -98 1.2336 USF gcctCGTGCg (SEQ ID NO 37) 106015438 106015447 -50 0.888 CCAAT-box gcgggCCAATcg (SEQ ID NO 38) 106015458 106015469 -30 1.136 Pax-4 
106015470 106015490 -18 1.3408 Muscle initiator sequence-20 
106015473 106015493 -15 1.3408 v-Maf gggtGATGAcgtaggctgc (SEQ ID NO 41) 106015480 106015498 -8 1.356 CREB gtgaTGACGtag (SEQ ID NO 42) 106015482 106015493 -6 1.3786666 67 CREB gaTGACGtaggc (SEQ ID NO 44) 106015484 106015495 -4 1.356 ATF4 gaTGACGtaggc (SEQ ID NO 43) 106015484 106015495 -4 1.356 TFII-I tgacGTAGG (SEQ ID NO 45) 106015486 106015494 -2 1.544 CREB TGACGtag (SEQ ID NO 46) 106015486 106015493 -2 1.544 MAZ aGGGAGgg (SEQ ID NO 47) 106015513 106015520 25 0.7146666 67 E2F ctTGGCGg (SEQ ID NO 50) 106015526 106015533 38 0.532 E2F-1 ctTGGCGg (SEQ ID NO 49) 106015526 106015533 38 0.532 E2F-1 cTTGGCgg (SEQ ID NO 48) 106015526 106015533 38 0.532 - The adjacent or overlapped binding sites are clustered by using self-generated script and the corresponding position and TF are listed in the table 5 for the gene DLD.
Table 5: Cluster ID Core sequences left position right position Transcription Factor(s) Cdc5;Cart-1;Cart-1;Lmo2compIex ;Pax- 1 
106015239 106015281 4;Pax-6;Pax-4;Pax-3; STATSA(homotetramer);N KX3A;IRF- 7;HNF-3alpha;Cdx;-2;HFH-3;HFH-8;HFH- 1;FOXD3;Freac-7;XFD-2;HNF- 3alpha;FOX04;FOXJ2;HN F-3beta;HFH- 3;FOXD3;Xvent-1;FOXJ2;HNF-3beta;Cdx- 2 
106015284 106015331 2; 3 agcattcccacca (SEQ ID NO 53) 106015359 106015371 lk-3;lk-1; 4 
106015383 106015410 Pax-4;E2F; 5 gcctcgtgcg (SEQ ID NO 55) 106015438 106015447 USF; TFII-I;CREB;CREB;ATF4;CRE B;v- Maf;Muscleinitiator sequence-20 ;Pax- 6 
106015458 106015498 4;CCAATbox; 7 agggaggg (SEQ ID NO 57) 106015513 105015520 MAZ; 8 cttggcgg (SEQ ID NO 58) 106015526 106015533 E2F;E2F-1;E2F-1; - All the binding profiles listed above are been collected in the database. The example list of the entry for gene DLD is shown in Table 6.
Table 6: TF name core score matrix score core sequences left position right position distance (base) to TSS genomic frequency conservation score Pax-3 1 0.964 tgaacttaTCACGctttactg (SEQ ID NO 63) 106015239 106015259 -249 0.426259226 0.426 Pax-4 0.796 0.779 aacttgtcacgCTTTActgtc (SEQ ID NO 5) 106015241 106015261 -247 0.96109025 0.3552 Pax-6 1 0.886 acttgTCACGctttactgtcg (SEQ ID NO 6) 106015242 106015262 -246 0.112003108 0.3552 Pax-4 0.977 0.761 acttgTCACGctttactgtcg (SEQ ID NO 7) 106015242 106015262 -246 0.96109025 0.3552 Lmo2compl ex 0.994 0.972 tCGATAatg (SEQ ID NO 8) 106015260 106015268 -228 0.120419526 0.06 Cart-1 0.951 0.952 caaTAATGtgcattaagc (SEQ ID NO 64) 106015261 106015278 -227 0.020134663 0.06 Cart-1 0.951 0.963 cgataatgtCATTAagc (SEQ ID NO 9) 106015261 106015278 -227 0.020134663 0.06 Cdc5 0.896 0.772 gcaTTAAGcaaa (SEQ ID NO 11) 106015270 106015281 -218 0.360481678 0.064 Cdx-2 1 0.806 ctagtTTTATttgt (SEQ ID NO 12) 106015284 106015297 -204 0.259031464 0.11 FOXJ2 0.96 0.937 agtttTATTTgtttattt (SEQ ID NO 13) 106015286 106015303 -202 0.167875178 0.162 HNF-3beta 1 0.952 agtttTATTTgttta (SEQ ID NO 14) 106015286 106015300 -202 0.23688981 0.162 Xvent-1 1 0.938 gttttATTTGttt (SEQ ID NO 15) 106015287 106015299 -201 0.678946005 0.122666667 HFH-3 0.981 0.98 tttTATTTgttta (SEQ ID NO 17) 106015288 106015300 -200 0.066942898 0.162 FOXD3 0.948 0.926 ttTTATTtgttt (SEQ ID NO 16) 106015288 106015299 -200 0.653632008 0.122666667 FOXJ2 1 0.982 ttattTGTTTatttcatc (SEQ ID NO 18) 106015290 106015307 -198 0.167875178 0.286 HNF-3beta 1 0.926 ttattTGTTTatttc (SEQ ID NO 19) 106015290 106015304 -198 0.23688981 0.192 FOX04 1 0.996 tattTGTTTat (SEQ ID NO 22) 106015291 106015301 -197 0.10785964 0.192 XFD-2 1 0.947 tatttgTTTATttc (SEQ ID NO 20) 106015291 106015304 -197 0.033665674 0.192 Freac-7 1 0.983 tatttgTTTATttcat (SEQ ID NO 21) 106015291 106015306 -197 0.076718892 0.286 HNF-3alpha 0.972 0.97 TATTTgtttat (SEQ ID NO 23) 106015291 106015301 -197 0.312184384 0.192 HFH-1 1 0.963 atttGTTTAttt (SEQ ID NO 27) 106015292 106015303 -196 0.01657387 0.192 HFH-3 1 0.971 attTGTTTatttc (SEQ ID NO 25) 106015292 106015304 -196 0.066942898 0.192 HFH-8 1 0.986 attTGTTTatttc (SEQ ID NO 26) 106015292 106015304 -196 0.020652596 0.192 FOXD3 1 0.958 atTTGTTtattt (SEQ ID NO 28) 106015292 106015303 -196 0.653632008 0.192 Cdx-2 1 0.834 atttgTTTATttca (SEQ ID NO 24) 106015292 106015305 -196 0.259031464 0.286 HNF-3alpha 1 0.919 TGTTTatttca (SEQ ID NO 29) 106015295 106015305 -193 0.312184384 0.357333333 IRF-7 0.85 0.878 gtttatttcatCTTCTaa (SEQ ID NO 30) 106015296 106015313 -192 0.206914411 0.41 NKX3A 1 0.964 ttctAAGTAtaa (SEQ ID NO 31) 106015308 106015319 -180 0.02233588 0.624 STAT5A(ho motetramer) 0.824 0.873 ttctaAGTATaagaatacattgta (SEQ ID NO 32) 106015308 106015331 -180 0.02926324 0.550666667 lk-1 1 0.962 agcaTTCCCacca (SEQ ID NO 33) 106015359 106015371 -129 0.149682766 0.394 lk-3 1 0.927 agcaTTCCacca (SEQ ID NO 65) 106015359 106015371 -129 0.019875696 0.394 E2F 0.813 0.869 gCGACAaa (SEQ ID NO 35) 106015383 106015390 -105 0.566230739 0.674666667 Pax-4 0.789 0.755 agccctgcgctCCTTAcgaca (SEQ ID NO 36) 106015390 106015410 -98 0.96109025 1.2336 USF 0.96 0.925 gcctCGTGCg (SEQ ID NO 37) 106015438 106015447 -50 0.781561569 0.888 CCAATbox 1 0.934 gcgggCCAATcg (SEQ ID NO 38) 106015458 106015469 -30 0.288488929 1.136 Pax-4 0.788 0.784 cgctgctcccgGGTGAtgacg (SEQ ID NO 39) 106015470 106015490 -18 0.96109025 1.3408 Muscle initiator sequence-20 0.964 0.902 tgctcccgggTGATGacgtag (SEQ ID NO 40) 106015473 106015493 -15 0.29004273 1.3408 v-Maf 0.91 0.839 gggtGATGAcgtaggctgc (SEQ ID NO 41) 106015480 106015498 -8 0.233458501 1.356 CREB 1 0.991 gtgaTGACGtag (SEQ ID NO 42) 106015482 106015493 -6 0.308429337 1.378666667 CREB 1 0.954 gaTGACGtaggc (SEQ ID NO 44) 106015484 106015495 -4 0.308429367 1.356 ATF4 1 0.881 gaTGACGtaggc (SEQ ID NO 43) 106015484 106015495 -4 0.142172731 1.356 TFII-1 0.973 0.951 tgacGTAGG (SEQ ID NO 45) 106015486 106015494 -2 0.949177781 1.544 CREB 1 0.971 TGACGtag (SEQ ID NO 46) 106015486 106015493 -2 0.308429367 1.544 MAZ 1 0.97 aGGGAGgg (SEQ ID NO 47) 106015513 106015520 25 1.118477276 0.714666667 E2F 0.984 0.897 ctTGGCGg (SEQ ID NO 50) 106015526 106015533 38 0.566230739 0.532 E2F-1 0.964 0.916 ctTGGCGg (SEQ ID NO 49) 106015526 106015533 38 0.901268937 0.532 E2F-1 1 0.999 cTTGGCgg (SEQ ID NO 48) 106015526 106015533 38 0.901268937 0.532 -
Figure 11 illustrates a screen shot of a query form that can be used with the database.Figure 12 illustrates a screen shot of a database query result - As illustrated in
Figure 13 , the present application also describes a computer implemented system for displaying the profiled regulatory factor binding sites. The system includes the database, a user interface that includes one or more selectable user inputs, an input device operable by a user, and a display for displaying at least one output in response to the profiled identified binding sites. - Examples of outputs include but are not limited to, gene name, identifier, identified TF binding site, TF names, genomic positions, length, distance, conservation score, binding scores, frequencies information, and binding sites sequences. Examples of inputs includes, the gene identifiers, such as gene symbols, unigene cluster ID, or locuslink ID, and the like.
- The system also includes a memory, a microprocessor, data files, scripts, supporting available software, including but not limited to MS windows, red hat linux, Apache HTTP sever, Perl compiler program, and the like.
- The foregoing description of a preferred embodiment of the invention has been presented for purposes of illustration and description. It is not intended to be exhaustive or to limit the invention to the precise forms disclosed. Obviously, many modifications and variations will be apparent to practitioners skilled in this art. It is intended that the scope of the invention be defined by the following claims.
-
- <110> CORGENTECH, INC.
ZHANG, Jie
WEI, Hsiu-Ying
MCEVOY, Leslie Margaret - <120> GENOMIC PROFILING OF REGULATORY FACTOR BINDING SITES
- <130> 39753-0003 PCT
- <140> Unassigned
<141> Herewith - <150>
US 10/402,689
<151> 2003-03-28 - <160> 65
- <170> FastSEQ for windows version 4.0
- <210> 1
<211> 14
<212> DNA
<213> Homo sapiens - <220>
<221> protein_bind
<222> (1)...(14) - <400> 1
aggggacttt ccca 14 - <210> 2
<211> 8 <212> DNA
<213> Homo sapiens - <220>
<221> protein_bind
<222> (1)...(8) - <400> 2
tttggcgg 8 - <210> 3
<211> 36
<212> DNA
<213> Homo sapiens - <220>
<221> protein_bind
<222> (10)...(22) - <400> 3
agcgtcagaa ggggactttc ccaagagagg ccgaga 36 - <210> 4
<211> 21
<212> DNA
<213> Homo sapiens - <220>
<221> protein_bind
<222> (9)...(13) - <400> 4
tgaacttgtc acgctttact g 21 - <210> 5
<211> 21
<212> DNA
<213> Homo sapiens - <220>
<221> protein_bind
<222> (12)...(16) - <400> 5
aacttgtcac gctttactgt c 21 - <210> 6
<211> 21
<212> DNA
<213> Homo sapiens - <220>
<221> protein_bind
<222> (6)...(10) - <400> 6
acttgtcacg ctttactgtc g 21 - <210> 7
<211> 21
<212> DNA
<213> Homo sapiens - <220>
<221> protein_bind
<222> (6)...(10) - <400> 7
acttgtcacg ctttactgtc g 21 - <210> 8
<211> 9
<212> DNA
<213> Homo sapiens - <220>
<221> protein_bind
<222> (2)...(6) - <400> 8
tcgataatg 9 - <210> 9
<211> 18
<212> DNA
<213> Homo sapiens - <220>
<221> protein_bind
<222> (11)...(15) - <400> 9
cgataatgtg cattaagc 18 - <210> 10
<211> 18
<212> DNA
<213> Homo sapiens - <220>
<221> protein_bind
<222> (4)...(8) - <400> 10
cgataatgtg cattaagc 18 - <210> 11
<211> 12
<212> DNA
<213> Homo sapiens - <220>
<221> protein_bind
<222> (4)...(8) - <400> 11
gcattaagca aa 12 - <210> 12
<211> 14
<212> DNA
<213> Homo sapiens - <220>
<221> protein_bind
<222> (6)...(10) - <400> 12
ctagttttat ttgt 14 - <210> 13
<211> 18
<212> DNA
<213> Homo sapiens - <220>
<221> protein_bind
<222> (6)...(10) - <400> 13
agttttattt gtttattt 18 - <210> 14
<211> 15
<212> DNA
<213> Homo sapiens - <220>
<221> protein_bind
<222> (6)...(10) - <400> 14
agttttattt gttta 15 - <210> 15
<211> 13
<212> DNA
<213> Homo sapiens - <220>
<221> protein_bind
<222> (6)...(10) - <400> 15 13
gttttatttg ttt 13 - <210> 16
<211> 12
<212> DNA
<213> Homo sapiens - <220>
<221> protein_bind
<222> (3)...(7) - <400> 16 12
ttttatttgt tt 12 - <210> 17
<211> 13
<212> DNA
<213> Homo sapiens - <220>
<221> protein_bind
<222> (4)...(8) - <400> 17 13
ttttatttgt tta 13 - <210> 18
<211> 18
<212> DNA
<213> Homo sapiens - <220>
<221> protein_bind
<222> (6)...(10) - <400> 18
ttatttgttt atttcatc 18 - <210> 19
<211> 15
<212> DNA
<213> Homo sapiens - <220>
<221> protein_bind
<222> (6)...(10) - <400> 19
ttatttgttt atttc 15 - <210> 20
<211> 14
<212> DNA
<213> Homo sapiens - <220>
<221> protein_bind
<222> (7)...(11) - <400> 20
tatttgttta tttc 14 - <210> 21
<211> 16
<212> DNA
<213> Homo sapiens - <220>
<221> protein_bind
<222> (7)...(11) - <400> 21
tatttgttta tttcat 16 - <210> 22
<211> 11
<212> DNA
<213> Homo sapiens - <220>
<221> protein_bind
<222> (5)...(9) - <400> 22
tatttgttta t 11 - <210> 23
<211> 11
<212> DNA
<213> Homo sapiens - <220>
<221> protein_bind
<222> (1)...(5) - <400> 23
tatttgttta t 11 - <210> 24
<211> 14
<212> DNA
<213> Homo sapiens - <220>
<221> protein_bind
<222> (6)...(10) - <400> 24
atttgtttat ttca 14 - <210> 25
<211> 13
<212> DNA
<213> Homo sapiens - <220>
<221> protein_bind
<222> (4)...(8) - <400> 25
atttgtttat ttc 13 - <210> 26
<211> 13
<212> DNA
<213> Homo sapiens - <220>
<221> protein_bind
<222> (4)...(8) - <400> 26
atttgtttat ttc 13 - <210> 27
<211> 12
<212> DNA
<213> Homo sapiens - <220>
<221> protein_bind
<222> (5)...(9) - <400> 27
atttgtttat tt 12 - <210> 28
<211> 12
<212> DNA
<213> Homo sapiens - <220>
<221> protein_bind
<222> (3)...(7) - <400> 28
atttgtttat tt 12 - <210> 29
<211> 11
<212> DNA
<213> Homo sapiens - <220>
<221> protein_bind
<222> (1)...(5) - <400> 29
tgtttatttc a 11 - <210> 30
<211> 18
<212> DNA
<213> Homo sapiens - <220>
<221> protein_bind
<222> (12)...(16) - <400> 30
gtttatttca tcttctaa 18 - <210> 31
<211> 12
<212> DNA
<213> Homo sapiens - <220>
<221> protein_bind
<222> (5)...(9) - <400> 31
ttctaagtat aa 12 - <210> 32
<211> 24
<212> DNA
<213> Homo sapiens - <220>
<221> protein_bind
<222> (6)...(10) - <400> 32
ttctaagtat aagaatacat tgta 24 - <210> 33
<211> 13
<212> DNA
<213> Homo sapiens - <220>
<221> protein_bind
<222> (5)...(9) - <400> 33
agcattccca cca 13 - <210> 34
<211> 13
<212> DNA
<213> Homo sapiens - <220>
<221> protein_bind
<222> (5)...(9) - <400> 34
agcattccca cca 13 - <210> 35
<211> 8
<212> DNA
<213> Homo sapiens - <220>
<221> protein_bind
<222> (2)...(6) - <400> 35
gcgacaaa 8 - <210> 36
<211> 21
<212> DNA
<213> Homo sapiens - <220>
<221> protein_bind
<222> (12)...(16) - <400> 36
agccctgcgc tccttacgac a 21 - <210> 37
<211> 10
<212> DNA
<213> Homo sapiens - <220>
<221> protein_bind
<222> (5)...(9) - <400> 37
gcctcgtgcg 10 - <210> 38
<211> 12
<212> DNA
<213> Homo sapiens - <220>
<221> protein_bind
<222> (6)...(10) - <400> 38
gcgggccaat cg 12 - <210> 39
<211> 21
<212> DNA
<213> Homo sapiens - <220>
<221> protein_bind
<222> (12)...(16) - <400> 39
cgctgctccc gggtgatgac g 21 - <210> 40
<211> 21
<212> DNA
<213> Homo sapiens - <220>
<221> protein_bind
<222> (11) ... (15) - <400> 40
tgctcccggg tgatgacgta g 21 - <210> 41
<211> 19
<212> DNA
<213> Homo sapiens - <220>
<221> protein_bind
<222> (5)...(9) - <400> 41
gggtgatgac gtaggctgc 19 - <210> 42
<211> 12
<212> DNA
<213> Homo sapiens - <220>
<221> protein_bind
<222> (5)...(9) - <400> 42
gtgatgacgt ag 12 - <210> 43
<211> 12
<212> DNA
<213> Homo sapiens - <220>
<221> protein_bind
<222> (3)...(7) - <400> 43
gatgacgtag gc 12 - <210> 44
<211> 12
<212> DNA
<213> Homo sapiens - <220>
<221> protein_bind
<222> (3)...(7) - <400> 44
gatgacgtag gc 12 - <210> 45
<211> 9
<212> DNA
<213> Homo sapiens - <220>
<221> protein_bind
<222> (5)...(9) - <400> 45
tgacgtagg 9 - <210> 46
<211> 8
<212> DNA
<213> Homo sapiens - <220>
<221> protein_bind
<222> (1)...(5) - <400> 46
tgacgtag 8 - <210> 47
<211> 8
<212> DNA
<213> Homo sapiens - <220>
<221> protein_bind
<222> (2)...(6) - <400> 47
agggaggg 8 - <210> 48
<211> 8
<212> DNA
<213> Homo sapiens - <220>
<221> protein_bind
<222> (2)...(6) - <400> 48
cttggcgg 8 - <210> 49
<211> 8
<212> DNA
<213> Homo sapiens - <220>
<221> protein_bind
<222> (3)...(7) - <400> 49 8
cttggcgg 8 - <210> 50
<211> 8
<212> DNA
<213> Homo sapiens - <220>
<221> protein_bind
<222> (3)...(7) - <400> 50 8
cttggcgg 8 - <210> 51
<211> 43
<212> DNA
<213> Homo sapiens - <400> 51
tgaacttgtc acgctttact gtcgataatg tgcattaagc aaa 43 - <210> 52
<211> 48
<212> DNA
<213> Homo sapiens - <400> 52
ctagttttat ttgtttattt catcttctaa gtataagaat acattgta 48 - <210> 53
<211> 13
<212> DNA
<213> Homo sapiens - <400> 53 13
agcattccca cca 13 - <210> 54
<211> 28
<212> DNA
<213> Homo sapiens - <400> 54
gcgacaaagc cctgcgctcc ttacgaca 28 - <210> 55
<211> 10
<212> DNA
<213> Homo sapiens - <400> 55
gcctcgtgcg 10 - <210> 56
<211> 40
<212> DNA
<213> Homo sapiens - <400> 56
gcgggcaatc gcgctgctcc cgggtgatga cgtaggctgc 40 - <210> 57
<211> 8
<212> DNA
<213> Homo sapiens - <400> 57
agggaggg 8 - <210> 58
<211> 8
<212> DNA
<213> Homo sapiens - <400> 58
cttggcgg 8 - <210> 59
<211> 2320
<212> DNA
<213> Homo sapiens - <400> 59

- <210> 60
<211> 2108
<212> DNA
<213> Homo sapiens - <400> 60

- <210> 61
<211> 2341
<212> DNA
<213> Homo sapiens - <400> 61


- <210> 62
<211> 301
<212> DNA
<213> Homo sapiens - <400> 62

- <210> 63
<211> 21
<212> DNA
<213> Homo sapiens - <220>
<221> protein_bind
<222> (9)...(13) - <400> 63
tgaacttatc acgctttact g 21 - <210> 64
<211> 18
<212> DNA
<213> Homo sapiens - <220>
<221> protein_bind
<222> (4)...(8) - <400> 64
caataatgtg cattaagc 18 - <210> 65
<211> 12
<212> DNA
<213> Homo sapiens - <220>
<221> protein_bind
<222> (5)...(8) - <400> 65
agcattccac ca 12
Claims (33)
- A method for profiling regulatory factor binding sites, comprising
locating and retrieving a complete and most 5' full-length gene for mapping the regulatory regions of said gene to a human genome;
retrieving genomic sequences from the human genome for the gene regulatory region comprising the sequence about 200-300 bases upstream of the transcriptional start site (TSS) and the sequence about 50-100 bases downstream of the TSS;
screening DNA sequence information of the retrieved gene regulatory region for the purpose of identifying putative regulatory factor binding sites;
creating a conservation score for each putative regulatory factor binding site;
profiling the putative regulatory factor binding sites of the gene;
collecting profiles including transcription factor binding site sequence information and the conservation score in a database; and
computationally generating all the possible transcriptional decoys for profiled regulatory factor binding sites. - The method of claim 1, wherein the retrieved genes are mapped to the human genome using a publicly available UCSC genome database browser.
- The method of claim 1, wherein the TSS is mapped by taking the most 5' TSS of each gene after comparing all available TSSs for the gene.
- The method of claim 1, wherein a genomic sequence of a regulatory region for each retrieved gene with the most 5'TSS is retrieved from a human genome.
- The method of claim 4, further comprising:cutting and storing the corresponding sequences relative to TSS.
- The method of claim 1, wherein the DNA sequence information is screened using a MATCH program or the similar Position Weighted Matrix Programs for motif searching.
- The method of claim 1, wherein the DNA sequence information screening includes selecting the TF matrix, scores of matrix similarity and scores of core similarity.
- The method of claim 1, wherein cut-off is applied to reduce the false positive and false negative matching during screening.
- The method of claim 1, further comprising:determining at least one of a genomic or tissue-specific frequency of each binding site.
- The method of claim 1, wherein the frequency is the existence of specific TF binding sites in regulatory regions of all the genes.
- The method of claim 1, wherein the frequency is the existence of specific TF binding sites in regulatory regions of tissue specific genes.
- The method of claim 7, further comprising:creating a conservation score for each binding site.
- The method of claim 12, wherein the conservation scores are selected to cover regions where the TF binding sites are identified.
- The method of claim 8, further comprising:determining a position of each binding site.
- The method of claim 14, wherein the position is based on a human genome working draft.
- The method of claim 15, wherein the position is a converted position in a human genome working draft.
- The method of claim 14, wherein the genome position of a start and end is determined.
- The method of claim 14, further comprising:determining a distance of each binding site to a TSS.
- The method of claim 18, wherein the distance is relative to a number of bases between a binding site and the TSS.
- The method of claim 18, further comprising:determining a length of each binding site.
- The method of claim 20, further comprising:determining sequence information about regions adjacent to the binding site.
- The method of claim 21, further comprising:determining co-existence information of other binding sites.
- The method of claim 22, further comprising:determining cluster of the binding sites and their positions.
- The method of any one of the preceding claims, wherein the method further comprises experimentally screening said transcriptional decoys using high-throughput methods for binding efficiency optimization.
- The method of claim 1, wherein the database includes TF binding profiles for the regulatory region of each gene.
- The method of claim 1, wherein the database is searchable by gene identifiers.
- The method of claim 1, wherein the gene identifiers are selected from the NCBI database.
- The method of claim 27, wherein the NCBI database includes at least one of Unigene Cluster ID, LocusLink ID and international approved gene symbols.
- The method of claim 26, wherein the database includes genomic frequencies information for TF.
- The method 29 wherein the database includes genomic frequencies for vertebrate TF.
- The method of claim 29 or claim 30, wherein the database can be sorted by at least one of TF name and TF frequencies.
- The method of claim 31, wherein the TF frequencies include genome frequencies and tissue specific frequencies.
- A method comprising profiling regulatory factor binding sites according to the method of claim 1, and further comprising:retrieving information from the database for biomedical research;retrieving information from the database for pre-clinical development;retrieving information from the database for drug screening applications;retrieving information from the database for target discovering and target validation;retrieving information from the database for profiling of a regulatory region; orretrieving information from the database for building the genome or tissue wide connections between regulatory profilings of different genes.
Applications Claiming Priority (3)
| Application Number | Priority Date | Filing Date | Title |
|---|---|---|---|
| US402689 | 1995-03-13 | ||
| US10/402,689 US20040191781A1 (en) | 2003-03-28 | 2003-03-28 | Genomic profiling of regulatory factor binding sites |
| PCT/US2004/009201 WO2004087966A2 (en) | 2003-03-28 | 2004-03-24 | Genomic profiling of regulatory factor binding sites |
Publications (2)
| Publication Number | Publication Date |
|---|---|
| EP1608786A2 EP1608786A2 (en) | 2005-12-28 |
| EP1608786B1 true EP1608786B1 (en) | 2008-12-03 |
Family
ID=32989771
Family Applications (1)
| Application Number | Title | Priority Date | Filing Date |
|---|---|---|---|
| EP04758363A Expired - Lifetime EP1608786B1 (en) | 2003-03-28 | 2004-03-24 | Genomic profiling of regulatory factor binding sites |
Country Status (12)
| Country | Link |
|---|---|
| US (1) | US20040191781A1 (en) |
| EP (1) | EP1608786B1 (en) |
| JP (3) | JP2004303201A (en) |
| KR (1) | KR20060015484A (en) |
| CN (1) | CN1784498A (en) |
| AT (1) | ATE416261T1 (en) |
| AU (1) | AU2004225474A1 (en) |
| CA (1) | CA2519674A1 (en) |
| DE (1) | DE602004018115D1 (en) |
| MX (1) | MXPA05010276A (en) |
| RU (1) | RU2005133192A (en) |
| WO (1) | WO2004087966A2 (en) |
Families Citing this family (11)
| Publication number | Priority date | Publication date | Assignee | Title |
|---|---|---|---|---|
| US20080163824A1 (en) * | 2006-09-01 | 2008-07-10 | Innovative Dairy Products Pty Ltd, An Australian Company, Acn 098 382 784 | Whole genome based genetic evaluation and selection process |
| US20090049856A1 (en) * | 2007-08-20 | 2009-02-26 | Honeywell International Inc. | Working fluid of a blend of 1,1,1,3,3-pentafluoropane, 1,1,1,2,3,3-hexafluoropropane, and 1,1,1,2-tetrafluoroethane and method and apparatus for using |
| CN101930502B (en) * | 2010-09-03 | 2011-12-21 | 深圳华大基因科技有限公司 | Method and system for detection of phenotype genes and analysis of biological information |
| CA2818973A1 (en) * | 2010-11-25 | 2012-05-31 | Portable Genomics Llc | Organization, visualization and utilization of genomic data on electronic devices |
| WO2013188789A2 (en) * | 2012-06-14 | 2013-12-19 | Whitehead Institute For Biomedical Research | Genome-wide method of assessing interactions between chemical entities and their target molecules |
| WO2015031628A1 (en) * | 2013-08-28 | 2015-03-05 | Oregon Health & Science University | Synthetic oligonucleotides for detection of nucleic acid binding proteins |
| CN103870719B (en) * | 2014-04-09 | 2017-06-16 | 苏州大学 | A kind of process for recognising human gene promoter and system |
| CN104156635B (en) * | 2014-07-08 | 2017-07-07 | 华南师范大学 | The OPSM method for digging of the gene chip expression data based on common subsequence |
| WO2016092444A1 (en) * | 2014-12-10 | 2016-06-16 | Koninklijke Philips N.V. | Methods and systems to generate noncoding-coding gene co-expression networks |
| CN105912886A (en) * | 2016-03-29 | 2016-08-31 | 上海师范大学 | Method of predicting binding site of protein in RNA virus gene |
| CN118866104B (en) * | 2024-09-26 | 2025-02-25 | 烟台大学 | A method, system, device and storage medium for comparing long genome sequences |
Family Cites Families (1)
| Publication number | Priority date | Publication date | Assignee | Title |
|---|---|---|---|---|
| US6519583B1 (en) * | 1997-05-15 | 2003-02-11 | Incyte Pharmaceuticals, Inc. | Graphical viewer for biomolecular sequence data |
-
2003
- 2003-03-28 US US10/402,689 patent/US20040191781A1/en not_active Abandoned
-
2004
- 2004-02-03 JP JP2004027409A patent/JP2004303201A/en active Pending
- 2004-03-24 RU RU2005133192/13A patent/RU2005133192A/en not_active Application Discontinuation
- 2004-03-24 DE DE602004018115T patent/DE602004018115D1/en not_active Expired - Fee Related
- 2004-03-24 KR KR1020057018232A patent/KR20060015484A/en not_active Ceased
- 2004-03-24 WO PCT/US2004/009201 patent/WO2004087966A2/en not_active Ceased
- 2004-03-24 EP EP04758363A patent/EP1608786B1/en not_active Expired - Lifetime
- 2004-03-24 CA CA002519674A patent/CA2519674A1/en not_active Abandoned
- 2004-03-24 AT AT04758363T patent/ATE416261T1/en not_active IP Right Cessation
- 2004-03-24 CN CNA2004800126273A patent/CN1784498A/en active Pending
- 2004-03-24 MX MXPA05010276A patent/MXPA05010276A/en not_active Application Discontinuation
- 2004-03-24 AU AU2004225474A patent/AU2004225474A1/en not_active Abandoned
-
2005
- 2005-08-17 JP JP2005237018A patent/JP2006031728A/en active Pending
-
2008
- 2008-06-04 JP JP2008147319A patent/JP2008293505A/en active Pending
Also Published As
| Publication number | Publication date |
|---|---|
| MXPA05010276A (en) | 2006-03-17 |
| DE602004018115D1 (en) | 2009-01-15 |
| RU2005133192A (en) | 2006-02-27 |
| WO2004087966A3 (en) | 2004-12-09 |
| ATE416261T1 (en) | 2008-12-15 |
| EP1608786A2 (en) | 2005-12-28 |
| AU2004225474A1 (en) | 2004-10-14 |
| JP2006031728A (en) | 2006-02-02 |
| JP2008293505A (en) | 2008-12-04 |
| CA2519674A1 (en) | 2004-10-14 |
| WO2004087966A2 (en) | 2004-10-14 |
| US20040191781A1 (en) | 2004-09-30 |
| JP2004303201A (en) | 2004-10-28 |
| KR20060015484A (en) | 2006-02-17 |
| CN1784498A (en) | 2006-06-07 |
Similar Documents
| Publication | Publication Date | Title |
|---|---|---|
| Baril et al. | Earl Grey: a fully automated user-friendly transposable element annotation and analysis pipeline | |
| Li et al. | A hidden Markov model for analyzing ChIP-chip experiments on genome tiling arrays and its application to p53 binding sequences | |
| Frith et al. | Detection of functional DNA motifs via statistical over‐representation | |
| Molina et al. | Genome wide analysis of Arabidopsis core promoters | |
| Valori et al. | Human rDNA copy number is unstable in metastatic breast cancers | |
| Liu et al. | Eukaryotic regulatory element conservation analysis and identification using comparative genomics | |
| Down et al. | NestedMICA: sensitive inference of over-represented motifs in nucleic acid sequence | |
| Hoffmann et al. | Accurate mapping of tRNA reads | |
| Zhang et al. | RNA landscape of evolution for optimal exon and intron discrimination | |
| Boeva et al. | Short fuzzy tandem repeats in genomic sequences, identification, and possible role in regulation of gene expression | |
| Ayele et al. | Whole genome shotgun sequencing of Brassica oleracea and its application to gene discovery and annotation in Arabidopsis | |
| Oggenfuss et al. | Recent transposable element bursts are associated with the proximity to genes in a fungal plant pathogen | |
| JP2008293505A (en) | Genomic profiling of regulatory factor binding sites | |
| WO2012168815A2 (en) | Method for assembly of nucleic acid sequence data | |
| Wildschutte et al. | Discovery and characterization of Alu repeat sequences via precise local read assembly | |
| Genovese et al. | Dot2dot: accurate whole-genome tandem repeats discovery | |
| Minniti et al. | TFinder: A Python Web Tool for Predicting Transcription Factor Binding Sites | |
| Barta et al. | DoOP: Databases of Orthologous Promoters, collections of clusters of orthologous upstream sequences from chordates and plants | |
| Sauer et al. | Evaluating phylogenetic footprinting for human–rodent comparisons | |
| Siddharthan | PhyloGibbs-MP: module prediction and discriminative motif-finding by Gibbs sampling | |
| Bortoluzzi et al. | A multistep bioinformatic approach detects putative regulatory elements in gene promoters | |
| Donaldson et al. | CoMoDis: composite motif discovery in mammalian genomes | |
| CN120072049B (en) | Transcription factor analysis method, apparatus, electronic device and storage medium | |
| JPWO2020008968A1 (en) | Information processing system, mutation detection system, storage medium and information processing method | |
| Tsou et al. | Biological data warehousing system for identifying transcriptional regulatory sites from gene expressions of microarray data |
Legal Events
| Date | Code | Title | Description |
|---|---|---|---|
| PUAI | Public reference made under article 153(3) epc to a published international application that has entered the european phase |
Free format text: ORIGINAL CODE: 0009012 |
|
| 17P | Request for examination filed |
Effective date: 20051012 |
|
| AK | Designated contracting states |
Kind code of ref document: A2 Designated state(s): AT BE BG CH CY CZ DE DK EE ES FI FR GB GR HU IE IT LI LU MC NL PL PT RO SE SI SK TR |
|
| AX | Request for extension of the european patent |
Extension state: AL LT LV MK |
|
| RIN1 | Information on inventor provided before grant (corrected) |
Inventor name: MCEVOY, LESLIE, MARGARET Inventor name: ZHANG, JIE Inventor name: WEI, HSIU-YING |
|
| DAX | Request for extension of the european patent (deleted) | ||
| REG | Reference to a national code |
Ref country code: HK Ref legal event code: DE Ref document number: 1087439 Country of ref document: HK |
|
| 17Q | First examination report despatched |
Effective date: 20051230 |
|
| RAP1 | Party data changed (applicant data changed or rights of an application transferred) |
Owner name: ANESIVA, INC. |
|
| GRAP | Despatch of communication of intention to grant a patent |
Free format text: ORIGINAL CODE: EPIDOSNIGR1 |
|
| GRAS | Grant fee paid |
Free format text: ORIGINAL CODE: EPIDOSNIGR3 |
|
| GRAA | (expected) grant |
Free format text: ORIGINAL CODE: 0009210 |
|
| AK | Designated contracting states |
Kind code of ref document: B1 Designated state(s): AT BE BG CH CY CZ DE DK EE ES FI FR GB GR HU IE IT LI LU MC NL PL PT RO SE SI SK TR |
|
| REG | Reference to a national code |
Ref country code: GB Ref legal event code: FG4D |
|
| REG | Reference to a national code |
Ref country code: CH Ref legal event code: EP |
|
| REG | Reference to a national code |
Ref country code: IE Ref legal event code: FG4D |
|
| REF | Corresponds to: |
Ref document number: 602004018115 Country of ref document: DE Date of ref document: 20090115 Kind code of ref document: P |
|
| PG25 | Lapsed in a contracting state [announced via postgrant information from national office to epo] |
Ref country code: ES Free format text: LAPSE BECAUSE OF FAILURE TO SUBMIT A TRANSLATION OF THE DESCRIPTION OR TO PAY THE FEE WITHIN THE PRESCRIBED TIME-LIMIT Effective date: 20090314 |
|
| NLV1 | Nl: lapsed or annulled due to failure to fulfill the requirements of art. 29p and 29m of the patents act | ||
| PG25 | Lapsed in a contracting state [announced via postgrant information from national office to epo] |
Ref country code: SI Free format text: LAPSE BECAUSE OF FAILURE TO SUBMIT A TRANSLATION OF THE DESCRIPTION OR TO PAY THE FEE WITHIN THE PRESCRIBED TIME-LIMIT Effective date: 20081203 Ref country code: PL Free format text: LAPSE BECAUSE OF FAILURE TO SUBMIT A TRANSLATION OF THE DESCRIPTION OR TO PAY THE FEE WITHIN THE PRESCRIBED TIME-LIMIT Effective date: 20081203 Ref country code: NL Free format text: LAPSE BECAUSE OF FAILURE TO SUBMIT A TRANSLATION OF THE DESCRIPTION OR TO PAY THE FEE WITHIN THE PRESCRIBED TIME-LIMIT Effective date: 20081203 Ref country code: FI Free format text: LAPSE BECAUSE OF FAILURE TO SUBMIT A TRANSLATION OF THE DESCRIPTION OR TO PAY THE FEE WITHIN THE PRESCRIBED TIME-LIMIT Effective date: 20081203 |
|
| PG25 | Lapsed in a contracting state [announced via postgrant information from national office to epo] |
Ref country code: EE Free format text: LAPSE BECAUSE OF FAILURE TO SUBMIT A TRANSLATION OF THE DESCRIPTION OR TO PAY THE FEE WITHIN THE PRESCRIBED TIME-LIMIT Effective date: 20081203 Ref country code: RO Free format text: LAPSE BECAUSE OF FAILURE TO SUBMIT A TRANSLATION OF THE DESCRIPTION OR TO PAY THE FEE WITHIN THE PRESCRIBED TIME-LIMIT Effective date: 20081203 Ref country code: BE Free format text: LAPSE BECAUSE OF FAILURE TO SUBMIT A TRANSLATION OF THE DESCRIPTION OR TO PAY THE FEE WITHIN THE PRESCRIBED TIME-LIMIT Effective date: 20081203 Ref country code: BG Free format text: LAPSE BECAUSE OF FAILURE TO SUBMIT A TRANSLATION OF THE DESCRIPTION OR TO PAY THE FEE WITHIN THE PRESCRIBED TIME-LIMIT Effective date: 20090303 |
|
| PG25 | Lapsed in a contracting state [announced via postgrant information from national office to epo] |
Ref country code: PT Free format text: LAPSE BECAUSE OF FAILURE TO SUBMIT A TRANSLATION OF THE DESCRIPTION OR TO PAY THE FEE WITHIN THE PRESCRIBED TIME-LIMIT Effective date: 20090504 Ref country code: SE Free format text: LAPSE BECAUSE OF FAILURE TO SUBMIT A TRANSLATION OF THE DESCRIPTION OR TO PAY THE FEE WITHIN THE PRESCRIBED TIME-LIMIT Effective date: 20090303 Ref country code: AT Free format text: LAPSE BECAUSE OF FAILURE TO SUBMIT A TRANSLATION OF THE DESCRIPTION OR TO PAY THE FEE WITHIN THE PRESCRIBED TIME-LIMIT Effective date: 20081203 Ref country code: CZ Free format text: LAPSE BECAUSE OF FAILURE TO SUBMIT A TRANSLATION OF THE DESCRIPTION OR TO PAY THE FEE WITHIN THE PRESCRIBED TIME-LIMIT Effective date: 20081203 |
|
| PG25 | Lapsed in a contracting state [announced via postgrant information from national office to epo] |
Ref country code: SK Free format text: LAPSE BECAUSE OF FAILURE TO SUBMIT A TRANSLATION OF THE DESCRIPTION OR TO PAY THE FEE WITHIN THE PRESCRIBED TIME-LIMIT Effective date: 20081203 |
|
| PLBE | No opposition filed within time limit |
Free format text: ORIGINAL CODE: 0009261 |
|
| STAA | Information on the status of an ep patent application or granted ep patent |
Free format text: STATUS: NO OPPOSITION FILED WITHIN TIME LIMIT |
|
| PG25 | Lapsed in a contracting state [announced via postgrant information from national office to epo] |
Ref country code: MC Free format text: LAPSE BECAUSE OF NON-PAYMENT OF DUE FEES Effective date: 20090331 Ref country code: DK Free format text: LAPSE BECAUSE OF FAILURE TO SUBMIT A TRANSLATION OF THE DESCRIPTION OR TO PAY THE FEE WITHIN THE PRESCRIBED TIME-LIMIT Effective date: 20081203 |
|
| REG | Reference to a national code |
Ref country code: CH Ref legal event code: PL |
|
| 26N | No opposition filed |
Effective date: 20090904 |
|
| GBPC | Gb: european patent ceased through non-payment of renewal fee |
Effective date: 20090324 |
|
| REG | Reference to a national code |
Ref country code: FR Ref legal event code: ST Effective date: 20091130 |
|
| PG25 | Lapsed in a contracting state [announced via postgrant information from national office to epo] |
Ref country code: IE Free format text: LAPSE BECAUSE OF NON-PAYMENT OF DUE FEES Effective date: 20090324 Ref country code: DE Free format text: LAPSE BECAUSE OF NON-PAYMENT OF DUE FEES Effective date: 20091001 Ref country code: LI Free format text: LAPSE BECAUSE OF NON-PAYMENT OF DUE FEES Effective date: 20090331 Ref country code: CH Free format text: LAPSE BECAUSE OF NON-PAYMENT OF DUE FEES Effective date: 20090331 |
|
| PG25 | Lapsed in a contracting state [announced via postgrant information from national office to epo] |
Ref country code: FR Free format text: LAPSE BECAUSE OF NON-PAYMENT OF DUE FEES Effective date: 20091123 Ref country code: GB Free format text: LAPSE BECAUSE OF NON-PAYMENT OF DUE FEES Effective date: 20090324 |
|
| PG25 | Lapsed in a contracting state [announced via postgrant information from national office to epo] |
Ref country code: GR Free format text: LAPSE BECAUSE OF FAILURE TO SUBMIT A TRANSLATION OF THE DESCRIPTION OR TO PAY THE FEE WITHIN THE PRESCRIBED TIME-LIMIT Effective date: 20090304 |
|
| PG25 | Lapsed in a contracting state [announced via postgrant information from national office to epo] |
Ref country code: IT Free format text: LAPSE BECAUSE OF FAILURE TO SUBMIT A TRANSLATION OF THE DESCRIPTION OR TO PAY THE FEE WITHIN THE PRESCRIBED TIME-LIMIT Effective date: 20081203 |
|
| PG25 | Lapsed in a contracting state [announced via postgrant information from national office to epo] |
Ref country code: LU Free format text: LAPSE BECAUSE OF NON-PAYMENT OF DUE FEES Effective date: 20090324 |
|
| PG25 | Lapsed in a contracting state [announced via postgrant information from national office to epo] |
Ref country code: HU Free format text: LAPSE BECAUSE OF FAILURE TO SUBMIT A TRANSLATION OF THE DESCRIPTION OR TO PAY THE FEE WITHIN THE PRESCRIBED TIME-LIMIT Effective date: 20090604 |
|
| PG25 | Lapsed in a contracting state [announced via postgrant information from national office to epo] |
Ref country code: TR Free format text: LAPSE BECAUSE OF FAILURE TO SUBMIT A TRANSLATION OF THE DESCRIPTION OR TO PAY THE FEE WITHIN THE PRESCRIBED TIME-LIMIT Effective date: 20081203 |
|
| PG25 | Lapsed in a contracting state [announced via postgrant information from national office to epo] |
Ref country code: CY Free format text: LAPSE BECAUSE OF FAILURE TO SUBMIT A TRANSLATION OF THE DESCRIPTION OR TO PAY THE FEE WITHIN THE PRESCRIBED TIME-LIMIT Effective date: 20081203 |
|
| REG | Reference to a national code |
Ref country code: HK Ref legal event code: WD Ref document number: 1087439 Country of ref document: HK |