EP1598713A2 - Method and apparatus for implementing statistical process control (spc) in a printing environment - Google Patents
Method and apparatus for implementing statistical process control (spc) in a printing environment Download PDFInfo
- Publication number
- EP1598713A2 EP1598713A2 EP05104201A EP05104201A EP1598713A2 EP 1598713 A2 EP1598713 A2 EP 1598713A2 EP 05104201 A EP05104201 A EP 05104201A EP 05104201 A EP05104201 A EP 05104201A EP 1598713 A2 EP1598713 A2 EP 1598713A2
- Authority
- EP
- European Patent Office
- Prior art keywords
- data
- errant
- print engine
- control
- set forth
- Prior art date
- Legal status (The legal status is an assumption and is not a legal conclusion. Google has not performed a legal analysis and makes no representation as to the accuracy of the status listed.)
- Granted
Links
Images


Classifications
-
- G—PHYSICS
- G05—CONTROLLING; REGULATING
- G05B—CONTROL OR REGULATING SYSTEMS IN GENERAL; FUNCTIONAL ELEMENTS OF SUCH SYSTEMS; MONITORING OR TESTING ARRANGEMENTS FOR SUCH SYSTEMS OR ELEMENTS
- G05B23/00—Testing or monitoring of control systems or parts thereof
- G05B23/02—Electric testing or monitoring
- G05B23/0205—Electric testing or monitoring by means of a monitoring system capable of detecting and responding to faults
- G05B23/0218—Electric testing or monitoring by means of a monitoring system capable of detecting and responding to faults characterised by the fault detection method dealing with either existing or incipient faults
- G05B23/0221—Preprocessing measurements, e.g. data collection rate adjustment; Standardization of measurements; Time series or signal analysis, e.g. frequency analysis or wavelets; Trustworthiness of measurements; Indexes therefor; Measurements using easily measured parameters to estimate parameters difficult to measure; Virtual sensor creation; De-noising; Sensor fusion; Unconventional preprocessing inherently present in specific fault detection methods like PCA-based methods
Definitions
- the present exemplary embodiment relates to a method and system for implementing statistical process control (SPC) in a printing environment. It finds particular application in conjunction with print engines, and will be described with particular reference thereto. However, it is to be appreciated that the present exemplary embodiment is also amenable to other like applications.
- SPC statistical process control
- process control sensors typically include process control sensors that accomplish a variety of tasks.
- process control sensors are typically positioned within a print engine of a printer to detect printed color.
- the printing system uses the data from the sensors to implement adjustments to the print engine to accommodate for errors or undesired variations in the printed color. This provides a useful feedback system that enhances the quality of the printing process.
- the process control sensor data may be in error and not representative of the true attribute being measured. This could occur for a variety of reasons, including an errant read. If the erroneous process control sensor reads are not identified as such, then actuator adjustments are made in response to the false reads. This unnecessarily induces color instability which leads to customer dissatisfaction.
- a periodic "spike” in a tone reproduction curve sensor may induce a color shift in the printing process.
- the "spike” may merely be the result of a short-lived system problem such as electrical noise, as opposed to actual problems with the printed color.
- This undesired color shift will likely produce prints that truly are in error.
- these erroneous prints will then result in further unnecessary color shifting as a result of the process control sensor reads. It would be desirable to have error corrections made in the system only where necessary, i.e., where actual undesired color variations exist -- and not as the result of an errant sensor read.
- SPC statistical process control
- the notion of real time SPC is extremely effective in determining process capability for a variety of industrial applications. It determines whether the process under analysis is stable and, if so, then determines the mean and variance of the process. If the process lacks stability, this is also typically detected. The lack of stability may indicate the presence of a problem, allowing for the commencement of a process by which a root cause may be pursued. If the process is stable, the estimates of the process mean and variation may still indicate a problem and also initiate a process by which the root cause can be pursued and eliminated, or if the estimates of the process mean and variation represent a system limitation, the system itself can be redesigned.
- Real time SPC can be a strong pillar of any system of diagnosis, debugging, and/or process improvement for a manufacturing process.
- SPC is capable of identifying the existence of a problem, it is limited in identifying root causes of problems. More intelligence in the system is necessary to do so. For example, in a printing environment, analyzing the frequency domain properties of a sensor signal may indicate an impending bearing failure. This type of intelligence would typically be used to supplement a conventional statistical process control (SPC) technique to allow for identification of such a root cause.
- SPC statistical process control
- U.S. Patent No. 5,053,815 (the '815 patent) relates to a reproduction apparatus having real time statistical process control.
- this patent teaches the concept of making comparisons to predetermine control limit reference values, as opposed to real time data streams indicative of whether a process is in stable control and/or, if it is in control, then determining the mean and degree of variation in the process.
- the '815 patent does not disclose a technique for addressing errant reads of sensors. Indeed, it appears that errant sensor reads would simply be used in the process disclosed to predict incipient problems before failure occurs.
- the method comprises receiving data read by process control sensors in the print engine, identifying subgroups within the data, determining ranges of each of the subgroups, calculating an average range based on the determined ranges, estimating a natural process variation based on the average range, calculating a control limit based on the natural process variation, comparing a selected subgroup range to the control limit (determining if the process is or is not in control), then identifying the data that exceeds the control limit as errant data, and filtering out the errant data from the feedback path.
- the process control sensors are operative to detect color.
- the controlling of the print engine comprises initiating color shifts.
- the identifying of subgroups comprises identifying subgroups of a fixed number of data points
- the estimating of the natural process variation comprises estimating a standard deviation.
- the calculating of the control limit comprises multiplying the standard deviation by a factor of approximately three.
- the filtering out of errant data comprises selectively activating a control unit on the feedback path to block the errant data from feedback to the print engine.
- the method further comprises storing the errant data.
- the method comprises performing a diagnostics process based on the errant data.
- the method further comprises performing a redesign of the print engine based on the errant data, and the estimated control limits that represent the mean and standard deviation of the process.
- a means for implementing the method of the present exemplary embodiment.
- the method further comprises performing a redesign of the print engine based on the errant data, system stability, and estimated mean and standard deviation behavior.
- An advantage of the present exemplary embodiment is that it provides a stopgap measure -- to identify a potential failure in the event that a failure is developed over time -- without unnecessarily alerting the printing process.
- the erroneous sensor read is flagged and ignored, thereby preventing the degradation of customer prints until design changes can be made or a service technician can be called.
- the frequency of occurrence can also be tracked to determine the extent of the problem.
- FIGURE 1 is a graph illustrating aspects of a method according to the present exemplary embodiment
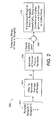
- FIGURE 2 is a flowchart illustrating a method according to the present exemplary embodiment
- FIGURE 3 is a block diagram of an implementation of the present exemplary embodiment.
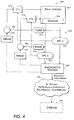
- FIGURE 4 is a block diagram of an implementation of the present exemplary embodiment.
- a plot 10 of an example sensor read sequence (termed M mid ETAC Read (FAC), which represents the sensor reads associated with the magenta mid patch fractional area coverage) vs. Time (one sample instant is ⁇ 10 seconds) is shown.
- the data plotted represents sensor reads from a process control sensor detecting color for the purpose of analysis; however, other types of sensors may be used in conjunction with the presently described embodiments.
- all data points 12 fall in a range of 0.4 to 0.6.
- Data point 14 is shown as having a magnitude of approximately 1, significantly higher than the neighboring data points.
- Data point 14 represents the "spike" referenced above and, in all likelihood, is the result of an errant sensor read.
- the sensor read may be representative of a problem in the system that is unrelated to color variation such as electrical noise or grounding problems.
- FIGURE 1 Also shown in FIGURE 1 are subgroups of the data points. These subgroups are used to calculate range values which, as will be described below, are useful in the data analysis. As shown, subgroup 16 relates to a first range, subgroup 18 relates to a second range, subgroup 20 relates to a third range, subgroup 22 relates to a fourth range, subgroup 24 relates to a fifth range, subgroup 26 relates to a sixth range, subgroup 28 relates to an seventh range, subgroup 30 relates to a eighth range and subgroup 32 relates to a ninth range of values.
- the flow chart represents an online SPC routine 200 that identifies the data outliers, such as data point 14 of FIGURE 1, and then operates in an open loop manner until there is confidence that the outliers, or errant data, are no longer occurring.
- the system operates in an open loop manner, then there is no feedback of the erroneous data point 14 to the system.
- errant data is essentially blocked from being fed back to the print engine that is the subject of the exemplary embodiments described herein. As a result, unnecessary color shifting based on the errant read is avoided.
- the data points in the form of an average range of a subgroup thereof, are collected serially in time.
- a subgroup size of 2 or 3 can be specified.
- a subgroup of size may comprise sets of reads of [X1, X2, X3], [X2, X3, X4], [X3, X4, X5], etc.
- the range of each subgroup will be computed (at 202).
- the range is preferably defined as a maximum sensor read minus the minimum sensor read in the subgroup.
- the computed ranges will then be first order low pass filtered or processed with a moving average filter to obtain an estimate of the average range R bar (at 204).
- the filtering effect of this averaging can also be viewed as using a forgetting factor, so that ranges far in the past do not influence the current outlier threshold very much - thereby providing the system with a threshold that is adaptive.
- the degree of filtering can be specified by a single value.
- the variation of the process can change over time (over the short term the process is in statistical control but over the long term there is drift).
- the moving average filter may process the sequence of ranges.
- the filtered range will then be scaled to estimate a 3-sigma upper and lower control limit (at 206).
- the natural process limits e.g., +-3 standard deviation units, are then computed from the filtered ranges.
- selected subgroup ranges are compared to the control limit (at 208).
- the sub-group ranges and the natural process limits are updated in real time. Notably, the process limits are not fixed, since they are an outcome of the process, not a prespecified input. If the selected subgroup range exceeds the process limits, then the subgroup range is assumed to be the result of a specific problem in the process and, as such, is classified as an outlier, or errant data.
- the outlier is noted, and in the exemplary application described here, it is ignored and not fed back to the feedback control system (at 210). Though it is ignored for feedback purposes, the existence of an outlier is recorded and communicated to the design or service community. Ignoring the read but counting the number of such occurrences is a tradeoff between responding to a non representative outlier or going open loop for an additional sample interval.
- This exemplary embodiment describes a unique adaptation of the standard IMR (Individual Moving Range) chart for the monitoring of process variation.
- the subject filter process requires the specification of a sub-group size (e.g., the subgroup size is set at a value of 3 for illustration purposes). It should be understood that setting the subgroup size to greater than 2 can catch successive erroneous reads. With larger subgroup sizes that are smaller than a 3 sigma upper control limit, the algorithm reads in a conservative manner. In this specific case where color stability is critical, it is better to have more false positives (e.g., simply go open loop for a short time) than to miss a real occurrence.
- any such implementation preferably includes the feature of detecting potentially erroneous sensor reads and ignoring (for the time being) such reads so as to not disrupt the normal processing of the system.
- a printing system 100 is illustrated. It should be appreciated that the system 100 is shown in representative fashion and, in implementation, includes a variety of other components that are well known and need not be shown or described herein.
- basic printing system 100 includes an image processing unit 200, or the like, and a print engine system 300.
- a page or data for a page 102 is input into the system and is ultimately processed by the image processing unit 200.
- the image is then fed to the print engine system 300 which will be described in more detail in connection with FIGURE 4.
- the end result of the printing process is a printed page 104.
- the printing system 100 is preferably a printer, however, it may take the form of other image rendering devices such as copiers, facsimiles, and the like. Of course, some of these embodiments may require that a scanner be implemented in the system.
- the image processing unit 200 and the print engine 300 include appropriate software and hardware to accommodate printing and the method and apparatus of the presently described embodiments. Again, these units may take a variety of forms that will be apparent to those of skill in the art upon reading and understanding of the present embodiment. For example, storage devices could be utilized within the system 100 to store the code to implement the presently preferred embodiments.
- a print engine system 300 includes a print engine 302 having sensors 304 disposed therein.
- the print engine comprises a feedback loop having paths 306 and 308 which extend from the sensors 304 back to the print engine 302.
- the feedback loop is used to feed back data read by color sensors to the print engine. Electrostatic fields within the print engine may be changed as a result. This, of course, will impact the subsequently printed pages.
- the path 306 includes a filter 310 and a control unit 312.
- the path 308 includes a filter 314 and a control unit 316.
- comparison units 318 and 320 are also included within the paths 306 and 308. It should be understood that the control unit, comparison unit and filter of each feedback path establish the control mechanism for that path and, in one form, may comprise a single unit in implementation.
- the system 300 is further provided with a statistical process control section 330 that includes statistical process control unit 332 and statistical process control unit 334. These units 332 and 334 are connected at their input side to the paths 306 and 308, respectively. The output of each of these units is connected to a diagnostics process center 340 whose output of a decision or information is input to an action element 342 for the design and/or service community. The actions taken may vary. For example, a redesign, performance evaluation, or the like may be implemented. The information or decision may be stored in a storage module 344 as a part of, prior to, or subsequent to the action taken. Of course, the information or decision may also be ignored by the system or the designer/operator.
- the output of the sensors 304 of the print engine 302 are processed by two types of filters, depending on the location of the signal as it is passed to the realtime feedback loop 306, 308 and/or the diagnostic decision making process 330.
- the filters 310, 314 may be simple low pass filters to remove random electrical noise that behaves as if drawn from a fixed probability distribution. Such noise does not result in errant reads, or "spikes," as contemplated herein.
- the input signals labeled as targets can be either fixed or can be outputs of other decision making modules. They are determined by a customer, for example, or set by the diagnostic process block 340.
- the sensor outputs are also directed to the SPC blocks 332, 334. It is within these blocks that statistical information is extracted and the process characterized in terms of stability, location, and dispersion, as described in connection with FIGURES 1 and 2. Notably, a comparison is made, as noted in FIGURE 2 (at 208) above, between a selected range and the control limits. If the selected range exceeds the process limits, this is communicated to the control units 312 and/or 316 (and/or other appropriate elements) which operate to "ignore" that data for feedback purposes (this communication being represented by the dashed lines between the SPC units and the control units).
- each SPC processing filter will depend on the specific application, particularly if there are known special kinds of process deviations that are feared.
- the outputs of these modules are then fed to the diagnostics block 340 for further processing.
- the diagnostics block may also feed data to other places as noted above.
- the components of the system 300 are preferably included on a multi-input/output processor (MIOP) board within the printer.
- MIOP multi-input/output processor
- the print engine will typically run the software that relates to printing and adjusting while the diagnostics process unit and the statistical process control units will provide the software functionality for the statistical process control features described herein.
Landscapes
- Physics & Mathematics (AREA)
- General Physics & Mathematics (AREA)
- Engineering & Computer Science (AREA)
- Automation & Control Theory (AREA)
- Testing And Monitoring For Control Systems (AREA)
- Control Or Security For Electrophotography (AREA)
- Control By Computers (AREA)
- Accessory Devices And Overall Control Thereof (AREA)
Abstract
Description
Claims (10)
- A method of statistical process control for a print engine to address errant sensor data, the method comprising:receiving data read by process control sensors in the print engine, the data also being transmitted on a feedback path for controlling the print engine;identifying subgroups within the data;determining ranges of each of the subgroups;calculating an average range based on the determined ranges;estimating a natural process variation based on the average range;calculating a control limit based on the natural process variation;comparing a selected subgroup range to the control limit;identifying the data that exceeds the control limit as errant data; and, filtering out the errant data from the feedback path.
- The method as set forth in claim 1 wherein the process control sensors detect color.
- The method as set forth in claim 1 wherein the controlling of the print engine comprises initiating color shifts.
- The method as set forth in claim 1 wherein the identifying of subgroups comprises identifying subgroups of a specified number of data points.
- The method as set forth in claim 1 wherein the estimating of the natural process variation comprises estimating a standard deviation.
- The method as set forth in claim 5 wherein calculating the control limit comprises multiplying the standard deviation by a factor of approximately three.
- The method as set forth in claim 1 wherein the filtering out of errant data comprises selectively activating a control unit on the feedback path to block the errant data from feedback to the print engine.
- The method as set forth in claim 1 further comprising storing the errant data.
- The method as set forth in claim 1 further comprising performing a diagnostics process based on the errant data.
- A system of statistical process control for a print engine, the system comprising:means for receiving data read by process control sensors in the print engine, the data also being transmitted on a feedback path for controlling the print engine;means for identifying subgroups within the data;means for determining ranges of each of the subgroups;means for calculating an average range based on the determined ranges;means for estimating a natural process variation based on the average range;means for calculating a control limit based on the natural process variation;means for comparing a selected subgroup range to the control limit; means for identifying the data that exceeds the control limit as errant data; and,means for filtering out the errant data from the feedback path.
Applications Claiming Priority (2)
| Application Number | Priority Date | Filing Date | Title |
|---|---|---|---|
| US10/847,933 US7545531B2 (en) | 2004-05-18 | 2004-05-18 | Method and apparatus for implementing statistical process control (SPC) in a printing environment |
| US847933 | 2004-05-18 |
Publications (3)
| Publication Number | Publication Date |
|---|---|
| EP1598713A2 true EP1598713A2 (en) | 2005-11-23 |
| EP1598713A3 EP1598713A3 (en) | 2006-01-25 |
| EP1598713B1 EP1598713B1 (en) | 2007-10-31 |
Family
ID=34975231
Family Applications (1)
| Application Number | Title | Priority Date | Filing Date |
|---|---|---|---|
| EP05104201A Ceased EP1598713B1 (en) | 2004-05-18 | 2005-05-18 | Method and apparatus for implementing statistical process control (spc) in a printing environment |
Country Status (4)
| Country | Link |
|---|---|
| US (1) | US7545531B2 (en) |
| EP (1) | EP1598713B1 (en) |
| JP (1) | JP4903396B2 (en) |
| DE (1) | DE602005003052T2 (en) |
Cited By (1)
| Publication number | Priority date | Publication date | Assignee | Title |
|---|---|---|---|---|
| CN110426999A (en) * | 2019-07-22 | 2019-11-08 | 上海华力集成电路制造有限公司 | Statistical process control method and its control system |
Families Citing this family (3)
| Publication number | Priority date | Publication date | Assignee | Title |
|---|---|---|---|---|
| CN101625564B (en) * | 2008-07-07 | 2012-05-09 | 上海新策科技有限公司 | Method and system for automatic control and automatic warning |
| US8548621B2 (en) | 2011-01-31 | 2013-10-01 | Xerox Corporation | Production system control model updating using closed loop design of experiments |
| WO2015100632A1 (en) * | 2013-12-31 | 2015-07-09 | 西门子公司 | Method for diagnosing operational parameter detection fault in gas turbine |
Family Cites Families (20)
| Publication number | Priority date | Publication date | Assignee | Title |
|---|---|---|---|---|
| CH374407A (en) * | 1957-07-30 | 1964-01-15 | Hrabak Jaroslav | Process and device for regulating a quantity that determines the quality of products using a static method |
| US4062061A (en) * | 1976-04-15 | 1977-12-06 | Xerox Corporation | Error log for electrostatographic machines |
| US4785329A (en) * | 1987-10-09 | 1988-11-15 | Xerox Corporation | Monitoring window expansion for diagnostics |
| JPH02118677A (en) * | 1988-10-28 | 1990-05-02 | Ricoh Co Ltd | Image quality control method |
| US5053815A (en) | 1990-04-09 | 1991-10-01 | Eastman Kodak Company | Reproduction apparatus having real time statistical process control |
| US5257206A (en) | 1991-04-08 | 1993-10-26 | Praxair Technology, Inc. | Statistical process control for air separation process |
| US5392226A (en) | 1993-06-17 | 1995-02-21 | Icom, Inc. | Computer-implemented method and apparatus for monitoring statistical process control data |
| US7085610B2 (en) * | 1996-03-28 | 2006-08-01 | Fisher-Rosemount Systems, Inc. | Root cause diagnostics |
| US6017143A (en) | 1996-03-28 | 2000-01-25 | Rosemount Inc. | Device in a process system for detecting events |
| US6445969B1 (en) | 1997-01-27 | 2002-09-03 | Circuit Image Systems | Statistical process control integration systems and methods for monitoring manufacturing processes |
| US5862054A (en) | 1997-02-20 | 1999-01-19 | Taiwan Semiconductor Manufacturing Company, Ltd. | Process monitoring system for real time statistical process control |
| US6496958B1 (en) | 1999-04-27 | 2002-12-17 | Infineon Technologies Richmond, Lp | Yield prediction and statistical process control using predicted defect related yield loss |
| AUPQ611200A0 (en) * | 2000-03-09 | 2000-03-30 | Commonwealth Scientific And Industrial Research Organisation | Determination of change in thickness of dampening solution on offset printing rollers |
| US6442499B1 (en) | 2000-03-29 | 2002-08-27 | Test Advantage, Inc. | Methods and apparatus for statistical process control of test |
| US6556884B1 (en) | 2000-06-16 | 2003-04-29 | Advanced Micro Devices, Inc. | Method and apparatus for interfacing a statistical process control system with a manufacturing process control framework |
| JP4440488B2 (en) * | 2001-03-30 | 2010-03-24 | 株式会社リコー | Shading correction data creation device, white shading correction device, image reading device, image forming device, shading correction data creation method, program, and storage medium |
| JP4065485B2 (en) * | 2001-11-09 | 2008-03-26 | キヤノン株式会社 | Method for correcting output value of color detection means of color image forming apparatus, and color image forming apparatus provided with the method |
| JP2004102239A (en) * | 2002-07-19 | 2004-04-02 | Seiko Epson Corp | Image forming apparatus and image forming method |
| CN100351725C (en) | 2002-08-01 | 2007-11-28 | 应用材料有限公司 | Method, system, and medium for handling misrepresentative metrology data within an advanced process control system |
| JP2004069947A (en) * | 2002-08-06 | 2004-03-04 | Canon Inc | Color image forming apparatus and method of controlling density-gradation characteristics thereof |
-
2004
- 2004-05-18 US US10/847,933 patent/US7545531B2/en not_active Expired - Fee Related
-
2005
- 2005-05-12 JP JP2005139298A patent/JP4903396B2/en not_active Expired - Fee Related
- 2005-05-18 DE DE602005003052T patent/DE602005003052T2/en not_active Expired - Lifetime
- 2005-05-18 EP EP05104201A patent/EP1598713B1/en not_active Ceased
Cited By (1)
| Publication number | Priority date | Publication date | Assignee | Title |
|---|---|---|---|---|
| CN110426999A (en) * | 2019-07-22 | 2019-11-08 | 上海华力集成电路制造有限公司 | Statistical process control method and its control system |
Also Published As
| Publication number | Publication date |
|---|---|
| DE602005003052D1 (en) | 2007-12-13 |
| JP2005331944A (en) | 2005-12-02 |
| EP1598713B1 (en) | 2007-10-31 |
| EP1598713A3 (en) | 2006-01-25 |
| JP4903396B2 (en) | 2012-03-28 |
| US7545531B2 (en) | 2009-06-09 |
| DE602005003052T2 (en) | 2008-02-14 |
| US20080170245A1 (en) | 2008-07-17 |
Similar Documents
| Publication | Publication Date | Title |
|---|---|---|
| DE10297009B4 (en) | Sensor fusion using self-evaluating process sensors | |
| EP1109395A2 (en) | Systems and methods for automated image quality based diagnostics and remediation of document processing systems | |
| EP0906593B1 (en) | Industrial process surveillance system | |
| US8451504B2 (en) | Banding defect detection in digital imaging systems | |
| US20030055607A1 (en) | Residual signal alert generation for condition monitoring using approximated SPRT distribution | |
| Ma et al. | Dynamic process monitoring using adaptive local outlier factor | |
| Goodall et al. | Concepts and techniques for railway condition monitoring | |
| US20100100521A1 (en) | Diagnostic system | |
| HUE033477T2 (en) | System state monitoring using recurrent local learning machine | |
| US6292738B1 (en) | Method for adaptive detection of engine misfire | |
| US7545531B2 (en) | Method and apparatus for implementing statistical process control (SPC) in a printing environment | |
| Cocquempot et al. | Switching time estimation and fault detection for hybrid systems using structured parity residuals | |
| US5850582A (en) | Administrative device for image forming apparatus | |
| US20240272592A1 (en) | Substrate processing apparatus, data processing method, and data processing program | |
| KR20220122781A (en) | Abnormality detection system, abnormality detection method, and abnormality detection program stored in recording medium | |
| Classens et al. | Joint estimation of additive and parametric faults: A model-based fault diagnosis approach towards predictive maintenance | |
| Mina et al. | Fault detection using dynamic principal component analysis by average estimation | |
| O'reilly | Local sensor fault detection using Bayesian decision theory | |
| CN114637793B (en) | Equipment fault frequent region positioning method based on big data analysis | |
| JP2001022441A (en) | Plant monitoring equipment | |
| US20090049340A1 (en) | System analysis device and computer readable storage medium storing system analysis program | |
| Xu et al. | On-line sensor calibration monitoring and fault detection for chemical processes | |
| Kabbaj et al. | Wavelet based residual evaluation for fault detection and isolation | |
| US6856881B2 (en) | Adaptation method for controlling shifting elements | |
| KR20230060407A (en) | System of detecting software abnormal operation using Comparative Neural Network Learning and method thereof |
Legal Events
| Date | Code | Title | Description |
|---|---|---|---|
| PUAI | Public reference made under article 153(3) epc to a published international application that has entered the european phase |
Free format text: ORIGINAL CODE: 0009012 |
|
| AK | Designated contracting states |
Kind code of ref document: A2 Designated state(s): AT BE BG CH CY CZ DE DK EE ES FI FR GB GR HU IE IS IT LI LT LU MC NL PL PT RO SE SI SK TR |
|
| AX | Request for extension of the european patent |
Extension state: AL BA HR LV MK YU |
|
| PUAL | Search report despatched |
Free format text: ORIGINAL CODE: 0009013 |
|
| AK | Designated contracting states |
Kind code of ref document: A3 Designated state(s): AT BE BG CH CY CZ DE DK EE ES FI FR GB GR HU IE IS IT LI LT LU MC NL PL PT RO SE SI SK TR |
|
| AX | Request for extension of the european patent |
Extension state: AL BA HR LV MK YU |
|
| RIC1 | Information provided on ipc code assigned before grant |
Ipc: G05B 23/02 19680901AFI20051207BHEP |
|
| 17P | Request for examination filed |
Effective date: 20060725 |
|
| AKX | Designation fees paid |
Designated state(s): DE FR GB |
|
| 17Q | First examination report despatched |
Effective date: 20061025 |
|
| GRAP | Despatch of communication of intention to grant a patent |
Free format text: ORIGINAL CODE: EPIDOSNIGR1 |
|
| GRAS | Grant fee paid |
Free format text: ORIGINAL CODE: EPIDOSNIGR3 |
|
| GRAA | (expected) grant |
Free format text: ORIGINAL CODE: 0009210 |
|
| AK | Designated contracting states |
Kind code of ref document: B1 Designated state(s): DE FR GB |
|
| REG | Reference to a national code |
Ref country code: GB Ref legal event code: FG4D |
|
| REF | Corresponds to: |
Ref document number: 602005003052 Country of ref document: DE Date of ref document: 20071213 Kind code of ref document: P |
|
| ET | Fr: translation filed | ||
| PLBE | No opposition filed within time limit |
Free format text: ORIGINAL CODE: 0009261 |
|
| STAA | Information on the status of an ep patent application or granted ep patent |
Free format text: STATUS: NO OPPOSITION FILED WITHIN TIME LIMIT |
|
| 26N | No opposition filed |
Effective date: 20080801 |
|
| REG | Reference to a national code |
Ref country code: FR Ref legal event code: PLFP Year of fee payment: 12 |
|
| REG | Reference to a national code |
Ref country code: FR Ref legal event code: PLFP Year of fee payment: 13 |
|
| REG | Reference to a national code |
Ref country code: FR Ref legal event code: PLFP Year of fee payment: 14 |
|
| PGFP | Annual fee paid to national office [announced via postgrant information from national office to epo] |
Ref country code: DE Payment date: 20180419 Year of fee payment: 14 |
|
| PGFP | Annual fee paid to national office [announced via postgrant information from national office to epo] |
Ref country code: FR Payment date: 20180423 Year of fee payment: 14 |
|
| PGFP | Annual fee paid to national office [announced via postgrant information from national office to epo] |
Ref country code: GB Payment date: 20180419 Year of fee payment: 14 |
|
| REG | Reference to a national code |
Ref country code: DE Ref legal event code: R119 Ref document number: 602005003052 Country of ref document: DE |
|
| GBPC | Gb: european patent ceased through non-payment of renewal fee |
Effective date: 20190518 |
|
| PG25 | Lapsed in a contracting state [announced via postgrant information from national office to epo] |
Ref country code: GB Free format text: LAPSE BECAUSE OF NON-PAYMENT OF DUE FEES Effective date: 20190518 Ref country code: DE Free format text: LAPSE BECAUSE OF NON-PAYMENT OF DUE FEES Effective date: 20191203 |
|
| PG25 | Lapsed in a contracting state [announced via postgrant information from national office to epo] |
Ref country code: FR Free format text: LAPSE BECAUSE OF NON-PAYMENT OF DUE FEES Effective date: 20190531 |