FIELD OF THE INVENTION
-
The present invention deals with a method for in vitro quantitative
determination of cellular uptake of exogenous substances. Said method can be
applied substantially to any type of in vitro sample, for example, cells, tissues and
organs. Main application fields of the invention are: a) screening and development
process stages of pharmaceutical lead compounds, contrast agents for imaging
techniques, radio-sensitizers for photodynamic and neutron capture therapy (bio-availability,
effectiveness, resistance and toxicity studies included); b) therapy
follow-up; c) chemical toxicology; d) development process stages of pesticides.
ABBREVIATIONS USED IN THE DESCRIPTION
-
For sake of clarity and conciseness, a list of the abbreviations/acronyms most
frequently used inside the following description is herewith enclosed.
- MAS-NMR
- Magic-Angle-Spinning Nuclear Magnetic Resonance
- CP-MAS
- Cross Polarization Magic-Angle-Spinning
- HR-MAS
- High Resolution Magic-Angle-Spinning
- MR
- Magnetic Resonance
- EXO/s
- Exogenous substance/substances
- ENDO/s
- Endogenous naturally occurring substance/substances
- CC/s
- Cellular Compartment/Compartments
- SA/s
- Shift Agent/Agents
- CA/s
- Contrast Agent/Agents
- LIS
- Lanthanide Induced Shift
- LISEXO
- Lanthanide Induced Shift of Exogenous substance (signal/signals)
- LISENDO
- Lanthanide Induced Shift of Endogenous substance
(signal/signals)
- [ ]
- molar concentration
- [a]
- molar concentration of substance a
- ρEXO
- [SA]/[EXO], i.e. it represents the ratio: SA concentration to EXO
concentration
- ρENDO
- [SA]/[ENDO], i.e. it represents the ratio: SA concentration to
ENDO concentration
- CC≠SA
- Cellular compartment in which the SA is not present
- CCSA
- Cellular compartment in which the SA is present
- EXOo
- EXO substance present in extra-cellular compartment
- EXOi
- EXO substance present in intra-cellular compartment
- SEM
- Scanning Electronic Microscope
- PDT
- Photodynamic Therapy
- NCT
- Neutron Capture Therapy
- MECM
- Multi-photon Excitation Confocal Microscopy
- ESR
- Electron Spin Resonance
- HRBC
- Human Red Blood Cells
Bibliographic references included in the specification as numbers in brackets are
detailed later on in the paragraph titled "References".
BACKGROUND OF THE INVENTION
-
In principle, cellular-uptake quantitative determination can give relevant
information about, for example, bio-availability, effectiveness and toxicity of
EXOs. That may result important for drugs and in general for all substances which
must not have biological activity, but, at the same time, must specifically
accumulate inside human cells (examples are radio-sensitizers for PDT and NCT,
as well as CAs for diagnostic use). In the pharmaceutical field, in particular,
cellular uptake represents one of the milestones on which the whole drug
development process is based, starting from the recognition of the most promising
lead compounds, up to the final formulation of the drug (i.e. the formulation ready
for administration to human and/or animal beings). In the diagnostic field, cellular-uptake
measurement is important because it is closely related to tissue and/or organ
specificity of the CAs used. It is known that tissue/organ specificity is usually
connected both with effectiveness and toxicity of these substances. That means that
the capability of obtaining reliable cellular-uptake measurements represents the
starting point for the development of new CAs, which are able, for example, to
induce high contrast imaging at lower dosages. Analogous considerations can be
done for radio-sensitizers to be used in PDT and NCT. In toxicology, measuring
EXOs cellular uptake is important, because it is directly related to the toxicity of
the EXOs. Areas of competence for cellular uptake are, therefore, diagnosis and
care of diseases (therapy follow-up included), and toxicology. Sometimes it is
possible to confuse cellular uptake with organ uptake. Although these two topics
are often closely related, they regard two different kind of uptake. Cellular uptake
means accumulation of a given substance in the intra-cellular compartment, while
organ uptake means accumulation in the whole organ. This latter feature does not
necessarily mean cellular uptake because a given substance may accumulate into
the organ, but in its extra-cellular compartments, for example, as a consequence of
bonds or interactions with the molecules on the external layer of the cellular
membrane.
-
The technical problem related to the measurement of EXOs cellular uptake
substantially regards the following features:
- measurements should involve a parameter which is directly linked to
cellular uptake, i.e. the EXO compartmental concentration;
- measurements should not require sample manipulations, to avoid changes of
the concentrations of the species at equilibrium, as well as modifications of the
functionality and/or the integrity of the cellular membrane (the fulfilment of this
condition will make greater the reliability of the results and will also allow
performing dynamic measurements, such as pharmaco-kinetic determinations);
- measurements should be applicable to the widest possible range of EXOs
and samples.
-
Today, the methods utilized to determine EXOs cellular uptake only partially
fulfil these requirements. Consequently, the need for a method of general
applicability for EXOs cellular-uptake measurement is still waiting for a solution,
in spite of the relevance of this problem for pharmaceutical research and for
toxicology studies.
-
The commonly used analytical methods can be substantially divided into four
groups:
- Group A - In principle, the methods belonging to this group can be used to
measure cellular uptake of all types of EXOs inside any type of cells or tissues.
They are based on chemical and chemical-physical techniques which require
sample pre-treatment, as a necessary step for the analysis. Said treatment is
mandatory because the analytical techniques employed are only able to measure the
total content of a substance, without distinguishing how it is shared out in the
various CCs. The nature of the above mentioned pre-treatment depends on the
employed analytical technique and on the type of sample. Anyway, whichever the
treatment is, it always produces modifications on the cellular system, with
consequent changes in the concentration of the species present in the cellular
compartments at equilibrium, and/or changes of the mechanisms which govern the
transport of substances across the cellular membrane. These effects may make the
sample under analysis not representative of reality, with the consequence that the
results of the analysis can be wrong or misleading. For example, when cells are
cultured in liquid phase, the pre-treatment consists in the separation of said cells
from the extra-cellular fluid; said method is performed by employing several
washing steps and subsequent centrifugation. This treatment can change the
concentrations at equilibrium and breaks part of the cells, a circumstance which
means perfusion in the extra-cellular compartment of part of the intra-cellular fluid.
As a result, part of the intra-cellular content is measured as extra-cellular content.
On the other hand, when cells are cultured on semisolid or solid matrix, the
situation can result even more critical because a vigorous treatment can be
necessary in order to free the cells from the matrix. Under these conditions,
changes of the concentrations of the species at equilibrium and modifications of the
functionality and integrity of the cellular membrane, during sample preparation, are
almost inevitable. When the study regards agglomerates of cells and strips of
tissues, treatments can be even more invasive, because it is necessary to destroy the
tissutal matrix in order to obtain isolated cells.
- Group B - In the case of some particular EXOs, specific methods can be
employed to measure cellular uptake, for example:
- if the EXO is a paramagnetic metal complex, a method based on ESR
spectroscopy can be used (1);
- if the EXO is a gadolinium complex, measurements can be performed by
observing the contrast enhancement in MR imaging (2);
- if the EXO is a manganese compound, the measure can be done by
observing the line broadening of phosphorus signal in ATP 31P-NMR spectra (3);
- if the EXO is a substance containing atoms which are different from those
naturally occurring inside the cells, i.e. atoms which are different from hydrogen,
carbon, nitrogen, sodium, etc., SEM combined with micro-analysis can be utilized
(unfortunately the main EXOs are organic molecules, therefore they cannot be
measured by this technique);
- if the EXO has a fluorescent spectrum, well distinguishable from the ones
produced by the ENDOs inside the sample, MECM (4,5) can be used (anyway,
ENDOs usually contain a lot of organic chromophores, therefore the possibility to
use MECM is limited to a little number of cases).
All these methods of group B have the advantage not to require cell
treatment, but have the disadvantage that the measured parameters are only
indirectly linked to cellular uptake. This means that the reliability of the results
strongly depends on the type of model that links cellular uptake to the measured
parameters. Moreover, these methods are usable only with a few of specific EXOs. - Group C - For metal ions such as Na+, K+, Li+, etc. (6,7,8) and for some
endogenous metabolites (9), SAs combined to NMR spectra have been employed
to measure the concentration ratio between the intra- and the extra-cellular content
of said substances. This method has the double advantage that it does not need
sample treatments and measuring compartmental concentrations, i.e. a parameter
directly linked to the cellular uptake. Nevertheless, it can only measure the
concentration ratio between intra- and extra-cellular EXO content, but it cannot
measure the absolute EXO content in the various CC.
- Group D - Shift of water signal induced by paramagnetic complexes have
been observed with MAS-NMR, allowing the determination of cellular uptake of
said paramagnetic complexes (10,11). Unfortunately, this procedure is usable only
with paramagnetic complexes.
-
-
Summarizing:
- the reliability of the methods currently used is insufficient in most of the
cases;
- it does not exist a method of general applicability; moreover some
techniques, which could avoid sample treatment, can only be used in very
particular cases;
- it is difficult, if not impossible, to standardize the present methodologies,
because they are too much dependent on the nature of the sample, the nature of the
substance under investigation, and the modality of sample handling;
- current in vitro tests imply high costs and long times, mainly because of the
huge work necessary for the tuning of the method and for sample preparation.
-
The previously disclosed points raise serious questions about reliability and
usefulness of in vitro data; however the state-of-the-art concerning in vivo cellular-uptake
tests, which in principle are a possible alternative to the ones in vitro, is not
better. In fact, although in vivo data are currently considered the "gold standard",
their reliability is not doubt-free; in particular in vivo experiments have shown
relevant drawbacks due to long experimental times, high costs (mainly due to
animal stabling and to the cost of the staff engaged in handling animals and
samples), ethical reasons.
-
Accordingly, reliable, fast, cheap and easy-to-do in vitro cellular-uptake tests
are still a main issue for pharmaceutical research and, more in general, for research
concerning bio-activity of substances which can accumulate inside cells.
-
The method, object of the present invention, seeks to overcome the
drawbacks of the above mentioned methods, by fulfilling all the requirements for a
general method for every type of EXOs cellular-uptake measurement.
-
In particular, the present invention shows the following advantages in
comparison with the state-of-the-art:
- it allows non-invasive measurements. In the present description the term
"non-invasive" is used with the meaning that the in vitro sample is not treated at
all, or that the needed manipulation is so light as not to produce modifications of
the concentration of the chemical species at equilibrium, nor modifications of the
processes which govern the cellular up-take. In such a way, the sample maintains
all its biological functionality intact;
- it allows to measure a parameter directly linked to the absolute
concentration of the EXO in the different CCs. This aspect, together with the
previous one, guarantees high reliability and reproducibility of the measured data
and the possibility to replace a large number of the in vivo tests. For example, this
feature also allows determining whether the condition of full "NMR visibility" is
matched or no;
- the sensitivity of the measurements is the one typical for NMR
spectroscopy; actually, micromolar concentrations are needed for medium strength
magnetic fields, as well as sub-micromolar concentrations, when using high
magnetic fields and cryogenic technology for probeheads;
- it allows the measurement of cellular uptake of a wide series of substances,
with respect to a wide kind of in vitro samples, either in liquid or semisolid media,
included strips of tissues, strips of organs and whole organs; this makes the method
of general applicability;
- it consents to study the kinetics of cellular up-take, such as pharmaco-kinetic
studies which are very difficult and onerous to carry out;
- it guarantees a high level of standardisation because it is based on a single
technique, the MAS-NMR spectroscopy in combination with lanthanide SA, and it
does not require complex sample treatments;
- it makes it possible to obtain easy and fast measurements, because NMR
spectra can be acquired in few minutes;
- it makes it possible to utilize a substantial part of the experimental
conditions, tuned for the cellular uptake of a substance, also for cellular up-take
determination of other substances. In fact, the experimental conditions mainly
depend on the type of samples, less on the type of molecules tested.
- A strong reduction of costs and time for experimentations is achieved.
SUMMARY OF THE INVENTION
-
The present invention substantially deals with a method for in vitro
quantitative determination of cellular uptake of EXOs.
-
Said method is based on the application on cellular in vitro samples of MAS-NMR
spectroscopy, in combination with the use of suitable SAs, preferably
selected from substances which contain metal ions of the lanthanide group.
-
The method of the present invention substantially comprises the following
steps:
- 1) selection of the shift agent (SA) and nucleus combination to be
employed for the measurement of cellular uptake of the exogenous
substance (EXO) under investigation;
- 2) determination of the cellular compartment/s (CC/s) in which said
exogenous substance (EXO) distributes;
- 3) measurement of said exogenous substance (EXO) compartmental
concentration, i.e. of said EXO cellular uptake.
-
EXPLAINATION OF THE FIGURES
-
- Figure 1
- is the example of a markerENDO signal showing a single peak in
absence of a SA. Trace a: spectrum in absence of SA; traces b - g:
spectra in presence of SA.
- Figure 2
- is the example of a markerENDO signal showing more than one peak in
absence of a SA. Trace a: spectrum in absence of SA; trace b - g:
spectra in presence of SA.
- Figure 3
- is the example of a marker EXO signal showing a single peak in absence
of a SA. Trace a: spectrum in absence of SA; trace b - f spectra in
presence of SA shared out in one CC only.
- Figure 4
- is the example of a marker EXO signal showing more than one peak, in
absence of a SA. Trace a: spectrum in absence of SA; trace b - f
spectra in presence of SA shared out in one CC only.
- Figure 5
- is the example of a marker EXO signal showing a single peak, in absence
of a SA. Trace a: spectrum in absence of SA; trace b -h: spectra in
presence of a SA shared out between intra- and extra-cellular
compartments.
- Figure 6
- is the example of a marker EXO signal showing more than one peak, in
absence of a SA. Trace a: spectrum in absence of SA; trace b - h:
spectra in presence of SA shared out between intra- and extra-cellular
compartments.
- Figure 7
- is the 23Na MAS-NMR spectra of a HRBC sample containing different
amounts of Dy-BOPTA. Trace a: the spectrum of HRBC alone; traces
b - d: the spectra of HRBC after progressive additions of Dy-BOPTA.
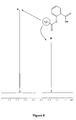
- Figure 8
- is the 1H NMR spectra of aspirin in D2O.
- Figure 9
- is the graph of LIS ASPIRIN vs. ρASPIRIN= [Dy-BOPTA]/[ASPIRIN]
- Figure 10
- is 1H MAS-NMR spectra of aspirin in HRBC suspension. Trace a:
spectrum of HRBC; trace b: same sample of trace a but after addition
of aspirin (100 µl, 1M stock solution); trace c: same sample of trace b
but after addition of Dy-BOPTA (80 µl, 0.1M stock solution).
DETAILED DESCRIPTION OF THE INVENTION
-
As already mentioned in the foregoing, the method of the present invention
comprises the use of MAS-NMR spectroscopy in combination with suitable SAs.
By means of MAS technique, the NMR spectra result unaffected by shifts due to
chemical shift anisotropy (CSA), dipole-dipole interactions and anisotropic
component of bulk magnetic susceptibility (BMS) (12 - 15). Moreover, the
lineshape in biological sample results improved, allowing a better differentiation
between intra- and extra-cellular signals (16). That means that LIS induced by SA
on the EXO signals, can be well detected and can occur, only as a consequence of
direct interactions between SA and EXO, i.e. SA and EXO must stay in the same
CC. Consequently, after the addition of the SA in the in vitro sample, two main
behaviours can take place, with respect the condition in absence of the SA: the
EXO NMR signals remain unchanged or they undergo to LIS. The EXO,
corresponding to the unshifted signals, stays in CCs different from that/those
occupied by the SA while, on the contrary, EXO corresponding to shifted signals,
occupy the same CCs of SA. That allows a direct measurement of the cellular
uptake of the EXO. In particular, whether unshifted and shifted EXO signals exist
in the same sample, the ratio between the areas of these signals directly gives the
distribution ratio of the EXO between the CCs.
-
The present invention comprises the following steps:
- 1) selection of the shift agent (SA) and nucleus combination to be
employed for the measurement of cellular uptake of the exogenous
substance (EXO) under investigation;
- 2) determination of the cellular compartment/s (CC/s) in which said
exogenous substance (EXO) distributes;
- 3) measurement of said exogenous substance (EXO) compartmental
concentration, i.e. of said EXO cellular uptake.
-
-
Said selection of step 1) preferably comprises:
- a) recognising a set of possible candidates for said SA and nucleus
combination, on the basis of the LIS produced on at least one signal
belonging to said EXO;
- b) recognising a set of possible candidates for said SA, on the basis of
the LIS produced on at least one signal belonging to an endogenous
substance (ENDO);
- c) recognising a set of possible candidates for said SA, on the basis of
the CC/s in which they distribute;
- d) selecting said SA and nucleus combination, on the basis of the
information gathered from points a), b) and c).
-
Regarding point a)
-
All substances containing a paramagnetic nucleus are able, in principle, to act
as SA, but, in order not to modify the biological processes inside the in vitro
sample, lanthanide complexes are most preferred for the scope of the present
invention. Among them, preferred, non-limiting, examples of lanthanide complexes
usable as SAs are selected from chelate complexes comprising:
- a ligand selected from: EDTA (ethylenediaminetetracetic acid); PCTA
(3,6,9,15-tetraazabicyclo-[9.3.1]-pentadeca-1(15)11,13-triene-3,6,9-tris(methane
phosphonic) acid); BOPTA ((4RS)-[4-carboxy-5,8,11-tris (carboxy methyl)-1-phenyl-2-oxa-5,8,11-triazatridecan-13-oicacid])
and/or derivatives thereof; DTPA
(diethylenetriamine pentaacetic acid) and/or derivatives thereof; DOTA (1,4,7,10-tetraazocyclo-dodecane-N,N',N",N"
"-tetraacetic acid) and/or derivatives thereof;
DO3A (1,4,7,10-tetra azacyclododecane-1,4,7-triacetic acid) and/or derivatives
thereof; DOTP (1,4,7,10-tetraazacyclododecane-1,4,7,10-tetrakis (methane
phosphonic) acid and/or derivatives thereof; ([3β(R),5β,12α]-3-[[4-[bis[2-bis(carboxymethyl)amino]-ethyl]amino]-4-carboxy-1-oxobutyl]amino]-12-hydroxycholan-24-oic
acid); and
- a metal ion of the lanthanide group selected from: Ce 3+; Pr3+; Nd3+; Pm3+;
Sm 3+; Eu 3+; Tb 3+; Dy3+; Ho3+; Er 3+; Tm3+; Yb3+.
-
The preferred nucleus to be used (i.e. the one to be observed by the employed
MAS-NMR technique), should allow an easy detection of the EXO signals.
Usually, proton cannot be the better choice for this scope, because 1H-NMR
spectra of biological samples most frequently show strong overcrowding and
overlapping of peaks, due to the various interfering ENDOs naturally occurring in
the sample. This consideration is valid also for 31P NMR spectra. In this respect,
carbon-13 or nitrogen-15 spectra are preferable, in those cases in which suitable
isotopically enriched substances are available. More preferable are those nuclei
which are not present in the naturally occurring ENDOs. In particular, fluorine-19,
deuterium, boron-11 and sodium-23 are nuclei which can supply very good spectra.
-
To recognise the most suitable set of SAs and nuclei usable for quantitatively
measuring cellular uptake of a given EXO, said EXO is dissolved in D2O and
LISEXO signals are measured, by employing different combinations of different SAs
with different nuclei and by varying the ratio ρEXO =[SA]/[EXO].
-
SAs and nuclei combinations inducing the largest LISEXO signals are the ones
potentially suitable for use with the EXO under investigation. The largest LISEXO
signal/s is/are preferred and from now on it/they will be defined as markerEXO
signal/s.
Regarding point b).
-
The method of the present invention needs knowing, with high precision, the
CC concentration of the SA (i.e., [SA]CC) which implies to know, at priori or by
experimental measures, the CCs where the SA share.
-
These data are obtained by measuring the LIS produced by the SA on, at
least, one signal belonging to an suitable endogenous substance (ENDO).
-
In order to measure [SA]CC with high precision, it is necessary to chose,
among the possible combinations SA-nucleus-ENDO, those producing the largest
LISENDO signals. For this aim, it is necessary to employ ENDOs possessing
functional groups which are able to interact with said SA. For example, if the SA is
a lanthanide complex, as previously defined, suitable ENDOs could be water (i.e.
observation of proton spectra) or the alkaline metal ions, such as Na+ (i.e.
observation of 23Na spectrum). In fact these two type of ENDOs supply very large
LISs when lanthanide complexes are employed.
-
To recognise preferred ENDO and nucleus, each potential candidate for
ENDO is dissolved in D2O and LISENDO signals are measured by employing the
best SAs resulting from previous point a), all the possible nuclei (compatible with
the nature of ENDO) and by varying the ratio ρENDO = [SA]/[ENDO]. In such a
way a graph LISENDO signal vs. ρENDO = [SA]/[ENDO] is built.
-
SAs-nuclei-ENDOs combinations inducing the largest LISENDO signals are the
ones potentially suitable for the next steps. The largest LISENDO signal will be
defined as marker ENDO signal.
-
It is worthwhile to mention that each SA-ENDO combination can produce the
best result by using a nucleus different from those optimal for other SAs-ENDOs
combinations and different from those employed for SAs-EXO combinations.
Regarding point c).
-
Point c consents the measurement of [SA]CC, upon the identification of the
CCs where the candidates SAs, deriving from the previous steps, distribute. To
obtain this data, for all the preferred SAs-nucleus-ENDOs combinations, the MAS-NMR
spectra of the in vitro sample are acquired, both in absence and in presence
of the selected SA. SA concentration, [SA], is gradually increased up to the
obtainment of a well visible and measurable LIS markerENDO signal. The MAS-NMR
spectra, acquired by this procedure, can show different behaviours, as
reported in enclosed Figures 1 and 2 and hereinafter discussed.
-
Figure 1 - traces a-g . In trace a a markerENDO signal is shown, in absence of
the SA. In this case only one signal exists, in correspondence of the different CCs.
Accordingly, in this case all the markerENDO signals in the different CCs are
isochronous (or the ENDO is present in only one CC). After the addition of a
suitable amount of the SA, different situations can arise:
- the markerENDO signal splits in two signals: the first one keeps the same
frequency of the original signal (i.e. the one in absence of the SA), while
the other signal shifts (trace b or c). In this case, all the SA stays in the CC
corresponding to the shifted markerENDO signal, i.e. the SA specifically
accumulates in one single CC (or in different CCs in which all the
markerENDO signals are isochronous) ;
- the markerENDO signal splits in more than two signals: one signal remains
unshifted with respect to the original position (i.e. the one in absence of the
SA), while all the other signals shift (trace d or e). In this case all the SA
stays in the CCs correspondent to the shifted marker ENDO signals. If the
signal labelled with (*) does not exist, the SA is distributed in all the
possible CCs (in this case the markerENDO signals are non-isochronous with
each other);
- the marker ENDO signal does not split but shifts with respect to the original
signal (i.e. the one in absence of the SA) (traces f or g). In this case the SA
is distributed in all the possible CCs and the corresponding markerENDO
signals are all isochronous.
-
Figure 2 - traces a - g . In trace a it is disclosed a marker ENDO signal that, in
absence of the SA, shows two (in general, many) signals (in this case represented
by signal A and signal B) in correspondence of the various CCs. Following the
addition of the SA, different situations can take place as described in the following:
- one markerENDO signal shifts with respect to the original chemical shift:
- signal B shifts and signal A remains unchanged (traces b or c), or vice-versa
(traces d or e). In these cases, the SA is completely distributed in the
CC/s corresponding to the markerENDO signals showing a shift (marker ENDO
signals in the different CCs are isochronous);
- - each component of the marker ENDO signal splits in two peaks: one shifted
and one unchanged with respect to the original one (traces f or g). The SA
is completely distributed in the CCs corresponding to the markerENDO
signals undergoing shift;
- - if all markerENDO signals shift, the SA is distributed among all the CCs.
-
In all the situations disclosed in Figures 1 and 2, the CCs can be easily
identified by the characteristic features of the corresponding markerENDO signals. In
particular, it is possible to utilize the areas under the signal, which are proportional
to the amount of ENDO in the different CCs (if these data are known), or the signal
linewidths which are usually different for different CCs. Once the CCs are
identified, the CCs where the SA is present results univocally assigned.
Regarding point d).
-
In principle, the SA suitable for the measure of EXO cellular uptake should
be the one which is able to induce the largest LISEXO signal for, at least, one of the
EXO signals (preferably the markerEXO signal), which is able to distribute in only
one CC and whose [SA]CC can be measured with high precision. Combining the
results obtained from the foregoing points a) to c) it is possible to select the
preferred SA and nucleus combination. However, often said SA and nucleus
combination is selected just through a compromise among the different indications
resulting from points a) to c).
-
Said determination of step 2) comprises:
- e) acquiring the MAS-NMR spectrum of the in vitro sample, containing
the EXO under investigation, in absence of SA and recognising the
markerEXO signal/s;
- f) re-acquiring the same spectrum after addition of an amount of the
preferred SA enough to induce a significant LIS of marker EXO
signal/s;
- g) comparing the markerEXO signal/s of points e) and f), wherein, since
the CC/s where the SA distributes is/are known, the CC/s where the
EXO is present result assigned.
-
-
The MAS-NMR spectrum can show different situations, as disclosed in
enclosed Figures 3-6, which are hereinafter disclosed.
-
In Figures 3 and 4, it is described the use of a preferred SA which stays in
only one type of CC.
-
Figure 3 - traces a - f. Trace a shows a markerEXO signal (in this case it is a
single, one component signal) in absence of the SA.
-
Different situations are possible, following the addition of the SA:
- the marker EXO signal remains unchanged (trace b). In this case the EXO
stays completely in a CC different from the one in which the SA is present,
i.e. all the EXO is EXOCC≠SA;
- the marker EXO signal remains a single peak but shifts with respect to the
original position (traces c or d). In this case the EXO stays in the same CC
in which the SA is present, i.e. all the EXO is EXOCCSA;
- the marker EXO signal splits in, at least, two components (traces e or f). The
EXO corresponding to the shifted signal is EXOCCSA while the EXO
corresponding to the unshifted signal is EXOCC≠SA. The ratio between the
areas of the two signals is proportional to the ratio between [EXOCCSA] and
[EXOCC≠SA].
-
It is possible that the cases shown in trace e or f appear as the case reported in
trace b. This can happen when the LIS of markerEXO signal is too small, i.e.
insufficient for separate the EXOCCSA signal from the one due to the EXOCC≠SA. To
avoid this possible mistake, in the case of spectra like the one of trace b, an ulterior
amount of SA is to be added to the sample, to check the existence of two or more
overlapped signals.
-
Figure 4 - traces a - f. Trace a shows a markerEXO signal having two (or
many) components, in absence of the SA. These components are due to the
presence of the EXO in different CCs, or to the fact that the EXO has two
markerEXO signals, for example as a consequence of two different chemical specie
such as isomers or conformers, or due to the action of specific bonds with ENDOs,
membrane, etc.).
-
Different situations are possible, following the addition of the SA:
- each markerEXO signal remains unchanged (trace b). In this case the EXO
stays in CCs different from the ones where the SA is present, i.e. all the
EXO is EXOCC≠SA;
- some markerEXO signals remain unchanged while other signals shift: signal
A shifts while signal B remain unchanged (trace c and d) or vice-versa
(traces e and f). In this case the shifted signals correspond to EXOCCSA
while the other ones correspond to EXOCC≠SA;
- all the markerEXO signals shift. In this case all the EXO is EXOCCSA.
-
It is possible that the cases shown in trace c-f appear as that reported in trace
b. This can happen when the LIS is too small, i.e. insufficient for separating the
EXOCCSA signals from those due to EXOCC≠SA. To avoid this potential mistake, in
the case of spectra like that in trace b, an ulterior amount of SA is added to the
sample, to check the existence of two or more overlapped signals.
-
If, at point c) of step 1) it has been discovered that the SA only stays in the
extra-cellular compartment (o), it is possible to affirm that EXOCCSA= EXOo and
EXOCC≠SA = EXOi.Vice-versa, if at said point c) it has been discovered that the SA
only stays in the intra-cellular compartment (i), it is possible to affirm that
EXOCCSA= EXOi and EXOCC≠SA= EXOo.
-
In Figures 5-6 it is described the use of a preferred SA which is shared among
many compartments.
-
Figure 5 - traces a - h. Trace a shows a markerEXO signal, showing only one
component, in absence of the SA. Different situations are possible, following the
addition of the SA:
- the markerEXO signal remains unchanged (trace b). In this case the EXO
stays in one or more CC/s different from the one where the SA is present.
The EXO is all EXOCC≠SA;
- the markerEXO signal shift (traces c - d). In this case the EXO is all
EXOCCSA; and SA stay in only one CC, (or in different CCs where,
casually, markerEXO are isochronous);
- the markerEXO signal shifts and peak (*) remain unshifted (traces e - f). In
this case the shifted signals correspond to EXOCCSA and signal (*)
correspond to EXOCC≠SA;
- the markerEXO signal splits in two or more components and peak (*)
remain unshifted (traces g - h). In this case the shifted signals correspond
to EXOCCSA and signal (*) correspond to EXOCC≠SA.
-
Figure 6 - traces a - h . Trace a shows a markerEXO signal showing two (in
general many) components, in absence of the SA. Different situations are possible,
following the addition of the SA:
- the markeEXO signals remain unchanged (trace b). In this case the EXO
stays in one or more CC different from those where the SA is present. The
EXO is all EXOCC≠SA;
- one signal remains unchanged while the other one shifts (trace c, d, e, f). It
is also possible that the shifted signal also splits in two or more
components. The shifted signals correspond to EXOCCSA and the unshifted
signal corresponds to EXOCC≠SA;
- all the signals shift (trace g, h). In this case all the EXO is EXOCCSA.
-
Since the CCs where the SA distributes are known, upon comparison between
the markerEXO signal/s in absence and presence of the SA, also the CC/s where the
EXO is present result assigned.
-
Said measurement of step 3) is performed in accordance to the following
possible situations.
- All the EXO is EXOCC≠SA (as disclosed in Figures 3b; 4b; 5b; 6b). In this
case, [EXOCC≠SA] is obtained by considering the amount of EXO added to
the sample and the volume of the CC where EXO is present (CC is known
from the foregoing point c) of steps 1).
- All the EXO is EXOCCSA and the SA stays in only one CC (as disclosed in
Figures 3c; 3d; 4c; 4d). To calculate [EXOCCSA] two procedures are
possible:
- if the volume of the CC where the EXO is present is known,
[EXOCCSA] is obtained by considering the amount of EXO added to
the sample and the volume of the CC where the EXO is present (CC
is known from the foregoing point c) of step 1).
- if the volume of the CC where the EXO is present is not known, it is
necessary to have available a graph of LISEXO signal vs. ρEXO =
[SA]/[EXO], by which [EXOCCSA] can be directly determined, once
ρEXO is experimentally measured and [SA]CC is known. To built
LIS EXO signal vs. ρEXO graph, a series of MAS-NMR spectra of the
EXO under investigation must be acquired (in a medium as similar as
possible to the one of the in vitro sample, such as physiological
solution, plasma, etc.), by using a known [EXO] and different known
[SA]. At each variation of [SA]/[EXO], LISEXO signal is measured.
[SA]cc can be determined by using the LISENDO signal vs. ρENDO
graphs built at the foregoing point b) of step 1).
- The EXO is partially EXOCCSA and EXOCC≠SA, and the SA stays in only
one CC (as disclosed in Figures 3e; 3f 4e; 4f). Since the amount of EXO
added to the sample is known, the ratio between the area of the peaks,
corresponding to EXOCCSA and EXOCC≠SA, supplies the ratio
[EXOCCSA]/[EXOCC≠SA] and if the volume of at least one of the CCs is
know, the values of [EXOCCSA] and [EXOCC≠SA] result determined. If CCs
volumes are not know, [EXOCCSA] can be determined as described in the
previous case (by using LISEXO signal vs. ρEXO and LISENDO signal vs.
ρENDO graphs), consequently, also [EXOCC≠SA] results determined.
- The EXO and the SA distributes into more than one CC (as disclosed in
Figures 5c-5h; 6c-6h). In this case it is possible to determine all the
compartmental concentrations of the EXO, but additional stoichiometric
calculations are required, whose complexity is different for the different
situations, depending on the availability of some or all the CC volumes and
the number of CCs where the SA and the EXO distribute. In any case, by
means of LISEXO signal vs. ρEXO and LISENDO signals vs.ρENDO graphs, the
values of the compartmental concentrations of the SA can be determined
and, consequently, the compartmental concentrations of EXO can also be
calculated. This situation is disclosed in the following theoretical example.
Example - In the case where the SA distributes into three different CCs
(named as CC1, CC2 and CC3) and three shifted markerEXO signals exist,
the following stoichiometric relationships hold:
- ρENDOCC1 = [SACC1] / [ENDOCC1]
- ρENDO CC2 = [SACC2] / [ENDOCC2]
- ρENDO CC3 = [SACC2] / [ENDOCC2]
- ρENDO CC3 = [SACC3] / [ENDOCC3]
The following equation set (equation set no. 1) can be obtained:
- "ρENDO CC1" = (SACC1 / VCC1) / (ENDOCC1 / VCC1)
- "ρENDO CC2" = (SACC2 / VCC2) / (ENDOCC2 / VCC2)
- "ρENDO CC3" = (SACC3 / VCC3) / (ENDOCC3 / VCC3)
- "SAT" = SACCI + SACC1 + SACC3
- "ENDOT" = ENDOCCI +ENDOCC2 + ENDOCC3
- "VT" = VCC1 + VCC2 + VCC3
- "ACC1 / ACC2" = ENDOCC1 / ENDOCC2
- "ACC1 ACC3" = ENDOCC1 ENDOCC3
- "ACC2 ACC3 "= ENDOCC2 / ENDOCC3
wherein:
- VCC = volume of the CC, A = area under the signal, SACC = amount of the
SA in the CC, ENDOCC = amount of the ENDO in the CC, T = total.
Quoted terms are known or easily measured, while the others terms are
unknown variables.
Globally, there are nine variables (ENDOCC1, ENDOCC2, ENDOCC3, SACC1,
SACC2, SACC3, VCC1, VCC2, VCC3) in nine equations. To solve the system, it
is possible to use different known mathematical methods.It is also possible that the values of VCC1, VCC2, VCC3 are all, or partially,
known with sufficient precision. In this case the solution of the system
results simplified.Usually some or all of the values of ENDOCC1, ENDOCC2, ENDOCC3 are
also known, thus allowing a drastic simplification of calculation.Moreover, it is also possible that only one markerENDO signal exists,
allowing a reduction of the number of equations and variables.In any case, the values of SAT, SACC1, SACC2, SACC3, VCC1, VCC2. and
VCC3 can be determined. Consequently, all the [SACC] can be also
determined. From NMR-MAS spectra the values of LISEXO CC1,
LISEXO CC2 and LISEXO CC3 signals can also be measured and by the
graphs of LISEXO signal vs. ρEXO, the correspondent values of ρEXO CC1,
ρEXO CC2, ρCC 3 are obtained. Being [SACC] known, it is possible to
determine the [EXOCC] by the following set of equations:
To solve the system, it is necessary to calculate all the possible
combinations and to verify which [EXOs] are congruent with both
sets of equations 2 and 3.To better clarify what above disclosed, the same example is expressed
in numbers.Let us suppose to have the compartmental distribution reported in
Table 1 and to label the three different compartments as 1, 2 and 3.The experimental data are:
- from the measured LIS: ρ1, = 0.02; ρ2 = 0.093; ρ3 = 0.016
- from equation set 1 : [SACC1] = 0.2; [SACC2] = 1.4; [SACC3] = 0.4
- from MAS-NMR spectra calculation of the areas gives:
- A1 = 66.66; A2 =100; A3 =166.66
From these values it is possible to calculate (by equation set 2) all the
possible values of [SACC]/ρEXO i.e. [EXOCC], in the three
compartments (see values reported in Table 2). By these [EXOs]
values it is possible to calculate all the values of the left terms of
equation set 3, for all the possible combinations (see data reported in
Table 3). Then it is possible to calculate the right terms of equation
set 3, for all the possible combinations, by using the experimental
values of the signal areas (see data reported in Table 4).
| | SA | EXO | ρ | signal area |
| [SACC1] | 0.2 | 10 | 0.02 | 66.66 |
| [SACC2] | 1.4 | 15 | 0.093 | 100 |
| [SACC3] | 0.4 | 25 | 0.016 | 166.66 |
| Total added mM of SA = 2, total added mM of EXO = 50. |
| | [SACC1] | [SACC2] | [SACC3] |
| ρ1 | [EXOCC1] = 10.00 | [EXOCC2] = 70.00 | [EXOCC3]= 20.00 |
| ρ2 | [EXOCC1] = 2.14 | [EXOCC2] = 15.00 | [EXOCC3] = 4.29 |
| ρ3 | [EXOCC1] = 12.50 | [EXOCC2] = 87.50 | [EXOCC3]= 25.00 |
| [EXOCC1]/[EXOCC2] | 0.14 | 0.67 | 0.11 |
| | 0.03 | 0.14 | 0.02 |
| | 0.18 | 0.83 | 0.14 |
| [EXOCC1]/[EXOCC3] | 0.50 | 2.33 | 0.40 |
| | 0.11 | 0.50 | 0.09 |
| | 0.63 | 2.92 | 0.50 |
| [EXOCC2]/[EXOCC3] | 3.50 | 16.33 | 2.80 |
| | 0.75 | 3.50 | 0.60 |
| | 4.38 | 20.42 | 3.50 |
| | A1 | A2 | A3 |
| A1 | -- | 1.50 | 2.50 |
| A2 | 0.67 | -- | 1.67 |
| A3 | 0.40 | 0.60 | -- |
The values reported in Tables 3 which fit with those in Table 4, are
highlighted in bold characters. They correspond to:
- [EXOC1]/[EXOC2] = 0.67 obtained by [EXOC1]= 10 and [EXOC2] = 15
- [EXOC1]/[EXOC3] - 0.40 obtained by [EXOC1]- 10 and [EXOC3] = 25
- [EXOC2]/[EXOC3] = 0.60 obtained by [EXOC2]= 15 and [EXOC3] = 25
- A1/A2 = 0.67 obtained by A1 = 66.66 and A2 = 100
- A1/A3 = 0.40 obtained by A1 = 66.66 and A3 = 166.66
- A2/A3 = 0.60 obtained by A2 = 100 and A3 = 166.66
therefore: [EXOC1]= 10; [EXOC2] = 15; [EXOC3] = 25
AC1 = 66.66; AC2 = 100; AC3 = 166.66
-
Accordingly, the solution of the system has allowed to calculate the
values of [EXOCC1], [EXOCC2], [EXOCC3].
-
Summarizing, step 3) is performed by taking into account the CC/s
where the EXO is present, the volume/s of said CC/s, the value/s of the area/s
under the markerEXO signal/s, the calculated ρEXO for every CC in which the
EXO is present and solving the system of equations connecting said
parameters.
EXPERIMENTAL SECTION
Determination of cellular uptake of aspirin in red blood cells
-
- EXO = Aspirin.
- ENDO = sodium ions.
- SA = Dy-BOPTA (Dy is the symbol of Dysprosium, one of the
lanthanides having characteristics of shift agent).
-
-
The nucleus used to determine the CCs where the SA is present is sodium-23.
-
The nucleus used to determine Aspirin cellular uptake is proton.
-
The in vitro determination has been performed on HRBC, obtained by human
blood treated as described in the following.
-
Centrifugation: the employed centrifuge was HERAEUS SEPATECH
OMNIFUGE 2 ORS, rotor model 3360. Centrifugation was done at 2109 g
(equivalent to 3500 rpm) at 4°C for 15 minutes.
-
Living HRBC preparation: human blood (to which sodium citrate has been
added as an anticoagulant) was centrifuged. After that, HRBC pellets were
separated from serum and white cell interface, being careful to obtain a solution of
red cells free of white cells; accordingly, red cells with 80% hematocrit were
obtained.
-
Dy-BOPTA stock solution: a 0.1 M stock solution of Dy-BOPTA was used in
all the measurement to obtain the suitable [SA].
-
Aspirin stock solution: a 1 M stock solution of aspirin was used in all the
measurements.
-
Aspirin in HRBC: a sample containing 1 ml of HRBC (80% hematocrit), 100
µmoles of aspirin (i.e. 100 µl of aspirin stock solution) and 8 µmoles of Dy-BOPTA
(i.e. 80 µl of Dy-BOPTA stock solution) was employed to measure the
uptake of aspirin in HRBC.
-
23 Na NMR spectra: all the 23 Na NMR spectra have been acquired on a Bruker
AMX 400 WB spectrometer at the frequency of 105.84 MHz. A multinuclear CP-MAS
probehead with double bearing and 4 mm rotor have been employed.
-
Experimental conditions were: sample rotating speed = 3500 Hz; spectra
width = 16000 Hz (c.a. 150 ppm); time domain data points = 16K; number of scans
= 1024; pulse length = 15 µs; recycle delay = 2s; Fourier Transform by 10 Hz of
enhancement multiplication function, sample temperature = 25°C.
-
Proton 1 H NMR spectra: all the 1H NMR spectra have been acquired on a
Bruker AMX 600 SB spectrometer at the frequency of 600.13 MHz. A
multinuclear HR-MAS probehead with double bearing and 4 mm rotor with 12 µl
spherical insert have been employed. Experimental conditions were: sample
rotating speed = 3500 Hz; spectra width = 12,000 Hz (c.a. 20 ppm); time domain
data points = 128 K; number of scans = 16; pulse length = 11.7 µs; recycle delay =
10 s; Fourier Transform by 0.5 Hz of enhancement multiplication function, sample
temperature = 25°C.
-
Dy-BOPTA employed in the present experiment has been selected from other
Dysprosium chelates as preferred SA and sodium ions have been selected as
preferred ENDO. This selection has been done on the basis of the procedure
previously described at Step 1, points a) -d). All measurements have been
performed by means of 23Na MAS-NMR spectra, as a consequence of the choice to
use sodium ions as ENDO. 23Na MAS-NMR spectra of HRBC sample containing
different amounts of Dy-BOPTA were acquired.
-
The results are disclosed in enclosed Figure 7.
-
Figure 7 - in trace a, reports 23Na MAS-NMR spectrum of the HRBC
sample, in absence of Dy-BOPTA, while traces b - d report the spectra of the same
sample, but after increasing additions of the SA, i.e. Dy-BOPTA. The observed
behaviour is like the one reported in Figure 1b, i.e. the original ENDO signal splits
in two components. The first one remains at the same chemical shift of the original
signal, while the other signal results shifted. That means that the SA, i.e. Dy-BOPTA,
is completely in the CC correspondent to the LIS markerENDO signal. This
CC is the extra-cellular compartment, as reported in literature (12). Value of [SA]
obtained by means of LISENDO signal vs. ρENDO graph, confirms that all the SA is in
the extra-cellular compartment.
-
Proton spectra have been employed to determine aspirin cellular uptake,
because 1H is the only nucleus present in aspirin having a high NMR sensitivity.
The 1H NMR spectra of aspirin in water shows two signals (A and B), in
correspondence to the methyl group, as disclosed in enclosed Figure 8. This case is
similar to the one shown in Figure 4 trace a. Both the two signals are markerEXO
signals.
-
The calculated graph of LISASPIRIN vs. ρASPIRIN= [Dy-BOPTA]/[ASPIRIN] is
reported in Figure 9, for both the markerEXO signals.
-
The measurement of cellular uptake of aspirin by HRBC is calculated from
the spectra reported in the enclosed Figure 10.
-
Firstly, the 1H NMR-MAS spectrum of HRBC was acquired (Figure 10 -
trace a) in absence either of aspirin (EXO) or of Dy-BOPTA (SA).
-
Then 100 µl of aspirin 1M stock solution were added and the spectrum
repeated (Figure 10 - trace b). In spectrum of trace b the two components for each
signal A and B of the methyl group of aspirin are well visible, i.e. four peaks exist
in the proton MAS-NMR spectrum. The splitting of signals A and B induce to
suppose that the molecules of aspirin in the extra- and intra-cellular are in
magnetically different environments, i.e. the four observed signals correspond to
signals A e B, respectively into intra- and extra-cellular compartments.
-
Last, 80 µl of Dy-BOPTA stock solution were also added to the sample and
the spectrum were again re-acquired (Figure 10 - trace c). Now the four peaks
show a larger difference in their chemical shift with respect to trace b. Two
components result unshifted with respect to the original markerEXO signals while
the other two components are shifted.
-
Aspirin correspondent to the unshifted markerEXO signals is ASPIRINCC≠SA,
i.e. aspirin in the intra-cellular compartment.
-
On the contrary, aspirin correspondent to the shifted marker EXO signals is
ASPIRINCCSA, i.e. aspirin in the extra-cellular compartment. This behaviour in
presence of the SA, also confirms that the four signals of aspirin, which appear in
the spectrum in absence of the SA, are due to intra- and extra-cellular component
of aspirin.
-
The ratio between the areas of the two sets of peaks, directly gives the ratio
between aspirin in the two cellular compartments for each type A and B. Since the
volume of the two cellular compartments can be calculated, it is possible to obtain
the ratio: [aspirin]o/[aspirin];.
-
- Peak area ofmarkerEXO(A)i = 5.84
- Peak area of markerEXO(A)o = 88.28
- Peak area of markerEXO(B)i = 11.13
- Peak area of markerEXO(B)o = 45.50
- Volume of intracellular fluid = 0.8 ml
(because 1 ml of HRBC with 80% hematocrit were used) - Volume of extracellular fluid = 0.2 ml + 0.1 ml + 0.08 ml = 0.38 ml
(0.2 ml = extracellular fluid in HRBC; 0.1 ml = volume of added aspirin
solution; 0.08 ml = volume of added SA solution) - Total of added aspirin = 100 µmoles
-
Calculations are the following:
-
- µmoles aspirini (A) = 5.84 x 100/(5.84+88.28+11.13+45.50) = 3.87
- µmoles aspirino (A) = 88.28 x 100/(5.84+88.28+11.13+45.50) = 58.56
- µmoles aspirini (B) = 11.13 x 100/(5.84+88.28+11.13+45.50) = 7.38
- µmoles aspirino (B) = 45.50 x 100/(5.84+88.28+11.13+45.50) = 30.19
- concentration of aspirini (A) = 3.87 / 0.8 = 4.83 mM
- concentration of aspirino (A) = 58.56 / 0.38 = 154.10 mM
- concentration of aspirini (B) = 7.38 / 0.8 = 9.22 mM
- concentration of aspirino (B) =30.19 / 0.38 = 79.44 mM
- [aspinn]o/[aspirin]i (A) = 154.10 / 4.83 = 31.90
- [aspirin]o/[aspirin]i (B) = 79.44 / 9.22 = 8.611
-
References
-
- 1. Zaplatin N., Baker K. A., Kleinhans. F. W., Effectiveness and Toxicity of Several
DTPA Broadening gents for Biological ESR Spectroscopy, J. Magn. Res. Ser. B 110,
249 - 254 (1996).
- 2. Artemov D, Solaiyappan M, Bhujwalla ZM, Magnetic resonance
pharmacoangiography to detect and predict chemotherapy delivery to solid tumors,
Cancer Res 61:7, 3039-44 (2001).
- 3. Colet J. M., Vander Elst L, Muller RN, Dynamic evaluation of the hepatic uptake and
clearance of manganese-based MRI contrast agents: a 31P NMR study on the isolated
and perfused rat liver. J Magn. Reson. Imaging 8:3 663-9 (1998).
- 4. Chirico G., Cannone F., Olivini F., Beretta S., Baldini G., Diaspro A., Robello M., "A
combined confocal and spectroscopic TPE architecture for the identification of single
fluorescent molecules", SPIE proc., Multiphoton Microscopy in the Biomedical
Sciences, A. Periasamy, P.T.C. So, Eds., vol.4262, p.407-413 (2001).
- 5. Chirico G., Cannone F., Beretta S., Baldini G., Diaspro A., "Single Molecules Studies
By Means Of The Two-Photon Fluorescence Distribution", Microsc.Res.Tech.,
(2001) 55:359-364.
- 6. Degani H., Elgavish G. A., Ionic Permeabilities of Membranes, FEBS Lett. 90(2), 357
- 360 (1978).
- 7. Gupta R. K., Gupta P., Direct Observation of Resolved Resonances from Intra- and
Extracellular Sodium-23 Ions in NMR Studies of Intact Cells and Tissues Using
Dysprosium(III)tripoly phosphate as Paramagnetic Shift Reagent, J. Magn. Reson. 47,
344 - 350 (1982).
- 8. Miller S. K., Chu W. J., Pohost G. M., Elgavish G. A., Improvement of
Spectral Resolution in Shift-Reagent-Aided 23Na NMR Spectroscopy in the
Isolated Perfused Rat Heart System, Magn. Reson. Med. 20, 184 - 195 (1991).
- 9. Aime S, Botta M, Mainero V, Terreno E., Separation of intra- and extracellular
lactate NMR signals using a lanthanide shift reagent. Magn Reson Med 47:1 10-3
(2002).
- 10. Calabi L., Alfieri G., Biondi L., De Miranda M., Paleari L., Ghelli S. - Application of
high resolution magic angle spinning NMR spectroscopy to define the cell up-taking
of MRI Contrast Agents J. Magn. Reson. 156, 222-229 (2002).
- 11. Calabi L., Paleari L., Biondi L., Linati L., De Miranda M., Ghelli S.,
Application of 1H and 23Na Magic Angle Spinning NMR Spectroscopy to
define the HRBC up-taking of MRI contrast agents, accepted on J. Magn.
Reson. 164, 28-34 (2003).
- 12. Springer C. S. Jr., Physicochemical Principles Influencing
Magnetopharmaceuticals in "NMR in Physiology and Biomedicine" (R.J.
Gillies, ed.), pp. 75-99, Academic Press Inc., Orlando (1994).
- 13. Live D. H., and Chan S. I., Bulk Susceptibility Corrections in Nuclear Magnetic
Resonance Experiment Using Superconducting Solenois, Anal. Chem. 42(7),
791-792(1970).
- 14. Pályka, W. Huang, and C. S. Springer Jr., The Effects of Bulk Magnetic
Susceptibility in NMR, Bull. Magn. Reson. 17,46 - 53 (1995).
- 15. Shachar-Hill Y., Berfroy D. E., Pfeffer P. E., and Ratcliffe R. G., Using Bulk
Magnetic Susceptibility to Resolve Internal and External Signals in the NMR
Spectra of Plant Tissues, J. Magn. Reson. 127, 17 - 25 (1997).
- 16. Humpfer E., Spraul M., Nicholson A. W., Nicholson J. K., and Lindon J. C., Direct
Observation of Resolved intra- and extracellular Water Signals in Intact Human Red
Blood Cells Using 1H MAS NMR Spectroscopy, Magn. Res. Med. 38, 334 - 336
(1997).
-