EP1568312A1 - Living body light measurement system and signal processing method - Google Patents
Living body light measurement system and signal processing method Download PDFInfo
- Publication number
- EP1568312A1 EP1568312A1 EP04030743A EP04030743A EP1568312A1 EP 1568312 A1 EP1568312 A1 EP 1568312A1 EP 04030743 A EP04030743 A EP 04030743A EP 04030743 A EP04030743 A EP 04030743A EP 1568312 A1 EP1568312 A1 EP 1568312A1
- Authority
- EP
- European Patent Office
- Prior art keywords
- light
- intensity distribution
- signal intensity
- subject
- living body
- Prior art date
- Legal status (The legal status is an assumption and is not a legal conclusion. Google has not performed a legal analysis and makes no representation as to the accuracy of the status listed.)
- Withdrawn
Links
- 238000005259 measurement Methods 0.000 title claims abstract description 36
- 238000003672 processing method Methods 0.000 title claims 5
- 238000009826 distribution Methods 0.000 claims abstract description 82
- 210000004556 brain Anatomy 0.000 claims abstract description 70
- 230000004913 activation Effects 0.000 claims abstract description 66
- 238000000034 method Methods 0.000 claims abstract description 61
- 238000006073 displacement reaction Methods 0.000 claims abstract description 44
- 230000008569 process Effects 0.000 claims abstract description 28
- 238000001514 detection method Methods 0.000 claims description 17
- 238000005286 illumination Methods 0.000 claims description 17
- 230000000644 propagated effect Effects 0.000 claims description 9
- 238000005094 computer simulation Methods 0.000 claims description 7
- 238000005070 sampling Methods 0.000 abstract description 34
- 239000008280 blood Substances 0.000 abstract description 29
- 210000004369 blood Anatomy 0.000 abstract description 29
- 238000003745 diagnosis Methods 0.000 abstract description 3
- 208000014644 Brain disease Diseases 0.000 abstract description 2
- 238000011282 treatment Methods 0.000 abstract description 2
- 238000001994 activation Methods 0.000 description 59
- 239000013307 optical fiber Substances 0.000 description 28
- 238000010586 diagram Methods 0.000 description 22
- 230000008859 change Effects 0.000 description 20
- 238000004422 calculation algorithm Methods 0.000 description 14
- 238000004088 simulation Methods 0.000 description 9
- 102000001554 Hemoglobins Human genes 0.000 description 8
- 108010054147 Hemoglobins Proteins 0.000 description 8
- 230000003925 brain function Effects 0.000 description 8
- 238000006213 oxygenation reaction Methods 0.000 description 8
- 210000003625 skull Anatomy 0.000 description 8
- 230000031700 light absorption Effects 0.000 description 7
- 210000001175 cerebrospinal fluid Anatomy 0.000 description 5
- 230000003287 optical effect Effects 0.000 description 5
- 210000004761 scalp Anatomy 0.000 description 5
- 230000035945 sensitivity Effects 0.000 description 5
- 238000003384 imaging method Methods 0.000 description 4
- 238000004590 computer program Methods 0.000 description 3
- 230000000694 effects Effects 0.000 description 3
- 238000002599 functional magnetic resonance imaging Methods 0.000 description 3
- 230000006872 improvement Effects 0.000 description 3
- 210000001519 tissue Anatomy 0.000 description 3
- 238000012876 topography Methods 0.000 description 3
- 239000013598 vector Substances 0.000 description 3
- 230000008033 biological extinction Effects 0.000 description 2
- 238000004364 calculation method Methods 0.000 description 2
- 239000003086 colorant Substances 0.000 description 2
- 206010015037 epilepsy Diseases 0.000 description 2
- 239000000835 fiber Substances 0.000 description 2
- 230000006870 function Effects 0.000 description 2
- 238000012545 processing Methods 0.000 description 2
- 239000000523 sample Substances 0.000 description 2
- 238000012360 testing method Methods 0.000 description 2
- 206010010904 Convulsion Diseases 0.000 description 1
- 240000005561 Musa balbisiana Species 0.000 description 1
- 235000018290 Musa x paradisiaca Nutrition 0.000 description 1
- 241000950638 Symphysodon discus Species 0.000 description 1
- 230000002490 cerebral effect Effects 0.000 description 1
- 230000006866 deterioration Effects 0.000 description 1
- 201000010099 disease Diseases 0.000 description 1
- 208000037265 diseases, disorders, signs and symptoms Diseases 0.000 description 1
- 238000005516 engineering process Methods 0.000 description 1
- 238000011156 evaluation Methods 0.000 description 1
- 238000013507 mapping Methods 0.000 description 1
- 239000000463 material Substances 0.000 description 1
- 230000002503 metabolic effect Effects 0.000 description 1
- 238000012986 modification Methods 0.000 description 1
- 230000004048 modification Effects 0.000 description 1
- 238000012544 monitoring process Methods 0.000 description 1
- 230000037023 motor activity Effects 0.000 description 1
- 230000007659 motor function Effects 0.000 description 1
- -1 oxy L Chemical class 0.000 description 1
- 238000011084 recovery Methods 0.000 description 1
- 238000011160 research Methods 0.000 description 1
- 239000011347 resin Substances 0.000 description 1
- 229920005989 resin Polymers 0.000 description 1
- 239000004065 semiconductor Substances 0.000 description 1
- 238000012732 spatial analysis Methods 0.000 description 1
- 230000003595 spectral effect Effects 0.000 description 1
- 230000007480 spreading Effects 0.000 description 1
- 239000000126 substance Substances 0.000 description 1
- 238000006467 substitution reaction Methods 0.000 description 1
- 238000012731 temporal analysis Methods 0.000 description 1
- 238000012546 transfer Methods 0.000 description 1
- 238000012795 verification Methods 0.000 description 1
Images







Classifications
-
- A—HUMAN NECESSITIES
- A61—MEDICAL OR VETERINARY SCIENCE; HYGIENE
- A61B—DIAGNOSIS; SURGERY; IDENTIFICATION
- A61B5/00—Measuring for diagnostic purposes; Identification of persons
- A61B5/145—Measuring characteristics of blood in vivo, e.g. gas concentration or pH-value ; Measuring characteristics of body fluids or tissues, e.g. interstitial fluid or cerebral tissue
- A61B5/1455—Measuring characteristics of blood in vivo, e.g. gas concentration or pH-value ; Measuring characteristics of body fluids or tissues, e.g. interstitial fluid or cerebral tissue using optical sensors, e.g. spectral photometrical oximeters
- A61B5/14551—Measuring characteristics of blood in vivo, e.g. gas concentration or pH-value ; Measuring characteristics of body fluids or tissues, e.g. interstitial fluid or cerebral tissue using optical sensors, e.g. spectral photometrical oximeters for measuring blood gases
- A61B5/14553—Measuring characteristics of blood in vivo, e.g. gas concentration or pH-value ; Measuring characteristics of body fluids or tissues, e.g. interstitial fluid or cerebral tissue using optical sensors, e.g. spectral photometrical oximeters for measuring blood gases specially adapted for cerebral tissue
-
- A—HUMAN NECESSITIES
- A61—MEDICAL OR VETERINARY SCIENCE; HYGIENE
- A61B—DIAGNOSIS; SURGERY; IDENTIFICATION
- A61B2562/00—Details of sensors; Constructional details of sensor housings or probes; Accessories for sensors
- A61B2562/02—Details of sensors specially adapted for in-vivo measurements
- A61B2562/0233—Special features of optical sensors or probes classified in A61B5/00
-
- A—HUMAN NECESSITIES
- A61—MEDICAL OR VETERINARY SCIENCE; HYGIENE
- A61B—DIAGNOSIS; SURGERY; IDENTIFICATION
- A61B2562/00—Details of sensors; Constructional details of sensor housings or probes; Accessories for sensors
- A61B2562/04—Arrangements of multiple sensors of the same type
- A61B2562/046—Arrangements of multiple sensors of the same type in a matrix array
-
- A—HUMAN NECESSITIES
- A61—MEDICAL OR VETERINARY SCIENCE; HYGIENE
- A61B—DIAGNOSIS; SURGERY; IDENTIFICATION
- A61B5/00—Measuring for diagnostic purposes; Identification of persons
- A61B5/0033—Features or image-related aspects of imaging apparatus, e.g. for MRI, optical tomography or impedance tomography apparatus; Arrangements of imaging apparatus in a room
- A61B5/004—Features or image-related aspects of imaging apparatus, e.g. for MRI, optical tomography or impedance tomography apparatus; Arrangements of imaging apparatus in a room adapted for image acquisition of a particular organ or body part
- A61B5/0042—Features or image-related aspects of imaging apparatus, e.g. for MRI, optical tomography or impedance tomography apparatus; Arrangements of imaging apparatus in a room adapted for image acquisition of a particular organ or body part for the brain
Definitions
- the present invention relates to a living body light measurement system, and, more particularly, the present invention is directed to a method for displaying images indicating a special distribution of changes in concentration and a method for displaying such images in a living body light measurement system capable of measuring the concentration of metabolic substances of a living body or the changes in the concentration using the light of the living body.
- Diagnosis of diseases in the brain can be realized by measuring, when possible, the activation of the human brain. Moreover, recovery processes and the monitoring of rehabilitation of these diagnosed brain diseases may also be realized. Therefore, various measuring systems for brain functions have been proposed.
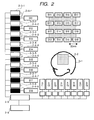
- Fig. 2 illustrates the structure of a system to perform the measurement disclosed in Non-Patent Document 1 or a similar process.
- a subject ( 2-1 ) wears a helmet (i.e., probe) ( 2-2 ) before beginning the measurement.
- the probe 2-2 is alternately provided with a light illumination location in which optical fibers ( S11 to S18) connected to a light source are placed and a light detection location in which optical fibers ( D11 to D18 ) connected to a light detector are placed with interval of about 30 mm.
- the optical fibers connected to the light source ( S11 to S18 ) are respectively connected to double-wavelength lasers ( 2-3-1 to 2-3-8 and 2-4-1 to 2-4-8 ) in different wavelengths.
- the light sources used are about 780 nm and 830 nm, around the wavelength of 800 nm, wherein the molecule extinction coefficients of oxygenation hemoglobin and de-oxygenation hemoglobin become identical.
- the light illuminated from the optical fiber S13 is detected with the optical fibers D13, D11, D15, D14 which are isolated by 30 mm from the place of the optical fiber S13.
- the light having reached the optical fibers for detection D11 to D18 are detected with a light detector 2-6 (semiconductor light detector, e.g., an avalanche photodiode, photomultiplier or similar device).
- the detected light is processed with a control and process device 2-5 .
- a blood volume which has been changed at the cortex in accordance with the activation of the brain can be calculated on the basis of the result of processing the light at each light illumination location and each light detection location (provided alternately at intervals of 30 mm).
- the result of this calculation is displayed on an electronic computer including a display as waveform (time domain) and an image showing the activations (i.e., activity) of the brain.
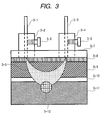
- Fig. 3 illustrates a method of measuring changes in blood volume in accordance with activations (i.e., activities) of the brain.
- a propagation path ( 3-5 ) of light being propagated between a holder (3-2) for fixing an optical fiber (3-1) connected to a light source and a holder (3-4) for fixing an optical fiber (3-3) connected to a light detector.
- Each holder fixes an optical fiber using a screw 3-6.
- These holders are fixed with a resin 3-7 which also forms the helmet (2-2).
- the end part of the optical fiber is placed in contact with the scalp of the subject 3-8.
- a typical structure of the brain of a human is also illustrated.
- the brain is generally formed, in addition to the scalp 3-8 described above, of the skull 3-9, cerebrospinal fluid layer 3-10, and cortex 3-11, or the like.
- these living body tissues have known optical scattering characteristics and absorbing characteristics and that the optical scattering characteristic of the skull is particularly large.
- the light illuminated from the light source is scattered depending on the optical scattering characteristic and is gradually lost in the intensity thereof depending on the optical absorbing characteristic.
- the holders illustrated in the figure are located with the intervals of about 30 mm.
- the light illuminated from the optical fiber 3-1 connected to the light source is propagated through the living body tissues in an arc shape 3-5 (like a banana) as illustrated and is then detected after the light has reached the optical fiber 3-3 connected to the light detector.
- 3-12 illustrates the area where the blood volume increases in accordance with activation of the brain. For example, when the blood volume increases, intensity (I) of the light having reached the optical fiber for detection 3-3 is reduced.
- ⁇ A corresponding to a logarithmic difference value of the detected light intensity before and after activation of the brain
- ⁇ Coxy, ⁇ Cdeoxy a change in the concentration of oxygenation hemoglobin and de-oxygenation hemoglobin
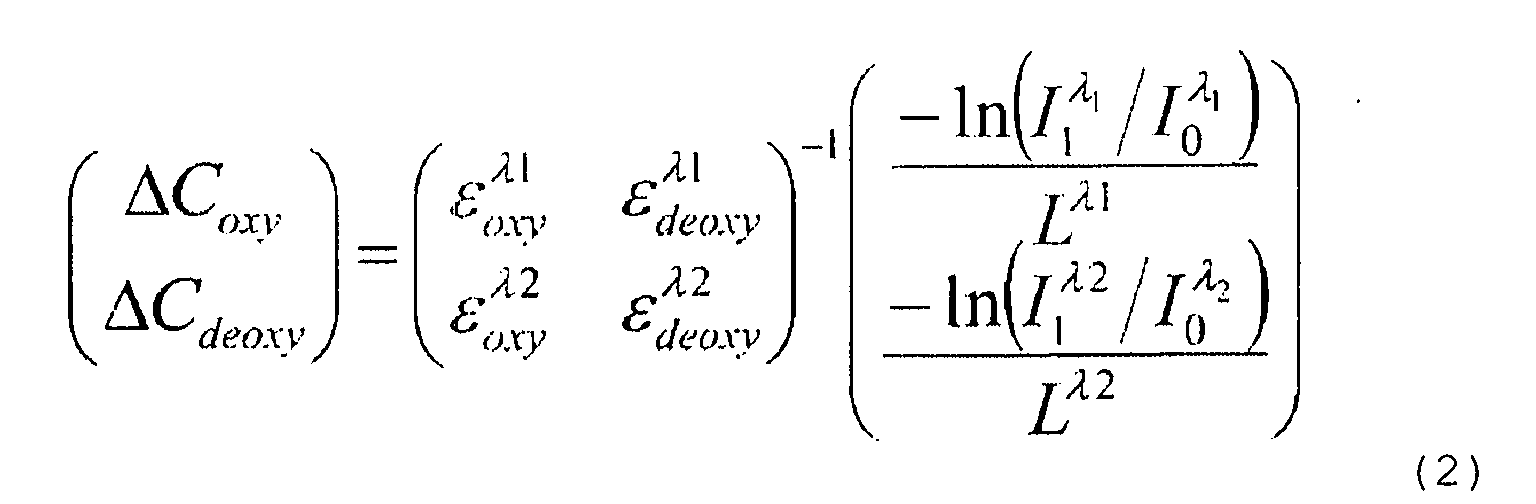
- Equation (1) denotes an average optical propagation path length between the light source and the light detector.
- ⁇ oxy and ⁇ deoxy in equation (1) denote respectively the molecule extinction coefficients of oxygenation hemoglobin and de-oxygenation hemoglobin.
- I denotes the intensity of light arriving at the detector and I 0 and I 1 represent the intensity of light before activation of the brain and during activation of the brain, respectively.
- Changes in concentration ( ⁇ Coxy, ⁇ Cdeoxy) of oxygenation hemoglobin and de-oxygenation hemoglobin due to the activation of brain can be expressed as equation (2) by applying equation (1) to each wavelength:
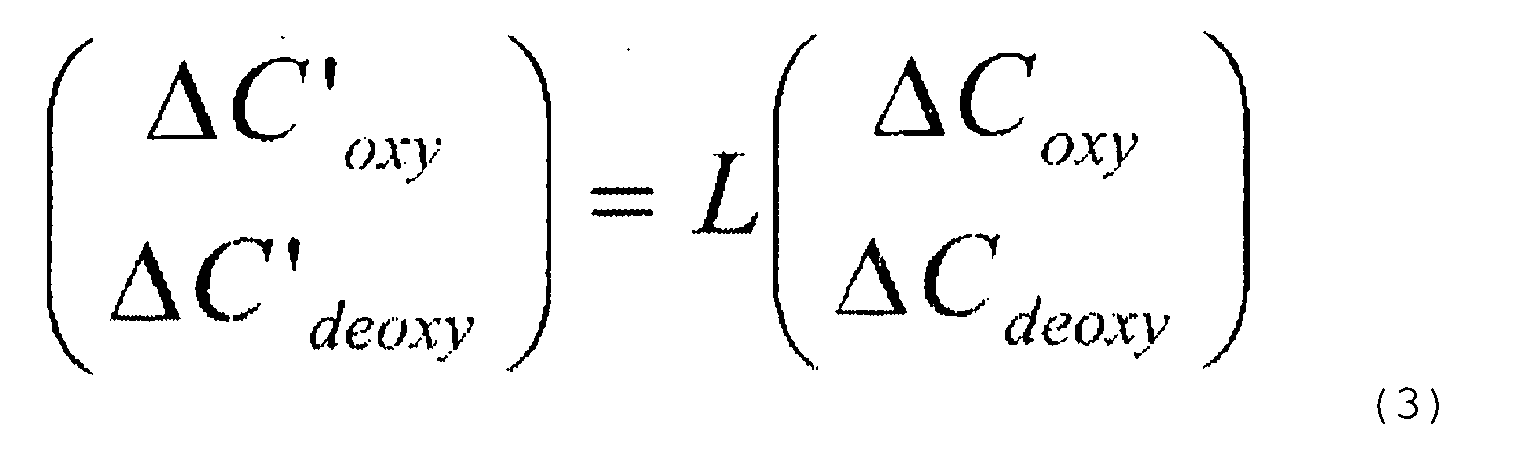
- equation (3) may be used:
- C' which is a unit having the dimension wherein concentration is multiplied with distance
- Fig. 4 illustrates a sensor locating method for the condition that eight light illumination locations for the optical fibers S11 to S18 connected to the light source and eight light detection locations for the optical fibers D11 to D18 are respectively allocated on the scalp of the subject.
- the eight white squares ( ⁇ , 4-1 ) and eight black squares ( ⁇ , 4-2 ) indicate the light illumination points and light detection points, respectively.
- the locations (4-3) indicated by the black circles are located almost at the intermediate locations between the light illumination location and the light detection location.
- intermediate locations are defined as the sampling points giving the location information of change in blood volume detected from a change in the intensity of the light having reached the light detection location after illumination from the light illumination location.
- the reason why the sampling point has been established as an almost intermediate point between the two fibers will be described using the light propagation path 3-5 illustrated in Fig. 3. According to this light propagation path, the light is not propagated to the areas just under the light illumination locations 4-1 and light detection locations 4-2.
- the light is propagated not only to the skull but also to the cerebrospinal fluid layer and the cortex as the brain activation area. Since the area considered as the actual brain activation area is the cortex, according to the light propagation characteristic illustrated in Fig. 4, a change in the blood volume detected by a pair of light source and light detector may be assumed to become a maximum when change in the blood volume is changed at the area just under the intermediate point of the light illumination location and the light detection location. Therefore, the intermediate point 4-3 between the light illumination location 4-1 and light detection location 4-2 is defined as the sampling point and also as the point giving the location information of change in blood volume detected by using a pair of light source and light detector. In the allocation method of the light source and light detector illustrated in Fig. 4, 24 sampling points are provided keeping the intervals of 21 mm (which is equal to ⁇ (1/2) times the sensor allocation interval of 30 mm).
- a topographic image illustrated in Fig. 5 can be obtained by spatially interpolating the change in blood volume of the measuring area enclosed by these 24 sampling points.
- the areas where the change in blood volume is large can be detected by displaying a change in blood volume using contour lines and concentration lines or a similar methodology.
- Fig. 5 the areas where the change in blood volume is large are indicated as the brighter (lighter) area, while the areas where change in blood volume is small are indicated as the darker areas.
- the "topography” referred to in this topographic image means a "topographical map” and a space distribution of the physical amount of the dimension which is different from that of the location information on a plane is displayed on this plane.
- a coordinate is established in Fig. 4 . This coordinate includes the x-y axes, and the origin is established at the center of the measuring areas. Therefore, x and y change in the areas of -45 ⁇ x, y ⁇ 45 and the measuring areas is extended up to 90 x 90 mm 2 .
- Non-Patent Document 1 In addition to Non-Patent Document 1 described above, some comments on the following additional references with be provided below: E. Watanabe, et al., “Noninvasive Cerebral Blood Volume Measurement During Seizures Using Multi-channel Near Infrared Spectroscopic Topography", Journal of Biomedical Optics, 2000, July, 5(3), P. 287-290 ("Non-Patent Document 2"); E. Watanabe, et al., “Non-invasive assessment of language dominance with Near-Infrared Spectroscopic mapping", Neurosci. Lett. 256 (1998) (“Non-Patent Document 3"); T.
- Non-Patent Document 5" “Arranging optical fibers for the spatial resolution improvement of topographical images", Phys. Med. Biol. 47 (2002)
- Non-Patent Document 4" “Arranging optical fibers for the spatial resolution improvement of topographical images”
- Sandwell, David T. “Biharmonic Spline Interpolation of GEOS-3 and SEASAT Altimeter Data”
- Geophysical Research Letters, 2, 139-142, 1987 (“Non-Patent Document 5").
- the topographic image illustrated in Fig. 5 is displayed under the condition that a change in blood volume is blurred. Meanwhile, such blur is rather small in the image of brain activation picked up with a functional magnetic-resonance imaging system or a positron topographic imaging system which are conventional brain function measurement systems. This is because the spatial distribution of the sampling points in the light topography method is somewhat smaller than that in the other brain function measurement systems.
- measurement is conducted by placing the optical fiber used for the measurement in contact with the scalp of the subject.
- the location information of a change in blood volume detected with a pair of sensors is given by establishing the intermediate point of the optical fiber location connected to the light source and detector as the sampling point.
- the sampling points can be established in principle without any limitation. Since changes in blood volume can be measured in the multiple points, blurring of the images is somewhat small in comparison with the topographical images.
- a multi-channel light brain function measurement system illustrated in Fig. 2 may be used in the actual medical field.
- the Non-Patent Documents 2 and 3 disclose that such a system is presently used for identifying the location of neurotic epilepsy and language dominance.
- users estimate the activation areas from the spatial distribution of changes in blood volume displayed with the topographic images. Therefore, the accurate display of the activation areas of the brain is needed as a tool for identifying the locations of neurotic epilepsy and language dominance.
- FIG. 6 A simulation model is illustrated in Fig. 6.
- the structure of a human brain is modeled in a three-layer structure formed of skull 6-1, cerebrospinal fluid layer 6-2, and cortex 6-3.
- Such a model structure is widely used even in the documents which have already been made public.
- this structure is described in Non-Patent Document 4.
- the area 6-4 indicates a location of the brain activation area existing over the cortex.
- Fig. 7 illustrates an allocation where an optical fiber 7-1 for illumination and a fiber 7-2 for detection are placed in contact with the upper side of brain model illustrated in Fig. 6 .
- these two optical fibers be located with an interval of 30 mm.
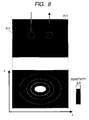
- the spatial distribution (sensitivity distribution) of ⁇ A in equation (1) when the brain activation area is changed and the light absorbing coefficient at the brain activation area is also changed for the locations of these optical fibers in locations of these optical fibers shows the elliptical shape distribution as illustrated at the lower portion of Fig. 8.
- the location of an optical fiber for illumination 8-1 and an optical fiber for detection 8-2 are designated.
- ⁇ x, ⁇ y indicates the half-value widths in the directions of the x axis and y axis.
- ⁇ x is known to take a value in the range of 20 to 40 mm
- ⁇ y is known to take a value in the range of 10 to 30 mm.
- ⁇ A ( x , y ) exp- x 2 ⁇ x 2 exp- y 2 ⁇ y 2
- Fig. 9 illustrates an allocation method of a light source and a light detector used for generation of a topographic image.
- 9-1 designates the location of light illumination to a light source represented by a laser or a light emitting diode.
- 9-2 designates the location of a light detector such as an avalanche photodiode or a photomultiplier.
- this intermediate point is defined as the sampling point 9-3 and as the point which gives the location information of a change in the blood volume detected with a pair of light source 9-1 and light detector 9-2.
- 24 sampling points are provided.
- the brain activation area is established in the area enclosed by the light source, light detector, and sampling points, and a topographic image can be generated using the spatial distribution of the sensitivity given by Fig. 8 and equation (5). Therefore, a method of assessing the location accuracy will be described by referring to Fig. 10.
- the brain activation area 10-3 indicated as 6-4 in Fig. 6 is established for eight light illumination points 10-1 and eight light detection points 10-2 at the upper side of the skull ( Fig. 10A ).
- the central location of the brain activation area is defined as (Xc, Yc). A change in the degree of light absorption at the 24 sampling points 10-4 is obtained with the computer simulation for this brain activation area.
- the distribution of the changes in light absorption degree is then visualized as a topographic image 10-5 ( Fig. 10B ).
- the maximum point which is of the most interest to users of the system among the topographic image is defined as (Xmax, Ymax), and this maximum point has been obtained.
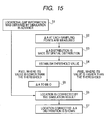
- the values of ⁇ A detected with the 24 pairs of light sources and light detectors existing in Fig. 10 are calculated as the value of ⁇ A at the 24 sampling points using equation (5) for changes in light absorption degree at the central location (Xc, Yc) of the preset brain activation ( S1-1 in Fig. 21 ).
- a topographic image can be visualized ( S1-2 in Fig. 21 ) with the spatial interpolation process using the value of each ⁇ A.
- the location information for obtaining such ⁇ A and the maximum location (Xmax, Ymax) thereof has been obtained ( S1-3 in Fig. 21 ).
- the interpolation process has been executed in this embodiment with the method (inverse distance method) described in Non-Patent Document 5.
- Displacement can be detected by comparing the central location (Xc, Yc) of the brain activation area and the maximum location (Xmax, Ymax) of the topographic image. Such displacement is generated because the interpolation is executed using ⁇ A at each sampling point and the location coordinate thereof in order to generate a topographic image with the spatial interpolation.
- the topographic image intensity reflects the location information at each sampling point.
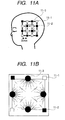
- the maximum point (Xmax, Ymax) for the central point (Xc, Yc) obtained by simulation is expressed with vectors ( S1-4 in Fig. 21 ) and the resulting obtained distribution is illustrated in Fig. 11. Moreover, the flowchart for obtaining distribution of the displacement information is illustrated in Fig. 21.
- Fig. 11A shows light illumination points 11-1 ; light detection points 11-2; and sampling points 11-3.
- the point (Xc, Yc) is ranged as -15 ⁇ (Xc, Yc) ⁇ 15 and the point (Xmax, Ymax) for the each point (Xc, Yc) within this range has been obtained.
- the starting point of each vector is (Xc, Yc) and the end point thereof corresponds to (Xmax, Ymax), showing the displacement of the topographic image. This result suggests that the displacement of the topographic image shows the following trends:
- the actual brain is different among different individuals in many parameters. For example, different people will have different: thicknesses of each skull, cerebrospinal fluid, and/or cortex layer illustrated in Fig. 6 ; scattering coefficient characteristics for the scattering of light, light absorbing coefficient characteristics for the absorption of light, sizes of activation areas, and changes in the light absorbing coefficient due to brain activation. Therefore, it is necessary to check whether the trends in displacement of the topographic image described in the items (1) to (3) are usually generated among the individuals or not. However, it is difficult to realize the simulation by changing all of the numerous parameters.
- An object of the present invention is therefore to provide a method of compensating for topographic images using the distribution illustrated in Fig. 11 .
- a spatial intensity distribution of the changes in blood volume is generated by detecting brain activation at many sampling points distributed on the scalp of the subject and then conducting spatial compensation.
- a signal intensity distribution of the coordinate having signal intensity which is higher than the predetermined threshold is extracted by performing the threshold process to this signal intensity distribution.
- the information about displacement between the brain activation area generated when the signal intensity distribution is generated and the maximum area of the signal intensity distribution is previously stored to a computer (recording unit) of a living body measurement system, and the signal intensity distribution extracted by the threshold process is compensated by referring to the displacement information stored therein.
- the brain activation area can be estimated with a location accuracy which is higher than the conventionally achieved accuracy, diagnosis for the diseased areas of the brain and medical treatments based on the results of these diagnoses can be realized with improved accuracy.
- a distribution of displacements illustrated in Fig. 11 is initially stored directly within a storage device (e.g., a memory or hard disk drive) provided in a computer 2-5 which includes a display illustrated in Fig. 2. Moreover, this distribution may also be stored in a storage device in the computer 2-5 using an information storage medium such as a CD-ROM.
- a storage device e.g., a memory or hard disk drive
- this distribution may also be stored in a storage device in the computer 2-5 using an information storage medium such as a CD-ROM.
- the present invention includes several methods of compensating for the distribution of displacements illustrated in Fig. 11 and the results obtained from testing various methods are provided herein.
- Fig. 12 illustrates the visualized distribution of displacements of Fig. 11 obtained for the entire part of a measurement area.
- a topographic image is displayed through attraction toward the sampling point 12-1 which is nearest to the central point of the brain activation area.
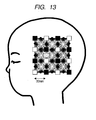
- Fig. 13 is a diagram where an example of the topographic image indicating the brain activation is adhered to the distribution of displacements of Fig. 12.
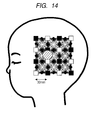
- Fig. 14 The results of compensation for the topographic image illustrated in Fig. 13 based on the method for compensation for the spatially distributed pixels of topographic image in accordance with the distribution of displacements of Fig. 11 are illustrated in Fig. 14.
- Fig. 14 it is shown that the topographic image which is expanded in comparison with the original image of Fig. 13 is displayed. The cause of this expansion will be described with consideration of the distribution of displacements of Fig. 12. From the distribution of displacements, it can be understood that the topographic image is displaced toward the nearest sampling point. From the inverted point of view of this result, it is shown that when the topographic image displayed at the point nearest to the sampling point is compensated, the topographic image is displayed at a point which is far from the sampling point.
- the compensation process is implemented to the topographic image, which is displayed in the manner that the central area of the brain activation area exists at the area near the sampling point and the image is spreading for display to the area near the central point as in the topographic image of Fig. 13, the image is further spread, resulting in a deterioration in the image quality. Accordingly, an algorithm for compensating for the pixels of the topographic image which are spatially distributed in accordance with the distribution of displacements of Fig. 11 is considered to have lower validity than other methods discussed herein.
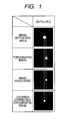
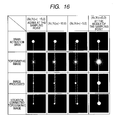
- Fig. 1, Fig. 16 , and Fig. 17 The results of testing the validity of this algorithm are illustrated in Fig. 1, Fig. 16 , and Fig. 17 .
- These figures illustrate (1) the brain activation area, (2) a topographic image indicating a change in blood volume in the brain activation area, (3) the results of a threshold process for the topographic image, and (4) the results of compensating for the location of the topographic image having completed the threshold process on the basis of the distributions of displacements of Fig. 11 and Fig. 12 .
- each figure will be described in detail.
- the central point of the topographic image of step (3) has been compensated in accordance with the distribution of displacements illustrated in Fig. 11 and Fig. 12.
- Fig. 18, Fig. 19, and Fig. 20 illustrate exemplary display images for implementing the algorithm described above.
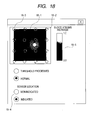
- Fig. 18 is a display image format in which a conventional topographic image is displayed.
- 18-1 designates a displayed topographic image in which the locations of the light source 18-2 and the light detector 18-3 are illustrated. Indicated and non-indicated conditions of locations of these light sources 18-2 and light detectors 18-3 can be selected and indication can be switched with a selection button 18-4.
- a color bar 18-5 for showing the distribution of concentrations of this topographic image is also displayed on the display image to show a clear correspondence between the physical amounts and the colors of the topographic image. This color bar 18-5 has usually been subjected to the gradation process to easily observe the concentration of changes in blood volume.
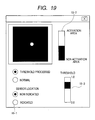
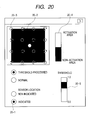
- Fig. 19 and Fig. 20 illustrate an embodiment of the present method of displaying the images compensated by the algorithm illustrated in Fig. 1, Fig. 16, and Fig. 17.
- This display image is referred to as the threshold processing mode.
- Fig. 19 does not show the locations of the light source and light detector, but Fig. 20 displays the locations of the light source 20-2 and the light detector 20-3 through the selecting operations of check boxes 19-1, 20-1.
- 19-2 and 20-4 are color bars for showing the activation area and non-activation area. Unlike the color bar designated as 18-5, these color bars may be displayed with the binary data in place of the gradation display. The display of these color bars represents the display of the areas for activations of the brain.
- 19-3 and 20-5 designate the bars for setting up the threshold for the image processes.
- the threshold is set to 0.9 to form the image with binary data in order to set 1 for the area of the threshold larger than this value and 0 for the area of the threshold not larger than this value.
- a problem is not generated even when the value 0.9 is freely set by a user. For example, when it is desired to observe only the central point of the brain activation area, it is sufficient to set the threshold to 1.0. However, on the contrary, when it is desired to remove a little of the "blur" of the topographic image, it is sufficient to set the threshold to a value near 0.0. As a result, a user is able to select the desired image display method.
- the present invention includes a computer program utilized in a living body light measurement system for measuring the inside of a subject by illuminating a plurality of areas of the subject with the light and detecting the light propagated within the subject at a plurality of areas of the subject.
- the computer program preferably causes a general purpose computer to carry out the following steps:
Landscapes
- Health & Medical Sciences (AREA)
- Life Sciences & Earth Sciences (AREA)
- Physics & Mathematics (AREA)
- Heart & Thoracic Surgery (AREA)
- Molecular Biology (AREA)
- Spectroscopy & Molecular Physics (AREA)
- Biophysics (AREA)
- Pathology (AREA)
- Engineering & Computer Science (AREA)
- Biomedical Technology (AREA)
- Neurology (AREA)
- Medical Informatics (AREA)
- Optics & Photonics (AREA)
- Surgery (AREA)
- Animal Behavior & Ethology (AREA)
- General Health & Medical Sciences (AREA)
- Public Health (AREA)
- Veterinary Medicine (AREA)
- Measurement Of The Respiration, Hearing Ability, Form, And Blood Characteristics Of Living Organisms (AREA)
- Investigating Or Analysing Materials By Optical Means (AREA)
Abstract
Description

Therefore, a method of assessing the location accuracy will be described by referring to Fig. 10. The brain activation area 10-3 indicated as 6-4 in Fig. 6 is established for eight light illumination points 10-1 and eight light detection points 10-2 at the upper side of the skull (Fig. 10A). The central location of the brain activation area is defined as (Xc, Yc). A change in the degree of light absorption at the 24 sampling points 10-4 is obtained with the computer simulation for this brain activation area. The distribution of the changes in light absorption degree is then visualized as a topographic image 10-5 (Fig. 10B). The maximum point which is of the most interest to users of the system among the topographic image is defined as (Xmax, Ymax), and this maximum point has been obtained.
In the arrangement of the light source and the light detector illustrated in Fig. 10 (measurement area = 90 mm × 90 mm), a brain activation area with a diameter of 15 mm has been set at the inside of the measurement area. The size of this activation area with a diameter of 15 mm corresponds, for example, to the size of a human finger motor (the brain function existing on the cortex for controlling the motor function of the fingers).
The topographic image indicating the brain activation at the brain activation area described in step (1) has been generated with computer simulation. More concretely, changes in the degree of light absorption at the preset brain activation area are detected at the 24 sampling points illustrated in Fig. 4, and the spatial distributions of such changes are visualized as an image with the interpolation process.
With the threshold process, the topographic image described in step (2) is displayed as a binary data image. In this embodiment, the topographic image of step (2) is standardized by 1 to obtain the binary data image wherein the area having a value of at least 0.9 is defined as 1, and the area having any other values is defined as 0.
Claims (14)
- A living body light measurement system, comprising:a plurality of light sources (11-1) for illuminating a subject with light;a plurality of light detectors (11-2) for detecting the light illuminated from said plurality of light sources after said light is propagated through the subject;a first arithmetic unit for generating a first signal intensity distribution for said subject based on the light signal detected with said plurality of light detectors (11-2);a second arithmetic unit for executing a threshold process to generate a second signal intensity distribution for signal intensities which are at least equal to a predetermined threshold for signal intensity distribution;a recording unit for storing data which defines a displacement between a brain activation area and a maximal location of the signal intensity distribution which is generated when said first arithmetic unit generates the first signal intensity distribution, wherein location information for said plurality of light sources (11-1) and plurality of light detectors (11-2) is obtained before said first signal intensity distribution is generated; anda third arithmetic unit for generating a third signal intensity distribution which utilizes the data stored in the recording unit to compensate for the displacement for the threshold-processed second signal intensity distribution.
- The living body light measurement system according to Claim 1, further comprising:a display unit for displaying the third signal intensity distribution.
- The living body light measurement system according to Claim 1 or 2, further comprising:a setting unit for setting said threshold.
- The living body light measurement system according to any of the preceding claims, wherein said plurality of light sources (11-1) and said plurality of light detectors (11-2) are alternately located in the form of a lattice.
- The living body light measurement system according to any of the preceding claims, further comprising:a setting unit for selecting whether to display the third signal intensity distribution or the second signal intensity distribution.
- A living body light measurement system comprising:a plurality of light sources (11-1) for illuminating a subject with light;a plurality of light detectors (11-2) for detecting the light illuminated from said plurality of light sources after said light is propagated through the subject;a first arithmetic unit for generating a first signal intensity distribution for said subject based on the light signal detected with said plurality of light detectors;a second arithmetic unit for executing a threshold process to generate a second signal intensity distribution for signal intensities which are at least equal to a predetermined threshold for signal intensity distribution;a recording unit for storing data which defines a displacement between a brain activation area and a maximal location of the signal intensity distribution which is generated when said first arithmetic unit generates the first signal intensity distribution; anda third arithmetic unit for generating a third signal intensity distribution which utilizes the data stored in the recording unit to compensate for the displacement for the threshold-processed second signal intensity distribution.
- The living body light measurement system according to Claim 6, further comprising:a display unit for displaying the third signal intensity distribution.
- The living body light measurement system according to Claim 6, further comprising:a setting unit for setting said threshold.
- The living body light measurement system according to Claim 6 or 7, wherein said plurality of light sources (11-1) and said plurality of light detectors (11-2) are alternately located in the form of a lattice.
- The living body light measurement system according to any of Claims 6 to 9, further comprising:a setting unit for selecting whether to display the third signal intensity distribution or the second signal intensity distribution.
- A signal processing method, utilized for a living body light measurement system for measuring an inside of a subject by illuminating light to a plurality of areas of the subject and detecting the light propagated through the inside of the subject, said method comprising the steps of:generating data, from a computer simulation, of the displacement between a brain activation area and a maximal location of signal intensity distribution on the subject generated on the basis of the light signal detected at said plurality of areas;illuminating the light to said plurality of areas of the subject;detecting the light illuminated to the subject and propagated through the inside of the subject;generating a first signal intensity distribution of the subject on the basis of the detected light;executing a threshold process to generate a second signal intensity distribution of intensities which are at least equal to a predetermined threshold; andcompensating for a displacement based on the data generated from the computer simulation and creating a third threshold-processed signal intensity distribution.
- The signal processing method according to Claim 11, further comprising a step of:displaying the third signal intensity distribution.
- The signal processing method according to Claim 11 or 12, wherein the threshold is a variable value which can be set by a user.
- The signal processing method according to any of Claims 11 to 13, wherein said plurality of locations for the illumination of the light and a plurality of locations for detection of the light are alternately located in the form of a lattice.
Applications Claiming Priority (2)
| Application Number | Priority Date | Filing Date | Title |
|---|---|---|---|
| JP2004050741 | 2004-02-26 | ||
| JP2004050741A JP4379150B2 (en) | 2004-02-26 | 2004-02-26 | Biological light measuring device and signal processing method |
Publications (1)
| Publication Number | Publication Date |
|---|---|
| EP1568312A1 true EP1568312A1 (en) | 2005-08-31 |
Family
ID=34747487
Family Applications (1)
| Application Number | Title | Priority Date | Filing Date |
|---|---|---|---|
| EP04030743A Withdrawn EP1568312A1 (en) | 2004-02-26 | 2004-12-23 | Living body light measurement system and signal processing method |
Country Status (4)
| Country | Link |
|---|---|
| US (1) | US7171250B2 (en) |
| EP (1) | EP1568312A1 (en) |
| JP (1) | JP4379150B2 (en) |
| CN (1) | CN1660017A (en) |
Families Citing this family (9)
| Publication number | Priority date | Publication date | Assignee | Title |
|---|---|---|---|---|
| JP4517111B2 (en) * | 2004-06-07 | 2010-08-04 | 独立行政法人情報通信研究機構 | Brain function measuring device, brain function measuring method, and brain function measuring program |
| JP5094326B2 (en) * | 2007-10-18 | 2012-12-12 | 株式会社日立製作所 | Biological measuring device |
| US20100004518A1 (en) | 2008-07-03 | 2010-01-07 | Masimo Laboratories, Inc. | Heat sink for noninvasive medical sensor |
| US9339191B2 (en) * | 2008-07-08 | 2016-05-17 | Hitachi, Ltd. | Optical measurement apparatus |
| US8630691B2 (en) | 2008-08-04 | 2014-01-14 | Cercacor Laboratories, Inc. | Multi-stream sensor front ends for noninvasive measurement of blood constituents |
| EP2347708A4 (en) * | 2008-10-17 | 2013-12-18 | Sysmex Corp | Monitoring device for living body |
| JP6186915B2 (en) * | 2013-06-14 | 2017-08-30 | コニカミノルタ株式会社 | Multi-angle colorimeter |
| RU2533968C1 (en) * | 2013-12-27 | 2014-11-27 | Владимир Владимирович Щедренок | Method for determining intracerebral growth volume |
| JP6217847B2 (en) * | 2014-05-20 | 2017-10-25 | 株式会社島津製作所 | Optical measurement system and optical brain function measurement method |
Family Cites Families (3)
| Publication number | Priority date | Publication date | Assignee | Title |
|---|---|---|---|---|
| US5853370A (en) * | 1996-09-13 | 1998-12-29 | Non-Invasive Technology, Inc. | Optical system and method for non-invasive imaging of biological tissue |
| US5803909A (en) * | 1994-10-06 | 1998-09-08 | Hitachi, Ltd. | Optical system for measuring metabolism in a body and imaging method |
| JP3839202B2 (en) * | 1999-10-28 | 2006-11-01 | 株式会社日立製作所 | Biological light measuring device and program for causing this device to function |
-
2004
- 2004-02-26 JP JP2004050741A patent/JP4379150B2/en not_active Expired - Lifetime
- 2004-12-14 US US11/010,668 patent/US7171250B2/en not_active Expired - Fee Related
- 2004-12-23 EP EP04030743A patent/EP1568312A1/en not_active Withdrawn
-
2005
- 2005-01-17 CN CN2005100023112A patent/CN1660017A/en active Pending
Non-Patent Citations (3)
| Title |
|---|
| MAKI A ET AL: "SPATIAL AND TEMPORAL ANALYSIS OF HUMAN MOTOR ACTIVITY USING NONINVASIVE NIR TOPOGRAPHY", MEDICAL PHYSICS, AMERICAN INSTITUTE OF PHYSICS. NEW YORK, US, vol. 22, no. 12, 1 December 1995 (1995-12-01), pages 1997 - 2005, XP000550635, ISSN: 0094-2405 * |
| T. KADOYA ET AL.: "Phantom experiment on relationship between activated position of cerebral cortex and and NIR signal", PROCEEDINGS OF SPIE, vol. 4250, 2001, pages 558 - 565, XP002333740 * |
| T. YAMA MOTO ET AL.: "Arranging optical fibres for the spatial resolution improvement of topographical images", PHYS. MED. BIOL, vol. 47, 5 September 2002 (2002-09-05), pages 3429 - 3440, XP002333741 * |
Also Published As
| Publication number | Publication date |
|---|---|
| CN1660017A (en) | 2005-08-31 |
| US7171250B2 (en) | 2007-01-30 |
| JP4379150B2 (en) | 2009-12-09 |
| US20050192490A1 (en) | 2005-09-01 |
| JP2005237618A (en) | 2005-09-08 |
Similar Documents
| Publication | Publication Date | Title |
|---|---|---|
| Abdelnour et al. | Real-time imaging of human brain function by near-infrared spectroscopy using an adaptive general linear model | |
| Khan et al. | Improving optical contact for functional near‑infrared brain spectroscopy and imaging with brush optodes | |
| Billino et al. | Differential aging of motion processing mechanisms: Evidence against general perceptual decline | |
| Saager et al. | Measurement of layer-like hemodynamic trends in scalp and cortex: implications for physiological baseline suppression in functional near-infrared spectroscopy | |
| Gow Jr et al. | Lexical influences on speech perception: a Granger causality analysis of MEG and EEG source estimates | |
| EP2120684B1 (en) | High performance imaging system for diffuse optical tomography and associated method of use | |
| Hu et al. | Recognition of stimulus-evoked neuronal optical response by identifying chaos levels of near-infrared spectroscopy time series | |
| JP3877959B2 (en) | Skin color measuring device and skin image processing device | |
| Aqil et al. | Cortical brain imaging by adaptive filtering of NIRS signals | |
| KR101703547B1 (en) | Method and apparatus for estimating effective channel of functional near-infrared spectroscopy | |
| Kamran et al. | Differential path-length factor's effect on the characterization of brain's hemodynamic response function: a functional near-infrared study | |
| Caredda et al. | Intraoperative quantitative functional brain mapping using an RGB camera | |
| EP1568312A1 (en) | Living body light measurement system and signal processing method | |
| Cai et al. | Diffuse optical reconstructions of functional near infrared spectroscopy data using maximum entropy on the mean | |
| Shu et al. | Monte Carlo investigation on quantifying the retinal pigment epithelium melanin concentration by photoacoustic ophthalmoscopy | |
| Medvedev et al. | Functional connectivity in the prefrontal cortex measured by near-infrared spectroscopy during ultrarapid object recognition | |
| US11678833B2 (en) | Brain activity feature amount extraction method | |
| Medvedev et al. | “Seeing” electroencephalogram through the skull: imaging prefrontal cortex with fast optical signal | |
| Ferber et al. | Are perceptual judgments dissociated from motor processes?—A prism adaptation study | |
| Hernández-Martin et al. | Comparing diffuse optical tomography and functional magnetic resonance imaging signals during a cognitive task: pilot study | |
| JP4543774B2 (en) | Biological light measurement device | |
| JP5658979B2 (en) | Biological light measuring device and method for estimating fluctuation of absorption coefficient in living body | |
| Dong et al. | Process-specific analysis in episodic memory retrieval using fast optical signals and hemodynamic signals in the right prefrontal cortex | |
| Liu et al. | Suppressing physiological interferences and physical noises in functional diffuse optical tomography via tandem inversion filtering and LSTM classification | |
| JP7503338B2 (en) | Brain function measuring device and brain function measuring method |
Legal Events
| Date | Code | Title | Description |
|---|---|---|---|
| PUAI | Public reference made under article 153(3) epc to a published international application that has entered the european phase |
Free format text: ORIGINAL CODE: 0009012 |
|
| AK | Designated contracting states |
Kind code of ref document: A1 Designated state(s): AT BE BG CH CY CZ DE DK EE ES FI FR GB GR HU IE IS IT LI LT LU MC NL PL PT RO SE SI SK TR |
|
| AX | Request for extension of the european patent |
Extension state: AL BA HR LV MK YU |
|
| 17P | Request for examination filed |
Effective date: 20051219 |
|
| AKX | Designation fees paid |
Designated state(s): DE FR GB IT |
|
| 17Q | First examination report despatched |
Effective date: 20090116 |
|
| STAA | Information on the status of an ep patent application or granted ep patent |
Free format text: STATUS: THE APPLICATION IS DEEMED TO BE WITHDRAWN |
|
| 18D | Application deemed to be withdrawn |
Effective date: 20090527 |