EP1536359A2 - Equipment for the generation of chronographic maps. - Google Patents

Equipment for the generation of chronographic maps. Download PDF

Info

Publication number
EP1536359A2
EP1536359A2 EP04021177A EP04021177A EP1536359A2 EP 1536359 A2 EP1536359 A2 EP 1536359A2 EP 04021177 A EP04021177 A EP 04021177A EP 04021177 A EP04021177 A EP 04021177A EP 1536359 A2 EP1536359 A2 EP 1536359A2
Authority
EP
European Patent Office
Prior art keywords
time
display
activity
map
activities
Prior art date
Legal status (The legal status is an assumption and is not a legal conclusion. Google has not performed a legal analysis and makes no representation as to the accuracy of the status listed.)
Ceased
Application number
EP04021177A
Other languages
German (de)
French (fr)
Other versions
EP1536359A3 (en
Inventor
Stefano Stabilini
Marco Albini
Sandra Bonfiglioli
Gian Piero Calza
Cesare Stevan
Roberto Zedda
Current Assignee (The listed assignees may be inaccurate. Google has not performed a legal analysis and makes no representation or warranty as to the accuracy of the list.)
Politecnico di Milano
Original Assignee
Politecnico di Milano
Priority date (The priority date is an assumption and is not a legal conclusion. Google has not performed a legal analysis and makes no representation as to the accuracy of the date listed.)
Filing date
Publication date
Application filed by Politecnico di Milano filed Critical Politecnico di Milano
Publication of EP1536359A2 publication Critical patent/EP1536359A2/en
Publication of EP1536359A3 publication Critical patent/EP1536359A3/en
Ceased legal-status Critical Current

Links

Images

Classifications

    • GPHYSICS
    • G06COMPUTING OR CALCULATING; COUNTING
    • G06TIMAGE DATA PROCESSING OR GENERATION, IN GENERAL
    • G06T17/00Three-dimensional [3D] modelling for computer graphics
    • G06T17/05Geographic models
    • GPHYSICS
    • G06COMPUTING OR CALCULATING; COUNTING
    • G06TIMAGE DATA PROCESSING OR GENERATION, IN GENERAL
    • G06T11/00Two-dimensional [2D] image generation
    • G06T11/20Drawing from basic elements
    • G06T11/26Drawing of charts or graphs

Definitions

  • This invention relates to equipment for the generation of chronographic maps in accordance with the precharacterising clause of claim 1.
  • this invention relates to equipment for the generation of chronographic maps which is applicable in the field of the management, organisation and planning of public policies, specific time-based urban policies.
  • GIS geographical information systems
  • chronographic maps which in addition to the usual cartographic information make it possible to have available additional information relating to the area in question. For example, from an analysis of a map generated in this way it is possible to obtain information relating to the population density per km 2 for the specific area of interest, or the number of persons living in that area.
  • the map is generated by positioning graphic elements distributed in various ways according to the information data represented, for example the value for the population density, the number of persons living in the area, and the like, on the chronographic base map. Through the use of an appropriate key the user can evaluate the information not as it stands, but in relation to the specific area of interest.
  • chronographic mapping of the type described above does not allow acess to information relating to events which take place over time, for example the flow of persons in a particular area, the flow of passengers on public transport, the opening up and closing down of commercial businesses, the start and end of cultural events, displays and so on.
  • the object of this invention is to provide equipment for the generation of chronographic maps having structural and functional characteristics such as to satisfy the abovementioned requirements and at the same time to overcome the disadvantages mentioned with reference to the known art.
  • 1 generically indicates equipment for the generation of a chronographic map ⁇ according to this invention.
  • chronographic map used in this invention refers to any topographical representation on which an area of territory or an area of interest is graphically represented in a detailed way using conventional signs, or in which a map of urban times are represented graphically.
  • on-off activity used in this invention relates to phenomena which can be in two different states in the course of time, such as commercial businesses or activities, cultural events, public offices and the like.
  • dynamic activity used in this invention relates to phenomena which can be represented by a plurality of values which vary over time.
  • each value varying over time corresponds to a flow of an item, such as for example a flow of persons entering/leaving an underground station, a flow of public transport corresponding to a particular station, a flow of persons entering/leaving a shopping centre and so on measured at a predetermined instant in time corresponding to a spatial position identified within the area.
  • Equipment 1 comprises a display screen 2 capable of displaying chronographic map ⁇ , memory means 3 capable of memorising a pair of Cartesian coordinates and a plurality of time-based data for each activity.
  • memory means 3 comprise a mass memory, such as for example a hard disk, a memory of the RAM type, etc.
  • Each pair of Cartesian coordinates can be associated with chronographic map ⁇ and represent the geographical position of the activity.
  • Corresponding pairs of Cartesian coordinates Sx i , Sy i are defined in the case of on-off activities SA i , while in the case of dynamic activities DA k corresponding pairs of Cartesian coordinates Dx k , Dy k are defined.
  • time-based data for each on-off activity SA i stored in memory means 3 comprise a time for the start of the activity Ton i and a time for the end of the activity Toffi.
  • the start time for the activity Ton i and the end time Toff i can represent the opening and closing times of a commercial business, or the days on which a fair opens and closes, respectively, and so on. It is important to note that a particular on-off activity can open and close several times in the course of one day. In this case on-off activity SA i is repeated as many times as there are opening and closing times.
  • a value F k (TS 1 ) representing the flow of the item considered is sampled at successive sampling times TS 1 .
  • a flow datum is sampled at a well-identified sampling time TS 1 , its value is not necessarily representative of the dynamic activity DA k and time TS 1 , but may correspond to a value of the flow in the entity F k (TS 1 ) measured during the time interval ⁇ T preceding the sampling time TS 1 .
  • ⁇ T is equal to TS 1 -TS 1-1 .
  • the value of the flow of entity F k (TS 1 ) sampled at instant TS 1 takes into account the measurement made between the preceding time TS 1-1 and the present time TS 1 .
  • a datum for the flow of an entity F k may for example represent the number of persons entering/leaving an underground station sampled at time TS 1 and measured over a period of time ⁇ T preceding that time TS 1 , or the number of means of public transport which pass a particular station sampled at time TS 1 and measured over a period of time ⁇ T preceding that time TS 1 .
  • Equipment 1 also comprises a graphic interface 5 which is capable of displaying a graphic element SI corresponding to the respective pair of Cartesian coordinates for the activity, on the display screen, for each activity at every display time T j for the map.
  • selection means 4 take the form of a keyboard and a mouse.
  • graphic interface 5 can display only on-off activities SA i or only dynamic activities DA k alternately, or both at the same time. With this object, through selection means 4 it is possible to select those activities from the plurality of activities which are to be displayed on the map.
  • Graphic interface 5 may also display a cursor of the type known in IT applications to permit a user to check the selections made via selection means 4.
  • the cursor may be an arrow or another graphic symbol suitable for the purpose.
  • Graphic interface 5 may also display additional information such as for example date, time and other information which will be described in greater detail below.
  • the equipment finally includes processing means 6 capable of processing at least one datum in the plurality of time data at each display time T j in order to switch graphic element SI between at least two different forms of display.
  • the map generated by equipment 1 may be defined dynamically, where the term dynamic relates to the variability in what the map displays over time, or the display of the graphic elements SI associated with each activity.
  • processing means 6 and memory means 3 are installed in a processor device 7 so as to render equipment 1 more compact and easier to use.
  • Each on-off activity SA 1 may adopt two different states, STATE, depending upon whether it is open or closed at a particular display time T j .
  • STATE the state in which associated graphic element SI is displayed is switched depending upon the STATE status of the activity.
  • Graphic element SI is for example a coloured circle, whose first and second forms of display differ by the colour assigned to the circle.
  • dynamic activities DA k are not defined by an activity status.
  • memory means 3 place flow data for entity F k (TS 1 ) sampled at successive sampling times TS 1 in memory. The manner in which graphic element SI associated with it is displayed is switched depending upon the value of the flow datum F k (TS 1 ) for dynamic activity DA k .
  • this object processing means 6 compare the sampling times TS 1 and the display time T j for each display time T j and each dynamic activity DA k in order to identify the flow datum for entity F k (TS 1 ) corresponding to display time T j in order to switch graphic element SI between a plurality of display forms depending upon the value of flow datum F k (TS 1 ) or dynamic activity DA k .
  • the plurality of display forms of graphic element SI differ from each other in size.
  • the map displays six different ranges of flow data to which six different forms of display of graphic element SI, in the example a circle, correspond, which differ in the diameter of the circle.
  • the time-based data for the activities are stored in memory in the form of tables ( Figures 3 and 4).
  • the time-based data Ton i , Toffi for on-off activities SA i are stored in a table which is structured differently from that used for dynamic activities DA k . This difference is due to the different natures of the activities, one of which can be identified through two different states, the other through the plurality of values for data flows.
  • equipment 1 is read to accept commands from the user through selection means 4.
  • the initial screen for graphic interface 5 displays a series of icons from which it is possible to open and close a plurality of display windows (Figure 5).
  • the user opens the window "Map Setting: Themes” which displays two boxes: the “Static Themes” box is designed to include the list of static themes, while the “Time-dependent Themes” box is designed to display the activities selected from the “Static Themes” box for which the cartographic representation is to vary over time ( Figure 6), that is the activities for which dynamic representation is desired.
  • Figure 10 shows the change over time of an example of a chronographic map generated by equipment 1 and displayed at successive display times T j .
  • the graphic elements SI for on-off activities SA i switch between the two on-off forms of display while graphic elements SI for dynamic activities DA k switch between the six different forms of display having different diameters according to the flow datum F k (TS 1 ) relating to the display time T j considered.
  • the animation ends when display time T j coincides with the end time T end .
  • the equipment for the generation of a dynamic map according to this invention makes it possible to satisfy the abovementioned requirements and at the same time to overcome the disadvantages mentioned in the introductory part of this description in reference to the known art.

Landscapes

  • Physics & Mathematics (AREA)
  • Engineering & Computer Science (AREA)
  • General Physics & Mathematics (AREA)
  • Theoretical Computer Science (AREA)
  • Geometry (AREA)
  • Software Systems (AREA)
  • Remote Sensing (AREA)
  • Computer Graphics (AREA)
  • Management, Administration, Business Operations System, And Electronic Commerce (AREA)
  • Instructional Devices (AREA)

Abstract

Equipment (1) for the generation of a chronographic map (£) for an area having a plurality of activities comprising a display screen (2) to display the map (£), memory means (3) to place a pair of Cartesian coordinates and a plurality of time-based data in memory, selection means (4) to select a display period (T start , T end ) and an updating interval (T update ) for the dynamic map (£) so as to define a plurality of display times (T j ). Equipment (1) also comprises a graphic interface (5) to display a corresponding graphic element (SI) on display screen (2) for every display time (T j ) for every activity, and processing means (6) to process at least one time-dependent datum with the display time (T j ) to switch the graphic element (SI) between at least two different forms of display.

Description

This invention relates to equipment for the generation of chronographic maps in accordance with the precharacterising clause of claim 1.
In particular this invention relates to equipment for the generation of chronographic maps which is applicable in the field of the management, organisation and planning of public policies, specific time-based urban policies.
Systems for the generation of cartographic maps in which a plurality of information relating to a specific geographical area of interest is represented are known. These systems, known as geographical information systems (GIS), are capable of relating information of a cartographic type for a particular geographical area with information relating to phenomena present within the area. In this way it is possible to generate chronographic maps which in addition to the usual cartographic information make it possible to have available additional information relating to the area in question. For example, from an analysis of a map generated in this way it is possible to obtain information relating to the population density per km2 for the specific area of interest, or the number of persons living in that area. The map is generated by positioning graphic elements distributed in various ways according to the information data represented, for example the value for the population density, the number of persons living in the area, and the like, on the chronographic base map. Through the use of an appropriate key the user can evaluate the information not as it stands, but in relation to the specific area of interest.
For this reason these maps are widely used as a tool for organising and planning land policy for urban development, for example, but not only, by local authorities.
However, chronographic mapping of the type described above does not allow acess to information relating to events which take place over time, for example the flow of persons in a particular area, the flow of passengers on public transport, the opening up and closing down of commercial businesses, the start and end of cultural events, displays and so on.
Whenever it is necessary to have the abovementioned information, existing chronographic maps are only capable of instantaneously "photographing" the situation, but not of showing the change in the phenomenon over time.
As a consequence there has been felt an appreciable need to have chronographic maps which make it possible to represent phenomena or events relating to a specific geographical area dynamically in time and space.
The object of this invention is to provide equipment for the generation of chronographic maps having structural and functional characteristics such as to satisfy the abovementioned requirements and at the same time to overcome the disadvantages mentioned with reference to the known art.
This object is achieved by equipment for the generation of chronographic maps according to claim 1.
Further features and advantages of the equipment for the generation of dynamic chronographic maps according to this invention will be apparent from the description of a preferred embodiment thereof described below, provided purely indicatively and without restriction, with reference to the appended figures, in which:
  • Figure 1 shows a diagram of equipment for the generation of dynamic chronographic maps according to this invention,
  • Figure 2 shows a detail of the diagram of the equipment in Figure 1,
  • Figures 3 and 4 illustrate structures for storing data in memory,
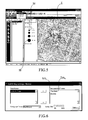
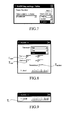
  • Figures 5 to 9 show an embodiment of the graphic interface of the equipment in Figure 1, and
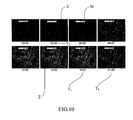
  • Figure 10 shows chronographic maps displayed by the graphic interface at different times during display.
With reference to the appended figures, 1 generically indicates equipment for the generation of a chronographic map Σ according to this invention.
The term chronographic map used in this invention refers to any topographical representation on which an area of territory or an area of interest is graphically represented in a detailed way using conventional signs, or in which a map of urban times are represented graphically.
The remainder of the description will be made with non-restrictive reference to equipment for the generation of a chronographic map Σ for an urban area, notwithstanding the possibility of generating chronographic maps for a non-urban area, such as for example airports, seaports or river ports, industrial areas, fairgrounds, playing fields and the like.
The urban area comprises a plurality of activities within which it is possible to distinguish N on-off activities SAi, where i = 1 ... N, and M dynamic activities DAk, where k = 1 ... M.
The term on-off activity used in this invention relates to phenomena which can be in two different states in the course of time, such as commercial businesses or activities, cultural events, public offices and the like. For example a commercial business may be open (state = ON) or closed (state = OFF) within the period of time of a day depending upon the instant of time considered.
The term dynamic activity used in this invention relates to phenomena which can be represented by a plurality of values which vary over time. In other words each value varying over time corresponds to a flow of an item, such as for example a flow of persons entering/leaving an underground station, a flow of public transport corresponding to a particular station, a flow of persons entering/leaving a shopping centre and so on measured at a predetermined instant in time corresponding to a spatial position identified within the area.
Equipment 1 comprises a display screen 2 capable of displaying chronographic map Σ, memory means 3 capable of memorising a pair of Cartesian coordinates and a plurality of time-based data for each activity. In accordance with a preferred embodiment, memory means 3 comprise a mass memory, such as for example a hard disk, a memory of the RAM type, etc.
Each pair of Cartesian coordinates can be associated with chronographic map Σ and represent the geographical position of the activity. Corresponding pairs of Cartesian coordinates Sxi, Syi are defined in the case of on-off activities SAi, while in the case of dynamic activities DAk corresponding pairs of Cartesian coordinates Dxk, Dyk are defined.
In accordance with the preferred embodiment the time-based data for each on-off activity SAi stored in memory means 3 comprise a time for the start of the activity Toni and a time for the end of the activity Toffi.
The start time for the activity Toni and the end time Toffi can represent the opening and closing times of a commercial business, or the days on which a fair opens and closes, respectively, and so on. It is important to note that a particular on-off activity can open and close several times in the course of one day. In this case on-off activity SAi is repeated as many times as there are opening and closing times.
In accordance with the preferred embodiment, for each dynamic activity DAk a value Fk(TS1) representing the flow of the item considered is sampled at successive sampling times TS1.
It should be pointed out that although a flow datum is sampled at a well-identified sampling time TS1, its value is not necessarily representative of the dynamic activity DAk and time TS1, but may correspond to a value of the flow in the entity Fk(TS1) measured during the time interval ΔT preceding the sampling time TS1.
According to a preferred embodiment ΔT is equal to TS1-TS1-1. In this way the value of the flow of entity Fk(TS1) sampled at instant TS1 takes into account the measurement made between the preceding time TS1-1 and the present time TS1.
A datum for the flow of an entity Fk (TS1) may for example represent the number of persons entering/leaving an underground station sampled at time TS1 and measured over a period of time ΔT preceding that time TS1, or the number of means of public transport which pass a particular station sampled at time TS1 and measured over a period of time ΔT preceding that time TS1.
Equipment 1 also comprises selection means 4 which are capable of selecting a display interval, Tstart,..., Tend and a chronographic map update time Tupdate to define a plurality of a display instants Tj where
Figure 00070001
   where T1 = Tstart and Tp = Tend .
In this way it is possible to set the display time window for the map generated and the map updating period, that is the frequency with which the map is updated.
Equipment 1 also comprises a graphic interface 5 which is capable of displaying a graphic element SI corresponding to the respective pair of Cartesian coordinates for the activity, on the display screen, for each activity at every display time Tj for the map.
The management of graphic interface 5 is aided by the use of selection means 4. According to a preferred embodiment selection means 4 take the form of a keyboard and a mouse.
It should be noted that graphic interface 5 can display only on-off activities SAi or only dynamic activities DAk alternately, or both at the same time. With this object, through selection means 4 it is possible to select those activities from the plurality of activities which are to be displayed on the map.
Graphic interface 5 may also display a cursor of the type known in IT applications to permit a user to check the selections made via selection means 4. The cursor may be an arrow or another graphic symbol suitable for the purpose.
Graphic interface 5 may also display additional information such as for example date, time and other information which will be described in greater detail below.
The equipment finally includes processing means 6 capable of processing at least one datum in the plurality of time data at each display time Tj in order to switch graphic element SI between at least two different forms of display.
It follows that as the display time Tj for the map varies, the manner of display of graphic element SI associated with each activity, or the chronographic map on which graphic elements SI are displayed, varies. As a consequence the map generated by equipment 1 according to the invention may be defined dynamically, where the term dynamic relates to the variability in what the map displays over time, or the display of the graphic elements SI associated with each activity.
In accordance with a preferred embodiment, processing means 6 and memory means 3 are installed in a processor device 7 so as to render equipment 1 more compact and easier to use.
Each on-off activity SA1 may adopt two different states, STATE, depending upon whether it is open or closed at a particular display time Tj. The manner in which associated graphic element SI is displayed is switched depending upon the STATE status of the activity.
In order to determine the status of each on-off activity SAi at each display time Tj, processing means 6 carries out a comparison between at least one of the time-based data for on-off activity SAi and display time Tj in question for each on-off activity SAi and for each display time Tj.
In particular, if display time Tj lies between the activity's start time Toni and the end time Toffi for an on-off activity SAi, then the processing means associate an activity status STATE=ON for this on-off activity SAi, and a first display form of graphic element SI corresponds to this. If instead display time Tj is less than the activity start time Toni or greater than the activity end time Toffi, then the processing means associates an activity status STATE=OFF, to which a second different form of display of graphic element SI corresponds, for this on-off activity SAi.
Graphic element SI is for example a coloured circle, whose first and second forms of display differ by the colour assigned to the circle.
Unlike what has been stated above relating to activities of the on-off type, dynamic activities DAk are not defined by an activity status. As previously stated, for each dynamic activity DAk memory means 3 place flow data for entity Fk(TS1) sampled at successive sampling times TS1 in memory. The manner in which graphic element SI associated with it is displayed is switched depending upon the value of the flow datum Fk (TS1) for dynamic activity DAk.
With this object processing means 6 compare the sampling times TS1 and the display time Tj for each display time Tj and each dynamic activity DAk in order to identify the flow datum for entity Fk (TS1) corresponding to display time Tj in order to switch graphic element SI between a plurality of display forms depending upon the value of flow datum Fk (TS1) or dynamic activity DAk.
Preferably, a different form of display for graphic element SI is associated with a value range of flow data Fk(TS1). In this way a predetermined number of different forms of display of graphic element SI are associated with a corresponding number of different ranges for the flow data values Fk(TS1).
Preferably the plurality of display forms of graphic element SI differ from each other in size. In the example described here and as illustrated in Figures 5 and 10, the map displays six different ranges of flow data to which six different forms of display of graphic element SI, in the example a circle, correspond, which differ in the diameter of the circle.
The function of equipment 1 according to the invention will be described below on the basis of an initial situation in which pairs of Cartesian coordinates and a plurality of time data relating to activities are stored in memory 3.
According to a preferred embodiment, the time-based data for the activities are stored in memory in the form of tables (Figures 3 and 4). In the example illustrated in the figure the time-based data Toni, Toffi for on-off activities SAi are stored in a table which is structured differently from that used for dynamic activities DAk. This difference is due to the different natures of the activities, one of which can be identified through two different states, the other through the plurality of values for data flows.
Time-based data for activities are partly provided by conventional sources (local authorities, category associations, etc.) and are partly obtained by specialised personnel located in the areas in which the activities in question take place.
Alternatively it is possible to provide for the use of remote data acquisition systems through which the various activities can be monitored and corresponding data can be stored in the memory of equipment 1.
Once all the data relating to the activities considered have been stored in the memory of memory means 3, equipment 1 is read to accept commands from the user through selection means 4.
In a manner which is in itself known, the hardware interface, which is not shown in the figures, places selection means 4 in communication with graphic interface 5 in such a way as to enable the user to control his selections on display screen 2.
The remainder of the description makes reference in a non-restrictive way to a preferred embodiment of graphic interface 5.
In order to generate a dynamic chronographic map a user using equipment 1 according to the invention must necessarily carry out a minimum series of operations. Performance of these operations is enabled through graphic interface 5 which displays the selections made by the user on screen 2.
The initial screen for graphic interface 5 displays a series of icons from which it is possible to open and close a plurality of display windows (Figure 5).
First of all the activities which are to be used to generate the dynamic map are selected from those available in memory 3. It should be pointed out that some activities can be selected in static mode so as to define a static theme for the map. In other words, graphic elements SI associated with these activities do not vary in their manner of display over time.
In what follows it is assumed that initially all the activities are included in static themes and that subsequently the user selects those which are to be used for the dynamic map. Alternatively all the activities may have already been selected for dynamic display.
In order to make the abovementioned selection the user opens the window "Map Setting: Themes" which displays two boxes: the "Static Themes" box is designed to include the list of static themes, while the "Time-dependent Themes" box is designed to display the activities selected from the "Static Themes" box for which the cartographic representation is to vary over time (Figure 6), that is the activities for which dynamic representation is desired.
Subsequently the user opens the "Map Settings: Tables" window to select the relative memory position for each selected activity in which the corresponding time data are present (Figure 7).
In the example the name of a file containing the time-based data and the time data necessary for generation of the dynamic map, stored in the form of a table (Figures 3 and 4), are selected. For each table it is necessary to select the type of structure in which the data for the activities are stored in memory. As has been seen previously, it is preferable to use different structures for on-off activities SAi and dynamic activities DAk.
After the tables from which the time-based data for the activities are to be taken have been selected, it is necessary to set the display window Tstart, Tend and the map updating period Tupdate.
With this object the user opens the "On/Off" dialogue window and through selection means 4 first selects the length of time "Time extent" for display of the dynamic map, for example a year, month, day (Figure 8). Subsequently the user selects the start time Tstart from the "Start" box and the end time Tend from the "End" box. If the period of time selected is one year, the start and end days and months are selected, if the period is one day, the start and end times are selected. Finally the user selects the updating interval or period Tupdate for the map which is to be generated.
In this way the user will have selected all the parameters necessary for equipment 1 to be able to generate the dynamic map. At this point the "On/Off" window displays a series of buttons through which the user can control the changes in the dynamic map over time (Figure 9) .
Figure 10 shows the change over time of an example of a chronographic map generated by equipment 1 and displayed at successive display times Tj. As will be noted the graphic elements SI for on-off activities SAi switch between the two on-off forms of display while graphic elements SI for dynamic activities DAk switch between the six different forms of display having different diameters according to the flow datum Fk(TS1) relating to the display time Tj considered.
The animation ends when display time Tj coincides with the end time Tend.
As will be appreciated from what has been described, the equipment for the generation of a dynamic map according to this invention makes it possible to satisfy the abovementioned requirements and at the same time to overcome the disadvantages mentioned in the introductory part of this description in reference to the known art.
Obviously in order to satisfy contingent and specific requirements a person skilled in the art could apply many modifications and variants to the equipment according to the invention described above, all of which however are included within the scope of protection of the invention as defined by the following claims.

Claims (3)

  1. Equipment (1) for the generation of a chronographic map (Σ) of an area comprising a plurality of activities, the said equipment comprising:
    a display screen (2) capable of displaying the said map,
    memory means (3) capable of placing a pair of Cartesian coordinates and a plurality of time-based data for each activity in memory,
    selection means (4) capable of selecting a display period (Tstart, Tend) and an updating interval (Tupdate) for the dynamic map (Σ) so as to define a plurality (P) of display times (Tj),
    characterised in that it comprises
    a graphic interface (5) designed to display a graphic element (SI) corresponding to a pair of Cartesian coordinates for the activity on the said display screen (2) at each display time (Tj) for each activity, and
    processing means (6) designed to process at least one time-based datum of the said plurality of time-based data with the said display time (Tj) to switch the said graphic element (Si) between at least two different forms of display.
  2. Equipment (1) for the generation of a chronographic map (Σ) according to claim 1, in which the said plurality of activities comprise on-off activities (SAi), the said plurality of time-based data comprising an activity start time (Toni) and an activity end time (Toffi) for each on-off activity (SAi), the said processing means (6) associating with each on-off activity (SAi):
    a first activity status (STATE=ON) if the display time (Tj) lies between the start time (Toni) and the end time (Toffi) for the activity,
    a second activity status (STATE=OFF) if the display time (Tj) is less than the activity start time (Toni) or greater than the activity end time (Toffi) ,
    the said first and second different forms of display of the graphic element (SI) corresponding to the said first and second activity statuses respectively.
  3. Equipment (1) for the generation of a chronographic map (Σ) according to claim 1 or 2, in which the said plurality of activities comprises dynamic activities (DAk), the said plurality of time-based data comprising flow data for the entity (Fk(TS1)) for each dynamic activity (DAk) sampled at corresponding sampling times (TS1), the said processing means 6 comparing the sampling times (TS1) and the display time (Tj) to identify the flow datum for the entity (Fk(TS1)) corresponding to the display time (Tj) for each display time (Tj) and for each dynamic activity (DAk) so as to switch the said graphic element (SI) between a plurality of display forms depending upon the value of the flow datum for the dynamic activity.
EP04021177A 2003-10-06 2004-09-07 Equipment for the generation of chronographic maps. Ceased EP1536359A3 (en)

Applications Claiming Priority (2)

Application Number Priority Date Filing Date Title
IT001920A ITMI20031920A1 (en) 2003-10-06 2003-10-06 APPARATUS FOR THE GENERATION OF A CHRONOGRAPHIC CARTOGRAPHY.
ITMI20031920 2003-10-06

Publications (2)

Publication Number Publication Date
EP1536359A2 true EP1536359A2 (en) 2005-06-01
EP1536359A3 EP1536359A3 (en) 2007-01-17

Family

ID=34452246

Family Applications (1)

Application Number Title Priority Date Filing Date
EP04021177A Ceased EP1536359A3 (en) 2003-10-06 2004-09-07 Equipment for the generation of chronographic maps.

Country Status (2)

Country Link
EP (1) EP1536359A3 (en)
IT (1) ITMI20031920A1 (en)

Family Cites Families (5)

* Cited by examiner, † Cited by third party
Publication number Priority date Publication date Assignee Title
JP2900632B2 (en) * 1991-04-19 1999-06-02 株式会社日立製作所 Digital map processing device and digital map display method
AU2261292A (en) * 1991-06-21 1993-01-25 Unitech Research, Inc. Real time three dimensional geo-referenced digital orthophotograph-based positioning, navigation, collision avoidance and decision support system
JPH08509305A (en) * 1994-02-18 1996-10-01 フィリップス エレクトロニクス ネムローゼ フェンノートシャップ Device for displaying map information
US6188955B1 (en) * 1998-12-30 2001-02-13 Garmin Corporation Method and apparatus for storing cartographic route data
AU2001267003A1 (en) * 2000-06-16 2001-12-24 Eteam, Inc. Distributed, collaborative workflow management software

Also Published As

Publication number Publication date
ITMI20031920A1 (en) 2005-04-07
EP1536359A3 (en) 2007-01-17

Similar Documents

Publication Publication Date Title
Dykes et al. Seeking structure in records of spatio-temporal behaviour: visualization issues, efforts and applications
EP1131932B1 (en) A data administration method
EP3086288B1 (en) Interactive electronically presented map
Greger Spatio‐temporal building population estimation for highly urbanized areas using GIS
Ahmadi Crime mapping and spatial analysis
JP5038566B2 (en) Management device and information providing device
Fritsch Profiling and location-based services (lbs)
Kubíček et al. Dynamic visualization in emergency management
Kang et al. Animated cartography for urban soundscape information
Servigne et al. First specifications of an information system for urban soundscape
Muller et al. Noise Abatement Planning-Using Animated Maps and Sound to Visualise Traffic Flows and Noise Pollution
CN111144730A (en) Digital campus comprehensive management system
JP3799107B2 (en) Residential map
CN110597944A (en) Consumption data map presenting method
Reynolds An introduction to geographical information systems (gis)
Paay Understanding and modeling physical environments for mobile location aware information services
Badar et al. Addressing SDG 11.7: a review of literature on urban open spaces in India
Appleyard Environmental planning and social science: strategies for environmental decision-making
Anderson The application of geographical information systems in the spatial analysis of crime
US20020097276A1 (en) Device for offering information
Sepe Complexity and sustainability: relief and representation of the new urban identity
Tsouchlaraki et al. Visual elements inventory in urban landscapes: collecting data for a visual environmental GIS
Brindley et al. Crime map analyst: A GIS to support local-area crime reduction
Fairbairn Geovisualization issues in public transport applications
Leipnik et al. Overview of implementation issues

Legal Events

Date Code Title Description
PUAI Public reference made under article 153(3) epc to a published international application that has entered the european phase

Free format text: ORIGINAL CODE: 0009012

AK Designated contracting states

Kind code of ref document: A2

Designated state(s): AT BE BG CH CY CZ DE DK EE ES FI FR GB GR HU IE IT LI LU MC NL PL PT RO SE SI SK TR

AX Request for extension of the european patent

Extension state: AL HR LT LV MK

PUAL Search report despatched

Free format text: ORIGINAL CODE: 0009013

AK Designated contracting states

Kind code of ref document: A3

Designated state(s): AT BE BG CH CY CZ DE DK EE ES FI FR GB GR HU IE IT LI LU MC NL PL PT RO SE SI SK TR

AX Request for extension of the european patent

Extension state: AL HR LT LV MK

17P Request for examination filed

Effective date: 20070625

AKX Designation fees paid

Designated state(s): DE ES FR IT

17Q First examination report despatched

Effective date: 20090623

STAA Information on the status of an ep patent application or granted ep patent

Free format text: STATUS: THE APPLICATION HAS BEEN REFUSED

18R Application refused

Effective date: 20100509