EP1529846A1 - Means and methods for classifying cyanobacteria - Google Patents
Means and methods for classifying cyanobacteria Download PDFInfo
- Publication number
- EP1529846A1 EP1529846A1 EP03078502A EP03078502A EP1529846A1 EP 1529846 A1 EP1529846 A1 EP 1529846A1 EP 03078502 A EP03078502 A EP 03078502A EP 03078502 A EP03078502 A EP 03078502A EP 1529846 A1 EP1529846 A1 EP 1529846A1
- Authority
- EP
- European Patent Office
- Prior art keywords
- cyanobacterium
- sequences
- sequence
- strains
- rrna
- Prior art date
- Legal status (The legal status is an assumption and is not a legal conclusion. Google has not performed a legal analysis and makes no representation as to the accuracy of the status listed.)
- Withdrawn
Links
- 241000192700 Cyanobacteria Species 0.000 title claims abstract description 123
- 238000000034 method Methods 0.000 title claims abstract description 86
- 241001464430 Cyanobacterium Species 0.000 claims abstract description 85
- 230000002588 toxic effect Effects 0.000 claims abstract description 60
- 231100000331 toxic Toxicity 0.000 claims abstract description 58
- 150000007523 nucleic acids Chemical class 0.000 claims abstract description 56
- 108020004707 nucleic acids Proteins 0.000 claims abstract description 47
- 102000039446 nucleic acids Human genes 0.000 claims abstract description 47
- 238000002360 preparation method Methods 0.000 claims abstract description 14
- 239000000523 sample Substances 0.000 claims description 208
- 238000003199 nucleic acid amplification method Methods 0.000 claims description 68
- 230000003321 amplification Effects 0.000 claims description 67
- 108090000623 proteins and genes Proteins 0.000 claims description 60
- 231100000252 nontoxic Toxicity 0.000 claims description 49
- 230000003000 nontoxic effect Effects 0.000 claims description 49
- 238000009396 hybridization Methods 0.000 claims description 46
- 239000003053 toxin Substances 0.000 claims description 44
- 231100000765 toxin Toxicity 0.000 claims description 44
- 238000012360 testing method Methods 0.000 claims description 43
- 125000003729 nucleotide group Chemical group 0.000 claims description 33
- 239000002773 nucleotide Substances 0.000 claims description 32
- 108020004465 16S ribosomal RNA Proteins 0.000 claims description 31
- 108091023242 Internal transcribed spacer Proteins 0.000 claims description 15
- 108700022487 rRNA Genes Proteins 0.000 claims description 12
- 108091028043 Nucleic acid sequence Proteins 0.000 claims description 9
- 238000003935 denaturing gradient gel electrophoresis Methods 0.000 claims description 8
- 125000006850 spacer group Chemical group 0.000 claims description 8
- 108020004711 Nucleic Acid Probes Proteins 0.000 claims description 2
- 239000002853 nucleic acid probe Substances 0.000 claims description 2
- 239000002344 surface layer Substances 0.000 claims description 2
- 238000003499 nucleic acid array Methods 0.000 claims 1
- 239000002352 surface water Substances 0.000 abstract description 3
- 241000192701 Microcystis Species 0.000 description 119
- 239000000047 product Substances 0.000 description 49
- 108700012359 toxins Proteins 0.000 description 43
- 239000000499 gel Substances 0.000 description 41
- 108010067094 microcystin Proteins 0.000 description 41
- SRUWWOSWHXIIIA-UKPGNTDSSA-N Cyanoginosin Chemical compound N1C(=O)[C@H](CCCN=C(N)N)NC(=O)[C@@H](C)[C@H](C(O)=O)NC(=O)[C@H](CC(C)C)NC(=O)[C@H](C)NC(=O)C(=C)N(C)C(=O)CC[C@H](C(O)=O)N(C)C(=O)[C@@H](C)[C@@H]1\C=C\C(\C)=C\[C@H](C)[C@@H](O)CC1=CC=CC=C1 SRUWWOSWHXIIIA-UKPGNTDSSA-N 0.000 description 39
- 108020004414 DNA Proteins 0.000 description 39
- 238000004458 analytical method Methods 0.000 description 38
- XLYOFNOQVPJJNP-UHFFFAOYSA-N water Substances O XLYOFNOQVPJJNP-UHFFFAOYSA-N 0.000 description 38
- 238000004519 manufacturing process Methods 0.000 description 26
- 102100039068 Interleukin-10 Human genes 0.000 description 21
- 108090000174 Interleukin-10 Proteins 0.000 description 21
- 238000001514 detection method Methods 0.000 description 20
- 238000002955 isolation Methods 0.000 description 17
- 230000002441 reversible effect Effects 0.000 description 17
- 238000012163 sequencing technique Methods 0.000 description 17
- 210000004027 cell Anatomy 0.000 description 16
- 239000013505 freshwater Substances 0.000 description 16
- 238000002844 melting Methods 0.000 description 16
- 230000008018 melting Effects 0.000 description 16
- 239000000203 mixture Substances 0.000 description 16
- 241000894006 Bacteria Species 0.000 description 14
- 231100000419 toxicity Toxicity 0.000 description 14
- 230000001988 toxicity Effects 0.000 description 14
- 238000005070 sampling Methods 0.000 description 13
- 108091093088 Amplicon Proteins 0.000 description 12
- 230000002068 genetic effect Effects 0.000 description 12
- 238000001840 matrix-assisted laser desorption--ionisation time-of-flight mass spectrometry Methods 0.000 description 12
- 239000012528 membrane Substances 0.000 description 12
- 230000000877 morphologic effect Effects 0.000 description 12
- 241000192656 Nostoc Species 0.000 description 11
- 238000012408 PCR amplification Methods 0.000 description 11
- 230000015572 biosynthetic process Effects 0.000 description 11
- 230000004069 differentiation Effects 0.000 description 11
- 108091027305 Heteroduplex Proteins 0.000 description 10
- 241000192542 Anabaena Species 0.000 description 9
- 108010049746 Microcystins Proteins 0.000 description 9
- 241000192710 Microcystis aeruginosa Species 0.000 description 9
- 208000037065 Subacute sclerosing leukoencephalitis Diseases 0.000 description 9
- 206010042297 Subacute sclerosing panencephalitis Diseases 0.000 description 9
- 238000000137 annealing Methods 0.000 description 9
- 238000013461 design Methods 0.000 description 9
- 239000012634 fragment Substances 0.000 description 9
- 230000000813 microbial effect Effects 0.000 description 9
- IJGRMHOSHXDMSA-UHFFFAOYSA-N Atomic nitrogen Chemical compound N#N IJGRMHOSHXDMSA-UHFFFAOYSA-N 0.000 description 8
- ZHNUHDYFZUAESO-UHFFFAOYSA-N Formamide Chemical compound NC=O ZHNUHDYFZUAESO-UHFFFAOYSA-N 0.000 description 8
- XSQUKJJJFZCRTK-UHFFFAOYSA-N Urea Chemical compound NC(N)=O XSQUKJJJFZCRTK-UHFFFAOYSA-N 0.000 description 8
- 238000013459 approach Methods 0.000 description 8
- 230000001580 bacterial effect Effects 0.000 description 8
- 238000012512 characterization method Methods 0.000 description 8
- 238000002864 sequence alignment Methods 0.000 description 8
- 241000059630 Nodularia <Cyanobacteria> Species 0.000 description 7
- 241000530769 Planktothrix Species 0.000 description 7
- DBMJMQXJHONAFJ-UHFFFAOYSA-M Sodium laurylsulphate Chemical compound [Na+].CCCCCCCCCCCCOS([O-])(=O)=O DBMJMQXJHONAFJ-UHFFFAOYSA-M 0.000 description 7
- 241000192707 Synechococcus Species 0.000 description 7
- 239000003398 denaturant Substances 0.000 description 7
- QTBSBXVTEAMEQO-UHFFFAOYSA-N Acetic acid Chemical compound CC(O)=O QTBSBXVTEAMEQO-UHFFFAOYSA-N 0.000 description 6
- 241000192660 Aphanizomenon Species 0.000 description 6
- 108090000364 Ligases Proteins 0.000 description 6
- 108091034117 Oligonucleotide Proteins 0.000 description 6
- 238000006243 chemical reaction Methods 0.000 description 6
- 230000001351 cycling effect Effects 0.000 description 6
- 238000005259 measurement Methods 0.000 description 6
- 238000000926 separation method Methods 0.000 description 6
- 235000019333 sodium laurylsulphate Nutrition 0.000 description 6
- 239000000243 solution Substances 0.000 description 6
- 241000149144 Anabaenopsis Species 0.000 description 5
- 244000085413 Aphanizomenon flos aquae Species 0.000 description 5
- 235000013781 Aphanizomenon flos aquae Nutrition 0.000 description 5
- 238000007399 DNA isolation Methods 0.000 description 5
- 241001134698 Lyngbya Species 0.000 description 5
- 241000192709 Microcystis sp. Species 0.000 description 5
- 241000192143 Prochlorothrix hollandica Species 0.000 description 5
- 241000192118 Trichodesmium Species 0.000 description 5
- 229940054349 aphanizomenon flos-aquae Drugs 0.000 description 5
- 230000000875 corresponding effect Effects 0.000 description 5
- 238000001962 electrophoresis Methods 0.000 description 5
- 150000002500 ions Chemical class 0.000 description 5
- 239000000463 material Substances 0.000 description 5
- 239000002609 medium Substances 0.000 description 5
- 244000005700 microbiome Species 0.000 description 5
- 238000013508 migration Methods 0.000 description 5
- 230000005012 migration Effects 0.000 description 5
- 210000002706 plastid Anatomy 0.000 description 5
- 238000012545 processing Methods 0.000 description 5
- 241000894007 species Species 0.000 description 5
- 241000192685 Calothrix Species 0.000 description 4
- 241000320434 Gloeotrichia sp. Species 0.000 description 4
- 102000003960 Ligases Human genes 0.000 description 4
- TWRXJAOTZQYOKJ-UHFFFAOYSA-L Magnesium chloride Chemical compound [Mg+2].[Cl-].[Cl-] TWRXJAOTZQYOKJ-UHFFFAOYSA-L 0.000 description 4
- 108020001027 Ribosomal DNA Proteins 0.000 description 4
- 239000007983 Tris buffer Substances 0.000 description 4
- 238000003556 assay Methods 0.000 description 4
- 230000003816 axenic effect Effects 0.000 description 4
- 239000004202 carbamide Substances 0.000 description 4
- 230000009260 cross reactivity Effects 0.000 description 4
- 238000009826 distribution Methods 0.000 description 4
- 230000000694 effects Effects 0.000 description 4
- 230000007613 environmental effect Effects 0.000 description 4
- 108091008053 gene clusters Proteins 0.000 description 4
- 238000011534 incubation Methods 0.000 description 4
- 239000011159 matrix material Substances 0.000 description 4
- 229910052757 nitrogen Inorganic materials 0.000 description 4
- 238000007747 plating Methods 0.000 description 4
- 238000011160 research Methods 0.000 description 4
- 238000005096 rolling process Methods 0.000 description 4
- 230000035945 sensitivity Effects 0.000 description 4
- 239000007787 solid Substances 0.000 description 4
- LENZDBCJOHFCAS-UHFFFAOYSA-N tris Chemical compound OCC(N)(CO)CO LENZDBCJOHFCAS-UHFFFAOYSA-N 0.000 description 4
- WEVYAHXRMPXWCK-UHFFFAOYSA-N Acetonitrile Chemical compound CC#N WEVYAHXRMPXWCK-UHFFFAOYSA-N 0.000 description 3
- 241001299740 Cylindrospermopsis Species 0.000 description 3
- 241001464794 Gloeobacter Species 0.000 description 3
- 241000215457 Leptolyngbya Species 0.000 description 3
- 241000179981 Microcoleus sp. Species 0.000 description 3
- 241000168877 Microcystis viridis Species 0.000 description 3
- 241001223105 Nodularia spumigena Species 0.000 description 3
- 241000192673 Nostoc sp. Species 0.000 description 3
- 108010053210 Phycocyanin Proteins 0.000 description 3
- 241000530778 Planktothrix prolifica Species 0.000 description 3
- 241000993827 Pseudanabaena catenata Species 0.000 description 3
- HEMHJVSKTPXQMS-UHFFFAOYSA-M Sodium hydroxide Chemical compound [OH-].[Na+] HEMHJVSKTPXQMS-UHFFFAOYSA-M 0.000 description 3
- 241000192560 Synechococcus sp. Species 0.000 description 3
- 241000192584 Synechocystis Species 0.000 description 3
- 241000192581 Synechocystis sp. Species 0.000 description 3
- 241000192117 Trichodesmium erythraeum Species 0.000 description 3
- 230000008901 benefit Effects 0.000 description 3
- 239000000872 buffer Substances 0.000 description 3
- 230000001413 cellular effect Effects 0.000 description 3
- 230000000295 complement effect Effects 0.000 description 3
- 239000000356 contaminant Substances 0.000 description 3
- 238000011109 contamination Methods 0.000 description 3
- 239000003480 eluent Substances 0.000 description 3
- 231100000784 hepatotoxin Toxicity 0.000 description 3
- 238000000338 in vitro Methods 0.000 description 3
- 238000011835 investigation Methods 0.000 description 3
- 238000007857 nested PCR Methods 0.000 description 3
- 238000013081 phylogenetic analysis Methods 0.000 description 3
- 238000011533 pre-incubation Methods 0.000 description 3
- 108090000765 processed proteins & peptides Proteins 0.000 description 3
- 230000002829 reductive effect Effects 0.000 description 3
- 238000007894 restriction fragment length polymorphism technique Methods 0.000 description 3
- 210000003705 ribosome Anatomy 0.000 description 3
- 238000006467 substitution reaction Methods 0.000 description 3
- LMDZBCPBFSXMTL-UHFFFAOYSA-N 1-ethyl-3-(3-dimethylaminopropyl)carbodiimide Chemical compound CCN=C=NCCCN(C)C LMDZBCPBFSXMTL-UHFFFAOYSA-N 0.000 description 2
- WXTMDXOMEHJXQO-UHFFFAOYSA-N 2,5-dihydroxybenzoic acid Chemical compound OC(=O)C1=CC(O)=CC=C1O WXTMDXOMEHJXQO-UHFFFAOYSA-N 0.000 description 2
- HRPVXLWXLXDGHG-UHFFFAOYSA-N Acrylamide Chemical compound NC(=O)C=C HRPVXLWXLXDGHG-UHFFFAOYSA-N 0.000 description 2
- 241000531070 Aphanizomenon gracile Species 0.000 description 2
- 240000002900 Arthrospira platensis Species 0.000 description 2
- 235000016425 Arthrospira platensis Nutrition 0.000 description 2
- 101710184216 Cardioactive peptide Proteins 0.000 description 2
- 241001299747 Cylindrospermopsis raciborskii Species 0.000 description 2
- 230000004544 DNA amplification Effects 0.000 description 2
- KCXVZYZYPLLWCC-UHFFFAOYSA-N EDTA Chemical compound OC(=O)CN(CC(O)=O)CCN(CC(O)=O)CC(O)=O KCXVZYZYPLLWCC-UHFFFAOYSA-N 0.000 description 2
- 241000206602 Eukaryota Species 0.000 description 2
- 241001534478 Funastrum gracile Species 0.000 description 2
- 108010010803 Gelatin Proteins 0.000 description 2
- 241000320398 Gloeotrichia Species 0.000 description 2
- 241000282412 Homo Species 0.000 description 2
- 108091029795 Intergenic region Proteins 0.000 description 2
- 241000215469 Leptolyngbya sp. Species 0.000 description 2
- 241000107845 Microcystis aeruginosa PCC 7806 Species 0.000 description 2
- 241001277082 Microcystis novacekii Species 0.000 description 2
- 108020005187 Oligonucleotide Probes Proteins 0.000 description 2
- 108091093037 Peptide nucleic acid Proteins 0.000 description 2
- 241000192138 Prochlorococcus Species 0.000 description 2
- 241000192144 Prochlorothrix Species 0.000 description 2
- 241000192511 Pseudanabaena Species 0.000 description 2
- UIIMBOGNXHQVGW-UHFFFAOYSA-M Sodium bicarbonate Chemical compound [Na+].OC([O-])=O UIIMBOGNXHQVGW-UHFFFAOYSA-M 0.000 description 2
- FAPWRFPIFSIZLT-UHFFFAOYSA-M Sodium chloride Chemical compound [Na+].[Cl-] FAPWRFPIFSIZLT-UHFFFAOYSA-M 0.000 description 2
- 108010006785 Taq Polymerase Proteins 0.000 description 2
- DTQVDTLACAAQTR-UHFFFAOYSA-N Trifluoroacetic acid Chemical compound OC(=O)C(F)(F)F DTQVDTLACAAQTR-UHFFFAOYSA-N 0.000 description 2
- 239000002253 acid Substances 0.000 description 2
- 150000007513 acids Chemical class 0.000 description 2
- 230000006154 adenylylation Effects 0.000 description 2
- 229930002868 chlorophyll a Natural products 0.000 description 2
- ATNHDLDRLWWWCB-AENOIHSZSA-M chlorophyll a Chemical compound C1([C@@H](C(=O)OC)C(=O)C2=C3C)=C2N2C3=CC(C(CC)=C3C)=[N+]4C3=CC3=C(C=C)C(C)=C5N3[Mg-2]42[N+]2=C1[C@@H](CCC(=O)OC\C=C(/C)CCC[C@H](C)CCC[C@H](C)CCCC(C)C)[C@H](C)C2=C5 ATNHDLDRLWWWCB-AENOIHSZSA-M 0.000 description 2
- 108091036078 conserved sequence Proteins 0.000 description 2
- 230000002596 correlated effect Effects 0.000 description 2
- 125000004122 cyclic group Chemical group 0.000 description 2
- 230000003247 decreasing effect Effects 0.000 description 2
- 238000004925 denaturation Methods 0.000 description 2
- 230000036425 denaturation Effects 0.000 description 2
- 230000001419 dependent effect Effects 0.000 description 2
- 238000011161 development Methods 0.000 description 2
- 230000001336 diazotrophic effect Effects 0.000 description 2
- 150000002148 esters Chemical class 0.000 description 2
- ZMMJGEGLRURXTF-UHFFFAOYSA-N ethidium bromide Chemical compound [Br-].C12=CC(N)=CC=C2C2=CC=C(N)C=C2[N+](CC)=C1C1=CC=CC=C1 ZMMJGEGLRURXTF-UHFFFAOYSA-N 0.000 description 2
- 229960005542 ethidium bromide Drugs 0.000 description 2
- 238000002474 experimental method Methods 0.000 description 2
- 239000008273 gelatin Substances 0.000 description 2
- 229920000159 gelatin Polymers 0.000 description 2
- 235000019322 gelatine Nutrition 0.000 description 2
- 235000011852 gelatine desserts Nutrition 0.000 description 2
- 238000012252 genetic analysis Methods 0.000 description 2
- 239000011544 gradient gel Substances 0.000 description 2
- 230000036541 health Effects 0.000 description 2
- 230000005571 horizontal transmission Effects 0.000 description 2
- 229910001629 magnesium chloride Inorganic materials 0.000 description 2
- ZIUHHBKFKCYYJD-UHFFFAOYSA-N n,n'-methylenebisacrylamide Chemical compound C=CC(=O)NCNC(=O)C=C ZIUHHBKFKCYYJD-UHFFFAOYSA-N 0.000 description 2
- 108010015857 nitrogenase reductase Proteins 0.000 description 2
- 230000001473 noxious effect Effects 0.000 description 2
- 239000002751 oligonucleotide probe Substances 0.000 description 2
- 230000029553 photosynthesis Effects 0.000 description 2
- 238000010672 photosynthesis Methods 0.000 description 2
- 229920002401 polyacrylamide Polymers 0.000 description 2
- 238000003752 polymerase chain reaction Methods 0.000 description 2
- 102000054765 polymorphisms of proteins Human genes 0.000 description 2
- 239000011148 porous material Substances 0.000 description 2
- 102000004169 proteins and genes Human genes 0.000 description 2
- 238000000746 purification Methods 0.000 description 2
- 238000011002 quantification Methods 0.000 description 2
- 239000011541 reaction mixture Substances 0.000 description 2
- 229940082787 spirulina Drugs 0.000 description 2
- 231100000563 toxic property Toxicity 0.000 description 2
- 238000011144 upstream manufacturing Methods 0.000 description 2
- 238000005406 washing Methods 0.000 description 2
- 108091032973 (ribonucleotides)n+m Proteins 0.000 description 1
- RKEBXTALJSALNU-LDCXZXNSSA-N 3-[(3R,21S,22S)-16-ethenyl-11-ethyl-4-hydroxy-3-methoxycarbonyl-12,17,21,26-tetramethyl-7,23,24,25-tetrazahexacyclo[18.2.1.15,8.110,13.115,18.02,6]hexacosa-1,4,6,8(26),9,11,13(25),14,16,18(24),19-undecaen-22-yl]propanoic acid Chemical compound CCC1=C(C2=NC1=CC3=C(C4=C([C@@H](C(=C5[C@H]([C@@H](C(=CC6=NC(=C2)C(=C6C)C=C)N5)C)CCC(=O)O)C4=N3)C(=O)OC)O)C)C RKEBXTALJSALNU-LDCXZXNSSA-N 0.000 description 1
- 241000588624 Acinetobacter calcoaceticus Species 0.000 description 1
- 229920000936 Agarose Polymers 0.000 description 1
- 108700028369 Alleles Proteins 0.000 description 1
- 241000147155 Ammonifex degensii Species 0.000 description 1
- 241000193830 Bacillus <bacterium> Species 0.000 description 1
- 244000063299 Bacillus subtilis Species 0.000 description 1
- 235000014469 Bacillus subtilis Nutrition 0.000 description 1
- 239000002028 Biomass Substances 0.000 description 1
- 241000192699 Chroococcales Species 0.000 description 1
- 102000053602 DNA Human genes 0.000 description 1
- 238000007400 DNA extraction Methods 0.000 description 1
- 241000238578 Daphnia Species 0.000 description 1
- 108010071079 Dinitrogenase Reductase Proteins 0.000 description 1
- 241001559570 Dolichospermum circinale Species 0.000 description 1
- 241000588724 Escherichia coli Species 0.000 description 1
- 241001107136 Gunnera Species 0.000 description 1
- 229930010555 Inosine Natural products 0.000 description 1
- UGQMRVRMYYASKQ-KQYNXXCUSA-N Inosine Chemical compound O[C@@H]1[C@H](O)[C@@H](CO)O[C@H]1N1C2=NC=NC(O)=C2N=C1 UGQMRVRMYYASKQ-KQYNXXCUSA-N 0.000 description 1
- 241000186604 Lactobacillus reuteri Species 0.000 description 1
- 241000194041 Lactococcus lactis subsp. lactis Species 0.000 description 1
- 241000913089 Limnothrix redekei Species 0.000 description 1
- 241000179980 Microcoleus Species 0.000 description 1
- 241000610599 Microcystis botrys Species 0.000 description 1
- 241001277087 Microcystis ichthyoblabe Species 0.000 description 1
- 241000688806 Microcystis panniformis Species 0.000 description 1
- 241000168879 Microcystis wesenbergii Species 0.000 description 1
- 101710138657 Neurotoxin Proteins 0.000 description 1
- 101710163270 Nuclease Proteins 0.000 description 1
- 108010038807 Oligopeptides Proteins 0.000 description 1
- 102000015636 Oligopeptides Human genes 0.000 description 1
- 241000192497 Oscillatoria Species 0.000 description 1
- 241000588702 Pectobacterium carotovorum subsp. carotovorum Species 0.000 description 1
- 102000003992 Peroxidases Human genes 0.000 description 1
- 108010004729 Phycoerythrin Proteins 0.000 description 1
- 241000192135 Prochloraceae Species 0.000 description 1
- 241000530613 Pseudanabaena limnetica Species 0.000 description 1
- 241000589614 Pseudomonas stutzeri Species 0.000 description 1
- 241000187561 Rhodococcus erythropolis Species 0.000 description 1
- 102000003661 Ribonuclease III Human genes 0.000 description 1
- 108010057163 Ribonuclease III Proteins 0.000 description 1
- 241000192120 Scytonema Species 0.000 description 1
- 238000012300 Sequence Analysis Methods 0.000 description 1
- 241000607715 Serratia marcescens Species 0.000 description 1
- 108020004682 Single-Stranded DNA Proteins 0.000 description 1
- 101800002927 Small subunit Proteins 0.000 description 1
- 241001149258 Sporobolus alterniflorus Species 0.000 description 1
- 108010090804 Streptavidin Proteins 0.000 description 1
- 235000014969 Streptococcus diacetilactis Nutrition 0.000 description 1
- 241001505901 Streptococcus sp. 'group A' Species 0.000 description 1
- 241000186423 Thermodesulfobacterium Species 0.000 description 1
- 108020004566 Transfer RNA Proteins 0.000 description 1
- 241000078013 Trichormus variabilis Species 0.000 description 1
- JLCPHMBAVCMARE-UHFFFAOYSA-N [3-[[3-[[3-[[3-[[3-[[3-[[3-[[3-[[3-[[3-[[3-[[5-(2-amino-6-oxo-1H-purin-9-yl)-3-[[3-[[3-[[3-[[3-[[3-[[5-(2-amino-6-oxo-1H-purin-9-yl)-3-[[5-(2-amino-6-oxo-1H-purin-9-yl)-3-hydroxyoxolan-2-yl]methoxy-hydroxyphosphoryl]oxyoxolan-2-yl]methoxy-hydroxyphosphoryl]oxy-5-(5-methyl-2,4-dioxopyrimidin-1-yl)oxolan-2-yl]methoxy-hydroxyphosphoryl]oxy-5-(6-aminopurin-9-yl)oxolan-2-yl]methoxy-hydroxyphosphoryl]oxy-5-(6-aminopurin-9-yl)oxolan-2-yl]methoxy-hydroxyphosphoryl]oxy-5-(6-aminopurin-9-yl)oxolan-2-yl]methoxy-hydroxyphosphoryl]oxy-5-(6-aminopurin-9-yl)oxolan-2-yl]methoxy-hydroxyphosphoryl]oxyoxolan-2-yl]methoxy-hydroxyphosphoryl]oxy-5-(5-methyl-2,4-dioxopyrimidin-1-yl)oxolan-2-yl]methoxy-hydroxyphosphoryl]oxy-5-(4-amino-2-oxopyrimidin-1-yl)oxolan-2-yl]methoxy-hydroxyphosphoryl]oxy-5-(5-methyl-2,4-dioxopyrimidin-1-yl)oxolan-2-yl]methoxy-hydroxyphosphoryl]oxy-5-(5-methyl-2,4-dioxopyrimidin-1-yl)oxolan-2-yl]methoxy-hydroxyphosphoryl]oxy-5-(6-aminopurin-9-yl)oxolan-2-yl]methoxy-hydroxyphosphoryl]oxy-5-(6-aminopurin-9-yl)oxolan-2-yl]methoxy-hydroxyphosphoryl]oxy-5-(4-amino-2-oxopyrimidin-1-yl)oxolan-2-yl]methoxy-hydroxyphosphoryl]oxy-5-(4-amino-2-oxopyrimidin-1-yl)oxolan-2-yl]methoxy-hydroxyphosphoryl]oxy-5-(4-amino-2-oxopyrimidin-1-yl)oxolan-2-yl]methoxy-hydroxyphosphoryl]oxy-5-(6-aminopurin-9-yl)oxolan-2-yl]methoxy-hydroxyphosphoryl]oxy-5-(4-amino-2-oxopyrimidin-1-yl)oxolan-2-yl]methyl [5-(6-aminopurin-9-yl)-2-(hydroxymethyl)oxolan-3-yl] hydrogen phosphate Polymers Cc1cn(C2CC(OP(O)(=O)OCC3OC(CC3OP(O)(=O)OCC3OC(CC3O)n3cnc4c3nc(N)[nH]c4=O)n3cnc4c3nc(N)[nH]c4=O)C(COP(O)(=O)OC3CC(OC3COP(O)(=O)OC3CC(OC3COP(O)(=O)OC3CC(OC3COP(O)(=O)OC3CC(OC3COP(O)(=O)OC3CC(OC3COP(O)(=O)OC3CC(OC3COP(O)(=O)OC3CC(OC3COP(O)(=O)OC3CC(OC3COP(O)(=O)OC3CC(OC3COP(O)(=O)OC3CC(OC3COP(O)(=O)OC3CC(OC3COP(O)(=O)OC3CC(OC3COP(O)(=O)OC3CC(OC3COP(O)(=O)OC3CC(OC3COP(O)(=O)OC3CC(OC3COP(O)(=O)OC3CC(OC3COP(O)(=O)OC3CC(OC3CO)n3cnc4c(N)ncnc34)n3ccc(N)nc3=O)n3cnc4c(N)ncnc34)n3ccc(N)nc3=O)n3ccc(N)nc3=O)n3ccc(N)nc3=O)n3cnc4c(N)ncnc34)n3cnc4c(N)ncnc34)n3cc(C)c(=O)[nH]c3=O)n3cc(C)c(=O)[nH]c3=O)n3ccc(N)nc3=O)n3cc(C)c(=O)[nH]c3=O)n3cnc4c3nc(N)[nH]c4=O)n3cnc4c(N)ncnc34)n3cnc4c(N)ncnc34)n3cnc4c(N)ncnc34)n3cnc4c(N)ncnc34)O2)c(=O)[nH]c1=O JLCPHMBAVCMARE-UHFFFAOYSA-N 0.000 description 1
- 238000010521 absorption reaction Methods 0.000 description 1
- 230000001133 acceleration Effects 0.000 description 1
- 239000011543 agarose gel Substances 0.000 description 1
- 230000002776 aggregation Effects 0.000 description 1
- 238000004220 aggregation Methods 0.000 description 1
- 238000013019 agitation Methods 0.000 description 1
- QVGXLLKOCUKJST-UHFFFAOYSA-N atomic oxygen Chemical group [O] QVGXLLKOCUKJST-UHFFFAOYSA-N 0.000 description 1
- 108010058966 bacteriophage T7 induced DNA polymerase Proteins 0.000 description 1
- 230000037429 base substitution Effects 0.000 description 1
- 238000010170 biological method Methods 0.000 description 1
- 210000000476 body water Anatomy 0.000 description 1
- 238000004113 cell culture Methods 0.000 description 1
- 239000006285 cell suspension Substances 0.000 description 1
- 239000007795 chemical reaction product Substances 0.000 description 1
- 229930002869 chlorophyll b Natural products 0.000 description 1
- NSMUHPMZFPKNMZ-VBYMZDBQSA-M chlorophyll b Chemical compound C1([C@@H](C(=O)OC)C(=O)C2=C3C)=C2N2C3=CC(C(CC)=C3C=O)=[N+]4C3=CC3=C(C=C)C(C)=C5N3[Mg-2]42[N+]2=C1[C@@H](CCC(=O)OC\C=C(/C)CCC[C@H](C)CCC[C@H](C)CCCC(C)C)[C@H](C)C2=C5 NSMUHPMZFPKNMZ-VBYMZDBQSA-M 0.000 description 1
- 210000003763 chloroplast Anatomy 0.000 description 1
- 238000010367 cloning Methods 0.000 description 1
- 230000001332 colony forming effect Effects 0.000 description 1
- 238000004891 communication Methods 0.000 description 1
- 230000000052 comparative effect Effects 0.000 description 1
- 238000012790 confirmation Methods 0.000 description 1
- 238000010276 construction Methods 0.000 description 1
- 230000008094 contradictory effect Effects 0.000 description 1
- 238000012937 correction Methods 0.000 description 1
- 108010073357 cyanoginosin LR Proteins 0.000 description 1
- 235000013365 dairy product Nutrition 0.000 description 1
- 239000007857 degradation product Substances 0.000 description 1
- 230000018044 dehydration Effects 0.000 description 1
- 238000006297 dehydration reaction Methods 0.000 description 1
- 230000003111 delayed effect Effects 0.000 description 1
- 238000012217 deletion Methods 0.000 description 1
- 230000037430 deletion Effects 0.000 description 1
- 238000003795 desorption Methods 0.000 description 1
- 230000023077 detection of light stimulus Effects 0.000 description 1
- 230000001627 detrimental effect Effects 0.000 description 1
- 238000010790 dilution Methods 0.000 description 1
- 239000012895 dilution Substances 0.000 description 1
- 239000000539 dimer Substances 0.000 description 1
- 239000003651 drinking water Substances 0.000 description 1
- 235000020188 drinking water Nutrition 0.000 description 1
- 230000005684 electric field Effects 0.000 description 1
- 238000005516 engineering process Methods 0.000 description 1
- 238000001976 enzyme digestion Methods 0.000 description 1
- 238000011156 evaluation Methods 0.000 description 1
- 238000000605 extraction Methods 0.000 description 1
- 238000013213 extrapolation Methods 0.000 description 1
- 230000002349 favourable effect Effects 0.000 description 1
- 238000001914 filtration Methods 0.000 description 1
- 238000007667 floating Methods 0.000 description 1
- 239000011888 foil Substances 0.000 description 1
- 230000006870 function Effects 0.000 description 1
- 238000010230 functional analysis Methods 0.000 description 1
- 125000000524 functional group Chemical group 0.000 description 1
- 239000007789 gas Substances 0.000 description 1
- 238000001502 gel electrophoresis Methods 0.000 description 1
- 239000011521 glass Substances 0.000 description 1
- 239000001963 growth medium Substances 0.000 description 1
- 101150008896 hetR gene Proteins 0.000 description 1
- 210000001990 heterocyst Anatomy 0.000 description 1
- 238000010921 in-depth analysis Methods 0.000 description 1
- 150000002484 inorganic compounds Chemical class 0.000 description 1
- 229910010272 inorganic material Inorganic materials 0.000 description 1
- 229960003786 inosine Drugs 0.000 description 1
- 238000003780 insertion Methods 0.000 description 1
- 230000037431 insertion Effects 0.000 description 1
- 238000002743 insertional mutagenesis Methods 0.000 description 1
- 230000003993 interaction Effects 0.000 description 1
- 230000002452 interceptive effect Effects 0.000 description 1
- 238000005304 joining Methods 0.000 description 1
- 238000002372 labelling Methods 0.000 description 1
- 229940001882 lactobacillus reuteri Drugs 0.000 description 1
- 150000002632 lipids Chemical class 0.000 description 1
- 239000007788 liquid Substances 0.000 description 1
- 230000007774 longterm Effects 0.000 description 1
- 239000003550 marker Substances 0.000 description 1
- 238000001819 mass spectrum Methods 0.000 description 1
- MYWUZJCMWCOHBA-VIFPVBQESA-N methamphetamine Chemical compound CN[C@@H](C)CC1=CC=CC=C1 MYWUZJCMWCOHBA-VIFPVBQESA-N 0.000 description 1
- 238000002493 microarray Methods 0.000 description 1
- 108010038973 microcystin synthetase A Proteins 0.000 description 1
- ZYZCGGRZINLQBL-GWRQVWKTSA-N microcystin-LR Chemical compound C([C@H](OC)[C@@H](C)\C=C(/C)\C=C\[C@H]1[C@@H](C(=O)N[C@H](CCC(=O)N(C)C(=C)C(=O)N[C@H](C)C(=O)N[C@@H](CC(C)C)C(=O)N[C@H]([C@H](C)C(=O)N[C@@H](CCCNC(N)=N)C(=O)N1)C(O)=O)C(O)=O)C)C1=CC=CC=C1 ZYZCGGRZINLQBL-GWRQVWKTSA-N 0.000 description 1
- DIDLWIPCWUSYPF-UHFFFAOYSA-N microcystin-LR Natural products COC(Cc1ccccc1)C(C)C=C(/C)C=CC2NC(=O)C(NC(CCCNC(=N)N)C(=O)O)NC(=O)C(C)C(NC(=O)C(NC(CC(C)C)C(=O)O)NC(=O)C(C)NC(=O)C(=C)N(C)C(=O)CCC(NC(=O)C2C)C(=O)O)C(=O)O DIDLWIPCWUSYPF-UHFFFAOYSA-N 0.000 description 1
- 238000002156 mixing Methods 0.000 description 1
- 238000012986 modification Methods 0.000 description 1
- 230000004048 modification Effects 0.000 description 1
- 238000012544 monitoring process Methods 0.000 description 1
- 235000019799 monosodium phosphate Nutrition 0.000 description 1
- 230000004660 morphological change Effects 0.000 description 1
- 230000035772 mutation Effects 0.000 description 1
- 239000013642 negative control Substances 0.000 description 1
- 239000002581 neurotoxin Substances 0.000 description 1
- 231100000618 neurotoxin Toxicity 0.000 description 1
- 238000005312 nonlinear dynamic Methods 0.000 description 1
- 231100000956 nontoxicity Toxicity 0.000 description 1
- 238000007899 nucleic acid hybridization Methods 0.000 description 1
- 235000016709 nutrition Nutrition 0.000 description 1
- 238000005457 optimization Methods 0.000 description 1
- 150000002894 organic compounds Chemical class 0.000 description 1
- 230000008520 organization Effects 0.000 description 1
- 229910052760 oxygen Inorganic materials 0.000 description 1
- 239000001301 oxygen Substances 0.000 description 1
- 230000036961 partial effect Effects 0.000 description 1
- 239000008188 pellet Substances 0.000 description 1
- 238000010647 peptide synthesis reaction Methods 0.000 description 1
- 108040007629 peroxidase activity proteins Proteins 0.000 description 1
- 229930001119 polyketide Natural products 0.000 description 1
- 229930001118 polyketide hybrid Natural products 0.000 description 1
- 125000003308 polyketide hybrid group Chemical group 0.000 description 1
- 239000002243 precursor Substances 0.000 description 1
- 230000002028 premature Effects 0.000 description 1
- 230000037452 priming Effects 0.000 description 1
- 230000008569 process Effects 0.000 description 1
- 102000004196 processed proteins & peptides Human genes 0.000 description 1
- 239000008213 purified water Substances 0.000 description 1
- 238000003908 quality control method Methods 0.000 description 1
- 238000011536 re-plating Methods 0.000 description 1
- 238000011084 recovery Methods 0.000 description 1
- 231100000916 relative toxicity Toxicity 0.000 description 1
- 238000009877 rendering Methods 0.000 description 1
- 108091008146 restriction endonucleases Proteins 0.000 description 1
- 108020004418 ribosomal RNA Proteins 0.000 description 1
- 239000011435 rock Substances 0.000 description 1
- 238000005204 segregation Methods 0.000 description 1
- 229910000030 sodium bicarbonate Inorganic materials 0.000 description 1
- 235000017557 sodium bicarbonate Nutrition 0.000 description 1
- 239000011780 sodium chloride Substances 0.000 description 1
- AJPJDKMHJJGVTQ-UHFFFAOYSA-M sodium dihydrogen phosphate Chemical compound [Na+].OP(O)([O-])=O AJPJDKMHJJGVTQ-UHFFFAOYSA-M 0.000 description 1
- 229910000162 sodium phosphate Inorganic materials 0.000 description 1
- 238000011895 specific detection Methods 0.000 description 1
- 230000003595 spectral effect Effects 0.000 description 1
- 230000002269 spontaneous effect Effects 0.000 description 1
- 229910001220 stainless steel Inorganic materials 0.000 description 1
- 239000010935 stainless steel Substances 0.000 description 1
- 238000003860 storage Methods 0.000 description 1
- 238000012916 structural analysis Methods 0.000 description 1
- 239000000126 substance Substances 0.000 description 1
- 239000000758 substrate Substances 0.000 description 1
- 230000009897 systematic effect Effects 0.000 description 1
- 239000008399 tap water Substances 0.000 description 1
- 235000020679 tap water Nutrition 0.000 description 1
- 238000013518 transcription Methods 0.000 description 1
- 230000035897 transcription Effects 0.000 description 1
- 230000007704 transition Effects 0.000 description 1
- 230000007332 vesicle formation Effects 0.000 description 1
- 239000003643 water by type Substances 0.000 description 1
Images




Classifications
-
- C—CHEMISTRY; METALLURGY
- C12—BIOCHEMISTRY; BEER; SPIRITS; WINE; VINEGAR; MICROBIOLOGY; ENZYMOLOGY; MUTATION OR GENETIC ENGINEERING
- C12Q—MEASURING OR TESTING PROCESSES INVOLVING ENZYMES, NUCLEIC ACIDS OR MICROORGANISMS; COMPOSITIONS OR TEST PAPERS THEREFOR; PROCESSES OF PREPARING SUCH COMPOSITIONS; CONDITION-RESPONSIVE CONTROL IN MICROBIOLOGICAL OR ENZYMOLOGICAL PROCESSES
- C12Q1/00—Measuring or testing processes involving enzymes, nucleic acids or microorganisms; Compositions therefor; Processes of preparing such compositions
- C12Q1/68—Measuring or testing processes involving enzymes, nucleic acids or microorganisms; Compositions therefor; Processes of preparing such compositions involving nucleic acids
- C12Q1/6876—Nucleic acid products used in the analysis of nucleic acids, e.g. primers or probes
- C12Q1/6888—Nucleic acid products used in the analysis of nucleic acids, e.g. primers or probes for detection or identification of organisms
- C12Q1/689—Nucleic acid products used in the analysis of nucleic acids, e.g. primers or probes for detection or identification of organisms for bacteria
-
- C—CHEMISTRY; METALLURGY
- C12—BIOCHEMISTRY; BEER; SPIRITS; WINE; VINEGAR; MICROBIOLOGY; ENZYMOLOGY; MUTATION OR GENETIC ENGINEERING
- C12Q—MEASURING OR TESTING PROCESSES INVOLVING ENZYMES, NUCLEIC ACIDS OR MICROORGANISMS; COMPOSITIONS OR TEST PAPERS THEREFOR; PROCESSES OF PREPARING SUCH COMPOSITIONS; CONDITION-RESPONSIVE CONTROL IN MICROBIOLOGICAL OR ENZYMOLOGICAL PROCESSES
- C12Q1/00—Measuring or testing processes involving enzymes, nucleic acids or microorganisms; Compositions therefor; Processes of preparing such compositions
- C12Q1/68—Measuring or testing processes involving enzymes, nucleic acids or microorganisms; Compositions therefor; Processes of preparing such compositions involving nucleic acids
- C12Q1/6813—Hybridisation assays
-
- C—CHEMISTRY; METALLURGY
- C12—BIOCHEMISTRY; BEER; SPIRITS; WINE; VINEGAR; MICROBIOLOGY; ENZYMOLOGY; MUTATION OR GENETIC ENGINEERING
- C12Q—MEASURING OR TESTING PROCESSES INVOLVING ENZYMES, NUCLEIC ACIDS OR MICROORGANISMS; COMPOSITIONS OR TEST PAPERS THEREFOR; PROCESSES OF PREPARING SUCH COMPOSITIONS; CONDITION-RESPONSIVE CONTROL IN MICROBIOLOGICAL OR ENZYMOLOGICAL PROCESSES
- C12Q1/00—Measuring or testing processes involving enzymes, nucleic acids or microorganisms; Compositions therefor; Processes of preparing such compositions
- C12Q1/68—Measuring or testing processes involving enzymes, nucleic acids or microorganisms; Compositions therefor; Processes of preparing such compositions involving nucleic acids
- C12Q1/6813—Hybridisation assays
- C12Q1/6834—Enzymatic or biochemical coupling of nucleic acids to a solid phase
- C12Q1/6837—Enzymatic or biochemical coupling of nucleic acids to a solid phase using probe arrays or probe chips
Definitions
- the present invention relates to the field of cyanobacteria, in particular it relates to the development of means and methods for classifying cyanobacteria.
- Microcystins are cyclic heptapeptides, formed non-ribosomally by peptide- and polyketide-synthetases. More than 70 structural microcystin variants are known to date (12).
- Cyanobacteria have been classified using a number of different methods. Traditionally, cyanobacteria are classified on the basis of morphological characteristics. Recently, hybridisation to 16S rRNA probes has been used for classifying this particular group of bacteria. This technique has the disadvantage that much of the variation within the group of cyanobacteria is not seen. The reason is most likely that the 16S rRNA is not divergent enough between the various strains. This leads to an under estimation of the genetic variety in the population of cyanobacteria and indeed in many cases cyanobacteria having identical 16S rRNA sequences differ in other genetic aspects such as but not limited to toxin production.
- the present invention provides an alternative method for the classification of cyanobacteria.
- the Internal Transcribed Spacer region (ITS) between 16S rRNA and 23S rRNA is used as a discriminating tool. It has been found that this region is sufficiently divergent to allow an adequate separation between the various strains of cyanobacteria, whereas at the same time it is not so divergent as to confound strain identification.
- the regions flanking the ITS in the 16S rRNA gene and the 23S rRNA gene are sufficiently conserved among cyanobacteria to allow amplification of this region for most cyanobacteria.
- the ITS regions of cyanobacteria are sufficiently far removed from the group of normal bacteria to prevent detecting bacterial strains in the classification method.
- strain does not refer to a single clone of genetically identical cyanobacteria, although this can be the case, but rather to a group of cyanobacteria that is genetically very similar.
- cyanobacteria that belong to a strain have the same ITS sequence in the region determined.
- all cyanobacteria samples that hybridise under stringent conditions are said to be of the same strain. Typically this is the case where the cyanobacteria have no mismatch with the probe.
- the invention provides a method for classifying a cyanobacterium clone comprising providing nucleic acid from said clone with at least one cyanobacteria specific primer, amplifying at least part of the ITS region therein and separating the resulting amplificate under gradually increasing denaturing conditions.
- This process that in a specific implementation is referred to as DGGE utilizes both the size of the nucleic acid and the sequence content thereof as a discriminating variable.
- the conditions that initiate denaturation of the nucleic acid vary with the sequence. Some sequences will denature readily whereas other sequences will denature only under significantly stronger denaturing conditions.
- the migration speed of a nucleic acid through a mesh under the influence of an electrical field is very sensitive to denaturation state of the nucleic acid. Double stranded nucleic acid migrates relatively quickly through the mesh whereas partly denatured nucleic acid migrates very poorly. Thus the migration endpoint under a gradient of ever increasing denaturing conditions is indicative of both the size and of the sequence of the migrated nucleic acid.
- this system can favourably be used to discriminate between different cyanobacterium strains. It is particularly suited to discriminate between closely related strains as there are among the genus Microcystis.
- the cyanobacteria specific primer comprises a sequence as depicted in table 1 of example 3.
- the primer may comprise a part of a sequence as depicted in table 1 of example 3, however, the primer comprises at least 15 and preferably at least 18 of the nucleotides of the sequences presented in table 1 of example 3.
- the primer consist of a sequence as depicted in table 1 of example 3.
- a primer comprises one or more of the (GC-)CSIF sequences in table 1 of example 3.
- the ITS can be subdivided into regions that are of particular interest in the method for the denaturing electrophoresis analysis.
- the nucleic acid for the electrophoresis comprises the region amplified by primers ((GC-)CSIF and ULR), or by primers ((GC-)CSIF and 373R, or by primers ((GC-)CSIF and ITS3R.
- primers (GC-)CSIF and ULR are used.
- cyanobacterial communities and isolates can be studied at high resolution.
- the selectivity of the primers makes it possible to focus on cyanobacteria in the presence of other organisms.
- the rationale for using different rRNA-ITS primer sets has become clear from our results. Each set has its advantages and disadvantages, and the choice which one to use depends on the study that is to be executed.
- ITSa primers for studying cyanobacteria, ITSa primers (GC-)CSIF and 373R have the broadest applicability and produce the most straightforward DGGE profiles. However, bands from some organisms may end up at identical positions in the gel, while sequence differences do exist (either because sequence differences occur in the non-amplified 3'-part of the rRNA-ITS or because different sequences dictate an identical melting behaviour).
- ITSb primers GC-CSIF and ITS3R and ITSc primers
- ULR supplementary resolution
- ITSb primers provide more selectivity towards some cyanobacterial genera (Table 3 of example 1), and produce complex DGGE profiles for some genera. Most sequence information, and thus strain typing potential, can be retrieved from ITSc primer amplicons. Moreover, for most tested genera they yielded particularly sharp bands on DGGE gels.
- the invention thus provides a method comprising hybridising a probe from an rRNA-internal transcribed spacer (ITS) located between sequences from a 16S and a 23S rRNA gene, of a reference cyanobacterium strain, with a preparation comprising nucleic acid from said region derived from a test cyanobacterium and determining whether hybridisation occurs.
- ITS rRNA-internal transcribed spacer
- This information is useful for instance in monitoring a particular cyanobacterium that is present in a lake. For instance, if in past seasons that particular strain caused problems in the lake, one can monitor samples from the lake for the presence of this cyanobacterium.. The method may also be used to determine the relative contribution of the particular strain in the lake. In this embodiment the method further comprises comparing the hybridisation result with a control hybridisation. By using a standard of varying but known amounts of input nucleic acid in the control hybridisation one can compare the hybridisation signal intensity of the sample with the signal intensities in the control hybridisation and determine from that the amount of specific nucleic acid in the test sample. Once this is known one can correlate this to the number of cells and thereby to the concentration of the test cyanobacterium in the sample.
- test cyanobacterium is not the only cyanobacterium in the sample one can also arrive at the relative contribution of the test cyanobacterium to the total population of cyanobacteria in the test sample. Such information can be used for instance to determine the population dynamics of cyanobacteria in a particular body of water.
- a method of the invention further comprises classifying said test cyanobacterium on the basis of said hybridisation and/or DGGE analysis. For quantification purposes one can correlate the results obtained with reference samples having various known amounts or distributions of the to be quantified cyanobacterium or cyanobacteria, respectively.
- the invention provides classifying said test cyanobacterium as a toxin producing strain. It is further possible to further classify toxin of the test cyanobacterium and to relate it to a particular toxin group, and within the group to a certain subtype. For instance the mcy gene cluster, encoding the microcystin synthetase genes, exhibits diversity and many different microcystin toxins can be produced by the various strains of Microcystis. With a method of the invention it is possible to correlate the ITS genotype to the toxin genotype.
- a classification of the invention further comprises classifying said cyanobacterium as a surface layer forming strain and/or as a high toxin producing strain.
- a method of the present invention can be practised using any reference cyanobacterium.
- the reference cyanobacterium comprises a Microcystis cyanobacterium.
- the invention provides a method wherein said hybridisation comprises hybridising said preparation with a panel of nucleic acid probes wherein said panel comprises said probe and at least one probe derived from the intergenic region between the transcribed sequences from 16S and 23S rRNA gene of another reference cyanobacterium strain.
- the probes do not necessarily have to map to the same region of the ITS. In fact many probes are situated in different regions.
- said panel comprises at least five probes, wherein each of said five probes is derived from the intergenic region between the transcribed sequences from 16S and 23S rRNA gene of different reference cyanobacterium strains. Using five probes is typically sufficient to monitor the population dynamics of cyanobacteria in a particular body of water.
- the panel comprises more than ten, and preferably more than 15 of said probes of different cyanobacterium strains. Using these larger number of probes the chance that a test cyanobacterium can assigned to a strain increases.
- strains that do not belong to one of the strains that a probe is used for (a typed strain) is thereby typed as a new strain and a probe can be designed to identify this new strain, which new probe can subsequently be added to the panel.
- the ITS region can be used to further delineate genetic differences and thus further subdivision of the strain. This can for instance be done by comparing the ITS regions on a sequence level.
- the probes are typically selected from ITS sub regions wherein at least one nucleotide mismatch is present compared with the sequence of the strain one wants to distinguish from. Typically a probe is selected to have as much discriminating power as possible. This can be achieved by selecting probes having at least one mismatch with all typed cyanobacterial ITS sequences other than those from the strain for which the probe has been designed. Probes having at least one nucleotide mismatch with the closest related counterpart can be used in the present invention. A one nucleotide mismatch is typically sufficient to obtain a clearly distinguishable hybridisation result. A counterpart probe can be designed for the closest related counterpart. This counterpart probe, is completely complementary to the region in the counterpart ITS and has the same number of nucleotides.
- This counterpart probe can be incorporated into the panel. This allows an even more precise analysis of the hybridisation result.
- the signal obtained with the probe can be compared with the signal obtained with the counterpart probe.
- the test cyanobacterium belongs to the same strain as the strain that the probe is derived from, if the hybridisation signal obtained with the probe is above background (i.e. there was specific hybridisation) and simultaneously more intense than the hybridisation signal obtained with counterpart probe.
- Counterpart probes can be designed for all probes in the panel and likewise be incorporated into the panel. Thus whereas probes can be of different regions in the ITS, counterpart probes always overlap the same region as the probe in the closest related counterpart strain.
- the probe comprises at least two mismatches with the same region in the closest related counterpart.
- At least one of said probes in the panel comprises no mismatches with the sequence of the reference strain the probe is derived from, and at least two mismatches with the sequence of said region in at least one other reference cyanobacterium strain.
- said at least one other reference strain is the strain that is the closest related counterpart of the reference cyanobacterium strain that the probe is derived from.
- the panel is a dedicated panel, for instance, capable of discriminating between all typed Microcystis strains.
- said at least five of said probes comprise no mismatches with the sequence of said region in the reference strains they are derived from, and each of said at least five probes comprises at least two mismatches with the sequence of said region in the other strains of said at least five reference strains. The latter criterion being met when the probe has at least two mismatches with the same region in the closest related strain.
- a method of the invention further comprises hybridising a control probe from said rRNA-internal transcribed spacer region (ITS) located between sequences from a 16S rRNA gene and a 23S rRNA gene, with a preparation comprising nucleic acid from said region derived from a test cyanobacterium and determining whether hybridisation occurs, wherein said control probe comprises sequence divergence with some strains of cyanobacteria, but not with other strains of cyanobacteria.
- said control probe is selective for a cluster of cyanobacteria strains. This probe provides confirmation of the information obtained for the strain specific probe in that there is also hybridisation with the control probe. It provides further information on the correct strain assignment.
- control probe is selective for a cluster of cyanobacteria that comprises the strain that said probe is selective for, preferably said control probe comprises a sequence as depicted in table 3B of example 3.
- the control probe can also be used separately or in combination with strain specific probes that are not specific for strains of the cluster.
- a positive signal in the control probe provides information on the cluster the test cyanobacterium belongs to and can therefore be used to correlate cluster specific geno- or phenotype characteristics to the test cyanobacterium.
- the probe is preferably an oligonucleotide or a functional equivalent thereof.
- a functional equivalent of an oligonucleotide comprises the same binding affinity in kind not necessarily in amount as the oligonucleotide itself.
- Suitable nucleotide mimetics are present in the art such as but not limited to peptide nucleic acid (PNA).
- Other mimetics include (L)-a-threofuranosyl oligonucleotides (TNA), RNA.
- at least one of said probes comprises between 12 and 30 nucleotides.
- at least one of said probes comprises between 16 and 28 nucleotides.
- the probe may share nucleotide sequence with or be complementary to several distinct regions in the ITS, however, in a preferred embodiment at least between 12 and 30 nucleotides are arranged consecutively in said ITS region. Probes may of course further comprise other sequences, such as for instance for the purpose of incorporating a label that becomes detectable upon hybridisation of the probe to the target nucleic acid. Examples of such probes are the so-called molecular beacon probes.
- the probes may also comprise nucleotides from one or more other regions of the cyanobacterium genome. Probes may also comprise nucleotide analogues having similar hybridisation characteristics in kind as the nucleotide they are analogous to, though they do not have to have the same characteristics in amount.
- Probes may further comprise other nucleotide analogous such as for instance inosine, that do not have a strong preferred counterpart base with which they associated in the opposing strand. Both types of analogues may be used to accommodate binding strength of particular probes thereby allowing fine adjustment of the panel. This fine tuning can be used to arrive at standardized hybridisation conditions. Probes may also further comprise other matter such as but not limited to protein, lipids or other substances to provide further functionality. In a panel the probes are typically selected to have about the same Tm. This being the case where the Tm of the various probes differs no more than one degree from each other, however, this need not always be true. One may further fine tune the probes to have an even closer set of Tm values.
- a probe can further be scrutinized for other features such as internal repeats, low self hybridisation characteristics, low internal hybridisation characteristics an low amounts of direct repeats. These properties can all be fine tuned and increase the propensity with which a suitable panel is designed. Probes may also further comprise organic or inorganic compounds, such as can be used to bind the probes to a solid surface or binding matrix and to provide distance from this solid surface or binding matrix.
- a probe of the invention preferably comprises a nucleic acid sequence as depicted in table 3 of example 3 or a functional equivalent thereof.
- a functional equivalent in this case also comprises the reverse complement of the presented sequence.
- a panel of probes preferably comprises at least one of probes comprising a nucleic acid sequence as depicted in table 3 of example 3 or a functional equivalent of such an oligonucleotide, preferably at least two, and more preferably at least five probes of said panel comprise a nucleic acid sequence as depicted in table 3 of example 3 or a functional equivalent of such an oligonucleotide.
- a method of the invention can be performed using any preparation containing nucleic acid of the ITS region.
- the preparation comprises nucleic acid that has undergone an amplification step specific for the ITS region.
- amplifying the nucleic acid from this region two things are accomplished simultaneously.
- the amount of nucleic acid to be detected is amplified thereby increasing the sensitivity of the method and allowing detection of cyanobacteria that are not easy to grow or obtain in other ways.
- the potential for background hybridisation of sequences that are not derived from the ITS region is reduced, thereby further increasing the signal to noise ratio for the assay.
- said preparation of nucleic acid of said test cyanobacterium is at least in part prepared through amplification of a sample comprising nucleic acid of said test cyanobacterium.
- said amplification is performed using a cyanobacterium specific primer within the 16S, 23S or 16S-23S rRNA internal transcribed spacer gene sequence.
- specific primers enhance the sensitivity for detection of cyanobacterial ITS sequences, since there is no competition for amplification of non-cyanobacterial sequences during the PCR reaction.
- Various cyanobacterial specific ITS amplification primers can be designed.
- amplification methods rely on two opposing primers. It is sufficient that at least one of said primers is specific for cyanobacteria. However, preferably, both primers in strategies relying in two opposing primers are cyanobacteria specific. It is possible to perform so-called nested amplifications to further increase the sensitivity of a method of the invention.
- Such nested primers can be both cyanobacterial specific primers and primers that recognize a broader range of bacterial ITS regions.
- at least one nested primer(s) is(are) cyanobacterial specific.
- a cyanobacterial specific primer comprises a sequence as depicted in table 1 of example 3.
- the invention further provides at least one of the sequence as identified by the EMBL accession numbers AJ605140 till AJ605221 (see table 2 of example 3).
- the EMBL sequences refer to ITS regions of particular strains of cyanobacteria that are used to select the probes from.
- the ITS regions can further be used to characterise the strain from which it was identified.
- the present invention further provides a method for typing a strain of cyanobacteria comprising determining whether the test cyanobacterium comprises a sequence of one of the isolates identified by accession numbers AJ605140 till AJ605221 as referred to in table 2 of example 3. This method is preferably performed by sequencing amplified product from an ITS region of the test cyanobacterium, however, other sequencing methods are known in art and can also be used.
- the invention provides a nucleic acid or a functional equivalent thereof as depicted in table 3 of example 3.
- a panel of nucleic acids, or functional equivalents thereof wherein said panel comprises at least one of said nucleic acids comprise a sequence as depicted in table 3 of example 3.
- said panel comprises at least two and more preferably at least five of said nucleic acids wherein said at least five nucleic acids comprise a sequence as depicted in table 3 of example 3 or a functional equivalent thereof.
- the panel preferably comprises an array that is associated with a solid surface. Preferably, a flat solid surface. In a particularly preferred embodiment the panel is present on a chip, which has preferably the dimensions of a microscopic slide.
- an apparatus for analysing hybridisation signals comprising a nucleic acid having a sequence depicted in table 3 of example 3, a panel of nucleic acids according to invention, an array and/or a chip according to the invention.
- the apparatus can for instance be an X-ray film, a CCD camera (especially the cooled variant), a reader for microtiterplates capable of detecting chemiluminescence signals.
- array readers such as the SensiChip DNA Array Reader from Quiagen, the Affymetrix Chip Reader, The Genapta microarray reader and microtiterplate readers such as that from Perkin Elmer, Wallac and Pharmacia.
- array readers such as the SensiChip DNA Array Reader from Quiagen, the Affymetrix Chip Reader, The Genapta microarray reader and microtiterplate readers such as that from Perkin Elmer, Wallac and Pharmacia.
- the invention provides the use of a nucleic acid or functional equivalent thereof of table 3 of example 3 or of a sequence identified by EMBL accession numbers AJ605140 till AJ605221, an array, chip or apparatus according to the invention, for classifying a cyanobacterium.
- said classification comprises classifying said cyanobacterium as a toxic or non-toxic cyanobacterium strain.
- the invention further provides a method for typing a cyanobacterium in a sample comprising subjecting ITS sequences from said clone to a denaturing gradient gel electrophoresis step and typing the strain from said step.
- a method of the invention is preferably performed using a clone of the test cyanobacterium as a source to prepare the preparation or as a source of ITS sequences. This source is particularly preferred in the instances wherein the nucleic acid sequence is determined or wherein a denaturing gradient gel is used.
- a method comprising a denaturing gradient gel electrophoresis step preferably further comprises comparing the result of said step with a reference.
- the reference is preferably a similar treated sample of a reference cyanobacterium.
- the reference comprises similar treated samples from at least 5 reference and more preferably at least 15 reference cyanobacteria.
- the material used to generate the references comprises a sequence as depicted in table 2 of example 3.
- ITS sequences are provided through amplification of the ITS region of said cyanobacterium clone.
- the ITS sequences are preferably amplified by using a cyanobacterium specific primer within the 16S, 23S or 16S-23S rRNA internal transcribed spacer gene sequence, preferably by using a cyanobacterium specific primer comprising a sequence as depicted in table 1 of example 3.
- the reference(s) are preferably similarly treated.
- cyanobacteria For many ecological studies of cyanobacteria, it is essential that closely related species or strains can be discriminated. Since this is often not possible using morphological features, cyanobacteria are frequently studied using DNA based methods. We realized high-resolution discrimination of a variety of cyanobacteria by means of DGGE analysis of the internal transcribed spacer, or parts thereof between the 16S and 23S rRNA genes (rRNA-ITS). A forward primer specific for cyanobacteria was designed, targeted at the 3'-end of the 16S rRNA gene.
- Cyanobacteria are a major component of many aquatic and terrestrial ecosystems and can be found in virtually all habitat types, including marine and freshwater environments, deserts, hot springs, hypersaline environments, rocks and ice. In addition, they can be involved in symbiotic associations with a remarkable range of eukaryotic host organisms. In all these environments, cyanobacteria are major contributors to photosynthesis and nitrogen fixation (38). Cyanobacterial populations may reach high densities during blooms in surface waters. Detrimental effects of such blooms are of growing concern for water managers worldwide (9). For ecological studies of cyanobacteria it is essential to be able to differentiate between closely related organisms.
- DGGE Denaturant gradient gel electrophoresis
- Isolated cultures can be assigned to field populations based on the comparison of their DGGE profiles, and sequence information from profile bands can be used to characterize the organisms that are present.
- a section of DNA is suitable for DGGE analysis if it can be specifically amplified from the target organisms, has sufficient sequence heterogeneity for the desired resolution and, preferably, is part of a gene of which a considerable number of sequences have been deposited in sequence databases.
- DGGE of hetR a gene assigned to heterocyst differentiation, has been used to study the diversity in isolated strains of the cyanobacterial genera Trichodesmium and Nostoc (28, 32).
- nifH a gene encoding dinitrogenase reductase in many microorganisms including cyanobacteria (42), has been used for DGGE analysis of the very diverse functional group of diazotrophic (N2 -fixing) organisms (22).
- rRNA-ITS very suitable for high-resolution analysis of cyanobacteria.
- Restriction enzyme digestion (RFLP) of rRNA-ITS has been used to resolve closely related cyanobacterial strains (21, 23, 26, 32), and direct sequencing has been used to study subgeneric phylogenetic relationships in genera such as Microcystis (30), Trichodesmium (28) and picocyanobacteria (34).
- RFLP Restriction enzyme digestion
- rRNA-ITS sequences have been used for analysis of Synechococcus (4) and Aphanizomenon (20).
- Lakes Kinselmeer and Sneekermeer are shallow lakes (maximum depth approximately 3 m), and Volkerak and Zeegerplas are deeper lakes (maximum depth 15m and 25 m respectively). All lakes have extensive blooms of various cyanobacteria, mostly in spring and summer. Water samples from the lakes were collected 0.5 m below the surface in sterile bottles from a boat in the middle of the lake and stored in the dark at 4°C. Within four hours after sampling, a volume of 250 ml water (or less if the filter clogged) was filtered over a 25 mm diameter, 0.2 mm pore size mixed esters filter (ME 24, Schleicher & Schuell, Dassel, Germany).
- the filter was cut in two with a sterile scalpel and each half was stored in a microcentrifuge tube at -80°C until further processing.
- DNA from filters containing field samples was isolated as described by Zwart et al. (43).
- DNA from the pellet of 2 ml cyanobacterial cultures in which growth was visible by eye was isolated by means of the DNA isolation procedure described by Tillett et al. (37). Strain isolation and culture conditions. Strains of cyanobacteria used in this study are given in Table 1. Cultures isolated in this study (Microcystis sp.
- the bacteria used as negative controls to test the specificity of the primers were Serratia marcescens (DSM 1636), Acinetobacter calcoaceticus strain BD4 (DSM 586), Erwinia carotovora carotovora (DSM 30168), Escherichia coli (DSM 423), Rhodococcus erythropolis (DSM 43188), Lactobacillus reuteri (DSM 20016), Lactococcus lactis lactis (NIZO-81), Bacillus polymixa (DSM 36), Bacillus subtilis (DSM 10), and Pseudomonas stutzeri (DSM 5190).
- sequences with a given number of mismatches was determined using probe match, followed by a correction for degenerate base positions in the primer sequence.
- Sequences from the rRNA-ITS region were obtained from Genbank/EMBI.JDDBJ and were aligned using the programs ClustalW and the BioEdit Sequence Alignment Editor (12).
- PCR amplification Primer sequences and references are given in Table 2.
- the forward primer for amplification of part of the 16S rRNA gene was slightly modified from Nubel et al (27) to further improve their theoretical specificity. This because the efficiency of amplification, and thereby the selectivity of the primer, is typically determined by the nature of the 3' end nucleotides. (19, 35).
- PCR amplification was performed in a MBS 0.5 S thermocycler (ThermoHybaid, Ashford, UK) in a 25 ml reaction mixture containing approximately 50 ng of DNA, [10 mM Tris/HCl pH 8.3, 50 mM KCl, 0.01% w/v gelatin, 200 mM of each deoxynucleotide, 1.5 mM MgCl2, 2.5 units of Taq DNA polymerase (Boehringer Mannheim, Mannheim, Germany) and 0.5 mM of each primer].
- the temperature cycling conditions for the amplification of part of the 16S rRNA were modified slightly from (27).
- ITSa, ITSb, and ITSc were as follows. After a pre-incubation at 94°C for 5 min, a total of 30 cycles were performed of 94°C for 1 min, Ta for 1 min and 72°C for 1 min. In the first twenty cycles, Ta decreased by 1°C after every second cycle from 62°C in the first cycle to 52°C in the twentieth.
- PCR products were separated on a 1.5 mm thick, vertical gel containing 8% (w/v) polyacrylamide (37.5:1 acrylamide: bisacrylamide) and a linear gradient of the denaturants urea and formamide, increasing from 25 or 30% at the top of the gel to 40% at the bottom.
- concentrations depended on the gene products that were analyzed and are given in the figure legends.
- 100% denaturant is defined as 7 M urea and 40% v/v formamide.
- Electrophoresis was performed in a buffer containing 40 mM Tris, 40 mM acetic acid, 1 mM EDTA, pH 7.6 (0.5 x TAE) for 16 hours at 75 V.
- the gel was stained for 1 h in water containing 0.5 ⁇ g ml-1 ethidium bromide. An image of the gel was recorded with a CCD camera system (Imago, B&L Systems, The Netherlands). Sequencing of DNA from DGGE bands. A small piece of gel from the middle of the target band was excised from the DGGE gel and incubated in 50 ml sterile milli-Q for 24 hours at 4°C. The eluent was reamplified using the original primerset and run on DGGE to confirm its identity. For sequence analysis, the eluent was reamplified with reverse primers that had M13 priming sites added 5' of the original primers.
- PCR products were purified using the Concert Rapid PCR Purification System (GibcoBRL Life Technologies, UK), and these products were used as templates for sequencing reactions with the Thermo Sequenase Primer cycle sequencing kit (Amersham Pharmacia Biotech, USA). Sequencing reaction products were analyzed on an ALF Express II sequencer (Amersham Pharmacia Biotech, USA) with CY5 fluorescence labeled M13 sequence primers or a labeled GC-clamp. The sequences were deposited at EMBL and were assigned accession numbers AJ579895-AJ579906.
- Sequences were processed using the program sequencher version 4.0.5 (Gene Codes Corp., MI, USA) and similarity with sequences deposited in Genbank/EMBL/DDBJ was checked using the program Blast (2)(via http://www.ncbi.nlm.nih.gov/BLAST/).
- ITSa was amplified from the selected cultures, and for each strain the amount of PCR product was estimated from an agarose gel.
- the PCR products were mixed and diluted in order to obtain template DNA from selected cultures, or from mixtures thereof, all in identical final concentrations. This template DNA was used for ITSa amplification and the PCR products were analyzed on a DGGE gel.
- a combined probe search was performed in the RDPII database (using the check_probe program) and in an ARB database containing more than 8000 full length 16S rRNA prokaryotic sequences (using the probe match option in ARB). No sequences of prokaryotes other than cyanobacteria were found with less than three mismatches, 2 sequences (from Ammonifex degensii and Thermodesulfobacterium hverag) had 3 mismatches, 116 sequences had 4 mismatches, and the remainder had 5 or more mismatches.
- a BLAST search (2) of the primer sequence yielded only cyanobacteria in the hits with highest similarity scores.
- the forward primer presented in Table 2 had a complete or almost complete match with cyanobacterial sequences, but also some sequence similarity with several non-cyanobacterial 16S rRNA sequences in the database.
- To confirm the selectivity of the primers for amplification of cyanobacterial rRNA-ITS we tried to amplify DNA from bacterial strains with some degree of sequence homology to the forward primer (4 to 5 mismatches), and from a few randomly chosen strains. No PCR products were generated from these bacteria, neither at the optimized annealing temperature (as described below), nor 10 degrees below this temperature.
- the phylogenetic coverage within the cyanobacterial phylum of the primers was investigated by using DNA from strains of a range of different cyanobacterial genera as template for PCR amplification (Table 3). For each primer combination, the highest temperature at which PCR products were generated for all genera was selected as optimal PCR amplification temperature. As a consequence, for several genera amplification is possible at higher annealing temperatures then those used in our optimized protocol. The number of PCR products and their sizes and relative intensities varied between the different genera (Table 3). For all strains that were tested, ITSa amplification yielded one band of 275 to 350 bp.
- ITSb amplification resulted in PCR products between 350 and 800 bp for most tested strains, with the exception of Synechocystis, Leptolyngbya and Lyngbya.
- One PCR product was formed from the genera Microcystis, Pseudanabaena, Planktothrix, Trichodesmium, Prochlorothrix and Synechococcus, and two PCR products from Aphanizomenon, Anabaena, Anabaenopsis, Gloeotrichia, Nodularia, Nostoc and Cylindrospermopsis.
- ITSc primers successfully amplified DNA from all strains that were tested, yielding for most genera PCR products ranging between 450 and 900 bp.
- Prochlorothrix hollandica yielded one very long product of 1050 basepairs.
- Amplification with ITSb or ITSc primers yielded the same number of bands for most strains, only ITSc amplification of Planktothrix strains produced two bands instead of one.
- High-resolution separation of Microcystis strains by means of rRNA-ITS DGGE The ability to differentiate related organisms by means of DGGE was examined using a number of Microcystis strains that had been isolated from Dutch lakes or obtained from culture collections (see Table 1 for details).
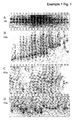
- the DGGE gels in Figure 1 demonstrate the possibility to separate PCR products obtained with the primerset targeted at the 16S (A), ITSa (B), ITSb (C), and ITSc (D), using DNA from 20 selected Microcystis strains.
- the 16S rRNA PCR product of approximately 450 basepairs gave rise to two bands in the DGGE gel, occupying identical positions for all strains (Fig. 1A). The occurrence of two bands can be explained by the presence of degenerate bases in the non GC-clamped reverse primer (Table 2).
- ITSa amplicons (approximately 325 bp) resulted for most of our isolated strains and all culture collection strains in one DGGE band, for many strains on a unique position (Fig. 1B).
- Examples of strains with more than one band are V40 with three bands (lane 20, the upper band is not on the figure), and V88 (lane 19) with four bands.
- These profiles containing two or more bands were encountered predominantly in Microcystis cultures that had been established by isolating single colonies. Compared to plating, this isolation strategy is more likely to yield cultures that are not yet unialgal.
- the upper bands in lanes 19 and 20 resulted from heteroduplex formation (15) as was confirmed through excision, reamplification and DGGE analysis of these bands.
- ITSa amplicons from strains CYA228 (lane 10), PCC7820 (lane 11) and PCC7806 (lane 12) were undistinguishable and differed only faintly from those of strain V91 (lane 13) (Fig. 1B), whereas ITSb or ITSc amplicons enabled a clear separation and left only CYA228 and PCC7820 undifferentiated (Fig. 1C and 1D).
- strains PCC7806 (lane 12) and V28 (lane 17), could hardly be distinguished when analyzing ITSb or ITSc amplicons, but occupied clearly different positions in the DGGE gel when ITSa amplicons were used (Fig. 1B-D).
- the presence of several homologous DNA templates may affect PCR amplification and result in heteroduplex (see above) and chimera formation.
- FIG. 2 shows the DGGE banding patterns generated from template mixtures of 2, 3, 5, or 7 Microcystis strains. In spite of the presence of several related sequences, each strain in the mixtures gave rise to one single band of similar intensity, and no additional bands were detected.
- ITSa amplification gave rise to one sharp band, mostly occupying a unique position in the gel (Fig. 3A). Only Aphanizomenon gracile yielded two bands. Also, the longer amplification products of ITSb and ITSc were analyzed using DGGE (Fig. 3B). The patterns for ITSb were mostly similar to those of ITSc and are therefore not shown. Strains from the genera Synechococcus, Synechocystis, Lyngbya, Pseudanabaena, Trichodesmium, and Prochlorothrix, yielded one band (Fig. 3). Leptolyngbya had a second band of lower intensity.
- Primer 16CITS we found 71 non-cyanobacterial sequences with 2 mismatches (as opposed to 0 for primer CSIF), and 266 sequences with 3 mismatches (as opposed to 2 for CSIF). Primer CSIF can therefore be considered more specific for cyanobacteria. Nevertheless, we emphasize that this was based on sequences in the current database and no experimental comparisons between the primers were made. Coverage of a broad range of genera of primer CSIF was confirmed by software tool Probe Match using published cyanobacterial sequences, and was supported by in vitro tests (Table 3 and Fig. 3).
- PCR products can be formed from all strains from the genera Nostoc and Spirulina (2 or 3 mismatches in deposited sequences), from Gloeobacter and Calothrix (3 mismatches), by including specific primers for these genera, i.e. reducing the mismatches to two or less.
- ITSa DGGE band could be explained by identical sequences at the 5'-end of different rRNA-ITS operons.
- primerset ITSc is preferable in most cases. Compared to ITSb analysis the resolution was similar (compare Figs 1C and 1D), yet more genera could be amplified and there is more sequence information contained in the amplicons (60-100 bp extra, see Table 3). Nevertheless, for some genera primerset ITSb was more suitable for DGGE profiling.
- ITSb amplification products of Nodularia yielded sharp DGGE bands (data not shown), whereas ITSc DGGE resulted in diffuse bands, unsuitable for analysis (Fig. 3B).
- DGGE profiles resulting from ITSb amplication of Planktothrix aghardii were relatively simple (1 band) compared to the profile resulting from ITSc amplification (3 bands). Due to the occurrence of multiple rRNA-ITS operons in one organism, identification of all dominant bands produced with ITSb and ITSc primers is necessary to come to a reliable estimate of the diversity of cyanobacteria in complex DGGE profiles. It has to be emphasized that DGGE diversity profiles do not necessarily reflect the true diversity in the field.
- DNA extraction efficiency and the number of rRNA operons may vary between genera, and the PCR step has several inherent pitfalls, which complicate the interpretation of DGGE profiles of communities.
- Artefacts introduced by the PCR amplification reaction of homologous sequences include chimera (17) and heteroduplex formation (15) which may lead to an overestimation of the number of organisms, and template annealing (36) and preferential amplification of some DNA templates (33) which may result in a shift in the apparent ratio between organisms after PCR amplification.
- Heteroduplex bands were formed in some cultures suspected of containing more than one Microcystis isolate (Fig. 1), and in some organisms containing multiple operons (Fig. 3).
- Microcystis colonies based on rRNA-ITS sequences correlates with microcystin production.
- ecological studies of toxic and non-toxic cyanobacteria are now feasible through studies of rRNA-ITS genotypic diversity in isolated cultures or colonies, and in natural communities.
- Microcystis colonies (107) were isolated from 14 European and 1 Paint lakes, the presence of microcystins in each colony was examined by MALDI-TOF, and they were grouped using rRNA-ITS DGGE. Based on DGGE analysis of amplified ITSa and ITSc fragments, yielding supplementary resolution (Janse et al., 2003), 59 classes could be distinguished.
- Microcystin-producing and non-producing colonies were separated into different classes. Sequences obtained from at least one representative strain from most classes were congruent with the classification based on rRNA-ITS DGGE. Alignment of these colony sequences and published rRNA-ITS sequences from cultured Microcystis strains of known toxicity confirmed that microcystin production correlated with rRNA-ITS sequences. About 30% of the analyzed colonies gave rise to more than one band in DGGE profiles, indicating either aggregation of different colonies or the occurrence of sequence differences between multiple operons in some strains.
- Microcystins are cyclic heptapeptides, formed non-ribosomally by peptide- and polyketide-synthetases. More than 70 structural microcystin variants are known to date (12).
- microcystin producing and non-producing strains coexist in natural populations (6, 28). Strains isolated from the same bloom sample are constitutively toxic or non-toxic (14, 19, 28) and the cellular microcystin content may differ considerably between strains (2).
- the decisive factor determining the average cellular microcystin content in a given natural population, and thereby the toxicity of a bloom, is the abundance of microcystin producing strains (4).
- microcystin synthetase (mcy) gene cluster (5, 25), for identification of toxic Microcystis strains.
- This approach has the obvious advantage of a direct relationship between gene detection and toxicity, provided non-toxic strains do not possess the gene. Detection by PCR of the mcyB gene, the mcyA gene, or the adenylation domain within the microcystin synthatase gene cluster, showed good correlation with toxin production, but some anomalies were found.
- a small number of Microcystis strains contained the mcy gene cluster but lacked detectable microcystins (10, 15, 17, 18, 26).
- Microcystis colonies from a field population in size classes and showed through quantification of genotypes with and without the mcyB gene that larger colonies were mainly responsible for microcystin production.
- Microcystis specific primers targeted at mcyB (13) did not yield PCR products from 39% of microcystin containing colonies (false negatives).
- combination with a diagnostic PCR targeted at mcyA resulted in only a few (4.9%) false negatives, as well as a few (2.5%) false positives (29).
- strain differentiation was based on sequence differences in universal genes, the pitfalls of diagnostic PCR when using mcy gene detection (occurrence of false positives and negatives) were avoided. Moreover, this approach provides ecologically relevant insights into the dynamics of all cyanobacterial strains that are present in a natural community. Instead of focusing on the limited subgroup of mcy gene-containing Microcystis strains, different toxic and non-toxic strains can be distinguished. Finally, since colony properties other than microcystin production (such as the production of other - potentially toxic- peptides) may also correlate with rRNA-ITS classification, this gene offers possibilities for characterization of a broader range of strain properties. It is preferred that all strains that can be encountered are characterized with regard to the strain properties of interest (such as toxin production) and rRNA-ITS sequence information.
- Colonies were transferred into a reaction tube (0.5ml) containing culture medium (final sample volume 4-30 ⁇ l) and the presence of each colony in the tube was verified microscopically.
- the tubes were frozen (liquid nitrogen) and thawed several times to disintegrate the colonies, and stored at -20°C. Aliquots from each tube were used for gene amplification and for matrix-assisted laser desorption/ionization time-of-flight mass spectrometry (MALDI-TOF MS).
- Measurements were performed in the delayed extraction mode, allowing the determination of monoisotopic mass values.
- a low mass gate of 500 improved the measurement by filtering out the most intensive matrix ions.
- Chlorophyll-a degradation products phaeophytine-a and phaeophorbide-a with mass values of m/z 871.57 and 593.27 Da were used for internal calibration.
- microcystins were identified by Post Source Decay (PSD) measurements of fragment ions.
- the precursor ions were selected with a Time Ion Selector having a mass window of 10 mass units.
- the operating voltages of the reflectron were reduced stepwise to record 12 spectral segments sequentially.
- PSD analysis were performed directly from the same colony on the template.
- Lakes 't Joppe and Zeegerplas are eutrophic lakes (maximum depth approximately 25 m) which are stratified during the summer. Water samples were collected 0.5 m below the surface, or from surface scum, in sterile bottles from a boat in the middle of the lake and stored in the dark at 4°C. Within four hours after sampling, a volume of 250 ml water or less if the filter clogged, was filtered over a 25 mm diameter, 0.2 mm pore size mixed esters filter (ME 24, Schleicher & Schuell, Dassel, Germany). The filter was cut in two with a sterile scalpel and each half was stored in a microcentrifuge tube at -80°C until further processing. DNA from filters containing field samples was isolated as described by Zwart et al. (31).
- Primer sequences and amplification conditions were according to (9).
- Primer CYA 371F forward primer for nested PCR
- Primer GC-CSIF forward primer for ITSa and ITSc amplification
- 5'- GYC ACG CCC GAA GTC RTT AC-3' 5'- GYC ACG CCC GAA GTC RTT AC-3'.
- Primer 373R (reverse primer for ITSa amplification) had the following sequence: 5'- CTA ACC ACC TGA GCT AAT-3', and primer ULR (reverse primer for nested PCR and for ITSc amplification) had the following sequence: 5'- CCT CTG TGT GCC TAG GTA TC-3'.
- PCR amplification was performed in an MBS 0.5 S thermocycler (ThermoHybaid, Ashford, UK) in a 25 ml reaction mixture containing approximately 50 ng of DNA, (10 mM Tris/HCl pH 8.3, 50 mM KCl, 0.01% w/v gelatin, 200 mM of each deoxynucleotide, 1.5 mM MgCl2, 2.5 units of Taq DNA polymerase and 0.5 mM of each primer).
- the temperature cycling conditions for the amplification of rRNA-ITS, ITSa and ITSc (9) were as follows.
- DGGE was performed essentially as described by Muyzer et al. (16). Briefly, PCR products were separated on a 1.5 mm thick, vertical gel containing 8% (w/v) polyacrylamide (37.5:1 acrylamide: bisacrylamide) and a linear gradient of the denaturants urea and formamide, increasing from 25 or 30% at the top of the gel to 40% at the bottom. The concentrations depended on the gene products that were analyzed and are given in the figure legends. Here, 100% denaturant is defined as 7 M urea plus 40% v/v formamide.
- Electrophoresis was performed in a buffer containing 40 mM Tris, 40 mM acetic acid, 1 mM EDTA (pH 7.6) (0.5' Tris-acetate-EDTA buffer) for 16 hours at 75 V.
- the gel was stained for 1 h in water containing 0.5 ⁇ g ml-1 ethidium bromide. An image of the gel was recorded with a CCD camera system (Imago, B&L Systems, The Netherlands).
- Sequences from the rRNA-ITS region were obtained from Genbank/EMBL/DDBJ and were aligned using the programs ClustalW, the BioEdit Sequence Alignment Editor (7), and the program package ARB (www.ARB-home.de). Trees were constructed from aligned sequences using ARB and Treecon (27).
- Microcystis colonies exhibited intermediate morphological characteristics. For details on relative abundances and distribution over the sampled lakes of these morphotypes, we refer to their paper. In 123 out of 151 colony samples we obtained, the presence of toxins had been determined by MALDI TOF MS and in 111 of these colonies toxin production capacity had been confirmed by PCR detection of the mcy gene. Eight colonies that had not yielded a MALDI TOF signal, had been characterized by mcy PCR only.
- the resulting PCR product was diluted and used as template for amplification of the 3'-end of the 16S plus part of the rRNA ITS (ITSa) by using cyanobacteria specific 16S primer CSIF in combination with ITS primer 373R, or for amplification of a longer fragment spanning the entire rRNA ITS (ITSc) by using primers CSIF and ULR (9).
- Colonies were differentiated by analysis of ITSa amplicons on DGGE. Based on the position of ITSa bands in the gel (Fig. 1), colonies were assigned to 27 different groups (Table 1). To enable between gels comparison of bands, each new batch of colonies was analyzed together with a mixture of colonies assigned to different groups and thus representing different gel positions. Differentiation of colonies based on ITSc DGGE was more difficult due to the smaller differences in migration of the longer sequences. Nevertheless, colonies could be assigned to 19 different groups based on ITSc DGGE (Table 1). Several of the colonies gave rise to profiles with two or more bands (e.g. Fig 1, colonies #63 or #147).
- ITSa bands on DGGE was not a sufficient determinant for differentiation of all toxic and non-toxic colonies.
- ITSa group 11 for instance, several non-toxic colonies were grouped together with a majority of toxic ones (Table 1).
- colonies could be sufficiently set apart to allow classification of toxic and non-toxic colonies into distinct groups. Only one colony (#100, see ITSa group 18 and ITSc group 18, denoted as 18a/18c) in which a toxin was identified could not be differentiated from non-toxic colonies on the basis of ITS DGGE.
- ITSc was sequenced from colonies and bands representative for most of the DGGE classes of Table 1.
- colony #60 and #105 in classes 19a/12c plus 26a/12c and 18a/17c plus 24a/17c respectively
- sequencing of two ITSa bands resolved ambiguous base calls resulting from a mixture of sequences that were not separated on ITSc DGGE.
- ITS DGGE classes we obtained from 15 classes multiple sequences, from 29 classes one sequence and from 14 classes no sequences. Attempts to obtain sequences from some bands (e.g.
- ITS differentiated sequence 12 from 15-1 in class 8a/5c and a substitution in the 16S differentiated 10-u from the other sequences in class 11a15c.
- Microcystis rRNA ITS sequences were aligned and phylogenetic trees were constructed based on the alignment of ITSa or ITSc fragments. The ITSa tree revealed that sequence differences in the ITSa region were sufficient for discrimination of toxic and non-toxic colonies (data not shown). The only exception was toxic colony #100 which had an ITS sequence identical to that of non-toxic colonies #87 and #89, which had been classified in the same ITS DGGE class 18a/18c (see above and Table 1).
- Toxic colony #39 (27a/19c) had an ITSa sequence identical to 5 non-toxic M. novacekii strains (TAC66, TAC65, TAC20, CC2, BC18), and non-toxic colony ITSa sequences 148 (18a/7c) and 105-u (18a/17c) were identical to two non-toxic M. ichtyoblabe strains (TAC136 and TAC138) but also one toxic M, ichtyoblabe strain (TAC125).
- ITSa and ITSc DGGE profiles from the water samples from which most colonies had been harvested. These samples had been taken from the water column of Lakes 't Joppe and Zeegerplas in June, August and September 2001, and from the surface scum of 't Joppe at the latter two sampling dates. Ambient abiotic parameters, microcystin concentrations, and cell and colony numbers are given in Table 2. Microbial communities from these lakes were collected on filters and ITSa and ITSc DGGE profiles were generated (Fig. 2). The number of different sequences that could be distinguished in ITS DGGE community profiles of water samples, was lower than the number that had been identified based on isolated colonies.
- ITSa community profile from 't Joppe we detected 12 bands (4 of which less distinct) in the lower part of the gel where Microcystis sequences were expected, and 6 bands in the upper part of the gel, while isolated Microcystis colonies from this lake had been differentiated into 18 groups based on ITSa DGGE (Table 1).
- ITSa community profiles from the Zeegerplas 8 different Microcystis bands (2 less distinct) were discernable, while colony analysis had resulted in the identification of 9 groups.
- ITSc DGGE yielded for both lakes profiles with 8 bands (1 less distinct) in the lower part of the gels, while colonies isolated from 't Joppe and Zeegerplas had been differentiated in 15 and 7 groups, respectively (Table 1).
- Genotype analysis using DGGE enables processing of many samples, assessment of the purity of isolated cultures or colonies, and detection of various genotypes in complex natural communities. Differentiation of colonies was achieved by means of ITSa and ITSc DGGE. Although a somewhat better separation of bands could be achieved by ITSa DGGE (Fig. 2), ITSc DGGE yielded supplementary resolution and contaminant detection in several cases, and provided more sequence information (9)(Table 1). DGGE based on ITSa or ITSc alone yielded insufficient resolution for discrimination of toxic and non-toxic Microcystis strains. In combination, however, these methods provided a suitable basis for identification of toxic strains (Table 1).
- ITSa The partial rRNA-ITS sequences covered by ITSa amplicons discriminated toxic and non-toxic colonies in our dataset. Therefore, sequences from ITSa DGGE profiles were suitable for identification of toxic colonies.
- ITSc sequences covering the entire ITS (ITSc) confirmed the colony classification and identification of toxic groups based on ITSa and ITSc DGGE (sequences differed between classes and were mostly identical within a class).
- the occurrence of a few colonies within a class with slight (one basepair) sequence differences could be explained by the position of this basepair in the 3' region, which forms the high melting domain. In this region, base substitutions do not result in altered migration on DGGE.
- one basepair differences could be detected clearly as evidenced by the upper and lower bands from e.g. colony #41.
- the multiple sequences in a portion of the colonies may be explained by contamination from aggregated colonies which were not separated despite thorough washings during isolation, or by the occurrence of multiple different rRNA operons in a portion of Microcystis strains. This can be resolved by further replating and cloning of the respective strains. The occurrence of different operons in a portion of the Microcystis strains would imply considerable intragenus variability. The most parsimonious explanation would be the presence in the genus Microcystis of at least two rRNA operons, identical in sequence in most strains and with mutations in one operon in a portion of the strains.
- Two sequences derived from a non-toxic colony will correspond to one or two non-toxic Microcystis strains, however, one of the sequences in a toxic colony could be derived from a non-toxic contaminant.
- a second solution would be based on expanding the available database of sequences assigned to toxic and non toxic strains to infer properties of the colonies of interest. The variation in Microcystis ITS between strains was restricted to approximately 11% of the sequence positions.
- Regions D1, D1', D2, D4, and D5 are required for correct folding of the rRNA transcript, indispensable for the prematuration of the 16S and 23S rRNA molecules by RNase III. Premature termination of transription of the rRNA operon is prevented by antiterminator sites.
- Antiterminator Box A sequences are reasonably well conserved within bacteria and are immediately preceded by a Box B stem of more variable sequence.
- Microcystis rRNA-ITS also contains one highly conserved tRNAile gene.
- Microcystin concentration in water samples were well below the 10mg/L guideline for safe recreational waters (3) but exceeded this concentration considerably in scums. Although care is needed in quantitative interpretations of band intensities.
- the methods of the present invention are suitable for identification of the most abundant organisms in field populations. Initial cell numbers of Microcystis strains are likely to correlate well with DGGE band intensities since the efficiencies of DNA isolation and amplification are comparable (see also above).
- the dominant bands in community profiles could correspond to non-colony forming Microcystis strains that are missed by the colony isolation procedure yet are detected in community profiles generated from filtered water samples.
- a more intensive sampling and colony isolation study can be used to elucidate the sequence identity of all bands in the community profiles and thereby substantiate insights in the dynamics of Microcystis colonies.
- Probe P1514 was designed as general probe to hybridize with all Microcystis strains and thus serve as positive hybridization control. All sequences tested hybridized with this probe.
- Probe Pla354 (52) was designed to hybridize with strain 1A only (which includes only toxic isolates). Only group 1A sequences hybridized with this probe, no cross-reactivity was observed.
- Probe P1all was designed to hybridize with all strains from cluster 1 (which includes toxic strains 1A and 1B and non-toxic strains 1C and 1D). 1A, 1B and 1C sequences hybridized with this probe, however, one sequence from strain7 (BK10-o) also did, which call for further optimization of reaction conditions.
- Probe P2all was designed to hybridize with all strains from cluster 2 (which includes toxic strains 2A and 2B). Only strain 2A and 2B sequences hybridized with this probe and no cross-reactivity was observed.
- Probes were designed on the basis of rRNA ITS sequences from 129 different cyanobacterial isolates (EMBL database accession numbers AB015357 to AB015403 ⁇ Otsuka et al, 1999 ⁇ and AJ605140 to AJ605221. The sequences were aligned using the software ARB to the alignment/database, release june 2002, provided by W. Ludwig of the ARB bioinformatics group ( http://www2.mikro.biologie.tu-muenchen.de/arb/ ). Using the program Treecon (van de Peer et al) a distance tree was calculated using a neighbor joining algorithm. Among the 129 ITS sequences we identified 13 clusters of sequences.
- Cluster 1 was subdivided into 4 strains (strain 1a,1b,1c and 1d)
- cluster2 was subdivided into 2 strains (strain 2a and 2b)
- cluster 5 was subdivided into 6 strains (strain 5a, 5b, 5c, 5d, 5e and 5f). All other clusters (3,4,6 to 13) were designated strains for the purpose of the present invention.
- sequences belonging to this strain had very high similarity or were identical.
- multiple probes were designed, 20 nucleotides in length, using the tool 'probe design' in the package ARB.
- probes were found that were specific for a combination of strains such for strains 8 and 9, for strains 2b, 5a and 6, for strains 2b 5d 5e and 6, for strains 10, 11, 12, 13 (Table 3B of Example 3)
- the output of probe match which is a list of matching sequences to the investigated probe, also contains flanking sequences. If possible, we extended each probe with 1 to 8 flanking nucleotides (adjacent to the probe sequence at 3' and 5' side) that were shared by all sequences that had perfect match to the 20 nucleotide investigated probe.
- probes are covalently bound to a membrane and the target DNA is applied in solution ⁇ Dattagupta, 1989; Saiki, 1989 ⁇ .
- Reverse line blot hybridization is a modification introduced by Kaufhold et al ⁇ Kaufhold,1994 ⁇ in which the probes are applied as lines instead of dots.
- Hybridization with labeled target DNA in lines perpendicular to the probe lines enables simultaneous testing of several samples to several probes.
- a detailed protocol is available at http://www.nioo.knaw.nl/cl/me/.
- a Biodyne C membrane (Pall Europe Ltd, Portsmouth, UK) is activated by incubation for 10 min in a rolling bottle at room temperature in 16% 1-ethyl-3-(3-dimethylaminopropyl)carbodiimide (Sigma-Aldrich, St. Louis, MO), rinsed with tapwater, and placed on a PC200 support cushion (Immunetics, Cambridge, MA) in a Miniblotter 45 manifold (Immunetics), with screws handtight. Slots are filled with 150 ⁇ l of 0.66, 2, 6.6, 20 ⁇ M probe solution (probes in Table 3 Example 3) in 500 mM NaHCO3 (pH 8.4).
- Probes are allowed to bind at room temperature for 5 minutes, after which the probe solution is aspirated from the slots.
- the blot is then removed from the manifold using forceps and incubated for 8 minutes at room temperature in 100 mM NaOH in a rolling bottle to inactivate the membrane.
- SDS sodium dodecyl sulphate
- the prepared membrane is washed in 200 ml 20 mM NaEDTA pH 8 at room temperature for 15 min, sealed in seal foil (Audion Electro, Weesp, Netherlands) to avoid dehydration and kept at 4°C until use.
- Hybridization After incubation in 2 x SSPE/0.1% SDS at room temperature for 5 min, the probe-carrying membrane is placed on the support cushion in the manifold, rotated 90° from the orientation of probe application. Each PCR products is denatured in 150 ⁇ l 2 x SSPE/0.1% SDS in a 0.5 ml microcentrifuge tube at 99°C for 10 min and immediately thereafter chilled on ice. Then, all PCR products are applied to the slots and slots without PCR product are filled with 2 x SSPE/0.1% SDS. Hybridization is performed in the manifold at 42°C for 60 min on a horizontal surface without agitation.
- the membrane is washed by two subsequent incubations in a rolling bottle (with mesh) in 200 ml 2 x SSPE/0.5% SDS at 52°C for 10 min (stringent wash). Detection.
- the washed membrane is incubated in 10 ml of a 1:4000 dilution of peroxidase labeled streptavidin conjugate (Roche, Mannheim, Germany) in 2 x SSPE/0.5% SDS, in a rolling bottle at 42°C, for 45 min.
- the membrane is then washed twice in 200 ml 2 x SSPE/0.5% SDS at 42°C for 10 min and rinsed twice in 200 ml 2x SSPE at room temperature for 5 min.
- Each of these variant probes has different melting characteristics when tested in actual hybridization, thus allowing selection of the optimal probe for particular assays.
- the optimal probe pairs high sensitivity with high selectivity. 13 probes were selected that were highly specific, meaning that they have perfect match for sequences of the target strain or cluster and two or more mismatches to strains that are not part of the target strain or cluster. For probe P2all252-48 longer versions of the probe, with higher theoretical melting temperatures could not be designed because of the variation of the flanking nucleotides within cluster 2. 33 probes were selected that had perfect match to most sequences from the target strain or cluster and one or more mismatches to sequences that are not part of the target strain or cluster.
- Fig. 2 of example 3 shows an example of a hybridization result.
- the isolated colonies used for this example were K63-b, K15-o, K60, K12, K65. K13, K21, K75-b, K69, K75-o, K10-o, K51, K72, K123, K10-b, K104, K139-o, K47-o, K74, K57, K34, K58, K16, K49.
- These colonies were obtained from lake water samples through microscope assisted micromanipulation as described in example 2.
- Probe P1514 -52 was designed as general probe to hybridize with all Microcystis strains and thus serves as positive hybridization control. All sequences tested hybridized with this probe. Probe P1a251 -52 was designed to hybridize with group 1A only (which includes only toxic strains).
- Probe P1all36 -52 was designed to hybridize with all strains from cluster 1 (which includes toxic strains 1A and 1B and non-toxic strains 1C and 1D). 1A, 1B and 1C sequences hybridized with this probe, however, one sequence from strain 6 (K10-o) also did ( Figure 2 of Example3). Probe P2all252 -52 was designed to hybridize with all strains from cluster 2 (which includes toxic strains 2A and 2B). Only strain 2A and 2B sequences hybridized with this probe and no cross-reactivity was observed (Figure 2 of Example3).
Landscapes
- Chemical & Material Sciences (AREA)
- Life Sciences & Earth Sciences (AREA)
- Analytical Chemistry (AREA)
- Proteomics, Peptides & Aminoacids (AREA)
- Organic Chemistry (AREA)
- Zoology (AREA)
- Wood Science & Technology (AREA)
- Health & Medical Sciences (AREA)
- Engineering & Computer Science (AREA)
- Microbiology (AREA)
- Immunology (AREA)
- Molecular Biology (AREA)
- Biotechnology (AREA)
- Biophysics (AREA)
- Physics & Mathematics (AREA)
- Biochemistry (AREA)
- Bioinformatics & Cheminformatics (AREA)
- General Engineering & Computer Science (AREA)
- General Health & Medical Sciences (AREA)
- Genetics & Genomics (AREA)
- Measuring Or Testing Involving Enzymes Or Micro-Organisms (AREA)
Abstract
The present invention is concerned with the typing of cyanobacteria. Methods and nucleic acids for use therein are presented with which preparations comprising a cyanobacterium can be tested and the cyanobacterium therein classified. The classification can be used to correlate the cyanobacterium in the preparation to a pheno- and genotypic characteristics known for the typed strain. This information is useful in the variety of different applications, for instance in predicting and/or characterising toxic blooms of cyanobacteria in surface water bodies.
Description
The present invention relates to the field of cyanobacteria, in
particular it relates to the development of means and methods for classifying
cyanobacteria.
Worldwide, eutrophic freshwater lakes endure noxious blooms and
surface scums caused by cyanobacteria from, for instance, the genus
Microcystis. During many blooms, Microcystis cells produce the hepatotoxin
microcystin which is toxic to humans and many other eukaryotes (3).
Microcystins are cyclic heptapeptides, formed non-ribosomally by peptide- and
polyketide-synthetases. More than 70 structural microcystin variants are
known to date (12).
Water management authorities need to determine whether and to
what extent blooms of cyanobacteria can influence the water quality of their
surface waters. Not only for the conversion into drinking water but also to
maintain a balanced environment in the body water and to prevent toxic
effects on recreational users of the water bodies. Toxin measurements of
surface freshwater lakes can provide insight into the actual situation at the
moment of sampling, however, these immediate tests are not suited when
predictions about future development of the toxin levels are needed such as for
a proper assessment of the hazards that Microcystis blooms pose on human
health and aquatic ecosystems.
Cyanobacteria have been classified using a number of different
methods. Traditionally, cyanobacteria are classified on the basis of
morphological characteristics. Recently, hybridisation to 16S rRNA probes has
been used for classifying this particular group of bacteria. This technique has
the disadvantage that much of the variation within the group of cyanobacteria
is not seen. The reason is most likely that the 16S rRNA is not divergent
enough between the various strains. This leads to an under estimation of the
genetic variety in the population of cyanobacteria and indeed in many cases
cyanobacteria having identical 16S rRNA sequences differ in other genetic
aspects such as but not limited to toxin production. Considering the interest in
toxin production by cyanobacteria, tests have been developed to discriminate
cyanobacteria on the absence, presence or kind of genetic information that
contributes directly to toxin production. However, also this approach has
serious limitations in that although providing an indication on the capability of
toxin production, it does not give sufficient insight into strain characteristics.
Strains characteristics alone or combined with local variation in the conditions
in the freshwater environment can have an effect on the absolute levels of
toxin produced and coupled therewith the risk for the environment. For
instance, the tendency to be a high or relatively low producer of toxin, as well
as the array of toxin variants that can be produced, has been found to vary
from strain to strain. In addition, the tendency to form scums on the water
surface and thus the contribution to toxicity of a bloom may vary from strain to
strain.
The present invention provides an alternative method for the
classification of cyanobacteria. In the present invention the Internal
Transcribed Spacer region (ITS) between 16S rRNA and 23S rRNA is used as a
discriminating tool. It has been found that this region is sufficiently divergent
to allow an adequate separation between the various strains of cyanobacteria,
whereas at the same time it is not so divergent as to confound strain
identification. The regions flanking the ITS in the 16S rRNA gene and the 23S
rRNA gene are sufficiently conserved among cyanobacteria to allow
amplification of this region for most cyanobacteria. As a group, the ITS regions
of cyanobacteria are sufficiently far removed from the group of normal bacteria
to prevent detecting bacterial strains in the classification method.
With the present classification it is possible to pinpoint groups of
genetically sufficiently similar cyanobacteria such that a prediction of their
phenotype is reasonably accurate. Thus for the purpose of the present
invention, the term strain does not refer to a single clone of genetically
identical cyanobacteria, although this can be the case, but rather to a group of
cyanobacteria that is genetically very similar. Thus cyanobacteria that belong
to a strain have the same ITS sequence in the region determined. In case of a
method using a probe, all cyanobacteria samples that hybridise under
stringent conditions are said to be of the same strain. Typically this is the case
where the cyanobacteria have no mismatch with the probe. In case of
denaturing gradient electrophoresis all cyanobacteria samples having the
same migration pattern as the reference cyanobacterial sample are said to
belong to the same strain. This is typically the case where over the region of
the ITS covered, there is no sequence divergence with the reference
cyanobacterial sample. In case the sequence is determined, the sample
cyanobacterium is said to be of the same strain as the reference
cyanobacterium when the ITS sequence over the range sequenced is identical.
The similarity in genotype is sufficiently strong that a strain can be coupled to
phenotypic characteristics thereby allowing a reasonable accurate prediction of
the phenotype of a cyanobacterium identified by means of a method of the
invention.
In one aspect the invention provides a method for classifying a cyanobacterium
clone comprising providing nucleic acid from said clone with at least one
cyanobacteria specific primer, amplifying at least part of the ITS region
therein and separating the resulting amplificate under gradually increasing
denaturing conditions. This process that in a specific implementation is
referred to as DGGE utilizes both the size of the nucleic acid and the sequence
content thereof as a discriminating variable. The conditions that initiate
denaturation of the nucleic acid vary with the sequence. Some sequences will
denature readily whereas other sequences will denature only under
significantly stronger denaturing conditions. The migration speed of a nucleic
acid through a mesh under the influence of an electrical field is very sensitive
to denaturation state of the nucleic acid. Double stranded nucleic acid
migrates relatively quickly through the mesh whereas partly denatured
nucleic acid migrates very poorly. Thus the migration endpoint under a
gradient of ever increasing denaturing conditions is indicative of both the size
and of the sequence of the migrated nucleic acid. In the present invention it
has been found that this system can favourably be used to discriminate
between different cyanobacterium strains. It is particularly suited to
discriminate between closely related strains as there are among the genus
Microcystis. In a preferred embodiment the cyanobacteria specific primer
comprises a sequence as depicted in table 1 of example 3. The primer may
comprise a part of a sequence as depicted in table 1 of example 3, however, the
primer comprises at least 15 and preferably at least 18 of the nucleotides of the
sequences presented in table 1 of example 3. In a preferred embodiment the
primer consist of a sequence as depicted in table 1 of example 3. Preferably, a
primer comprises one or more of the (GC-)CSIF sequences in table 1 of
example 3. The ITS can be subdivided into regions that are of particular
interest in the method for the denaturing electrophoresis analysis. In a
preferred embodiment the nucleic acid for the electrophoresis comprises the
region amplified by primers ((GC-)CSIF and ULR), or by primers ((GC-)CSIF
and 373R, or by primers ((GC-)CSIF and ITS3R. Preferably, the primers (GC-)CSIF
and ULR are used. Using the primers and/or a method of the invention,
cyanobacterial communities and isolates can be studied at high resolution. The
selectivity of the primers makes it possible to focus on cyanobacteria in the
presence of other organisms. The rationale for using different rRNA-ITS
primer sets has become clear from our results. Each set has its advantages and
disadvantages, and the choice which one to use depends on the study that is to
be executed. For studying cyanobacteria, ITSa primers (GC-)CSIF and 373R
have the broadest applicability and produce the most straightforward DGGE
profiles. However, bands from some organisms may end up at identical
positions in the gel, while sequence differences do exist (either because
sequence differences occur in the non-amplified 3'-part of the rRNA-ITS or
because different sequences dictate an identical melting behaviour). In case
one wants to expand on the information obtained from DGGE of ITSa, for
instance to describe an ecosystem in detail or to make sure a culture contains
one cyanobacterial isolate one may combine the results obtained with results
obtained from longer stretches of rRNA-ITS that are amplified by ITSb
primers (GC-)CSIF and ITS3R and ITSc primers (GC-)CSIF and ULR. This
makes detection of additional sequence differences possible and thus provides
supplementary resolution (Fig. 1 of example 1). Also, these amplicons contain
more sequence information, which is especially interesting when field profiles
are analyzed. ITSb primers provide more selectivity towards some
cyanobacterial genera (Table 3 of example 1), and produce complex DGGE
profiles for some genera. Most sequence information, and thus strain typing
potential, can be retrieved from ITSc primer amplicons. Moreover, for most
tested genera they yielded particularly sharp bands on DGGE gels.
In the present invention it has been found that the ITS region is particularly
well suited for the discrimination between different cyanobacterium strains
using a probe from that region. It has been found that for many different
cyanobacteria it is possible to design probes that discriminates the selected
strain from other strains of cyanobacteria. The invention thus provides a
method comprising hybridising a probe from an rRNA-internal transcribed
spacer (ITS) located between sequences from a 16S and a 23S rRNA gene, of a
reference cyanobacterium strain, with a preparation comprising nucleic acid
from said region derived from a test cyanobacterium and determining whether
hybridisation occurs. The method can be used to determine whether the test
cyanobacterium belongs to the strain of the reference cyanobacterium or not.
This information is useful for instance in monitoring a particular
cyanobacterium that is present in a lake. For instance, if in past seasons that
particular strain caused problems in the lake, one can monitor samples from
the lake for the presence of this cyanobacterium.. The method may also be
used to determine the relative contribution of the particular strain in the lake.
In this embodiment the method further comprises comparing the hybridisation
result with a control hybridisation. By using a standard of varying but known
amounts of input nucleic acid in the control hybridisation one can compare the
hybridisation signal intensity of the sample with the signal intensities in the
control hybridisation and determine from that the amount of specific nucleic
acid in the test sample. Once this is known one can correlate this to the
number of cells and thereby to the concentration of the test cyanobacterium in
the sample. If the test cyanobacterium is not the only cyanobacterium in the
sample one can also arrive at the relative contribution of the test
cyanobacterium to the total population of cyanobacteria in the test sample.
Such information can be used for instance to determine the population
dynamics of cyanobacteria in a particular body of water. Thus in a further
embodiment a method of the invention further comprises classifying said test
cyanobacterium on the basis of said hybridisation and/or DGGE analysis. For
quantification purposes one can correlate the results obtained with reference
samples having various known amounts or distributions of the to be quantified
cyanobacterium or cyanobacteria, respectively.
Of current interest is the toxin production capability of at least some strains of
cyanobacteria. Thus in a further embodiment the invention provides
classifying said test cyanobacterium as a toxin producing strain. It is further
possible to further classify toxin of the test cyanobacterium and to relate it to a
particular toxin group, and within the group to a certain subtype. For instance
the mcy gene cluster, encoding the microcystin synthetase genes, exhibits
diversity and many different microcystin toxins can be produced by the various
strains of Microcystis. With a method of the invention it is possible to correlate
the ITS genotype to the toxin genotype. Although there is no direct genetic
linkage between the two genotypes, it has been found that horizontal
transmission between different cyanobacteria of the two loci is not very
frequent. This infrequent horizontal transmission renders the correlation to
presence and kind of toxin genes sufficiently predictive for the ITS typed
strain. Indeed many more genotypic and also phenotypic characteristics are
sufficiently stable to allow correlation with the ITS genotype. Using a method
of the invention it is therefore possible to associate further strain pheno- or
genotype characteristics to the test cyanobacterium on the proviso of course
that such characteristics are determined for the reference cyanobacterium.
Considering the close relationship between the various cyanobacteria
belonging to a strain as defined in the invention, it is very likely that the
classified test cyanobacterium will also exhibit such characteristics. Such
characteristics encompass at least, the level of toxin production and if the
cyanobacterium produces more than one toxin, the relative ratio of the various
toxins produced. Correlations could also be made with growth characteristics
such as the colony size, whether or not the cyanobacterium easily forms
multicellular structures, floating behaviour, nutritional preferences and/or
requirements, and resistance or susceptibility to water quality control
measures etc. Thus in another embodiment a classification of the invention
further comprises classifying said cyanobacterium as a surface layer forming
strain and/or as a high toxin producing strain.
A method of the present invention can be practised using any reference cyanobacterium. However, in a preferred embodiment the reference cyanobacterium comprises a Microcystis cyanobacterium.
A method of the present invention can be practised using any reference cyanobacterium. However, in a preferred embodiment the reference cyanobacterium comprises a Microcystis cyanobacterium.
With the use of a single probe or reference denaturing gradient gel
electrophoresis sample it is possible to determine whether a test
cyanobacterium and the reference cyanobacterium belong to the same strain or
not. By expanding the number of reference cyanobacteria in the sense that
more probes are used and/or that more reference cyanobacterium samples are
compared with, it is possible to increase the chance that a particular test
cyanobacterium can be typed. Thus in a preferred embodiment the invention
provides a method wherein said hybridisation comprises hybridising said
preparation with a panel of nucleic acid probes wherein said panel comprises
said probe and at least one probe derived from the intergenic region between
the transcribed sequences from 16S and 23S rRNA gene of another reference
cyanobacterium strain. The probes do not necessarily have to map to the same
region of the ITS. In fact many probes are situated in different regions. In a
preferred embodiment said panel comprises at least five probes, wherein each
of said five probes is derived from the intergenic region between the
transcribed sequences from 16S and 23S rRNA gene of different reference
cyanobacterium strains. Using five probes is typically sufficient to monitor the
population dynamics of cyanobacteria in a particular body of water. Preferably
the panel comprises more than ten, and preferably more than 15 of said probes
of different cyanobacterium strains. Using these larger number of probes the
chance that a test cyanobacterium can assigned to a strain increases. Of course
strains that do not belong to one of the strains that a probe is used for (a typed
strain), is thereby typed as a new strain and a probe can be designed to
identify this new strain, which new probe can subsequently be added to the
panel. Upon typing of the strain, the ITS region can be used to further
delineate genetic differences and thus further subdivision of the strain. This
can for instance be done by comparing the ITS regions on a sequence level.
The probes are typically selected from ITS sub regions wherein at least one
nucleotide mismatch is present compared with the sequence of the strain one
wants to distinguish from. Typically a probe is selected to have as much
discriminating power as possible. This can be achieved by selecting probes
having at least one mismatch with all typed cyanobacterial ITS sequences
other than those from the strain for which the probe has been designed. Probes
having at least one nucleotide mismatch with the closest related counterpart
can be used in the present invention. A one nucleotide mismatch is typically
sufficient to obtain a clearly distinguishable hybridisation result. A
counterpart probe can be designed for the closest related counterpart. This
counterpart probe, is completely complementary to the region in the
counterpart ITS and has the same number of nucleotides. This counterpart
probe can be incorporated into the panel. This allows an even more precise
analysis of the hybridisation result. The signal obtained with the probe can be
compared with the signal obtained with the counterpart probe. The test
cyanobacterium belongs to the same strain as the strain that the probe is
derived from, if the hybridisation signal obtained with the probe is above
background (i.e. there was specific hybridisation) and simultaneously more
intense than the hybridisation signal obtained with counterpart probe.
Counterpart probes can be designed for all probes in the panel and likewise be
incorporated into the panel. Thus whereas probes can be of different regions in
the ITS, counterpart probes always overlap the same region as the probe in the
closest related counterpart strain. In a preferred embodiment the probe
comprises at least two mismatches with the same region in the closest related
counterpart. Thus different clones that have no mismatch within the region of
the probe, are typed in the present invention as belonging to the same strain,
irrespective of the fact that other geno- or phenotypic differences may be
present. Thus in one embodiment of the invention at least one of said probes in
the panel comprises no mismatches with the sequence of the reference strain
the probe is derived from, and at least two mismatches with the sequence of
said region in at least one other reference cyanobacterium strain. Preferably,
said at least one other reference strain is the strain that is the closest related
counterpart of the reference cyanobacterium strain that the probe is derived
from. In a preferred embodiment of the invention, the panel is a dedicated
panel, for instance, capable of discriminating between all typed Microcystis
strains.
In one embodiment said at least five of said probes comprise no mismatches with the sequence of said region in the reference strains they are derived from, and each of said at least five probes comprises at least two mismatches with the sequence of said region in the other strains of said at least five reference strains. The latter criterion being met when the probe has at least two mismatches with the same region in the closest related strain.
In another embodiment a method of the invention further comprises hybridising a control probe from said rRNA-internal transcribed spacer region (ITS) located between sequences from a 16S rRNA gene and a 23S rRNA gene, with a preparation comprising nucleic acid from said region derived from a test cyanobacterium and determining whether hybridisation occurs, wherein said control probe comprises sequence divergence with some strains of cyanobacteria, but not with other strains of cyanobacteria. In a preferred embodiment said control probe is selective for a cluster of cyanobacteria strains. This probe provides confirmation of the information obtained for the strain specific probe in that there is also hybridisation with the control probe.
It provides further information on the correct strain assignment. Thus preferably said control probe is selective for a cluster of cyanobacteria that comprises the strain that said probe is selective for, preferably said control probe comprises a sequence as depicted in table 3B of example 3. The control probe can also be used separately or in combination with strain specific probes that are not specific for strains of the cluster. In one embodiment a positive signal in the control probe provides information on the cluster the test cyanobacterium belongs to and can therefore be used to correlate cluster specific geno- or phenotype characteristics to the test cyanobacterium.
In one embodiment said at least five of said probes comprise no mismatches with the sequence of said region in the reference strains they are derived from, and each of said at least five probes comprises at least two mismatches with the sequence of said region in the other strains of said at least five reference strains. The latter criterion being met when the probe has at least two mismatches with the same region in the closest related strain.
In another embodiment a method of the invention further comprises hybridising a control probe from said rRNA-internal transcribed spacer region (ITS) located between sequences from a 16S rRNA gene and a 23S rRNA gene, with a preparation comprising nucleic acid from said region derived from a test cyanobacterium and determining whether hybridisation occurs, wherein said control probe comprises sequence divergence with some strains of cyanobacteria, but not with other strains of cyanobacteria. In a preferred embodiment said control probe is selective for a cluster of cyanobacteria strains. This probe provides confirmation of the information obtained for the strain specific probe in that there is also hybridisation with the control probe.
It provides further information on the correct strain assignment. Thus preferably said control probe is selective for a cluster of cyanobacteria that comprises the strain that said probe is selective for, preferably said control probe comprises a sequence as depicted in table 3B of example 3. The control probe can also be used separately or in combination with strain specific probes that are not specific for strains of the cluster. In one embodiment a positive signal in the control probe provides information on the cluster the test cyanobacterium belongs to and can therefore be used to correlate cluster specific geno- or phenotype characteristics to the test cyanobacterium.
The probe is preferably an oligonucleotide or a functional equivalent thereof. A
functional equivalent of an oligonucleotide comprises the same binding affinity
in kind not necessarily in amount as the oligonucleotide itself. Suitable
nucleotide mimetics are present in the art such as but not limited to peptide
nucleic acid (PNA). Other mimetics include (L)-a-threofuranosyl
oligonucleotides (TNA), RNA. In a preferred embodiment at least one of said
probes comprises between 12 and 30 nucleotides. In a preferred embodiment at
least one of said probes comprises between 16 and 28 nucleotides. The probe
may share nucleotide sequence with or be complementary to several distinct
regions in the ITS, however, in a preferred embodiment at least between 12
and 30 nucleotides are arranged consecutively in said ITS region. Probes may
of course further comprise other sequences, such as for instance for the
purpose of incorporating a label that becomes detectable upon hybridisation of
the probe to the target nucleic acid. Examples of such probes are the so-called
molecular beacon probes. The probes may also comprise nucleotides from one
or more other regions of the cyanobacterium genome. Probes may also
comprise nucleotide analogues having similar hybridisation characteristics in
kind as the nucleotide they are analogous to, though they do not have to have
the same characteristics in amount. Probes may further comprise other
nucleotide analogous such as for instance inosine, that do not have a strong
preferred counterpart base with which they associated in the opposing strand.
Both types of analogues may be used to accommodate binding strength of
particular probes thereby allowing fine adjustment of the panel. This fine
tuning can be used to arrive at standardized hybridisation conditions. Probes
may also further comprise other matter such as but not limited to protein,
lipids or other substances to provide further functionality. In a panel the
probes are typically selected to have about the same Tm. This being the case
where the Tm of the various probes differs no more than one degree from each
other, however, this need not always be true. One may further fine tune the
probes to have an even closer set of Tm values. A probe can further be
scrutinized for other features such as internal repeats, low self hybridisation
characteristics, low internal hybridisation characteristics an low amounts of
direct repeats. These properties can all be fine tuned and increase the
propensity with which a suitable panel is designed. Probes may also further
comprise organic or inorganic compounds, such as can be used to bind the
probes to a solid surface or binding matrix and to provide distance from this
solid surface or binding matrix.
A probe of the invention preferably comprises a nucleic acid sequence as
depicted in table 3 of example 3 or a functional equivalent thereof. A functional
equivalent in this case also comprises the reverse complement of the presented
sequence. A panel of probes preferably comprises at least one of probes
comprising a nucleic acid sequence as depicted in table 3 of example 3 or a
functional equivalent of such an oligonucleotide, preferably at least two, and
more preferably at least five probes of said panel comprise a nucleic acid
sequence as depicted in table 3 of example 3 or a functional equivalent of such
an oligonucleotide.
A method of the invention can be performed using any preparation containing
nucleic acid of the ITS region. In a preferred embodiment the preparation
comprises nucleic acid that has undergone an amplification step specific for the
ITS region. By amplifying the nucleic acid from this region, two things are
accomplished simultaneously. On the one hand the amount of nucleic acid to
be detected is amplified thereby increasing the sensitivity of the method and
allowing detection of cyanobacteria that are not easy to grow or obtain in other
ways. On the other hand, the potential for background hybridisation of
sequences that are not derived from the ITS region is reduced, thereby further
increasing the signal to noise ratio for the assay. So in a preferred embodiment
said preparation of nucleic acid of said test cyanobacterium is at least in part
prepared through amplification of a sample comprising nucleic acid of said test
cyanobacterium. Preferably said amplification is performed using a
cyanobacterium specific primer within the 16S, 23S or 16S-23S rRNA internal
transcribed spacer gene sequence. In this way, the potential for background
hybridisation with nucleic acid from bacterial origin other than cyanobacterial
origin is substantially reduced. Moreover, specific primers enhance the
sensitivity for detection of cyanobacterial ITS sequences, since there is no
competition for amplification of non-cyanobacterial sequences during the PCR
reaction. Various cyanobacterial specific ITS amplification primers can be
designed. Many amplification methods rely on two opposing primers. It is
sufficient that at least one of said primers is specific for cyanobacteria.
However, preferably, both primers in strategies relying in two opposing
primers are cyanobacteria specific. It is possible to perform so-called nested
amplifications to further increase the sensitivity of a method of the invention.
Such nested primers can be both cyanobacterial specific primers and primers
that recognize a broader range of bacterial ITS regions. Preferably, also at
least one nested primer(s) is(are) cyanobacterial specific. In a preferred
embodiment a cyanobacterial specific primer comprises a sequence as depicted
in table 1 of example 3.
The invention further provides at least one of the sequence as
identified by the EMBL accession numbers AJ605140 till AJ605221 (see table
2 of example 3). The EMBL sequences refer to ITS regions of particular strains
of cyanobacteria that are used to select the probes from. The ITS regions can
further be used to characterise the strain from which it was identified. Thus
the present invention further provides a method for typing a strain of
cyanobacteria comprising determining whether the test cyanobacterium
comprises a sequence of one of the isolates identified by accession numbers
AJ605140 till AJ605221 as referred to in table 2 of example 3. This method is
preferably performed by sequencing amplified product from an ITS region of
the test cyanobacterium, however, other sequencing methods are known in art
and can also be used.
In yet another embodiment the invention provides a nucleic acid or a
functional equivalent thereof as depicted in table 3 of example 3. Further
provided is a panel of nucleic acids, or functional equivalents thereof wherein
said panel comprises at least one of said nucleic acids comprise a sequence as
depicted in table 3 of example 3. Preferably, said panel comprises at least two
and more preferably at least five of said nucleic acids wherein said at least five
nucleic acids comprise a sequence as depicted in table 3 of example 3 or a
functional equivalent thereof.
The panel preferably comprises an array that is associated with a solid
surface. Preferably, a flat solid surface. In a particularly preferred embodiment
the panel is present on a chip, which has preferably the dimensions of a
microscopic slide. Further provided is an apparatus for analysing hybridisation
signals comprising a nucleic acid having a sequence depicted in table 3 of
example 3, a panel of nucleic acids according to invention, an array and/or a
chip according to the invention. For detection of chemiluminescence signals the
apparatus can for instance be an X-ray film, a CCD camera (especially the
cooled variant), a reader for microtiterplates capable of detecting
chemiluminescence signals. For detection of fluorescence signals, array readers
such as the SensiChip DNA Array Reader from Quiagen, the Affymetrix Chip
Reader, The Genapta microarray reader and microtiterplate readers such as
that from Perkin Elmer, Wallac and Pharmacia. For detection of light
absorption microtiterplate readers.
In yet another embodiment the invention provides the use of a
nucleic acid or functional equivalent thereof of table 3 of example 3 or of a
sequence identified by EMBL accession numbers AJ605140 till AJ605221, an
array, chip or apparatus according to the invention, for classifying a
cyanobacterium. In a preferred embodiment said classification comprises
classifying said cyanobacterium as a toxic or non-toxic cyanobacterium strain.
As mentioned above, the invention further provides a method for
typing a cyanobacterium in a sample comprising subjecting ITS sequences
from said clone to a denaturing gradient gel electrophoresis step and typing
the strain from said step. A method of the invention is preferably performed
using a clone of the test cyanobacterium as a source to prepare the preparation
or as a source of ITS sequences. This source is particularly preferred in the
instances wherein the nucleic acid sequence is determined or wherein a
denaturing gradient gel is used. A method comprising a denaturing gradient
gel electrophoresis step preferably further comprises comparing the result of
said step with a reference. The reference is preferably a similar treated sample
of a reference cyanobacterium. Preferably, the reference comprises similar
treated samples from at least 5 reference and more preferably at least 15
reference cyanobacteria. Preferably, the material used to generate the
references comprises a sequence as depicted in table 2 of example 3.
Preferably, ITS sequences are provided through amplification of the ITS region
of said cyanobacterium clone. The ITS sequences are preferably amplified by
using a cyanobacterium specific primer within the 16S, 23S or 16S-23S rRNA
internal transcribed spacer gene sequence, preferably by using a
cyanobacterium specific primer comprising a sequence as depicted in table 1 of
example 3. The reference(s) are preferably similarly treated.
For many ecological studies of cyanobacteria, it is essential that closely related
species or strains can be discriminated. Since this is often not possible using
morphological features, cyanobacteria are frequently studied using DNA based
methods. We realized high-resolution discrimination of a variety of
cyanobacteria by means of DGGE analysis of the internal transcribed spacer,
or parts thereof between the 16S and 23S rRNA genes (rRNA-ITS). A forward
primer specific for cyanobacteria was designed, targeted at the 3'-end of the
16S rRNA gene. Combination of this primer with three different reverse
primers targeted at the rRNA-ITS or the 23S rRNA gene yielded PCR products
of different sizes from cultures of all 16 cyanobacterial genera that were tested,
but not from bacteria that were not cyanobacteria. DGGE profiles produced
from the shortest section of rRNA-ITS consisted of 1 band for all but one
cyanobacterial genera, those generated from longer stretches of rRNA-ITS
yielded DGGE profiles containing 1 to 4 bands. The method is suited to detect
intrageneric and intraspecific variation of cyanobacteria, the method was
exemplified using strains of the genus Microcystis. Many strains could be
discriminated by means of rRNA-ITS DGGE, and the resolution of this method
was strikingly higher than that obtained with previously described methods.
The applicability of the developed DGGE assays for analysis of cyanobacteria
in field samples was demonstrated using samples from freshwater lakes.
Advantages and disadvantages associated with the use of each developed
primerset are discussed.
Cyanobacteria are a major component of many aquatic and terrestrial
ecosystems and can be found in virtually all habitat types, including marine
and freshwater environments, deserts, hot springs, hypersaline environments,
rocks and ice. In addition, they can be involved in symbiotic associations with a
remarkable range of eukaryotic host organisms. In all these environments,
cyanobacteria are major contributors to photosynthesis and nitrogen fixation
(38). Cyanobacterial populations may reach high densities during blooms in
surface waters. Detrimental effects of such blooms are of growing concern for
water managers worldwide (9).
For ecological studies of cyanobacteria it is essential to be able to differentiate between closely related organisms. Some important features such as nitrogen fixation or toxicity are not uniformly dispersed across taxa or morphological groups, and may vary between species or even between strains of the same species (9, 41). For example, toxic cyanobacterial blooms often require characterization below the genus level. Both toxin producing and non-producing strains are included in most morphologically distinguishable species of the genera Microcystis (18, 30) and Anabaena (5). Shifts in the ratio of toxic and non-toxic genotypes of Microcystis may (partly) explain the often poor correlations of cell counts with toxin content in many field studies (6).
To study the functions and interactions of cyanobacteria, it is necessary to reveal the composition and dynamics of their populations. Also, it is important to relate isolated strains to their counterparts in nature, for extrapolation of findings from physiological experiments carried out on cultures to natural conditions. Linking laboratory cultures and field populations is often problematic due to the selectivity inherent to cultivation, and to morphological changes occurring after cultivation (27, 31). Denaturant gradient gel electrophoresis (DGGE), a technique for sequence-dependent separation of PCR products (25), can be used to assess the genotypic diversity in environmental samples and to judge the purity and uniqueness of isolated strains. Isolated cultures can be assigned to field populations based on the comparison of their DGGE profiles, and sequence information from profile bands can be used to characterize the organisms that are present. A section of DNA is suitable for DGGE analysis if it can be specifically amplified from the target organisms, has sufficient sequence heterogeneity for the desired resolution and, preferably, is part of a gene of which a considerable number of sequences have been deposited in sequence databases. DGGE of hetR, a gene assigned to heterocyst differentiation, has been used to study the diversity in isolated strains of the cyanobacterial genera Trichodesmium and Nostoc (28, 32). Also nifH, a gene encoding dinitrogenase reductase in many microorganisms including cyanobacteria (42), has been used for DGGE analysis of the very diverse functional group of diazotrophic (N2 -fixing) organisms (22). An important drawback for the application of both protein-encoding genes, especially for the analysis of communities of cyanobacteria, is that they are present only in a limited number of cyanobacterial genera. Nübel et al. (27) developed primers for specific amplification of a 16S rRNA gene segment from cyanobacteria and plastids, allowing DGGE analysis of cyanobacterial populations (1, 11, 27). However, the taxonomic resolution offered by 16S rRNA genes is insufficient for discrimination of closely related organisms. As a result, research has increasingly focused on the rRNA 16S-23S internal transcribed spacer (rRNA-ITS). The greater degree of sequence heterogeneity, as well as a considerable number of published rRNA-ITS sequences, make rRNA-ITS very suitable for high-resolution analysis of cyanobacteria. Restriction enzyme digestion (RFLP) of rRNA-ITS has been used to resolve closely related cyanobacterial strains (21, 23, 26, 32), and direct sequencing has been used to study subgeneric phylogenetic relationships in genera such as Microcystis (30), Trichodesmium (28) and picocyanobacteria (34). Recently, rRNA-ITS sequences have been used for analysis of Synechococcus (4) and Aphanizomenon (20).
In the present work, we combine the relatively high sequence variation in rRNA-ITS with the potential of DGGE to separate even small sequence differences, to introduce methods for high-resolution analysis of cultures and populations of cyanobacteria. We developed and tested primers and protocols for selective amplification and DGGE analysis of cyanobacterial genotypes in the presence of DNA from contaminating microorganisms. Their value for analysis of cyanobacterial strains of various genera and of field samples was examined, and the resolution that could be achieved by different rRNA DGGE methods was compared using closely related Microcystis strains.
For ecological studies of cyanobacteria it is essential to be able to differentiate between closely related organisms. Some important features such as nitrogen fixation or toxicity are not uniformly dispersed across taxa or morphological groups, and may vary between species or even between strains of the same species (9, 41). For example, toxic cyanobacterial blooms often require characterization below the genus level. Both toxin producing and non-producing strains are included in most morphologically distinguishable species of the genera Microcystis (18, 30) and Anabaena (5). Shifts in the ratio of toxic and non-toxic genotypes of Microcystis may (partly) explain the often poor correlations of cell counts with toxin content in many field studies (6).
To study the functions and interactions of cyanobacteria, it is necessary to reveal the composition and dynamics of their populations. Also, it is important to relate isolated strains to their counterparts in nature, for extrapolation of findings from physiological experiments carried out on cultures to natural conditions. Linking laboratory cultures and field populations is often problematic due to the selectivity inherent to cultivation, and to morphological changes occurring after cultivation (27, 31). Denaturant gradient gel electrophoresis (DGGE), a technique for sequence-dependent separation of PCR products (25), can be used to assess the genotypic diversity in environmental samples and to judge the purity and uniqueness of isolated strains. Isolated cultures can be assigned to field populations based on the comparison of their DGGE profiles, and sequence information from profile bands can be used to characterize the organisms that are present. A section of DNA is suitable for DGGE analysis if it can be specifically amplified from the target organisms, has sufficient sequence heterogeneity for the desired resolution and, preferably, is part of a gene of which a considerable number of sequences have been deposited in sequence databases. DGGE of hetR, a gene assigned to heterocyst differentiation, has been used to study the diversity in isolated strains of the cyanobacterial genera Trichodesmium and Nostoc (28, 32). Also nifH, a gene encoding dinitrogenase reductase in many microorganisms including cyanobacteria (42), has been used for DGGE analysis of the very diverse functional group of diazotrophic (N2 -fixing) organisms (22). An important drawback for the application of both protein-encoding genes, especially for the analysis of communities of cyanobacteria, is that they are present only in a limited number of cyanobacterial genera. Nübel et al. (27) developed primers for specific amplification of a 16S rRNA gene segment from cyanobacteria and plastids, allowing DGGE analysis of cyanobacterial populations (1, 11, 27). However, the taxonomic resolution offered by 16S rRNA genes is insufficient for discrimination of closely related organisms. As a result, research has increasingly focused on the rRNA 16S-23S internal transcribed spacer (rRNA-ITS). The greater degree of sequence heterogeneity, as well as a considerable number of published rRNA-ITS sequences, make rRNA-ITS very suitable for high-resolution analysis of cyanobacteria. Restriction enzyme digestion (RFLP) of rRNA-ITS has been used to resolve closely related cyanobacterial strains (21, 23, 26, 32), and direct sequencing has been used to study subgeneric phylogenetic relationships in genera such as Microcystis (30), Trichodesmium (28) and picocyanobacteria (34). Recently, rRNA-ITS sequences have been used for analysis of Synechococcus (4) and Aphanizomenon (20).
In the present work, we combine the relatively high sequence variation in rRNA-ITS with the potential of DGGE to separate even small sequence differences, to introduce methods for high-resolution analysis of cultures and populations of cyanobacteria. We developed and tested primers and protocols for selective amplification and DGGE analysis of cyanobacterial genotypes in the presence of DNA from contaminating microorganisms. Their value for analysis of cyanobacterial strains of various genera and of field samples was examined, and the resolution that could be achieved by different rRNA DGGE methods was compared using closely related Microcystis strains.
Sampling and DNA Isolation. Lakes Kinselmeer and Sneekermeer are shallow
lakes (maximum depth approximately 3 m), and Volkerak and Zeegerplas are
deeper lakes (maximum depth 15m and 25 m respectively). All lakes have
extensive blooms of various cyanobacteria, mostly in spring and summer.
Water samples from the lakes were collected 0.5 m below the surface in sterile
bottles from a boat in the middle of the lake and stored in the dark at 4°C.
Within four hours after sampling, a volume of 250 ml water (or less if the filter
clogged) was filtered over a 25 mm diameter, 0.2 mm pore size mixed esters
filter (ME 24, Schleicher & Schuell, Dassel, Germany). The filter was cut in
two with a sterile scalpel and each half was stored in a microcentrifuge tube at
-80°C until further processing. DNA from filters containing field samples was
isolated as described by Zwart et al. (43). DNA from the pellet of 2 ml
cyanobacterial cultures in which growth was visible by eye was isolated by
means of the DNA isolation procedure described by Tillett et al. (37).
Strain isolation and culture conditions. Strains of cyanobacteria used in this study are given in Table 1. Cultures isolated in this study (Microcystis sp. and Gloeotrichia sp.) were obtained by picking single colonies from water samples using a dissecting microscope and sterile glass Pasteur pipettes with a narrow opening, followed by repeated washing in a small volume of O2 medium (8). Alternatively, single Microcystis colonies were grown on plates containing O2 medium solidified with agarose (0.3% w/v). Colonies grown on plates were rendered unialgal through repeated plating. None of the cyanobacterial cultures that were used in this study were axenic. All cyanobacteria able to grow in freshwater medium were maintained in our laboratory in 02 medium (5 ml in 30 ml tubes or 30 ml in 100 ml Erlenmeyer flasks) at 20°C, at an irradience of approximately 15 mmol×m-2×s-1 at a light:dark cycle of 16:8 h. A Microcoleus isolate was maintained as decribed by Jonkers et al. (16). The bacteria used as negative controls to test the specificity of the primers were Serratia marcescens (DSM 1636), Acinetobacter calcoaceticus strain BD4 (DSM 586), Erwinia carotovora carotovora (DSM 30168), Escherichia coli (DSM 423), Rhodococcus erythropolis (DSM 43188), Lactobacillus reuteri (DSM 20016), Lactococcus lactis lactis (NIZO-81), Bacillus polymixa (DSM 36), Bacillus subtilis (DSM 10), and Pseudomonas stutzeri (DSM 5190). Cultures were obtained from the German Collection of Microorganisms and Cell Cultures (cultures encoded DSM), and from the Dutch Institute for Dairy Research (encoded NIZO).
Sequence alignment and investigation. Sequences of the 16S rRNA of bacteria and cyanobacteria were obtained from the ribosomal database project (RDPII) (24) and Genbank/EMBL/DDBJ databases. The program Dedicated Comparative Sequence Editor (DCSE) (10) and the program package ARB (www.ARB-home.de) were used for sequence alignments on the basis of comparison of secondary structural elements in the ribosomal RNA. These alignments containing most available cyanobacterial sequences, and an alignment of 218 representative bacterial sequences in RDPII, were used to search for potential primersites in the 16S rRNA gene. The number of mismatches of the designed primer with deposited sequences, was investigated using the probe match option in ARB and the '6spring2001' database supplemented with 19 sequences (W. Ludwig and A. Ernst, personal communication) containing 8229 16S rRNA gene sequences of more than 1400 bp (of which 145 are from cyanobacteria and 77 from chloroplasts). Based on this database, databases were constructed containing either all cyanobacteria , all plastids, or all sequences except cyanobacteria and plastids. The number of sequences with a given number of mismatches was determined using probe match, followed by a correction for degenerate base positions in the primer sequence. Sequences from the rRNA-ITS region were obtained from Genbank/EMBI.JDDBJ and were aligned using the programs ClustalW and the BioEdit Sequence Alignment Editor (12).
PCR amplification. Primer sequences and references are given in Table 2. The forward primer for amplification of part of the 16S rRNA gene was slightly modified from Nubel et al (27) to further improve their theoretical specificity. This because the efficiency of amplification, and thereby the selectivity of the primer, is typically determined by the nature of the 3' end nucleotides. (19, 35). PCR amplification was performed in a MBS 0.5 S thermocycler (ThermoHybaid, Ashford, UK) in a 25 ml reaction mixture containing approximately 50 ng of DNA, [10 mM Tris/HCl pH 8.3, 50 mM KCl, 0.01% w/v gelatin, 200 mM of each deoxynucleotide, 1.5 mM MgCl2, 2.5 units of Taq DNA polymerase (Boehringer Mannheim, Mannheim, Germany) and 0.5 mM of each primer]. The temperature cycling conditions for the amplification of part of the 16S rRNA were modified slightly from (27). After a pre-incubation at 94°C for 5 min, a total of 30 cycles were performed of 94°C for 1 min, 60°C for 1 min and 72°C for 1 min. The temperature cycling was concluded with a final step of 5 min at 72°C. The optimized temperature cycling conditions for the amplification of rRNA-ITS (ITSa, ITSb, and ITSc, for explanation see results section and Table 2) were as follows. After a pre-incubation at 94°C for 5 min, a total of 30 cycles were performed of 94°C for 1 min, Ta for 1 min and 72°C for 1 min. In the first twenty cycles, Ta decreased by 1°C after every second cycle from 62°C in the first cycle to 52°C in the twentieth. This 'touch down' procedure was followed to reduce non-specific annealing of the primers. In the last ten cycles, Ta was 52°C. The temperature cycling was concluded with a final step of 30 min at 72°C.
DGGE profiling. Theoretical melting profiles were constructed using the program MELT94 which can be found on the Internet at http://web.mit.edulosp/www/melt.html. DGGE was performed essentially as described by Muyzer et al. (25). Briefly, PCR products were separated on a 1.5 mm thick, vertical gel containing 8% (w/v) polyacrylamide (37.5:1 acrylamide: bisacrylamide) and a linear gradient of the denaturants urea and formamide, increasing from 25 or 30% at the top of the gel to 40% at the bottom. The concentrations depended on the gene products that were analyzed and are given in the figure legends. Here, 100% denaturant is defined as 7 M urea and 40% v/v formamide. Electrophoresis was performed in a buffer containing 40 mM Tris, 40 mM acetic acid, 1 mM EDTA, pH 7.6 (0.5 x TAE) for 16 hours at 75 V. The gel was stained for 1 h in water containing 0.5 µg ml-1 ethidium bromide. An image of the gel was recorded with a CCD camera system (Imago, B&L Systems, The Netherlands).
Sequencing of DNA from DGGE bands. A small piece of gel from the middle of the target band was excised from the DGGE gel and incubated in 50 ml sterile milli-Q for 24 hours at 4°C. The eluent was reamplified using the original primerset and run on DGGE to confirm its identity. For sequence analysis, the eluent was reamplified with reverse primers that had M13 priming sites added 5' of the original primers. PCR products were purified using the Concert Rapid PCR Purification System (GibcoBRL Life Technologies, UK), and these products were used as templates for sequencing reactions with the Thermo Sequenase Primer cycle sequencing kit (Amersham Pharmacia Biotech, USA). Sequencing reaction products were analyzed on an ALF Express II sequencer (Amersham Pharmacia Biotech, USA) with CY5 fluorescence labeled M13 sequence primers or a labeled GC-clamp. The sequences were deposited at EMBL and were assigned accession numbers AJ579895-AJ579906. Sequences were processed using the program sequencher version 4.0.5 (Gene Codes Corp., MI, USA) and similarity with sequences deposited in Genbank/EMBL/DDBJ was checked using the program Blast (2)(via
http://www.ncbi.nlm.nih.gov/BLAST/).
Strain isolation and culture conditions. Strains of cyanobacteria used in this study are given in Table 1. Cultures isolated in this study (Microcystis sp. and Gloeotrichia sp.) were obtained by picking single colonies from water samples using a dissecting microscope and sterile glass Pasteur pipettes with a narrow opening, followed by repeated washing in a small volume of O2 medium (8). Alternatively, single Microcystis colonies were grown on plates containing O2 medium solidified with agarose (0.3% w/v). Colonies grown on plates were rendered unialgal through repeated plating. None of the cyanobacterial cultures that were used in this study were axenic. All cyanobacteria able to grow in freshwater medium were maintained in our laboratory in 02 medium (5 ml in 30 ml tubes or 30 ml in 100 ml Erlenmeyer flasks) at 20°C, at an irradience of approximately 15 mmol×m-2×s-1 at a light:dark cycle of 16:8 h. A Microcoleus isolate was maintained as decribed by Jonkers et al. (16). The bacteria used as negative controls to test the specificity of the primers were Serratia marcescens (DSM 1636), Acinetobacter calcoaceticus strain BD4 (DSM 586), Erwinia carotovora carotovora (DSM 30168), Escherichia coli (DSM 423), Rhodococcus erythropolis (DSM 43188), Lactobacillus reuteri (DSM 20016), Lactococcus lactis lactis (NIZO-81), Bacillus polymixa (DSM 36), Bacillus subtilis (DSM 10), and Pseudomonas stutzeri (DSM 5190). Cultures were obtained from the German Collection of Microorganisms and Cell Cultures (cultures encoded DSM), and from the Dutch Institute for Dairy Research (encoded NIZO).
Sequence alignment and investigation. Sequences of the 16S rRNA of bacteria and cyanobacteria were obtained from the ribosomal database project (RDPII) (24) and Genbank/EMBL/DDBJ databases. The program Dedicated Comparative Sequence Editor (DCSE) (10) and the program package ARB (www.ARB-home.de) were used for sequence alignments on the basis of comparison of secondary structural elements in the ribosomal RNA. These alignments containing most available cyanobacterial sequences, and an alignment of 218 representative bacterial sequences in RDPII, were used to search for potential primersites in the 16S rRNA gene. The number of mismatches of the designed primer with deposited sequences, was investigated using the probe match option in ARB and the '6spring2001' database supplemented with 19 sequences (W. Ludwig and A. Ernst, personal communication) containing 8229 16S rRNA gene sequences of more than 1400 bp (of which 145 are from cyanobacteria and 77 from chloroplasts). Based on this database, databases were constructed containing either all cyanobacteria , all plastids, or all sequences except cyanobacteria and plastids. The number of sequences with a given number of mismatches was determined using probe match, followed by a correction for degenerate base positions in the primer sequence. Sequences from the rRNA-ITS region were obtained from Genbank/EMBI.JDDBJ and were aligned using the programs ClustalW and the BioEdit Sequence Alignment Editor (12).
PCR amplification. Primer sequences and references are given in Table 2. The forward primer for amplification of part of the 16S rRNA gene was slightly modified from Nubel et al (27) to further improve their theoretical specificity. This because the efficiency of amplification, and thereby the selectivity of the primer, is typically determined by the nature of the 3' end nucleotides. (19, 35). PCR amplification was performed in a MBS 0.5 S thermocycler (ThermoHybaid, Ashford, UK) in a 25 ml reaction mixture containing approximately 50 ng of DNA, [10 mM Tris/HCl pH 8.3, 50 mM KCl, 0.01% w/v gelatin, 200 mM of each deoxynucleotide, 1.5 mM MgCl2, 2.5 units of Taq DNA polymerase (Boehringer Mannheim, Mannheim, Germany) and 0.5 mM of each primer]. The temperature cycling conditions for the amplification of part of the 16S rRNA were modified slightly from (27). After a pre-incubation at 94°C for 5 min, a total of 30 cycles were performed of 94°C for 1 min, 60°C for 1 min and 72°C for 1 min. The temperature cycling was concluded with a final step of 5 min at 72°C. The optimized temperature cycling conditions for the amplification of rRNA-ITS (ITSa, ITSb, and ITSc, for explanation see results section and Table 2) were as follows. After a pre-incubation at 94°C for 5 min, a total of 30 cycles were performed of 94°C for 1 min, Ta for 1 min and 72°C for 1 min. In the first twenty cycles, Ta decreased by 1°C after every second cycle from 62°C in the first cycle to 52°C in the twentieth. This 'touch down' procedure was followed to reduce non-specific annealing of the primers. In the last ten cycles, Ta was 52°C. The temperature cycling was concluded with a final step of 30 min at 72°C.
DGGE profiling. Theoretical melting profiles were constructed using the program MELT94 which can be found on the Internet at http://web.mit.edulosp/www/melt.html. DGGE was performed essentially as described by Muyzer et al. (25). Briefly, PCR products were separated on a 1.5 mm thick, vertical gel containing 8% (w/v) polyacrylamide (37.5:1 acrylamide: bisacrylamide) and a linear gradient of the denaturants urea and formamide, increasing from 25 or 30% at the top of the gel to 40% at the bottom. The concentrations depended on the gene products that were analyzed and are given in the figure legends. Here, 100% denaturant is defined as 7 M urea and 40% v/v formamide. Electrophoresis was performed in a buffer containing 40 mM Tris, 40 mM acetic acid, 1 mM EDTA, pH 7.6 (0.5 x TAE) for 16 hours at 75 V. The gel was stained for 1 h in water containing 0.5 µg ml-1 ethidium bromide. An image of the gel was recorded with a CCD camera system (Imago, B&L Systems, The Netherlands).
Sequencing of DNA from DGGE bands. A small piece of gel from the middle of the target band was excised from the DGGE gel and incubated in 50 ml sterile milli-Q for 24 hours at 4°C. The eluent was reamplified using the original primerset and run on DGGE to confirm its identity. For sequence analysis, the eluent was reamplified with reverse primers that had M13 priming sites added 5' of the original primers. PCR products were purified using the Concert Rapid PCR Purification System (GibcoBRL Life Technologies, UK), and these products were used as templates for sequencing reactions with the Thermo Sequenase Primer cycle sequencing kit (Amersham Pharmacia Biotech, USA). Sequencing reaction products were analyzed on an ALF Express II sequencer (Amersham Pharmacia Biotech, USA) with CY5 fluorescence labeled M13 sequence primers or a labeled GC-clamp. The sequences were deposited at EMBL and were assigned accession numbers AJ579895-AJ579906. Sequences were processed using the program sequencher version 4.0.5 (Gene Codes Corp., MI, USA) and similarity with sequences deposited in Genbank/EMBL/DDBJ was checked using the program Blast (2)(via
http://www.ncbi.nlm.nih.gov/BLAST/).
Template mixtures experiment. ITSa was amplified from the selected cultures,
and for each strain the amount of PCR product was estimated from an agarose
gel. The PCR products were mixed and diluted in order to obtain template
DNA from selected cultures, or from mixtures thereof, all in identical final
concentrations. This template DNA was used for ITSa amplification and the
PCR products were analyzed on a DGGE gel.
Design of primers for rRNA-ITS amplification. Our aim was to develop a PCR
for specific amplification of cyanobacterial rRNA-ITS in the presence of non-cyanobacterial
DNA, yielding PCR products that can be separated by means of
DGGE. To ensure specific amplification of the rRNA-ITS gene section, the
target area for at least one of the primers had to be exclusive for
cyanobacteria. For the design of a specific primer we focused on the 16S rRNA
gene, since ample sequence information is available from this gene, and it
includes areas with various degrees of sequence conservation. We used
alignments of all available 16S sequences from cyanobacteria, and of
sequences from representative other prokaryotes in the ribosomal database
project (RDPII) (24) and Genbank/EMBL/DDBJ databases. The alignments
were searched upstream starting from the 3'-end of the 16S rRNA gene, which
resulted in the identification of a 20 nucleotide sequence (CSIF, see Table 2)
corresponding to position 1423-1442 in the Synechococcus sp. PCC6301
sequence. This sequence was highly conserved in all phylogenetic groups of
cyanobacteria from which sequences were available. Out of 145 cyanobacterial
sequences, 84 had 0 mismatches, 46 had 1 mismatch, 2 had 2 mismatches, and
13 had 3 mismatches with the primer sequence as revealed by a probe search
in ARB. Sequences with three mismatches were found in the genera Nostoc,
Spirulina, Gloeobacter and Calothrix. From the first two genera there were
also sequences deposited with fewer mismatches. Importantly, the three bases
at the 3'-end (TAC), which are the most selective bases when the sequence is
used as forward primer (19, 35) appeared to be conserved almost exclusively
amongst cyanobacteria. Only the few deposited sequences of the genera
Gloeobacter and Calothrix, and a sequence related to Limnothrix redekei
misnamed as Oscillatoria limnetica, did not contain a C at the 3'-end. As
expected from their close relationship with cyanobacteria, plastid sequences
had relatively few mismatches with the primer sequence. A probe search in
ARB revealed that from 77 plastid sequences, 1 had a perfect match, 45 had
one or two mismatches and 31 had three or more mismatches. To confirm the
specificity for cyanobacteria of the primer sequence, a combined probe search
was performed in the RDPII database (using the check_probe program) and in
an ARB database containing more than 8000 full length 16S rRNA prokaryotic
sequences (using the probe match option in ARB). No sequences of prokaryotes
other than cyanobacteria were found with less than three mismatches, 2
sequences (from Ammonifex degensii and Thermodesulfobacterium hverag)
had 3 mismatches, 116 sequences had 4 mismatches, and the remainder had 5
or more mismatches. A BLAST search (2) of the primer sequence yielded only
cyanobacteria in the hits with highest similarity scores.
Reverse primer sites for the amplification of cyanobacterial rRNA-ITS sequences were gathered from previous research (Table 2). Three reverse primers were used, two of these (373R and ITS3R) targeted at highly conserved sequence motifs in the ITS, and one (ULR) at the 5'-end of the 23S gene. The combination of the forward primer (CSIF) and the reverse primers yields three primersets, hereafter denoted as ITSa (primers CSIF + 373R), ITSb (CSIF + ITS3R), and ITSc (CSIF + ULR) (Table 2). The rationale for the use of more than one primer combination for amplification of the rRNA-ITS was the tradeoff that exists between the broad applicability of the shorter fragments and the different melting behavior and higher amount of sequence information associated with longer fragments (see below). Alignment of cyanobacterial rRNA-ITS sequences deposited in the Genbank/EMBL/DDBJ databases showed that virtually all cyanobacteria had at least one operon containing a perfect match with the reverse primer 373R, which is targeted at the highly conserved tRNAile gene. Only some Prochlorococcus strains contained one mismatch. Most deposited cyanobacterial sequences also had a perfect match with the ITS3R primer sequence. Only a number of picocyanobacteria did not contain the target sequence. A BLAST search performed on the reverse primer sequences resulted in highest similarity scores for cyanobacteria. However, it cannot be concluded that the reverse primers are selective for cyanobacteria, since the database of rRNA ITS and 23S sequences is relatively small (compared to 16S sequences) and may be biased for cyanobacteria.
Theoretical melting curves calculated for rRNA-ITS sequences of several major genera (using the program MELT94), showed that the GC clamp positioned at the forward (5') primer yielded a favorable melting curve with a lower melting domain at the 3'-end.
In vitro specificity and applicability of the primers for rRNA-ITS amplification. The forward primer presented in Table 2 had a complete or almost complete match with cyanobacterial sequences, but also some sequence similarity with several non-cyanobacterial 16S rRNA sequences in the database. To confirm the selectivity of the primers for amplification of cyanobacterial rRNA-ITS, we tried to amplify DNA from bacterial strains with some degree of sequence homology to the forward primer (4 to 5 mismatches), and from a few randomly chosen strains. No PCR products were generated from these bacteria, neither at the optimized annealing temperature (as described below), nor 10 degrees below this temperature.
The phylogenetic coverage within the cyanobacterial phylum of the primers was investigated by using DNA from strains of a range of different cyanobacterial genera as template for PCR amplification (Table 3). For each primer combination, the highest temperature at which PCR products were generated for all genera was selected as optimal PCR amplification temperature. As a consequence, for several genera amplification is possible at higher annealing temperatures then those used in our optimized protocol. The number of PCR products and their sizes and relative intensities varied between the different genera (Table 3). For all strains that were tested, ITSa amplification yielded one band of 275 to 350 bp. ITSb amplification resulted in PCR products between 350 and 800 bp for most tested strains, with the exception of Synechocystis, Leptolyngbya and Lyngbya. One PCR product was formed from the genera Microcystis, Pseudanabaena, Planktothrix, Trichodesmium, Prochlorothrix and Synechococcus, and two PCR products from Aphanizomenon, Anabaena, Anabaenopsis, Gloeotrichia, Nodularia, Nostoc and Cylindrospermopsis. ITSc primers successfully amplified DNA from all strains that were tested, yielding for most genera PCR products ranging between 450 and 900 bp. Prochlorothrix hollandica yielded one very long product of 1050 basepairs., Amplification with ITSb or ITSc primers yielded the same number of bands for most strains, only ITSc amplification of Planktothrix strains produced two bands instead of one.
High-resolution separation of Microcystis strains by means of rRNA-ITS DGGE. The ability to differentiate related organisms by means of DGGE was examined using a number of Microcystis strains that had been isolated from Dutch lakes or obtained from culture collections (see Table 1 for details). The DGGE gels in Figure 1 demonstrate the possibility to separate PCR products obtained with the primerset targeted at the 16S (A), ITSa (B), ITSb (C), and ITSc (D), using DNA from 20 selected Microcystis strains. The 16S rRNA PCR product of approximately 450 basepairs gave rise to two bands in the DGGE gel, occupying identical positions for all strains (Fig. 1A). The occurrence of two bands can be explained by the presence of degenerate bases in the non GC-clamped reverse primer (Table 2). In contrast, ITSa amplicons (approximately 325 bp) resulted for most of our isolated strains and all culture collection strains in one DGGE band, for many strains on a unique position (Fig. 1B). Examples of strains with more than one band are V40 with three bands (lane
20, the upper band is not on the figure), and V88 (lane 19) with four bands.
These profiles containing two or more bands were encountered predominantly
in Microcystis cultures that had been established by isolating single colonies.
Compared to plating, this isolation strategy is more likely to yield cultures
that are not yet unialgal. The upper bands in lanes 19 and 20 resulted from
heteroduplex formation (15) as was confirmed through excision,
reamplification and DGGE analysis of these bands. The lower two bands in
these cultures were both derived from Microcystis strains as was revealed by a
BLAST search of the sequences obtained from these bands.
Results of the DGGE analysis of ITSb and ITSc amplicons from the selected Microcystis strains were largely comparable. Amplification yielded single bands of approximately 500 and 550 basepairs for ITSb and ITSc respectively. This resulted in one band on DGGE gels (Fig. 1C and D), except for strains SAG17.85 (lane 1), K29 (lane 7) and K50 (lanes 8). The positions in the gel were unique for most strains, and, importantly, a number of strains that could not or hardly be distinguished based on ITSa DGGE were separated using ITSb or ITSc DGGE. For example, ITSa amplicons from strains CYA228 (lane 10), PCC7820 (lane 11) and PCC7806 (lane 12) were undistinguishable and differed only faintly from those of strain V91 (lane 13) (Fig. 1B), whereas ITSb or ITSc amplicons enabled a clear separation and left only CYA228 and PCC7820 undifferentiated (Fig. 1C and 1D). Three cultures, SAG17.85 (lane 1), K29 (lane 7), and K50 (lane 8), had multiple bands when analyzed using ITSb or ITSc DGGE, whereas ITSa DGGE had revealed only one band (Fig. 1B-D). Again, the upper bands were shown to result from heteroduplex formation, and all excised lower bands were confirmed to represent Microcystis strains. In contrast to the improved strain differentiation obtained by ITSb or ITSc DGGE compared to ITSa DGGE, examples were found for the opposite situation. For instance, strains PCC7806 (lane 12) and V28 (lane 17), could hardly be distinguished when analyzing ITSb or ITSc amplicons, but occupied clearly different positions in the DGGE gel when ITSa amplicons were used (Fig. 1B-D). The two strains that had yielded two bands on ITSa DGGE, V88 (lane 19) and V40 (lane 20), gave rise to a single band using ITSb or ITSc DGGE (Fig. 1B-D).
The presence of several homologous DNA templates may affect PCR amplification and result in heteroduplex (see above) and chimera formation. To investigate the occurrence of these phenomena we mixed ITSa amplification products from 7 Microcystis strains that could be separated using DGGE, and used these mixtures as templates for ITSa amplification. Figure 2 shows the DGGE banding patterns generated from template mixtures of 2, 3, 5, or 7 Microcystis strains. In spite of the presence of several related sequences, each strain in the mixtures gave rise to one single band of similar intensity, and no additional bands were detected.
DGGE profiles of rRNA-ITS from different cyanobacterial genera. The developed protocols that proved to be effective for Microcystis separation were applied for DGGE analysis of specifically amplified rRNA-ITS of other cyanobacterial genera (Table 3). For almost every strain that was tested, ITSa amplification gave rise to one sharp band, mostly occupying a unique position in the gel (Fig. 3A). Only Aphanizomenon gracile yielded two bands. Also, the longer amplification products of ITSb and ITSc were analyzed using DGGE (Fig. 3B). The patterns for ITSb were mostly similar to those of ITSc and are therefore not shown. Strains from the genera Synechococcus, Synechocystis, Lyngbya, Pseudanabaena, Trichodesmium, and Prochlorothrix, yielded one band (Fig. 3). Leptolyngbya had a second band of lower intensity. Strains from the genera Anabaena, Aphanizomenon, Planktothrix, Cylindrospermopsis, and Gloeotrichia yielded two to four clear bands in most cases, and a few less distinct additional bands for Anabaenopsis. Possibly, some of the bands resulted from heteroduplex formation. Nostoc and Nodularia strains yielded two very fuzzy bands. In addition to the strains shown in Figure 3, a Microcoleus sp. isolate was analyzed and yielded sharp, single bands both on ITSa and ITSc DGGE gels (data not shown).
Field samples. To confirm that the developed methods for high-resolution analysis of cyanobacteria are valid for analysis of the complex microbial communities encountered in the field, we tested two rRNA-ITS primersets on field samples. Samples from three freshwater lakes were taken in summer when dense blooms of cyanobacteria of various genera were observed, and from one lake also in winter when there was no visible presence (including microscopic) of distinctive cyanobacteria. When analyzed on DGGE, ITSa and ITSc PCR products gave rise to complex banding patterns. As shown in the ITSa profiles from Fig. 4., unique as well as (probably) similar genotypes could be identified. The dominant bands were excised from the gel and the PCR products were re-amplified and sequenced. A BLAST search performed on these sequences revealed that the retrieved bands were all derived from cyanobacteria of various genera, including Microcystis, Anabaena, Synechococcus, Oscillatoria and Nostoc.
Reverse primer sites for the amplification of cyanobacterial rRNA-ITS sequences were gathered from previous research (Table 2). Three reverse primers were used, two of these (373R and ITS3R) targeted at highly conserved sequence motifs in the ITS, and one (ULR) at the 5'-end of the 23S gene. The combination of the forward primer (CSIF) and the reverse primers yields three primersets, hereafter denoted as ITSa (primers CSIF + 373R), ITSb (CSIF + ITS3R), and ITSc (CSIF + ULR) (Table 2). The rationale for the use of more than one primer combination for amplification of the rRNA-ITS was the tradeoff that exists between the broad applicability of the shorter fragments and the different melting behavior and higher amount of sequence information associated with longer fragments (see below). Alignment of cyanobacterial rRNA-ITS sequences deposited in the Genbank/EMBL/DDBJ databases showed that virtually all cyanobacteria had at least one operon containing a perfect match with the reverse primer 373R, which is targeted at the highly conserved tRNAile gene. Only some Prochlorococcus strains contained one mismatch. Most deposited cyanobacterial sequences also had a perfect match with the ITS3R primer sequence. Only a number of picocyanobacteria did not contain the target sequence. A BLAST search performed on the reverse primer sequences resulted in highest similarity scores for cyanobacteria. However, it cannot be concluded that the reverse primers are selective for cyanobacteria, since the database of rRNA ITS and 23S sequences is relatively small (compared to 16S sequences) and may be biased for cyanobacteria.
Theoretical melting curves calculated for rRNA-ITS sequences of several major genera (using the program MELT94), showed that the GC clamp positioned at the forward (5') primer yielded a favorable melting curve with a lower melting domain at the 3'-end.
In vitro specificity and applicability of the primers for rRNA-ITS amplification. The forward primer presented in Table 2 had a complete or almost complete match with cyanobacterial sequences, but also some sequence similarity with several non-cyanobacterial 16S rRNA sequences in the database. To confirm the selectivity of the primers for amplification of cyanobacterial rRNA-ITS, we tried to amplify DNA from bacterial strains with some degree of sequence homology to the forward primer (4 to 5 mismatches), and from a few randomly chosen strains. No PCR products were generated from these bacteria, neither at the optimized annealing temperature (as described below), nor 10 degrees below this temperature.
The phylogenetic coverage within the cyanobacterial phylum of the primers was investigated by using DNA from strains of a range of different cyanobacterial genera as template for PCR amplification (Table 3). For each primer combination, the highest temperature at which PCR products were generated for all genera was selected as optimal PCR amplification temperature. As a consequence, for several genera amplification is possible at higher annealing temperatures then those used in our optimized protocol. The number of PCR products and their sizes and relative intensities varied between the different genera (Table 3). For all strains that were tested, ITSa amplification yielded one band of 275 to 350 bp. ITSb amplification resulted in PCR products between 350 and 800 bp for most tested strains, with the exception of Synechocystis, Leptolyngbya and Lyngbya. One PCR product was formed from the genera Microcystis, Pseudanabaena, Planktothrix, Trichodesmium, Prochlorothrix and Synechococcus, and two PCR products from Aphanizomenon, Anabaena, Anabaenopsis, Gloeotrichia, Nodularia, Nostoc and Cylindrospermopsis. ITSc primers successfully amplified DNA from all strains that were tested, yielding for most genera PCR products ranging between 450 and 900 bp. Prochlorothrix hollandica yielded one very long product of 1050 basepairs., Amplification with ITSb or ITSc primers yielded the same number of bands for most strains, only ITSc amplification of Planktothrix strains produced two bands instead of one.
High-resolution separation of Microcystis strains by means of rRNA-ITS DGGE. The ability to differentiate related organisms by means of DGGE was examined using a number of Microcystis strains that had been isolated from Dutch lakes or obtained from culture collections (see Table 1 for details). The DGGE gels in Figure 1 demonstrate the possibility to separate PCR products obtained with the primerset targeted at the 16S (A), ITSa (B), ITSb (C), and ITSc (D), using DNA from 20 selected Microcystis strains. The 16S rRNA PCR product of approximately 450 basepairs gave rise to two bands in the DGGE gel, occupying identical positions for all strains (Fig. 1A). The occurrence of two bands can be explained by the presence of degenerate bases in the non GC-clamped reverse primer (Table 2). In contrast, ITSa amplicons (approximately 325 bp) resulted for most of our isolated strains and all culture collection strains in one DGGE band, for many strains on a unique position (Fig. 1B). Examples of strains with more than one band are V40 with three bands (
Results of the DGGE analysis of ITSb and ITSc amplicons from the selected Microcystis strains were largely comparable. Amplification yielded single bands of approximately 500 and 550 basepairs for ITSb and ITSc respectively. This resulted in one band on DGGE gels (Fig. 1C and D), except for strains SAG17.85 (lane 1), K29 (lane 7) and K50 (lanes 8). The positions in the gel were unique for most strains, and, importantly, a number of strains that could not or hardly be distinguished based on ITSa DGGE were separated using ITSb or ITSc DGGE. For example, ITSa amplicons from strains CYA228 (lane 10), PCC7820 (lane 11) and PCC7806 (lane 12) were undistinguishable and differed only faintly from those of strain V91 (lane 13) (Fig. 1B), whereas ITSb or ITSc amplicons enabled a clear separation and left only CYA228 and PCC7820 undifferentiated (Fig. 1C and 1D). Three cultures, SAG17.85 (lane 1), K29 (lane 7), and K50 (lane 8), had multiple bands when analyzed using ITSb or ITSc DGGE, whereas ITSa DGGE had revealed only one band (Fig. 1B-D). Again, the upper bands were shown to result from heteroduplex formation, and all excised lower bands were confirmed to represent Microcystis strains. In contrast to the improved strain differentiation obtained by ITSb or ITSc DGGE compared to ITSa DGGE, examples were found for the opposite situation. For instance, strains PCC7806 (lane 12) and V28 (lane 17), could hardly be distinguished when analyzing ITSb or ITSc amplicons, but occupied clearly different positions in the DGGE gel when ITSa amplicons were used (Fig. 1B-D). The two strains that had yielded two bands on ITSa DGGE, V88 (lane 19) and V40 (lane 20), gave rise to a single band using ITSb or ITSc DGGE (Fig. 1B-D).
The presence of several homologous DNA templates may affect PCR amplification and result in heteroduplex (see above) and chimera formation. To investigate the occurrence of these phenomena we mixed ITSa amplification products from 7 Microcystis strains that could be separated using DGGE, and used these mixtures as templates for ITSa amplification. Figure 2 shows the DGGE banding patterns generated from template mixtures of 2, 3, 5, or 7 Microcystis strains. In spite of the presence of several related sequences, each strain in the mixtures gave rise to one single band of similar intensity, and no additional bands were detected.
DGGE profiles of rRNA-ITS from different cyanobacterial genera. The developed protocols that proved to be effective for Microcystis separation were applied for DGGE analysis of specifically amplified rRNA-ITS of other cyanobacterial genera (Table 3). For almost every strain that was tested, ITSa amplification gave rise to one sharp band, mostly occupying a unique position in the gel (Fig. 3A). Only Aphanizomenon gracile yielded two bands. Also, the longer amplification products of ITSb and ITSc were analyzed using DGGE (Fig. 3B). The patterns for ITSb were mostly similar to those of ITSc and are therefore not shown. Strains from the genera Synechococcus, Synechocystis, Lyngbya, Pseudanabaena, Trichodesmium, and Prochlorothrix, yielded one band (Fig. 3). Leptolyngbya had a second band of lower intensity. Strains from the genera Anabaena, Aphanizomenon, Planktothrix, Cylindrospermopsis, and Gloeotrichia yielded two to four clear bands in most cases, and a few less distinct additional bands for Anabaenopsis. Possibly, some of the bands resulted from heteroduplex formation. Nostoc and Nodularia strains yielded two very fuzzy bands. In addition to the strains shown in Figure 3, a Microcoleus sp. isolate was analyzed and yielded sharp, single bands both on ITSa and ITSc DGGE gels (data not shown).
Field samples. To confirm that the developed methods for high-resolution analysis of cyanobacteria are valid for analysis of the complex microbial communities encountered in the field, we tested two rRNA-ITS primersets on field samples. Samples from three freshwater lakes were taken in summer when dense blooms of cyanobacteria of various genera were observed, and from one lake also in winter when there was no visible presence (including microscopic) of distinctive cyanobacteria. When analyzed on DGGE, ITSa and ITSc PCR products gave rise to complex banding patterns. As shown in the ITSa profiles from Fig. 4., unique as well as (probably) similar genotypes could be identified. The dominant bands were excised from the gel and the PCR products were re-amplified and sequenced. A BLAST search performed on these sequences revealed that the retrieved bands were all derived from cyanobacteria of various genera, including Microcystis, Anabaena, Synechococcus, Oscillatoria and Nostoc.
There are two main considerations for the use of primers specific for
cyanobacteria in DGGE analyses. Firstly, specific primers prevent
amplification of the abundant DNA of non-cyanobacterial microbes in field
samples. The resulting DGGE profiles are less complex compared to those
generated with general bacterial primers, hence detection of cyanobacteria
that are less abundant or have lower amplification efficiency is feasible.
Secondly, characterization of cultures by DGGE, but also by RFLP or
sequencing, is not possible when DNA from contaminants is co-amplified.
Rendering cyanobacteria axenic can be a difficult and time-consuming
procedure, and often they are cultivated more easily when accompanied by
heterotrophic bacteria (27). The selectivity of our developed primersets was
confirmed through homology search in databases, and through in vitro tests
using DNA from cultures of heterotrophic bacteria and from complex microbial
communities in freshwater lakes (Fig. 4). The appearance of only 1 to 4 distinct
bands in DGGE profiles of cultures from various genera (Fig. 1 and 3) may
serve as additional support for selectivity of the developed primersets. None of
the cultures used in our study was axenic, yet no unexplainable additional
bands were detected on DGGE, even when PCR conditions were made less
selective (by substantially lowering annealing temperatures).
Primers 322, described by Wilmotte et al. (40), and 16CITS, described by Neilan et al (26), are targeted at sequences just upstream from the target sequence of forward primer CSIF, and thus could produce virtually identical amplification products. Primer 322 however, is targeted at highly conserved bacterial sequences and is therefore only suitable for studies of axenic cultures of cyanobacteria (14, 21). Primer 16CITS is specific for cyanobacteria. However, from our alignment of 16S sequences it appeared that primer CSIF has more sequence differences with non-cyanobacterial sequences, especially at the 3'site. For primer 16CITS we found 71 non-cyanobacterial sequences with 2 mismatches (as opposed to 0 for primer CSIF), and 266 sequences with 3 mismatches (as opposed to 2 for CSIF). Primer CSIF can therefore be considered more specific for cyanobacteria. Nevertheless, we emphasize that this was based on sequences in the current database and no experimental comparisons between the primers were made.
Coverage of a broad range of genera of primer CSIF was confirmed by software tool Probe Match using published cyanobacterial sequences, and was supported by in vitro tests (Table 3 and Fig. 3). We were able to generate PCR products from Nostoc strain CYA124, even as some deposited sequences from this genus had 3 mismatches with the primer sequence. In any case, PCR products can be formed from all strains from the genera Nostoc and Spirulina (2 or 3 mismatches in deposited sequences), from Gloeobacter and Calothrix (3 mismatches), by including specific primers for these genera, i.e. reducing the mismatches to two or less. The generation of amplification products from strains of all tested cyanobacterial genera when using primer 373R as reverse primer, and from most genera when using primer ITS3R, is supported by the universal occurrence of the highly conserved gene for tRNAile and of certain structural elements in cyanobacteria (7, 13, 34).
The difference in resolution using 16S and ITS DGGE in Microcystis is in agreement with the reported average sequence diversity of less than 1% in 16S (7, 29) compared to up to 7% in rRNA-ITS (26, 30). The high resolution and the single bands that are generated make rRNA-ITS DGGE a valuable method for analysis of this genus. We made the assumption that the multiple bands containing Microcystis sequences in the rRNA-ITS DGGE profiles of some cultures reflect the co-isolation of two different Microcystis strains, instead of the occurrence of two different rRNA operons. This assumption can be confirmed unequivocally by repeated plating to make certain that the analysed cultures are unialgal. This procedure was not carried out here. In any case, the possibility of co-isolation of two morphologically indistinguishable organisms is more likely than the occurrence of multiple different operons in a limited number of deviant strains. Also, all strains that were most confidently unialgal (because they originated from culture collections or had been isolated using plating techniques) gave rise to one band on DGGE. Following this line of reasoning, the two sequences in culture collection strain SAG 17.85 (Fig. 1C and D) have to be explained by unnoticed contamination during years of cultivation in the lab. Support for the occurrence of only one operon (or several identical operons) in the genus Microcystis comes from the unambiguous sequences that Otsuka et al (30) obtained when sequencing the rRNA-ITS of 47 Microcystis strains.
The occurrence of multiple operons in one organism, resulting in rRNA-ITS amplicons of different sizes (Table 3) has been found before in the genera Anabaena, Aphanizomenon, Anabaenopsis, Nostoc, Cylindrospermopsis, and Nodularia (13, 14, 26). Sequencing of the rRNA-ITS from Nodularia, Nostoc, Calothrix and Scytonema strains (3, 7, 13), revealed that not all rRNA operons of cyanobacteria contain tRNAile genes. However, since other operons in these organisms do contain tRNAile genes, they are detectable using ITSa amplification (as shown for Nodularia and Nostoc, Fig. 3A). The presence of tRNA genes on only one copy of the rRNA may explain for a number of genera the production of only one band after ITSa amplification (Fig. 3A and Table 3) despite the existence of different operons as revealed by ITSb or ITSc amplification (Fig. 3B and Table 3). Alternatively, generation of a single ITSa DGGE band could be explained by identical sequences at the 5'-end of different rRNA-ITS operons.
For the generation of DGGE profiles from longer stretches of rRNA-ITS, primerset ITSc is preferable in most cases. Compared to ITSb analysis the resolution was similar (compare Figs 1C and 1D), yet more genera could be amplified and there is more sequence information contained in the amplicons (60-100 bp extra, see Table 3). Nevertheless, for some genera primerset ITSb was more suitable for DGGE profiling. For instance, ITSb amplification products of Nodularia yielded sharp DGGE bands (data not shown), whereas ITSc DGGE resulted in diffuse bands, unsuitable for analysis (Fig. 3B). Also, DGGE profiles resulting from ITSb amplication of Planktothrix aghardii were relatively simple (1 band) compared to the profile resulting from ITSc amplification (3 bands). Due to the occurrence of multiple rRNA-ITS operons in one organism, identification of all dominant bands produced with ITSb and ITSc primers is necessary to come to a reliable estimate of the diversity of cyanobacteria in complex DGGE profiles.
It has to be emphasized that DGGE diversity profiles do not necessarily reflect the true diversity in the field. DNA extraction efficiency and the number of rRNA operons may vary between genera, and the PCR step has several inherent pitfalls, which complicate the interpretation of DGGE profiles of communities. Artefacts introduced by the PCR amplification reaction of homologous sequences include chimera (17) and heteroduplex formation (15) which may lead to an overestimation of the number of organisms, and template annealing (36) and preferential amplification of some DNA templates (33) which may result in a shift in the apparent ratio between organisms after PCR amplification. Heteroduplex bands were formed in some cultures suspected of containing more than one Microcystis isolate (Fig. 1), and in some organisms containing multiple operons (Fig. 3). In contrast, deliberate mixing of template DNA from several Microcystis strains showed no evidence of chimera or heteroduplex formation, since no additional bands were detected in the DGGE profiles (Fig. 2). Equal band intensities pointed to the absence of preferential amplification. However, this effect is more likely between genera since primer binding may differ due to imperfect matching.
Primers 322, described by Wilmotte et al. (40), and 16CITS, described by Neilan et al (26), are targeted at sequences just upstream from the target sequence of forward primer CSIF, and thus could produce virtually identical amplification products. Primer 322 however, is targeted at highly conserved bacterial sequences and is therefore only suitable for studies of axenic cultures of cyanobacteria (14, 21). Primer 16CITS is specific for cyanobacteria. However, from our alignment of 16S sequences it appeared that primer CSIF has more sequence differences with non-cyanobacterial sequences, especially at the 3'site. For primer 16CITS we found 71 non-cyanobacterial sequences with 2 mismatches (as opposed to 0 for primer CSIF), and 266 sequences with 3 mismatches (as opposed to 2 for CSIF). Primer CSIF can therefore be considered more specific for cyanobacteria. Nevertheless, we emphasize that this was based on sequences in the current database and no experimental comparisons between the primers were made.
Coverage of a broad range of genera of primer CSIF was confirmed by software tool Probe Match using published cyanobacterial sequences, and was supported by in vitro tests (Table 3 and Fig. 3). We were able to generate PCR products from Nostoc strain CYA124, even as some deposited sequences from this genus had 3 mismatches with the primer sequence. In any case, PCR products can be formed from all strains from the genera Nostoc and Spirulina (2 or 3 mismatches in deposited sequences), from Gloeobacter and Calothrix (3 mismatches), by including specific primers for these genera, i.e. reducing the mismatches to two or less. The generation of amplification products from strains of all tested cyanobacterial genera when using primer 373R as reverse primer, and from most genera when using primer ITS3R, is supported by the universal occurrence of the highly conserved gene for tRNAile and of certain structural elements in cyanobacteria (7, 13, 34).
The difference in resolution using 16S and ITS DGGE in Microcystis is in agreement with the reported average sequence diversity of less than 1% in 16S (7, 29) compared to up to 7% in rRNA-ITS (26, 30). The high resolution and the single bands that are generated make rRNA-ITS DGGE a valuable method for analysis of this genus. We made the assumption that the multiple bands containing Microcystis sequences in the rRNA-ITS DGGE profiles of some cultures reflect the co-isolation of two different Microcystis strains, instead of the occurrence of two different rRNA operons. This assumption can be confirmed unequivocally by repeated plating to make certain that the analysed cultures are unialgal. This procedure was not carried out here. In any case, the possibility of co-isolation of two morphologically indistinguishable organisms is more likely than the occurrence of multiple different operons in a limited number of deviant strains. Also, all strains that were most confidently unialgal (because they originated from culture collections or had been isolated using plating techniques) gave rise to one band on DGGE. Following this line of reasoning, the two sequences in culture collection strain SAG 17.85 (Fig. 1C and D) have to be explained by unnoticed contamination during years of cultivation in the lab. Support for the occurrence of only one operon (or several identical operons) in the genus Microcystis comes from the unambiguous sequences that Otsuka et al (30) obtained when sequencing the rRNA-ITS of 47 Microcystis strains.
The occurrence of multiple operons in one organism, resulting in rRNA-ITS amplicons of different sizes (Table 3) has been found before in the genera Anabaena, Aphanizomenon, Anabaenopsis, Nostoc, Cylindrospermopsis, and Nodularia (13, 14, 26). Sequencing of the rRNA-ITS from Nodularia, Nostoc, Calothrix and Scytonema strains (3, 7, 13), revealed that not all rRNA operons of cyanobacteria contain tRNAile genes. However, since other operons in these organisms do contain tRNAile genes, they are detectable using ITSa amplification (as shown for Nodularia and Nostoc, Fig. 3A). The presence of tRNA genes on only one copy of the rRNA may explain for a number of genera the production of only one band after ITSa amplification (Fig. 3A and Table 3) despite the existence of different operons as revealed by ITSb or ITSc amplification (Fig. 3B and Table 3). Alternatively, generation of a single ITSa DGGE band could be explained by identical sequences at the 5'-end of different rRNA-ITS operons.
For the generation of DGGE profiles from longer stretches of rRNA-ITS, primerset ITSc is preferable in most cases. Compared to ITSb analysis the resolution was similar (compare Figs 1C and 1D), yet more genera could be amplified and there is more sequence information contained in the amplicons (60-100 bp extra, see Table 3). Nevertheless, for some genera primerset ITSb was more suitable for DGGE profiling. For instance, ITSb amplification products of Nodularia yielded sharp DGGE bands (data not shown), whereas ITSc DGGE resulted in diffuse bands, unsuitable for analysis (Fig. 3B). Also, DGGE profiles resulting from ITSb amplication of Planktothrix aghardii were relatively simple (1 band) compared to the profile resulting from ITSc amplification (3 bands). Due to the occurrence of multiple rRNA-ITS operons in one organism, identification of all dominant bands produced with ITSb and ITSc primers is necessary to come to a reliable estimate of the diversity of cyanobacteria in complex DGGE profiles.
It has to be emphasized that DGGE diversity profiles do not necessarily reflect the true diversity in the field. DNA extraction efficiency and the number of rRNA operons may vary between genera, and the PCR step has several inherent pitfalls, which complicate the interpretation of DGGE profiles of communities. Artefacts introduced by the PCR amplification reaction of homologous sequences include chimera (17) and heteroduplex formation (15) which may lead to an overestimation of the number of organisms, and template annealing (36) and preferential amplification of some DNA templates (33) which may result in a shift in the apparent ratio between organisms after PCR amplification. Heteroduplex bands were formed in some cultures suspected of containing more than one Microcystis isolate (Fig. 1), and in some organisms containing multiple operons (Fig. 3). In contrast, deliberate mixing of template DNA from several Microcystis strains showed no evidence of chimera or heteroduplex formation, since no additional bands were detected in the DGGE profiles (Fig. 2). Equal band intensities pointed to the absence of preferential amplification. However, this effect is more likely between genera since primer binding may differ due to imperfect matching.
We show that genetic differentiation of Microcystis colonies based on rRNA-ITS
sequences correlates with microcystin production. Hence, ecological
studies of toxic and non-toxic cyanobacteria are now feasible through studies
of rRNA-ITS genotypic diversity in isolated cultures or colonies, and in natural
communities. Microcystis colonies (107) were isolated from 14 European and 1
Maroccan lakes, the presence of microcystins in each colony was examined by
MALDI-TOF, and they were grouped using rRNA-ITS DGGE. Based on DGGE
analysis of amplified ITSa and ITSc fragments, yielding supplementary
resolution (Janse et al., 2003), 59 classes could be distinguished. Microcystin-producing
and non-producing colonies were separated into different classes.
Sequences obtained from at least one representative strain from most classes
were congruent with the classification based on rRNA-ITS DGGE. Alignment
of these colony sequences and published rRNA-ITS sequences from cultured
Microcystis strains of known toxicity confirmed that microcystin production
correlated with rRNA-ITS sequences. About 30% of the analyzed colonies gave
rise to more than one band in DGGE profiles, indicating either aggregation of
different colonies or the occurrence of sequence differences between multiple
operons in some strains. Several colonies sharing identical rRNA-ITS
sequences were assigned to different morphospecies, and colonies of one
morphospecies contained various rRNA-ITS sequences, confirming the
inconsistencies reported for Microcystis identification based on morphology.
There was no indication for geographical restriction of strains since identical
sequences could originate from geographically distant lakes. DGGE
community profiles from two Dutch lakes from which colonies had been
isolated showed abundance of different strains at subsequent bloom stages.
Although not all bands in the community profiles could be matched with
isolated colonies, the profiles suggest that non-toxic colonies dominate later in
the season and in scums.
Worldwide, eutrophic freshwater lakes endure noxious blooms and surface
scums caused by cyanobacteria from the genus Microcystis. During many
blooms, Microcystis cells produce the hepatotoxin microcystin which is toxic to
humans and many other eukaryotes (3).
Microcystins are cyclic heptapeptides, formed non-ribosomally by peptide- and polyketide-synthetases. More than 70 structural microcystin variants are known to date (12).
Microcystins are cyclic heptapeptides, formed non-ribosomally by peptide- and polyketide-synthetases. More than 70 structural microcystin variants are known to date (12).
We provide rapid and reliable methods for toxin measurements that allow for a
proper assessment of the hazards that Microcystis blooms pose on human
health and aquatic ecosystems. Predicting how toxin concentrations will
develop, requires tools and insights for understanding the dynamics of
microcystin production. Environmental factors may affect microcystin
production in Microcystis cultures by a factor 3-4 (23). However, the actual
capability of microcystin production is genetically determined. Microcystin
producing and non-producing strains coexist in natural populations (6, 28).
Strains isolated from the same bloom sample are constitutively toxic or non-toxic
(14, 19, 28) and the cellular microcystin content may differ considerably
between strains (2). The decisive factor determining the average cellular
microcystin content in a given natural population, and thereby the toxicity of a
bloom, is the abundance of microcystin producing strains (4).
Understanding of the community composition and dynamics of microcystin
producing and non-producing Microcystis strains in the field is very limited,
due to a lack of suitable identification methods. Traditional characterization of
Microcystis based on morphological features is very difficult, moreover,
transition between morphological characteristics has been observed (20).
Identification difficulties may partly explain why correlations between
morphology and toxicity have proven to be unreliable (6, 13, 21, 29),
emphasizing the need for identification independent of morphological
characteristics. Molecular biological methods provide tools for recognition of
Microcystis strains that are more reliable, and the high resolution that can be
attained makes differentiation below genus level possible.
A number of studies have targeted the microcystin synthetase (mcy) gene
cluster (5, 25), for identification of toxic Microcystis strains. This approach has
the obvious advantage of a direct relationship between gene detection and
toxicity, provided non-toxic strains do not possess the gene. Detection by PCR
of the mcyB gene, the mcyA gene, or the adenylation domain within the
microcystin synthatase gene cluster, showed good correlation with toxin
production, but some anomalies were found. A small number of Microcystis
strains contained the mcy gene cluster but lacked detectable microcystins (10,
15, 17, 18, 26). The high sequence similarity between the mcyB region and
other peptide synthetase loci (5, 26) and the occurrence of multiple adenylation
domains in toxic and non-toxic Microcystis spp. (18) may explain these
discrepancies. Alternatively, Nishizawa et al. (18) suggested that some non-toxic
Microcystis strains do contain the mcyABC gene. To avoid the biases and
limitations inherent to studies on cultured isolates, genetic analyses have also
been done on colonies that had been isolated directly from the field. Kurmayer
et al. (12) separated Microcystis colonies from a field population in size classes
and showed through quantification of genotypes with and without the mcyB
gene that larger colonies were mainly responsible for microcystin production.
In a survey of a large number of (non-cultivated) Microcystis colonies that had
been characterized for microcystin production using matrix-assisted laser
desorption/ionization time-of-flight mass spectrometry (MALDI TOF MS) (6),
Microcystis specific primers targeted at mcyB (13) did not yield PCR products
from 39% of microcystin containing colonies (false negatives). However,
combination with a diagnostic PCR targeted at mcyA, resulted in only a few
(4.9%) false negatives, as well as a few (2.5%) false positives (29).
In the present invention, we used an alternative approach to characterize toxic
and non-toxic Microcystis colonies in natural populations, independent of mcy
gene detection. Isolated colonies in which the presence of microcystins had
been examined were differentiated at high resolution based on sequences of a
'taxonomic' marker gene (rRNA-Internal Transcribed Spacer, rRNA-ITS)
known to differ considerably between Microcystis strains (9, 21). We show that
analysis of the rRNA ITS by using denaturing gradient gel electrophoresis
(DGGE) or by sequencing, is sufficiently resolving for identification of toxic and
non-toxic Microcystis strains in single isolated colonies and in natural
samples.
Because strain differentiation was based on sequence differences in universal
genes, the pitfalls of diagnostic PCR when using mcy gene detection
(occurrence of false positives and negatives) were avoided. Moreover, this
approach provides ecologically relevant insights into the dynamics of all
cyanobacterial strains that are present in a natural community. Instead of
focusing on the limited subgroup of mcy gene-containing Microcystis strains,
different toxic and non-toxic strains can be distinguished. Finally, since colony
properties other than microcystin production (such as the production of other -
potentially toxic- peptides) may also correlate with rRNA-ITS classification,
this gene offers possibilities for characterization of a broader range of strain
properties. It is preferred that all strains that can be encountered are
characterized with regard to the strain properties of interest (such as toxin
production) and rRNA-ITS sequence information.
Sampling for colony isolation was carried out during summer 2001 in 15 water
bodies from 9 European countries and Marocco by net hauls using a plankton
net (40µm mesh size). The samples were kept cool until they were processed.
Colony isolation and morphological description were standardized in the
course of a workshop held from 2-7 July 2001 in Berlin, see also (29). For
colony isolation, samples were diluted and single colonies picked out by using
thin Pasteur pipettes or forceps under binocular microscopes. Colonies were
washed in BG11 medium (22) to dispose of any visible secondary colonies or
other cyanobacteria. Morphological classification was done using the
morphological criteria proposed by Komarek and Anagnostidis (11). Colonies
were transferred into a reaction tube (0.5ml) containing culture medium (final
sample volume 4-30 µl) and the presence of each colony in the tube was
verified microscopically. The tubes were frozen (liquid nitrogen) and thawed
several times to disintegrate the colonies, and stored at -20°C. Aliquots from
each tube were used for gene amplification and for matrix-assisted laser
desorption/ionization time-of-flight mass spectrometry (MALDI-TOF MS).
MALDI-TOF MS measurements were performed as described in (6, 29). 1-4 µl
of the cell suspension from each colony was prepared onto a stainless steel
template and immediately 1 µl of matrix (10 mg/ml 2,5-dihydroxybenzoic acid
in water/acetonitrile (1:1) with 0.03% trifluoroacetic acid) was added. Positive
ion mass spectra were recorded from each colony using a MALDI-TOF mass
spectrometer (Voyager DE-PRO, PerSeptive Biosystems, Framingham, MA)
equipped with a reflectron. For desorption of the components a nitrogen laser
beam (1 = 337 nm) was focused on the template. The acceleration voltage was
set at 20 kV. Measurements were performed in the delayed extraction mode,
allowing the determination of monoisotopic mass values. A low mass gate of
500 improved the measurement by filtering out the most intensive matrix ions.
Chlorophyll-a degradation products phaeophytine-a and phaeophorbide-a with
mass values of m/z 871.57 and 593.27 Da were used for internal calibration.
After determination of monoisotopic mass values microcystins were identified
by Post Source Decay (PSD) measurements of fragment ions. The precursor
ions were selected with a Time Ion Selector having a mass window of 10 mass
units. The operating voltages of the reflectron were reduced stepwise to record
12 spectral segments sequentially. PSD analysis were performed directly from
the same colony on the template.
Lakes 't Joppe and Zeegerplas are eutrophic lakes (maximum depth
approximately 25 m) which are stratified during the summer. Water samples
were collected 0.5 m below the surface, or from surface scum, in sterile bottles
from a boat in the middle of the lake and stored in the dark at 4°C. Within four
hours after sampling, a volume of 250 ml water or less if the filter clogged, was
filtered over a 25 mm diameter, 0.2 mm pore size mixed esters filter (ME 24,
Schleicher & Schuell, Dassel, Germany). The filter was cut in two with a
sterile scalpel and each half was stored in a microcentrifuge tube at -80°C until
further processing. DNA from filters containing field samples was isolated as
described by Zwart et al. (31).
Primer sequences and amplification conditions were according to (9).
Primer CYA 371F (forward primer for nested PCR) had the following sequence: 5'- CCT ACG GGA GGC AGC AGT GGG GAA TTT TCC AC-3'. Primer GC-CSIF (forward primer for ITSa and ITSc amplification) had the following sequence: 5'- GYC ACG CCC GAA GTC RTT AC-3'. Primer 373R (reverse primer for ITSa amplification) had the following sequence: 5'- CTA ACC ACC TGA GCT AAT-3', and primer ULR (reverse primer for nested PCR and for ITSc amplification) had the following sequence: 5'- CCT CTG TGT GCC TAG GTA TC-3'. PCR amplification was performed in an MBS 0.5 S thermocycler (ThermoHybaid, Ashford, UK) in a 25 ml reaction mixture containing approximately 50 ng of DNA, (10 mM Tris/HCl pH 8.3, 50 mM KCl, 0.01% w/v gelatin, 200 mM of each deoxynucleotide, 1.5 mM MgCl2, 2.5 units of Taq DNA polymerase and 0.5 mM of each primer). The temperature cycling conditions for the amplification of rRNA-ITS, ITSa and ITSc (9) were as follows. After a pre-incubation at 94°C for 5 min, a total of 30 cycles were performed of 94°C for 1 min, the annealing temperature Ta for 1 min and 72°C for 1 min. In the first twenty cycles, Ta decreased by 1°C after every second cycle from 62°C in the first cycle to 52°C in the twentieth. This 'touch down' procedure was followed to reduce non-specific annealing of the primers. In the last ten cycles, Ta was 52°C. The temperature cycling was concluded with a final step of 30 min at 72°C.
Primer CYA 371F (forward primer for nested PCR) had the following sequence: 5'- CCT ACG GGA GGC AGC AGT GGG GAA TTT TCC AC-3'. Primer GC-CSIF (forward primer for ITSa and ITSc amplification) had the following sequence: 5'- GYC ACG CCC GAA GTC RTT AC-3'. Primer 373R (reverse primer for ITSa amplification) had the following sequence: 5'- CTA ACC ACC TGA GCT AAT-3', and primer ULR (reverse primer for nested PCR and for ITSc amplification) had the following sequence: 5'- CCT CTG TGT GCC TAG GTA TC-3'. PCR amplification was performed in an MBS 0.5 S thermocycler (ThermoHybaid, Ashford, UK) in a 25 ml reaction mixture containing approximately 50 ng of DNA, (10 mM Tris/HCl pH 8.3, 50 mM KCl, 0.01% w/v gelatin, 200 mM of each deoxynucleotide, 1.5 mM MgCl2, 2.5 units of Taq DNA polymerase and 0.5 mM of each primer). The temperature cycling conditions for the amplification of rRNA-ITS, ITSa and ITSc (9) were as follows. After a pre-incubation at 94°C for 5 min, a total of 30 cycles were performed of 94°C for 1 min, the annealing temperature Ta for 1 min and 72°C for 1 min. In the first twenty cycles, Ta decreased by 1°C after every second cycle from 62°C in the first cycle to 52°C in the twentieth. This 'touch down' procedure was followed to reduce non-specific annealing of the primers. In the last ten cycles, Ta was 52°C. The temperature cycling was concluded with a final step of 30 min at 72°C.
DGGE was performed essentially as described by Muyzer et al. (16). Briefly,
PCR products were separated on a 1.5 mm thick, vertical gel containing 8%
(w/v) polyacrylamide (37.5:1 acrylamide: bisacrylamide) and a linear gradient
of the denaturants urea and formamide, increasing from 25 or 30% at the top
of the gel to 40% at the bottom. The concentrations depended on the gene
products that were analyzed and are given in the figure legends. Here, 100%
denaturant is defined as 7 M urea plus 40% v/v formamide. Electrophoresis
was performed in a buffer containing 40 mM Tris, 40 mM acetic acid, 1 mM
EDTA (pH 7.6) (0.5' Tris-acetate-EDTA buffer) for 16 hours at 75 V. The gel
was stained for 1 h in water containing 0.5 µg ml-1 ethidium bromide. An
image of the gel was recorded with a CCD camera system (Imago, B&L
Systems, The Netherlands).
A small piece of gel from the middle of the target band was excised from the
DGGE gel and incubated in 50 ml sterile milli-Q purified water for 24 hours at
4°C. The eluent was reamplified using the original primerset and run on
DGGE to confirm its identity. PCR products were purified and sequenced
using Applied Biosystems 3730 and 3100 genetic analysers by Baseclear
Labservices (Baseclear, Leiden, the Netherlands). Sequences were deposited at
EMBL and were assigned accession numbers AJ605140-AJ605221 for sequences from
isolated colonies. Similarity with sequences deposited in Genbank/EMBL/DDBJ
was checked using the program Blast (1)(via
http://www.ncbi.nlm.nih.gov/BLAST/).
http://www.ncbi.nlm.nih.gov/BLAST/).
Sequences from the rRNA-ITS region were obtained from
Genbank/EMBL/DDBJ and were aligned using the programs ClustalW, the
BioEdit Sequence Alignment Editor (7), and the program package ARB
(www.ARB-home.de). Trees were constructed from aligned sequences using
ARB and Treecon (27).
The Microcystis colonies we used for our investigations originated from 15
lakes from 9 European countries and Marocco. Most of the water samples had
been collected early July 2001 and were isolated and characterized by experts
during a European workshop. Additional colonies from two Dutch lakes ('t
Joppe and Zeegerplas) were isolated and characterized in August and
September. A study of the relations between colony morphotypes, occurrence of
microcystins, and diagnostic PCR targeted at the mcyA and mcyB genes, has
been published by Via-Ordorika et al. (29). These authors identified eight
morphotypes, mostly M. aeruginosa and M. ichthyoblabe, and less frequently
M. botrys, M. flos-aquae, M. panniformis, M. viridis, M. wesenbergii and M.
novacekii. A small number of Microcystis colonies exhibited intermediate
morphological characteristics. For details on relative abundances and
distribution over the sampled lakes of these morphotypes, we refer to their
paper. In 123 out of 151 colony samples we obtained, the presence of toxins
had been determined by MALDI TOF MS and in 111 of these colonies toxin
production capacity had been confirmed by PCR detection of the mcy gene.
Eight colonies that had not yielded a MALDI TOF signal, had been
characterized by mcy PCR only.
To enable grouping of Microcystis colonies based on rRNA-ITS, we amplified
DNA fragments that are suitable for DGGE analysis (9) from the small
quantities of cells in colony aliquots that remained after the analyses described
above. A nested PCR protocol was used to maximize DNA retrieval. In the first
step, cyanobacteria specific 16S primer CYA 371F and universal 235 primer
ULR were used for amplification of the a major part of the 16S, the ITS, and
short section of the 23S of the rRNA gene. The resulting PCR product was
diluted and used as template for amplification of the 3'-end of the 16S plus
part of the rRNA ITS (ITSa) by using cyanobacteria specific 16S primer CSIF
in combination with ITS primer 373R, or for amplification of a longer fragment
spanning the entire rRNA ITS (ITSc) by using primers CSIF and ULR (9).
Out of the total of 151 sample aliquots, 107 yielded PCR products. Successful
amplification was only slightly biased for lake of origin (between 70-100% of
the colonies originating from a lake yielded PCR products, with the exception
of 25% from lake Brno), morphospecies assignation (between 60- 85% of the
colonies assigned to a morphospecies yielded PCR products with the exception
of the two M.viridis colonies) and presence of toxins (75% of both toxic and
non-toxic colonies, and 48% of the colonies with undetectable toxins yielded
PCR products). Consequently, the collection of colonies that was subjected to
DGGE analysis contained Microcystis colonies derived from all 13 water bodies
and covering all morphospecies except M. viridis. Toxin data were available for
96 from the 107 colonies that yielded PCR products.
Colonies were differentiated by analysis of ITSa amplicons on DGGE. Based on
the position of ITSa bands in the gel (Fig. 1), colonies were assigned to 27
different groups (Table 1). To enable between gels comparison of bands, each
new batch of colonies was analyzed together with a mixture of colonies
assigned to different groups and thus representing different gel positions.
Differentiation of colonies based on ITSc DGGE was more difficult due to the
smaller differences in migration of the longer sequences. Nevertheless, colonies
could be assigned to 19 different groups based on ITSc DGGE (Table 1).
Several of the colonies gave rise to profiles with two or more bands (e.g. Fig 1,
colonies #63 or #147). In the 8 profiles with more than two bands, the upper
one or two bands were heteroduplexes as was shown through excision,
reamplification and analysis on DGGE of these bands. Only one colony (#119)
appeared to contain three different (non-heteroduplex) bands in ITSa DGGE
profiles. Out of 107 analyzed colonies, 76 yielded ITSa as well as ITSc DGGE
profiles containing one sequence (e.g. #65), and 11 colonies yielded ITSa and
ITSc profiles containing two sequences (e.g. #63). For 14 colonies, profiles of
one ITSa band and two ITSc bands were generated (e.g. #147), whereas 5
colonies showed one ITSc band and two ITSa bands (e.g. #112)(Table 1).
There was no apparent relation between morphospecies and rRNA-ITS DGGE
profiles, since colonies from each morphospecies were assigned to different ITS
DGGE classes. Also, with the exception of Lake Frederikborg (Denmark), the
lakes yielded colonies from multiple ITS DGGE classes. Hence, multiple
colonies in an ITS DGGE class were in most cases isolated from different lakes
and assigned to different morphospecies (Table 1).
The position of ITSa bands on DGGE was not a sufficient determinant for
differentiation of all toxic and non-toxic colonies. In ITSa group 11 for
instance, several non-toxic colonies were grouped together with a majority of
toxic ones (Table 1). In combination with differentiation based on ITSc DGGE,
however, colonies could be sufficiently set apart to allow classification of toxic
and non-toxic colonies into distinct groups. Only one colony (#100, see ITSa
group 18 and ITSc group 18, denoted as 18a/18c) in which a toxin was
identified could not be differentiated from non-toxic colonies on the basis of
ITS DGGE. However, toxin identification in this colony (as well as that in
colonies #13, 26a/12c, and #112, 4a/15c and 15a/15c) was questionable, since it
was based on a MALDI TOF MS peak that could also correspond to another
cyanopeptide than Microcystin LR (Table 1). Hence, identification of toxic and
non-toxic Microcystis colonies could be achieved on the basis of ITSa plus ITSc
DGGE profiles.
To substantiate the DGGE-based classification of colonies, and to allow in-depth
analysis of the Microcystis classes that were identified, ITSc was
sequenced from colonies and bands representative for most of the DGGE
classes of Table 1. When possible (e.g. colony # 60 and #105 in classes 19a/12c
plus 26a/12c and 18a/17c plus 24a/17c respectively), sequencing of two ITSa
bands resolved ambiguous base calls resulting from a mixture of sequences
that were not separated on ITSc DGGE. Out of 59 ITS DGGE classes, we
obtained from 15 classes multiple sequences, from 29 classes one sequence and
from 14 classes no sequences. Attempts to obtain sequences from some bands
(e.g. from colony #78, class 18a/1c and 18a/2c) failed due to the occurrence of
many ambiguous base calls. Most (10) of the classes that were not sequenced
contained only one sequence, and for 5 non-sequenced classes there were no
toxicity data available.
The sizes of Microcystis ITS ranged between 354 and 362 bp and variation between strains was restricted to approximately 11% of the sequence positions. Different colonies within a DGGE ITS class yielded identical sequences in most cases (e.g. all colonies in class 16a/9c). Nevertheless, a one basepair substitution in the 5' region of the ITSdifferentiated sequence 12 from 15-1 in
class 8a/5c and a substitution in the 16S differentiated 10-u from the other
sequences in class 11a15c.
Microcystis rRNA ITS sequences were aligned and phylogenetic trees were constructed based on the alignment of ITSa or ITSc fragments. The ITSa tree revealed that sequence differences in the ITSa region were sufficient for discrimination of toxic and non-toxic colonies (data not shown). The only exception wastoxic colony # 100 which had an ITS sequence identical to that of
non-toxic colonies #87 and #89, which had been classified in the same ITS
DGGE class 18a/18c (see above and Table 1). Inclusion in the alignment of the
ITSa sequences of 47 Asian Microcystis strains of known toxin production (21),
resulted in two occurrences of identical sequences associated with toxic as well
as non-toxic Microcystis strains. Toxic colony #39 (27a/19c) had an ITSa
sequence identical to 5 non-toxic M. novacekii strains (TAC66, TAC65, TAC20,
CC2, BC18), and non-toxic colony ITSa sequences 148 (18a/7c) and 105-u
(18a/17c) were identical to two non-toxic M. ichtyoblabe strains (TAC136 and
TAC138) but also one toxic M, ichtyoblabe strain (TAC125).
The sizes of Microcystis ITS ranged between 354 and 362 bp and variation between strains was restricted to approximately 11% of the sequence positions. Different colonies within a DGGE ITS class yielded identical sequences in most cases (e.g. all colonies in class 16a/9c). Nevertheless, a one basepair substitution in the 5' region of the ITS
Microcystis rRNA ITS sequences were aligned and phylogenetic trees were constructed based on the alignment of ITSa or ITSc fragments. The ITSa tree revealed that sequence differences in the ITSa region were sufficient for discrimination of toxic and non-toxic colonies (data not shown). The only exception was
Sequences covering the entire rRNA-ITS were analyzed to resolve these
imperfections in the discrimination of toxic and non-toxic strains. The
phylogenetic tree based on ITSc alignment (Fig. 3) shows that sequences from
the different colony DGGE classes, as well as from different Asian strains, end
up in separate branches. All our 107 Microcystis colonies aside from colony
# 100, as well as the 47 Microcystis strains mentioned above, contained rRNA-ITS
sequences with sufficient variation for discrimination of toxin producers
and non-producers. Clustering of toxin producers and of non-producers was
observed, however, a few toxin producers ended up in clusters withnon-toxic
sequences (e.g. #39) and vice versa (e.g. AB015386). Although clustering of
Asian Microcystis cultures and European colonies was observed (e.g.
AB015362 etc. and BK146), these sequences were never identical.
To investigate to what extent the isolated colonies represented the
cyanobacterial community in their lakes of origin, we analyzed ITSa and ITSc
DGGE profiles from the water samples from which most colonies had been
harvested. These samples had been taken from the water column of Lakes 't
Joppe and Zeegerplas in June, August and September 2001, and from the
surface scum of 't Joppe at the latter two sampling dates. Ambient abiotic
parameters, microcystin concentrations, and cell and colony numbers are given
in Table 2.
Microbial communities from these lakes were collected on filters and ITSa and ITSc DGGE profiles were generated (Fig. 2). The number of different sequences that could be distinguished in ITS DGGE community profiles of water samples, was lower than the number that had been identified based on isolated colonies. In ITSa community profile from 't Joppe we detected 12 bands (4 of which less distinct) in the lower part of the gel where Microcystis sequences were expected, and 6 bands in the upper part of the gel, while isolated Microcystis colonies from this lake had been differentiated into 18 groups based on ITSa DGGE (Table 1). In ITSa community profiles from the Zeegerplas, 8 different Microcystis bands (2 less distinct) were discernable, while colony analysis had resulted in the identification of 9 groups. ITSc DGGE yielded for both lakes profiles with 8 bands (1 less distinct) in the lower part of the gels, while colonies isolated from 't Joppe and Zeegerplas had been differentiated in 15 and 7 groups, respectively (Table 1).
For identification of Microcystis strains, bands at different positions in the ITS profiles from water samples were excised, reamplified, and their position and purity were verified on DGGE. Sequences were retrieved from the bands indicated in Fig. 2 and Table 3. Compared to ITSa profiles, retrieval of pure bands for sequencing proved more difficult from ITSc profiles. Greater differences in melting behavior of the smaller ITSa fragments made distinction and isolation of bands easier (and also explains the higher number of discernable bands). ITSa sequences were also sufficiently discriminating for identification of colony toxicity (see above). Nevertheless, we also put an effort in the retrieval of bands from ITSc profiles, mainly to obtain full sequences from strains that become dominant in scums.
Microbial communities from these lakes were collected on filters and ITSa and ITSc DGGE profiles were generated (Fig. 2). The number of different sequences that could be distinguished in ITS DGGE community profiles of water samples, was lower than the number that had been identified based on isolated colonies. In ITSa community profile from 't Joppe we detected 12 bands (4 of which less distinct) in the lower part of the gel where Microcystis sequences were expected, and 6 bands in the upper part of the gel, while isolated Microcystis colonies from this lake had been differentiated into 18 groups based on ITSa DGGE (Table 1). In ITSa community profiles from the Zeegerplas, 8 different Microcystis bands (2 less distinct) were discernable, while colony analysis had resulted in the identification of 9 groups. ITSc DGGE yielded for both lakes profiles with 8 bands (1 less distinct) in the lower part of the gels, while colonies isolated from 't Joppe and Zeegerplas had been differentiated in 15 and 7 groups, respectively (Table 1).
For identification of Microcystis strains, bands at different positions in the ITS profiles from water samples were excised, reamplified, and their position and purity were verified on DGGE. Sequences were retrieved from the bands indicated in Fig. 2 and Table 3. Compared to ITSa profiles, retrieval of pure bands for sequencing proved more difficult from ITSc profiles. Greater differences in melting behavior of the smaller ITSa fragments made distinction and isolation of bands easier (and also explains the higher number of discernable bands). ITSa sequences were also sufficiently discriminating for identification of colony toxicity (see above). Nevertheless, we also put an effort in the retrieval of bands from ITSc profiles, mainly to obtain full sequences from strains that become dominant in scums.
A BLAST search revealed that bands e1, e18, e19, e20, and e27, excised from
the upper part of the gels were derived from Anabaena, Aphanizomenon and
Synechocystis, whereas all other bands contained Microcystis sequences.
Sequences from most of the bands excised from ITSa profiles matched with
sequences from isolated colonies. From the nine different Microcystis
sequences we retrieved, only one (derived from band e3) aligned with
sequences corresponding to toxic colonies, five aligned with non-toxic
sequences (derived from bands e4= e5= e9, e6= e11, e12= e15, e8 and e17), one
(derived from band e 10) with a sequences of unknown toxicity, and two
sequences (derived from bands e2= e7= e13= e16 and e14) did not correspond
to any isolated colony (Table 3). The most prominent bands that were
amplified contained sequences corresponding to non-toxic colonies (e4= e5= e9,
e6= e11 and e12= e15) or sequences of unknown toxicity (e10 and e7= e16).
From the six different sequences retrieved from ITSc profiles, one (derived
from band e28) corresponded to a toxic strain, two (derived from bands e21=
e22 and e25= e29) tonon-toxic strains, and three (e23, e24 and e26) yielded
new sequences not corresponding to any isolated colony (Table 3). The
sequences of two of the strains that became relatively dominant in scums were
detected in ITSa profiles (bands e7 and e10) as well as in ITSc profiles (bands
e24 and e26).
Our data show that physiological differences between Microcystis strains
(microcystin-producing versus non-producing) can be correlated with genetic
differences in the rRNA-ITS. Thus, ecological studies of toxic and non-toxic
Microcystis strains are possible using colonies isolated from natural samples,
cultured isolates, or field samples. Recently, the production of microcystin
variants, differing in toxicity to a large extent (E Chorus and Bartram ref, ?),
has been found to have a genetic basis (15). Therefore, even information on the
relative toxicity of strains could be provided in the rRNA-ITS sequences since a
correlation with rRNA-ITS sequences exists.
Genotype analysis using DGGE enables processing of many samples,
assessment of the purity of isolated cultures or colonies, and detection of
various genotypes in complex natural communities. Differentiation of colonies
was achieved by means of ITSa and ITSc DGGE. Although a somewhat better
separation of bands could be achieved by ITSa DGGE (Fig. 2), ITSc DGGE
yielded supplementary resolution and contaminant detection in several cases,
and provided more sequence information (9)(Table 1). DGGE based on ITSa or
ITSc alone yielded insufficient resolution for discrimination of toxic and non-toxic
Microcystis strains. In combination, however, these methods provided a
suitable basis for identification of toxic strains (Table 1).
The partial rRNA-ITS sequences covered by ITSa amplicons discriminated
toxic and non-toxic colonies in our dataset. Therefore, sequences from ITSa
DGGE profiles were suitable for identification of toxic colonies. When
information contained in ITSa is not sufficient then sequences covering the
entire ITS (ITSc) confirmed the colony classification and identification of toxic
groups based on ITSa and ITSc DGGE (sequences differed between classes and
were mostly identical within a class). The occurrence of a few colonies within a
class with slight (one basepair) sequence differences could be explained by the
position of this basepair in the 3' region, which forms the high melting domain.
In this region, base substitutions do not result in altered migration on DGGE.
When positioned in the lower melting domain, one basepair differences could
be detected clearly as evidenced by the upper and lower bands from e.g. colony
#41.
Kurmayer et al. (13) analyzed subsamples of isolated colonies and reported
contradictory mcyB gene detection in 5 out of 27 colonies. They explained this
by either colony contamination by single cells, or by PCR inconsistencies. Our
approach was not prone to PCR inconsistencies since identification of toxic
strains was based on sequence information enclosed in a universal gene,
instead of the detection of a specific gene using a diagnostic PCR. The
information contained in the sequence was analyzed only after amplification.
In contrast, in a diagnostic PCR, the amplification itself is a crucial step which
is sensitive to variations in initial DNA concentration and quality and PCR
conditions (notably the number of temperature cycles).
We detected more than one Microcystis sequences in 28% of the colonies we
analyzed. Since the intensities of multiple bands in most profiles were similar,
we considered it unlikely that additional bands originated from a few
contaminating cells. It is unlikely that the ratio of target sequences altered
significantly during PCR amplification, since all analyzed Microcystis
sequences were very similar and primer sites were identical. Indeed, the ratio
between initial cell numbers has been found to correlate well with DGGE band
intensities after co-amplification of two Microcystis strains (data not shown).
The occurrence of minor secondary bands in some profiles indicated that there
was no overriding bias towards 1:1 mixtures of homologous PCR products as
may be encountered in PCR amplification (24).
The multiple sequences in a portion of the colonies may be explained by
contamination from aggregated colonies which were not separated despite
thorough washings during isolation, or by the occurrence of multiple different
rRNA operons in a portion of Microcystis strains. This can be resolved by
further replating and cloning of the respective strains. The occurrence of
different operons in a portion of the Microcystis strains would imply
considerable intragenus variability. The most parsimonious explanation would
be the presence in the genus Microcystis of at least two rRNA operons,
identical in sequence in most strains and with mutations in one operon in a
portion of the strains. The equal band intensities that were encountered in
most colonies with multiple sequences are in agreement with the presence of
two different operons in one strain. On the other hand, it could also imply that
the different strains that comprised colonies were present in similar
quantities. The alternative explanations for multiple colony bands may be true
for different colonies. Some colonies may have consisted of aggregated strains
as was supported by the presence of even three different sequences in colony
#119, the presence of additional sequences of low intensity (e.g. Fig. 1, colony
#70) and the occurrence of sequences as sole sequence in one colony and as one
of two sequences in another colony (e.g. 146 and 147-u). Conversely, for some
colonies the difference between bands could be well explained by a single
basepair substitution (e.g. colonies #41, #47, #99, #139) or insertion/deletion at
one location (#17) in one operon (of two present).
The detection of multiple sequences in a considerable portion of the carefully
isolated and washed colonies, highlights that RFLP patterns or sequences
obtained from such colonies (13) need to be interpreted with caution. A few
isolated colonies (e.g. #78) probably contained a mixture of sequences even if
they generated one band on ITSa and ITSc DGGE as judged from the many
ambiguous base calls obtained from sequencing. Toxin data from these colonies
can be assigned to sequences when the excised fragments are cloned.
Unequivocal correlation of toxin production to one particular sequence was
also not possible for the toxic colonies containing multiple sequences that could
be separated by DGGE. Two sequences derived from a non-toxic colony will
correspond to one or two non-toxic Microcystis strains, however, one of the
sequences in a toxic colony could be derived from a non-toxic contaminant.
There are two possible solutions to this problem of multiple bands in a toxic
colony. The first solution would be to cultivate the cells from the colony of
interest. Sequences and toxic properties of individual pure cultures obtained
from these colonies will enable assigning toxic properties to the sequences of
interest. A second solution would be based on expanding the available
database of sequences assigned to toxic and non toxic strains to infer
properties of the colonies of interest. The variation in Microcystis ITS between
strains was restricted to approximately 11% of the sequence positions. The
conserved regions contained elements necessary for coordinated transcription
and processing of rRNA genes (8). Regions D1, D1', D2, D4, and D5 are
required for correct folding of the rRNA transcript, indispensable for the prematuration
of the 16S and 23S rRNA molecules by RNase III. Premature
termination of transription of the rRNA operon is prevented by antiterminator
sites. Antiterminator Box A sequences are reasonably well conserved within
bacteria and are immediately preceded by a Box B stem of more variable
sequence. Microcystis rRNA-ITS also contains one highly conserved tRNAile
gene.
We did not find a relation between genotypes and origin of the isolated
Microcystis colonies (Table 1). Although identical sequences were mostly
shared between strains from the same lake, this could be explained by the
small number of colonies representing most sequences. Sequences represented
by multiple colonies originated from different locations (e.g. class 5a/11c).
Elucidation of the occurrence of local strains would require a more
comprehensive sampling of colonies in combination with analysis of DGGE
profiles from different locations. DGGE analysis needs to be combined with
sequencing as evidenced by e.g. excised bands e23, e25 and e29 which
contained different sequences despite an apparently identical DGGE position.
There was also no relation between genotypic classification based on rRNA-ITS
and morphospecies assignation. Every DGGE group with a considerable
number of colonies contained representatives of different morphospecies (Table
1). This is in agreement with the difficulties inherent to morphological
identification (see introduction), and the finding that different Microcystis
morphotypes contain toxic and non-toxic strains (21, 29).
Microcystin concentration in water samples were well below the 10mg/L
guideline for safe recreational waters (3) but exceeded this concentration
considerably in scums. Although care is needed in quantitative interpretations
of band intensities. The methods of the present invention are suitable for
identification of the most abundant organisms in field populations. Initial cell
numbers of Microcystis strains are likely to correlate well with DGGE band
intensities since the efficiencies of DNA isolation and amplification are
comparable (see also above). A non-toxic strain (bands e4, e5, e9, e21 and e22)
was abundant in all samples from 't Joppe, and a strain of unknown toxicity
(bands e2, e7, e13, e16 and e24) was present in June and August but had
disappeared in September (Fig. 2 and Table 3).
Bands derived from toxic strains were detected only in the samples from June
(bands e3 and e28) and not in the samples from August and September when
Microcystis reached the highest densities (Table 2). In contrast, many non-toxic
strains were identified in the profiles from August and September (e6, e8,
e11, e12, e15, e17, e22, e25 and e29). In addition, most of the toxic colonies
that had been isolated from these lakes (90%: 29 out of 32) originated from the
June samples, and most of the non-toxic colonies (60%: 9 out of 13) from the
August and September samples. Together, these data suggest that while in the
beginning of a bloom toxic colonies dominated, they were outcompeted when
the bloom progressed. This is in agreement with the negative correlation
between microcystin content per cell and Microcystis abundance during a
bloom that was found by Welker et al. (30). Some strains accumulated in
scums as evidenced by the dominance of their bands in DGGE profiles of scum
samples compared to water column samples from the same date (Fig 2). Their
sequences corresponded to non-toxic strains (bands e12 and e25) or strains of
unknown toxicity (bands e7, e10, e24 and e26). These data suggest that non-toxic
strains accumulate in scums, perhaps because these strains have a
greater capability for gas vesicle formation, or because toxic colonies sink out
from the scums before non-toxic colonies.
Surprisingly, two dominant bands from the Zeegerplas profiles appeared to
correspond to non-toxic colonies (bands e15= e29 and e17), while most isolated
Zeegerplas colonies were found to contain microcystins. Two other dominant
sequences (bands e13=e16 and e14) corresponded to colonies of unknown
toxicity. Either during colony isolation or processing of the colonies, some bias
must have occurred to explain this discrepancy. Also, the apparent abundance
in many samples of (identical) bands e2, e7, e13 and e16 should have resulted
in the isolation of the corresponding colonies. Possibly, this Microcystis strain
forms small colonies as the isolation procedure was selective against small
colonies (29). Alternatively, the dominant bands in community profiles could
correspond to non-colony forming Microcystis strains that are missed by the
colony isolation procedure yet are detected in community profiles generated
from filtered water samples. A more intensive sampling and colony isolation
study can be used to elucidate the sequence identity of all bands in the
community profiles and thereby substantiate insights in the dynamics of
Microcystis colonies.
Reversed Line Blot showing hybridization of the probes designed for specific
detection of groups of toxic and non-toxic Microcystis strains.
Increasing concentrations (0.66, 2, 6.6, 20 mM from left to right) of probes P1a354(52), Plall, P2all and P1514 were bound to the membrane in parallel vertical lanes. The rRNA-ITS from a number of colonies of known toxin production was PCR amplified, hybridized to these probes in horizontal lanes, and washed. Colonies are indicated with their identification number (BK#), followed by a symbol indicating whether they are known to produce toxins (T= toxic, NT = non-toxic) and a group number. Group numbers had been assigned to colonies based on the clustering of their rRNA-ITS sequences.
Probe P1514 was designed as general probe to hybridize with all Microcystis strains and thus serve as positive hybridization control. All sequences tested hybridized with this probe. Probe Pla354 (52) was designed to hybridize with strain 1A only (which includes only toxic isolates). Only group 1A sequences hybridized with this probe, no cross-reactivity was observed. Probe P1all was designed to hybridize with all strains from cluster 1 (which includes toxic strains 1A and 1B and non-toxic strains 1C and 1D). 1A, 1B and 1C sequences hybridized with this probe, however, one sequence from strain7 (BK10-o) also did, which call for further optimization of reaction conditions. Probe P2all was designed to hybridize with all strains from cluster 2 (which includes toxic strains 2A and 2B). Only strain 2A and 2B sequences hybridized with this probe and no cross-reactivity was observed.
Increasing concentrations (0.66, 2, 6.6, 20 mM from left to right) of probes P1a354(52), Plall, P2all and P1514 were bound to the membrane in parallel vertical lanes. The rRNA-ITS from a number of colonies of known toxin production was PCR amplified, hybridized to these probes in horizontal lanes, and washed. Colonies are indicated with their identification number (BK#), followed by a symbol indicating whether they are known to produce toxins (T= toxic, NT = non-toxic) and a group number. Group numbers had been assigned to colonies based on the clustering of their rRNA-ITS sequences.
Probe P1514 was designed as general probe to hybridize with all Microcystis strains and thus serve as positive hybridization control. All sequences tested hybridized with this probe. Probe Pla354 (52) was designed to hybridize with strain 1A only (which includes only toxic isolates). Only group 1A sequences hybridized with this probe, no cross-reactivity was observed. Probe P1all was designed to hybridize with all strains from cluster 1 (which includes toxic strains 1A and 1B and non-toxic strains 1C and 1D). 1A, 1B and 1C sequences hybridized with this probe, however, one sequence from strain7 (BK10-o) also did, which call for further optimization of reaction conditions. Probe P2all was designed to hybridize with all strains from cluster 2 (which includes toxic strains 2A and 2B). Only strain 2A and 2B sequences hybridized with this probe and no cross-reactivity was observed.
Probes were designed on the basis of rRNA ITS sequences from 129 different
cyanobacterial isolates (EMBL database accession numbers AB015357 to
AB015403 {Otsuka et al, 1999} and AJ605140 to AJ605221. The sequences
were aligned using the software ARB to the alignment/database, release june
2002, provided by W. Ludwig of the ARB bioinformatics group
(http://www2.mikro.biologie.tu-muenchen.de/arb/). Using the program Treecon
(van de Peer et al) a distance tree was calculated using a neighbor joining
algorithm. Among the 129 ITS sequences we identified 13 clusters of
sequences. Within each cluster, the cluster members (sequences) were
relatively similar in comparison to sequences outside of the cluster. Cluster 1
was subdivided into 4 strains (strain 1a,1b,1c and 1d), cluster2 was subdivided
into 2 strains (strain 2a and 2b) and cluster 5 was subdivided into 6 strains
(strain 5a, 5b, 5c, 5d, 5e and 5f). All other clusters (3,4,6 to 13) were designated
strains for the purpose of the present invention. For each strain, sequences
belonging to this strain had very high similarity or were identical. For each
strain and each cluster, multiple probes were designed, 20 nucleotides in
length, using the tool 'probe design' in the package ARB. Using the tool 'probe
match' a first evaluation of the probes was made in which we selected probes
that had perfect match (full complementarity) to all sequences in of the strain
or cluster and 2 or more nucleotide mismatches to any sequence outside of the
strain or cluster. If such a probe could not be designed for a particular strain or
cluster, we selected a probe that had a single mismatch to all sequences
outside of the strain or cluster. In addition probes were found that were
specific for a combination of strains such for strains 8 and 9, for strains 2b, 5a
and 6, for strains 2b 5d 5e and 6, for strains 10, 11, 12, 13 (Table 3B of
Example 3)
The output of probe match, which is a list of matching sequences to the investigated probe, also contains flanking sequences. If possible, we extended each probe with 1 to 8 flanking nucleotides (adjacent to the probe sequence at 3' and 5' side) that were shared by all sequences that had perfect match to the 20 nucleotide investigated probe.
These extended probe sequences were subjected to a second round of probe design using the software Array Designer (Premier Biosoft International, Palo Alto, CA, USA) in order to generate probes of similar theoretical melting temperatures (Tm). The package selects a contiguous stretch of nucleotides from each input sequence (the extended probe sequences) to best approach a chosen target Tm as calculated using nearest neighbor thermodynamic theory with SantaLucia thermodynamics values and to best agree to a number of additional probe settings. These additional probe design settings were as follows: The maximum acceptable free energy of hairpin formation was set at 6.0 -kcal/mol; the maximum acceptable free energy for self dimer formation was set at 12.0 -kcal/mol and the maximum acceptable run repeat length of nucleotides and dinucleotides was set at 8. If length of the input sequence and settings allowed, for each extended probe sequence, three probes were designed: one with theoretical Tm of 52°C (± 1°C), one with theoretical Tm of 50°C (± 1°C), and one with theoretical Tm of 48°C (± 1°C). The selected probes (Table 3A and B of Example 3) had lengths of 17 to 28 nucleotides.
For each probe that had a single mismatch to the closest sequence outside of the target strain or cluster, we also designed a counterpart probe that contained the mismatching nucleotide that was shared by the majority of the closest sequence outside of this strain or cluster. The remaining nucleotides of this 1-mismatch counterpart probe were identical to the perfectly matching probe, but, if necessary one or two, perfectly matching, extra nucleotides were added at the 3' side and/or 5'side. This addition was deemed necessary if the mismatch was an A or T to replace a G or C. In this manner the counterpart mismatch probe could be designed such that the theoretical melting temperature was identical to or slightly higher than that of the theoretical melting temperature of the perfectly matching probe.
The output of probe match, which is a list of matching sequences to the investigated probe, also contains flanking sequences. If possible, we extended each probe with 1 to 8 flanking nucleotides (adjacent to the probe sequence at 3' and 5' side) that were shared by all sequences that had perfect match to the 20 nucleotide investigated probe.
These extended probe sequences were subjected to a second round of probe design using the software Array Designer (Premier Biosoft International, Palo Alto, CA, USA) in order to generate probes of similar theoretical melting temperatures (Tm). The package selects a contiguous stretch of nucleotides from each input sequence (the extended probe sequences) to best approach a chosen target Tm as calculated using nearest neighbor thermodynamic theory with SantaLucia thermodynamics values and to best agree to a number of additional probe settings. These additional probe design settings were as follows: The maximum acceptable free energy of hairpin formation was set at 6.0 -kcal/mol; the maximum acceptable free energy for self dimer formation was set at 12.0 -kcal/mol and the maximum acceptable run repeat length of nucleotides and dinucleotides was set at 8. If length of the input sequence and settings allowed, for each extended probe sequence, three probes were designed: one with theoretical Tm of 52°C (± 1°C), one with theoretical Tm of 50°C (± 1°C), and one with theoretical Tm of 48°C (± 1°C). The selected probes (Table 3A and B of Example 3) had lengths of 17 to 28 nucleotides.
For each probe that had a single mismatch to the closest sequence outside of the target strain or cluster, we also designed a counterpart probe that contained the mismatching nucleotide that was shared by the majority of the closest sequence outside of this strain or cluster. The remaining nucleotides of this 1-mismatch counterpart probe were identical to the perfectly matching probe, but, if necessary one or two, perfectly matching, extra nucleotides were added at the 3' side and/or 5'side. This addition was deemed necessary if the mismatch was an A or T to replace a G or C. In this manner the counterpart mismatch probe could be designed such that the theoretical melting temperature was identical to or slightly higher than that of the theoretical melting temperature of the perfectly matching probe.
In reverse blot hybridization, probes are covalently bound to a membrane and
the target DNA is applied in solution {Dattagupta, 1989; Saiki, 1989}. Reverse
line blot hybridization is a modification introduced by Kaufhold et al
{Kaufhold,1994} in which the probes are applied as lines instead of dots.
Hybridization with labeled target DNA in lines perpendicular to the probe
lines enables simultaneous testing of several samples to several probes. A
detailed protocol is available at http://www.nioo.knaw.nl/cl/me/.
Membrane preparation. For covalent linkage of probes, a Biodyne C membrane
(Pall Europe Ltd, Portsmouth, UK) is activated by incubation for 10 min in a
rolling bottle at room temperature in 16% 1-ethyl-3-(3-dimethylaminopropyl)carbodiimide
(Sigma-Aldrich, St. Louis, MO), rinsed with
tapwater, and placed on a PC200 support cushion (Immunetics, Cambridge,
MA) in a Miniblotter 45 manifold (Immunetics), with screws handtight. Slots
are filled with 150 µl of 0.66, 2, 6.6, 20 µM probe solution (probes in Table 3
Example 3) in 500 mM NaHCO3 (pH 8.4). Probes are allowed to bind at room
temperature for 5 minutes, after which the probe solution is aspirated from the
slots. The blot is then removed from the manifold using forceps and incubated
for 8 minutes at room temperature in 100 mM NaOH in a rolling bottle to
inactivate the membrane. Then, the membrane is shaken gently, in 200 ml 2 x
SSPE/0.1% sodium dodecyl sulphate (SDS) at 60°C for 5 min (SSPE = 18 mM
NaCl, 1 mM NaH2PO4, 0.1 mM NaEDTA, pH 7.4). For storage, the prepared
membrane is washed in 200 ml 20 mM NaEDTA pH 8 at room temperature for
15 min, sealed in seal foil (Audion Electro, Weesp, Netherlands) to avoid
dehydration and kept at 4°C until use.
Hybridization. After incubation in 2 x SSPE/0.1% SDS at room temperature for
5 min, the probe-carrying membrane is placed on the support cushion in the
manifold, rotated 90° from the orientation of probe application. Each PCR
products is denatured in 150 µl 2 x SSPE/0.1% SDS in a 0.5 ml microcentrifuge
tube at 99°C for 10 min and immediately thereafter chilled on ice. Then, all
PCR products are applied to the slots and slots without PCR product are filled
with 2 x SSPE/0.1% SDS. Hybridization is performed in the manifold at 42°C
for 60 min on a horizontal surface without agitation. After the hybridization,
the membrane is washed by two subsequent incubations in a rolling bottle
(with mesh) in 200 ml 2 x SSPE/0.5% SDS at 52°C for 10 min (stringent wash).
Detection. In the next step, the washed membrane is incubated in 10 ml of a
1:4000 dilution of peroxidase labeled streptavidin conjugate (Roche,
Mannheim, Germany) in 2 x SSPE/0.5% SDS, in a rolling bottle at 42°C, for 45
min. The membrane is then washed twice in 200 ml 2 x SSPE/0.5% SDS at
42°C for 10 min and rinsed twice in 200 ml 2x SSPE at room temperature for 5
min. After incubation in 10 ml BM Chemiluminescence Blotting Substrate
(POD) (Roche) for 1 min the membrane is covered with an overhead sheet and
X-ray film for detection of chemiluminescence. The film is exposed 30 minutes
for PCR products from control templates (16S rRNA gene clones) or overnight
for natural samples. Signal strengths (pixel volumes) are recorded from the X-ray
film using a CCD camera and analyzed using the software package
Phoretics 1D Advanced (Non-linear Dynamics, UK).
On the basis of an optimized alignment and phylogenetic analysis of ITS
sequences from 129 strains, we designed 94 probes specific for particular
strains of Microcystis or clusters of strains thereof (Table 3A and B of Example
3 and Fig. 1 of Example 3). For this we followed the design strategy as outlined
in the materials and methods section. When possible for each strain and
cluster and each target site (in which the target site is the small region of 12 to
30 nucleotides that shows differences between clusters or strains), 3 probes
were designed, differering from each other by only a few nucleotides. These
three probes were designed to have theoretical melting temperatures of
approximately 48, 50 and 52 °C. Each of these variant probes has different
melting characteristics when tested in actual hybridization, thus allowing
selection of the optimal probe for particular assays. The optimal probe pairs
high sensitivity with high selectivity.
13 probes were selected that were highly specific, meaning that they have perfect match for sequences of the target strain or cluster and two or more mismatches to strains that are not part of the target strain or cluster. For probe P2all252-48 longer versions of the probe, with higher theoretical melting temperatures could not be designed because of the variation of the flanking nucleotides withincluster 2.
33 probes were selected that had perfect match to most sequences from the target strain or cluster and one or more mismatches to sequences that are not part of the target strain or cluster. For each of these probes we designed a counterpart probe of similar theoretical melting temperature that has the same target site as the specific probe but differs at the nucleotide that most commonly mismatched to the ITS sequences with a single mismatch. Testing of a sample against both the perfect matching and the mismatching counterpart probe will increase the certainty of classification of the test cyanobacterium.
13 probes were selected that were highly specific, meaning that they have perfect match for sequences of the target strain or cluster and two or more mismatches to strains that are not part of the target strain or cluster. For probe P2all252-48 longer versions of the probe, with higher theoretical melting temperatures could not be designed because of the variation of the flanking nucleotides within
33 probes were selected that had perfect match to most sequences from the target strain or cluster and one or more mismatches to sequences that are not part of the target strain or cluster. For each of these probes we designed a counterpart probe of similar theoretical melting temperature that has the same target site as the specific probe but differs at the nucleotide that most commonly mismatched to the ITS sequences with a single mismatch. Testing of a sample against both the perfect matching and the mismatching counterpart probe will increase the certainty of classification of the test cyanobacterium.
The designed probes were tested in Reversed Line Blot hybridization. Fig. 2 of
example 3 shows an example of a hybridization result.
We used DNA originating from isolated Microcystis colonies as test DNA. The isolated colonies used for this example were K63-b, K15-o, K60, K12, K65. K13, K21, K75-b, K69, K75-o, K10-o, K51, K72, K123, K10-b, K104, K139-o, K47-o, K74, K57, K34, K58, K16, K49. These colonies were obtained from lake water samples through microscope assisted micromanipulation as described in example 2. After DNA isolation from these colonies and specific amplification of the ITSc region as described in Example 2, the amplified DNA was subjected to DGGE and bands were excised from the gel, as described in Example 2. The test DNA was obtained through amplification using the ITSc primers of the DNA extracted from these excised bands as described in Example 2. This amplified known test DNA was then subjected to hybridization in Reverse Line Blot.
Probe P1514 -52 was designed as general probe to hybridize with all Microcystis strains and thus serves as positive hybridization control. All sequences tested hybridized with this probe. Probe P1a251 -52 was designed to hybridize with group 1A only (which includes only toxic strains). Only group 1A sequences hybridized with this probe, no cross-reactivity was observed (Figure 2 of Example 3). Probe P1all36 -52 was designed to hybridize with all strains from cluster 1 (which includes toxic strains 1A and 1B and non-toxic strains 1C and 1D). 1A, 1B and 1C sequences hybridized with this probe, however, one sequence from strain 6 (K10-o) also did (Figure 2 of Example3). Probe P2all252 -52 was designed to hybridize with all strains from cluster 2 (which includes toxic strains 2A and 2B). Only strain 2A and 2B sequences hybridized with this probe and no cross-reactivity was observed (Figure 2 of Example3).
We used DNA originating from isolated Microcystis colonies as test DNA. The isolated colonies used for this example were K63-b, K15-o, K60, K12, K65. K13, K21, K75-b, K69, K75-o, K10-o, K51, K72, K123, K10-b, K104, K139-o, K47-o, K74, K57, K34, K58, K16, K49. These colonies were obtained from lake water samples through microscope assisted micromanipulation as described in example 2. After DNA isolation from these colonies and specific amplification of the ITSc region as described in Example 2, the amplified DNA was subjected to DGGE and bands were excised from the gel, as described in Example 2. The test DNA was obtained through amplification using the ITSc primers of the DNA extracted from these excised bands as described in Example 2. This amplified known test DNA was then subjected to hybridization in Reverse Line Blot.
Probe P1514 -52 was designed as general probe to hybridize with all Microcystis strains and thus serves as positive hybridization control. All sequences tested hybridized with this probe. Probe P1a251 -52 was designed to hybridize with group 1A only (which includes only toxic strains). Only group 1A sequences hybridized with this probe, no cross-reactivity was observed (Figure 2 of Example 3). Probe P1all36 -52 was designed to hybridize with all strains from cluster 1 (which includes toxic strains 1A and 1B and non-toxic strains 1C and 1D). 1A, 1B and 1C sequences hybridized with this probe, however, one sequence from strain 6 (K10-o) also did (Figure 2 of Example3). Probe P2all252 -52 was designed to hybridize with all strains from cluster 2 (which includes toxic strains 2A and 2B). Only strain 2A and 2B sequences hybridized with this probe and no cross-reactivity was observed (Figure 2 of Example3).
| EXAMPLE 1 Cultures of cyanobacteria used in this study | |||
| Code | Identity | Origin | Reference |
| K29, K50 | Microcystis sp. | Kinselmeer, The Netherlands | This study |
| S2 | Microcystis sp. | Sneekermeer, The Netherlands | This study |
| V28, V40, V67, V72, V73, V80, V88, V89, V91 | Microcystis sp. | Volkerak, The Netherlands | This study |
| Z6, Z11 | Microcystis sp. | Zeegerplas, The Netherlands | This study |
| CYA 43 | Microcystis aeruginosa Kütz | | NIVA |
| CYA | |||
| 140 | Microcystis aeruginosa Kütz | Bendig's Pond, Bruno, Canada | NIVA |
| CYA 228 | Microcystis aeruginosa Kütz | Lake Akersvatnet, Vestfold, Norway | NIVA |
| PCC 7806 | Microcystis aeruginosa | Braakman Reservoir, The Netherlands | PCC |
| PCC 7820 | Microcystis aeruginosa | Loch Balgavies, Scotland | PCC |
| SAG17.85 | Microcystis aeruginosa Kütz | Lake Neusiedler, Austria | SAG |
| PCC 6803 | Synechocystis sp. | Freshwater, California, USA | PCC |
| PCC 7942 | Synechococcus sp. | Freshwater, California, USA | PCC |
| PCC 73110 | Leptolyngbya sp. | PCC | |
| CYA 99 | Lyngbya sp. | River Suldalslågen | NIVA |
| Microcoleus sp. | Microbial mat from hypersaline Lake Chirana, Spain | (16) | |
| CYA 146 | Pseudanabaena catenata Lauterb. | Canada | NIVA |
| CYA 24 | Planktothrix prolifica | Lake Levrasjön, Skäne, Sweden | NIVA |
| CYA 126 | Planktothrix aghardii | Lake Långajön, Finland | NIVA |
| ATCC 29413 | Anabaena variablis | ATCC | |
| CYA 135 | Anaboenopisis arnoldii Aptek. | Ferguson Gulf, Lake Turkana, Kenya | NIVA |
| CYA 103 | Aphanizomenon flos-aquae f. gracile | Pond at Vingrom, Lillehammer, Norway | NIVA |
| (Lemm.) | |||
| 1401/7 CCAP | Aphanizomenon flos-aquae | Freshwater, Brantry Lough, N. Ireland | CCAP |
| CYA 225 | Cylindrospermapsis raciborskii | Lake Balaton, Hungary | NIVA |
| CYA 124 | Nostoc sp. | Lake Steinsfjorden, Buskerud, | NIVA |
| KAC | |||
| 13 | Nodularia spumigena | Baltic Sea | KAC |
| BV16R | Gloeotrichia sp. | Lake Broekvelden, The Netherlands | This study |
| IMS 101 | Trichodesmium erythraeum | North Carolina coast | KAC |
| PCC 9006 | Prochlorothrix hollandica | Lake Loosdrecht, The Netherlands | PCC |
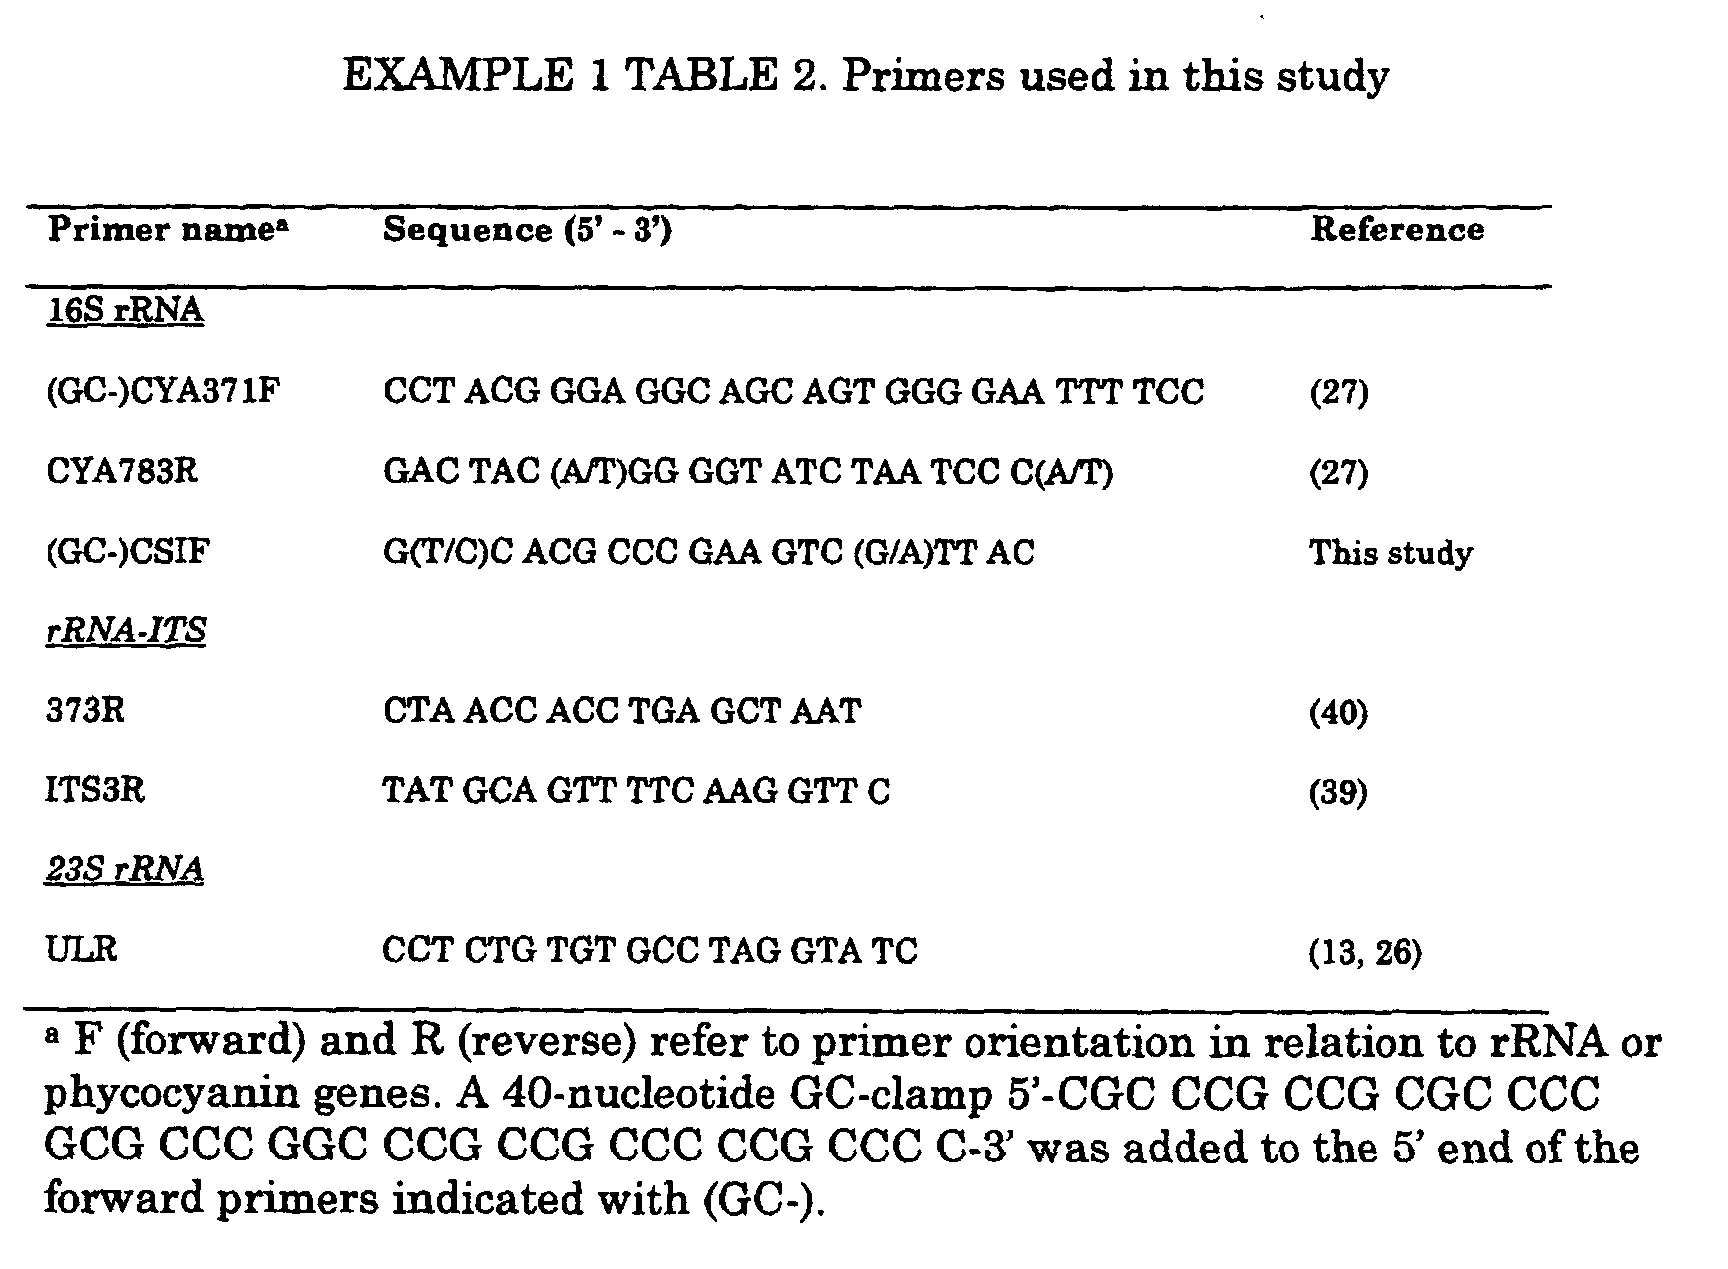
| EXAMPLE 1 Number and approximate sizes of the PCR products of strains from various cyanobacterial genera amplified with the primers described in this study | |||
| Strain | ITSaa | ITSba | ITSc |
| Microcystis | 300 | 500 | 550 |
| aeruginosa | |||
| Synechocystis sp. | 325 | 675 | |
| Synechococcus | 325 | 650 | 750 |
| Leptolyngbya | 275 | 500 | |
| Lyngbya sp. | 300 | 675 | |
| Microcoleus sp. | 300 | n.d. | 675 |
| Pseudanabaena catenata | 300 | 675 | 750 |
| Planktothrix prolifica | 300 | 550 | 525, 700 |
| Planktothrix aghardi | 300 | 550 | 525, 700 |
| Anabaena variabilis | 300 | 375, 600 | 500, 700 |
| Anabaenopsis arnoldii. | 300 | 350, 650 | 450, 725 |
| Aphanizomenon flos-aquae | 300 | 400, 625 | 475, 700 |
| Aphanizomenon flos-aquae f. gracile | 300 | 400, 625 | 475, 700 |
| Cylindrospermopsis raciborskii | 300 | 350, 525 | 425, 600 |
| Nostoc sp. | 300 | 375, 650 | 500, 775 |
| Nodularia spumigena | 300 | 400, 700 | 575, 875 |
| Gloeotrichia sp. | 275 | 375, 675 | 475, 775 |
| Trichodesmium erythraeum | 300 | 550 | 675 |
| Prochlorothrix hollandica | 350 | 800 | 1050 |

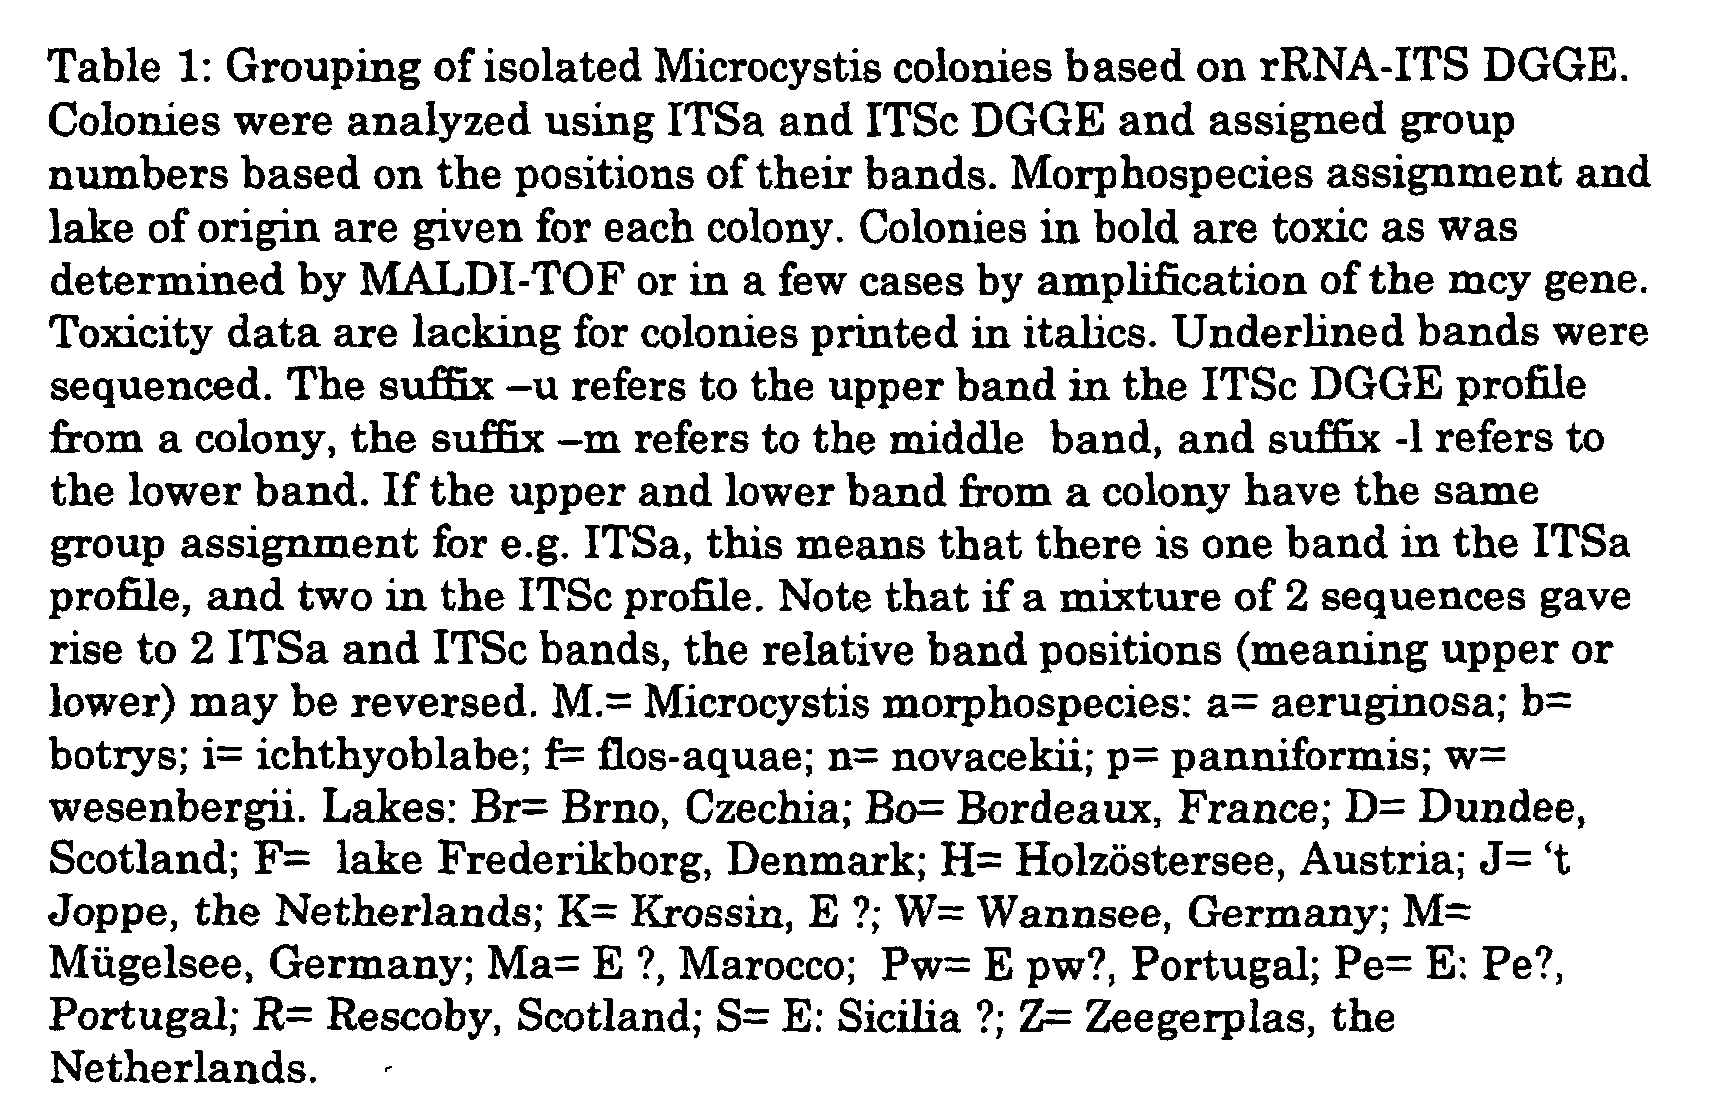
| EXAMPLE 2 Cell counts and ambient environmental parameters during sampling for Microcystis colonies | |||||||
| sampling | cell counts | toxins | |||||
| lake | date | source | Microcystis | Anabaena | Aphanizo menon | Microcystin in water column (µg/L) | Microcystin per cell (pg/cell) |
| 't Jopp e | 27.06 | water column | 8,1 × 10³ | 2,4 × 10⁴ | 4,5 × 10² | 0.22 (0.18) | 27 |
| 't Jopp e | 29.08 | water column | 5,5 × 10⁴ | 5,3 × 10² | 0 | 2.64 (0.03) | 48 |
| 't Jopp e | 29.08 | scum | 5,6 × 10⁶ | n.d. | n.d. | 420 (22.9) | 75 |
| 't Jopp e | 28.09 | |
7,8 × 10⁴ | 1,4 × 10³ | 88 | 0 | 0 |
| 't Jopp e | 28.09 | |
6,1 × 10⁷ | n.d. | n.d. | 3308 (244) | 55 |
| Zeeg erpla a | 20.06 | |
5,4 × 10⁴ | 1,8 × 10⁵ | 0 | 0 | 0 |
| Zeeg erpla s | 20.08 | |
2,8 × 10⁵ | 1,0 × 10⁵ | 0 | 0.60 (0.09) | 2 |


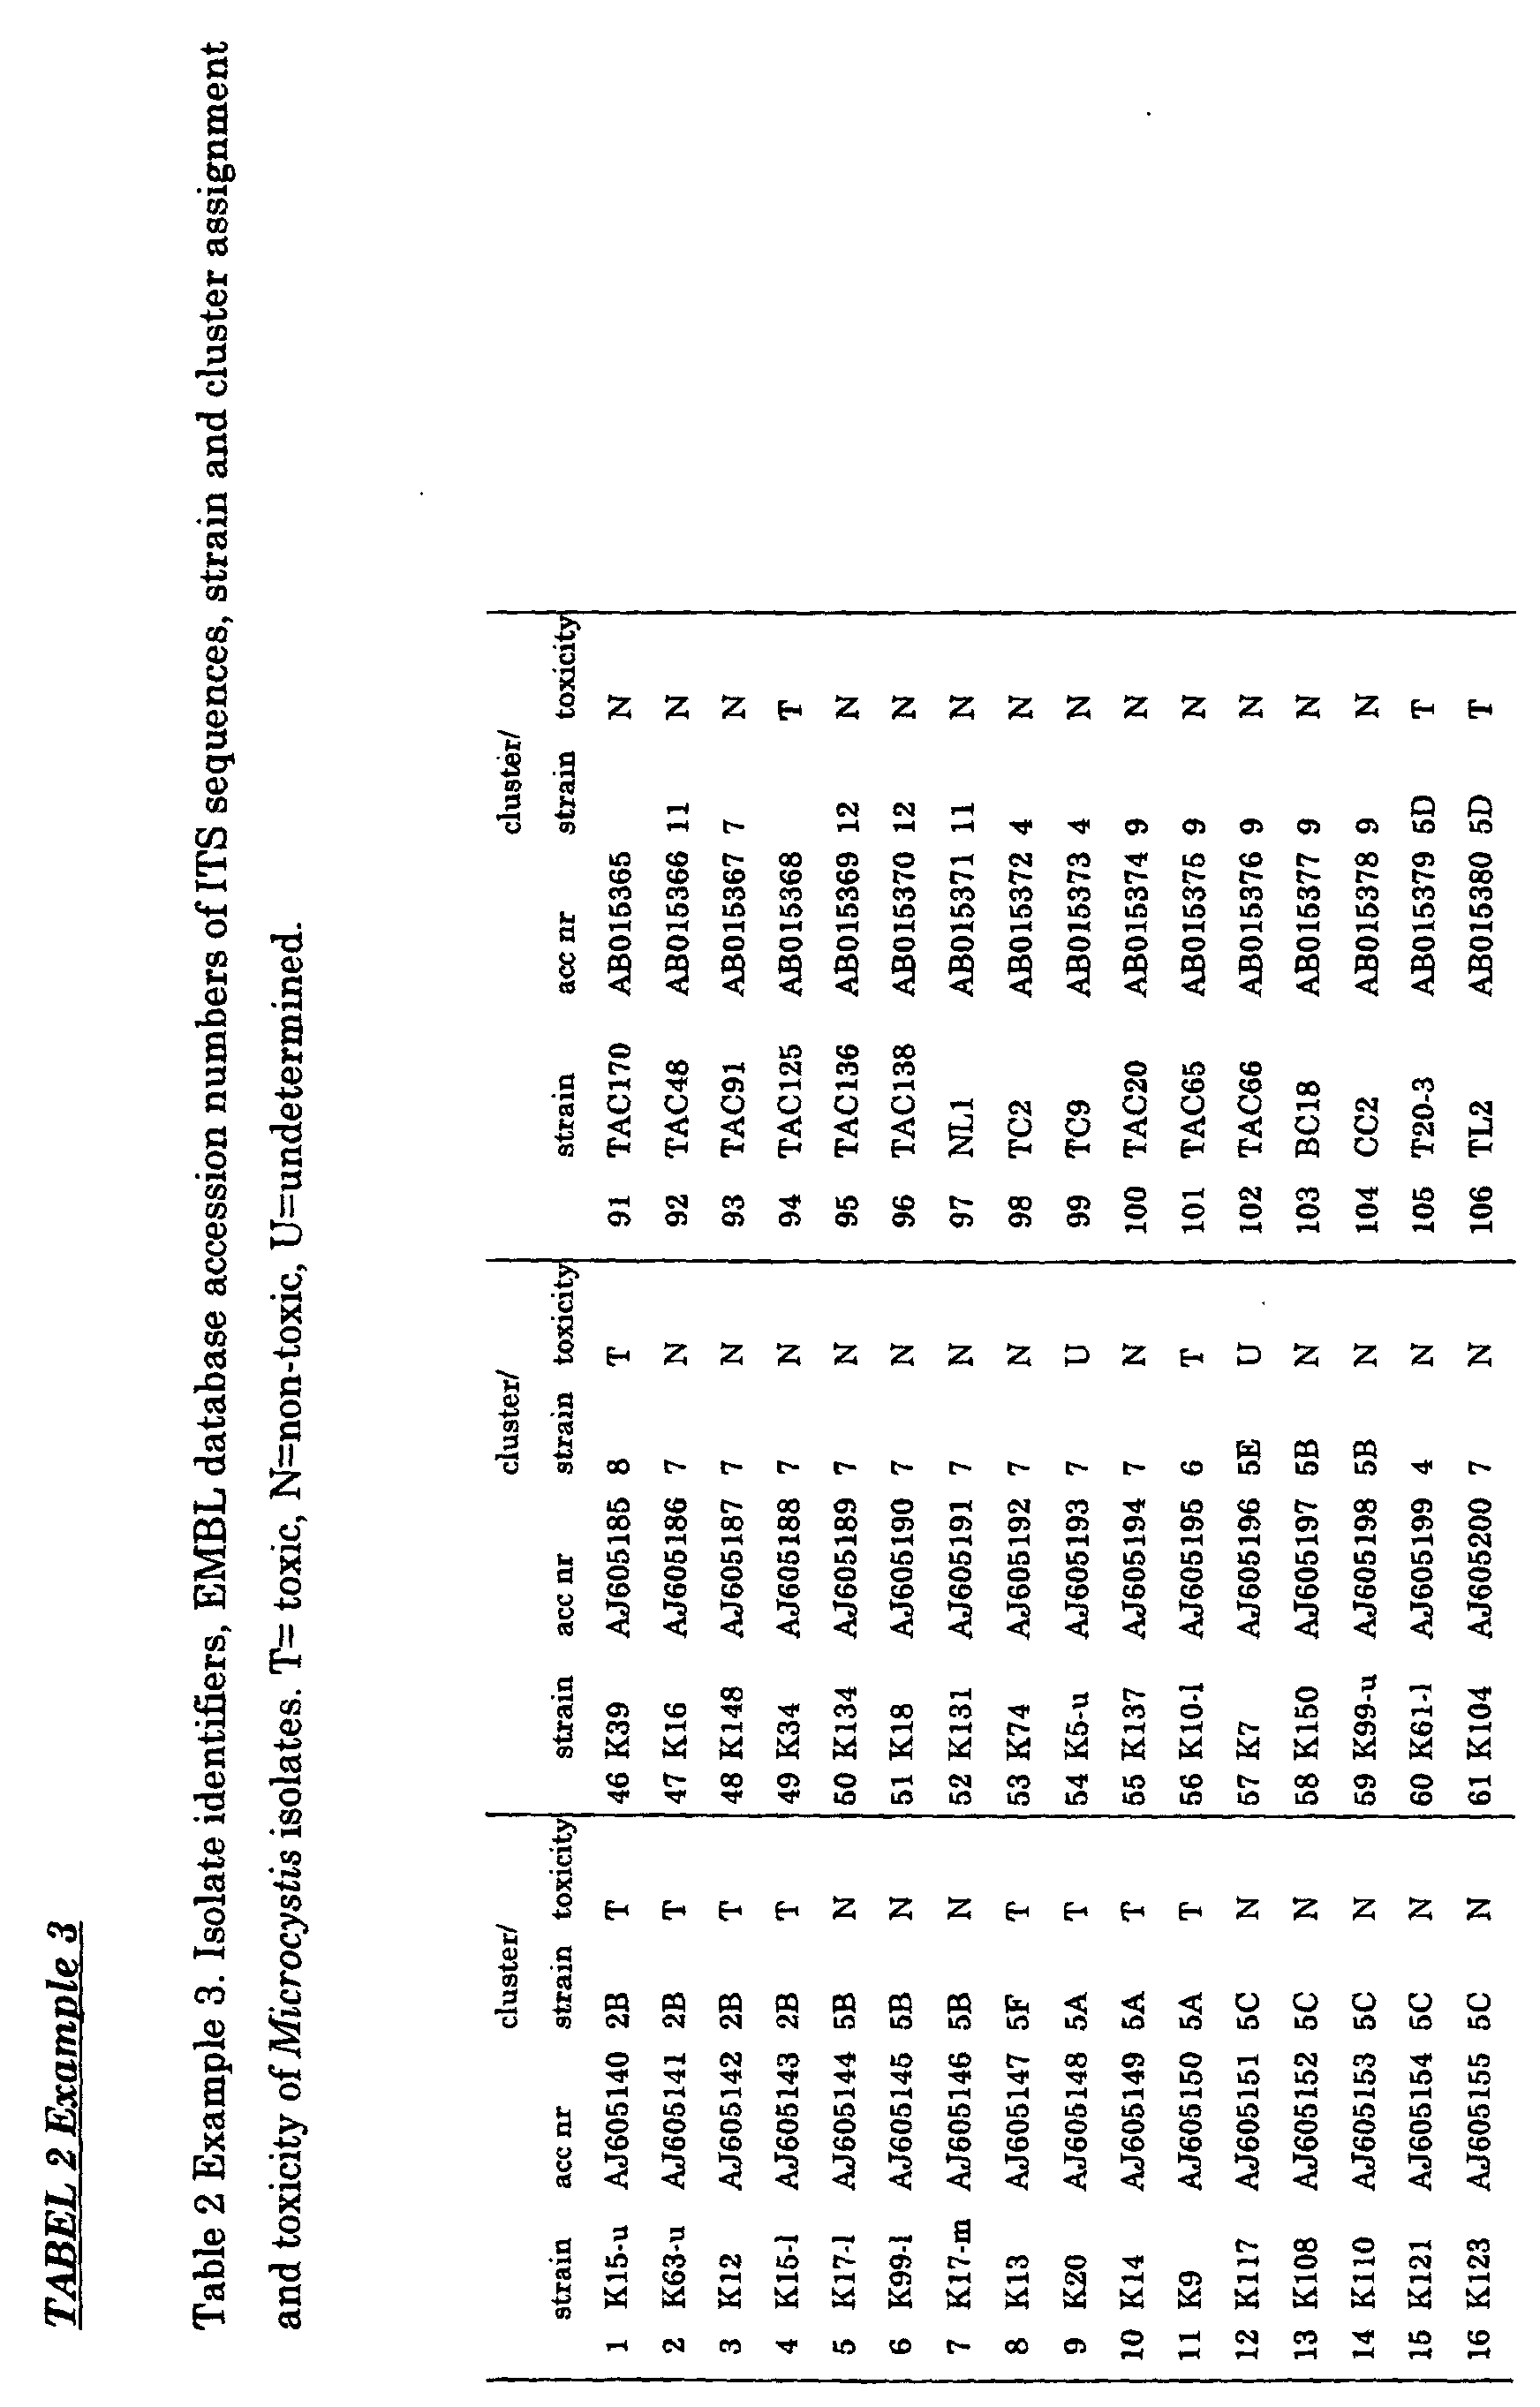


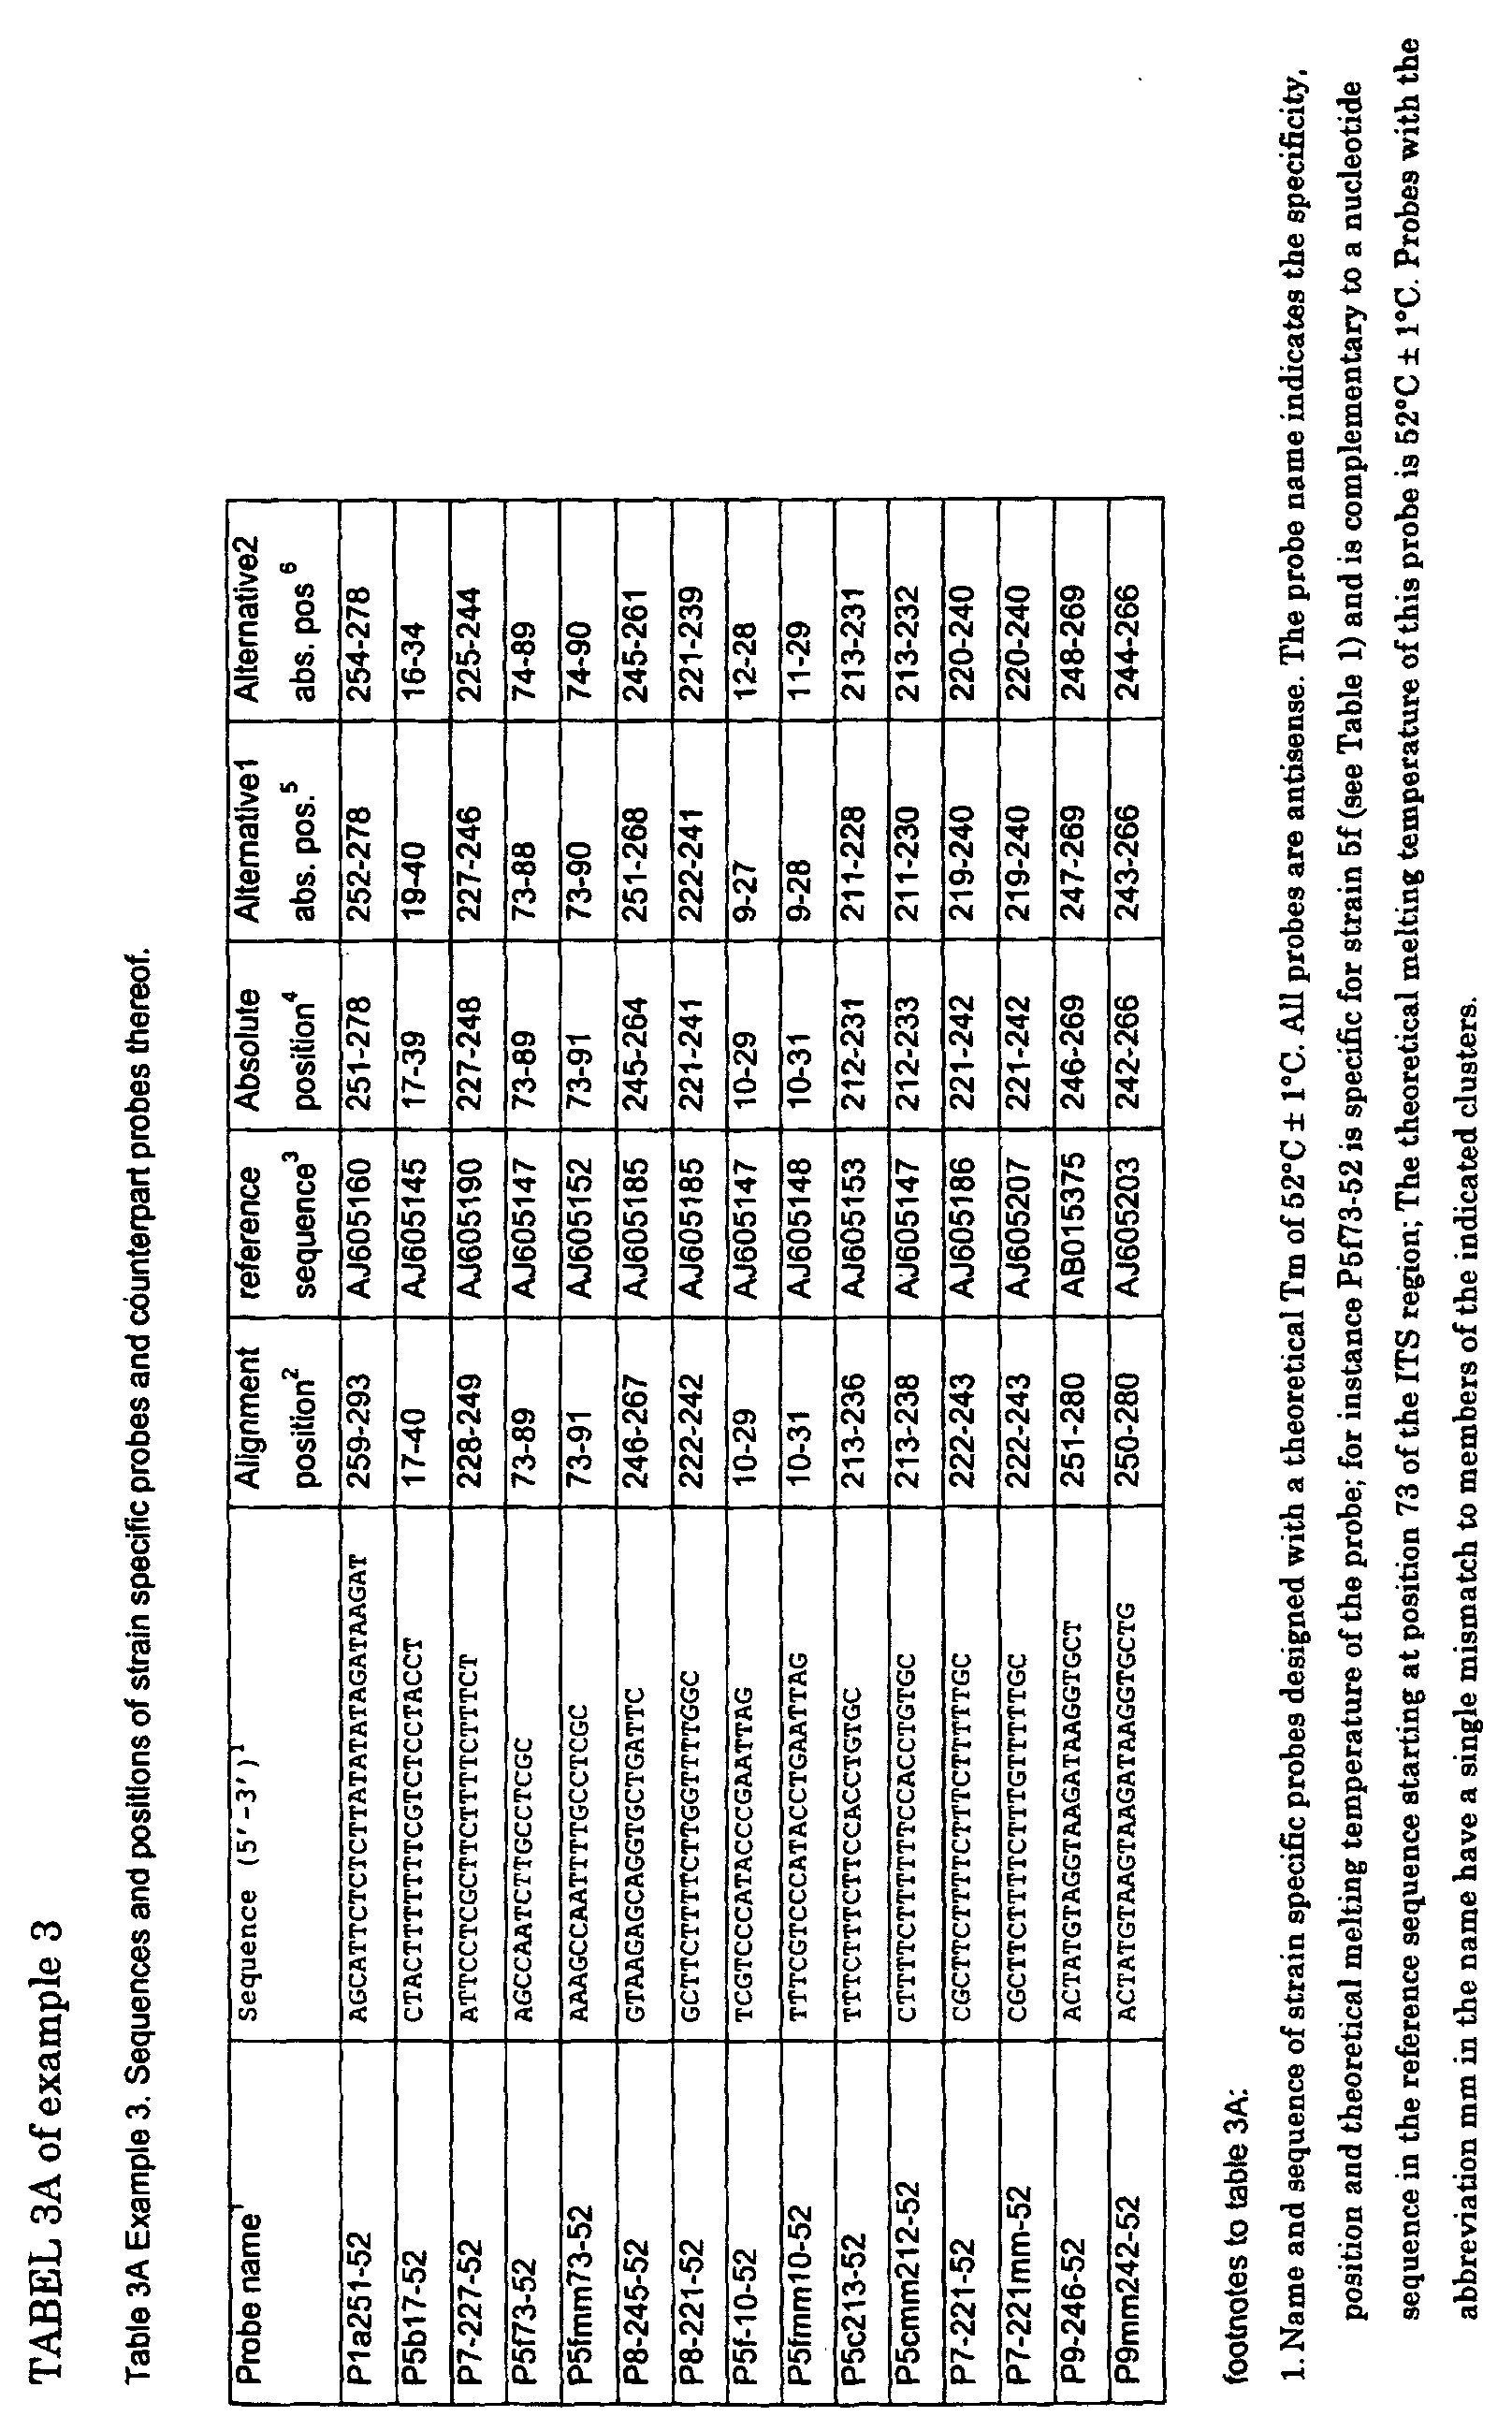


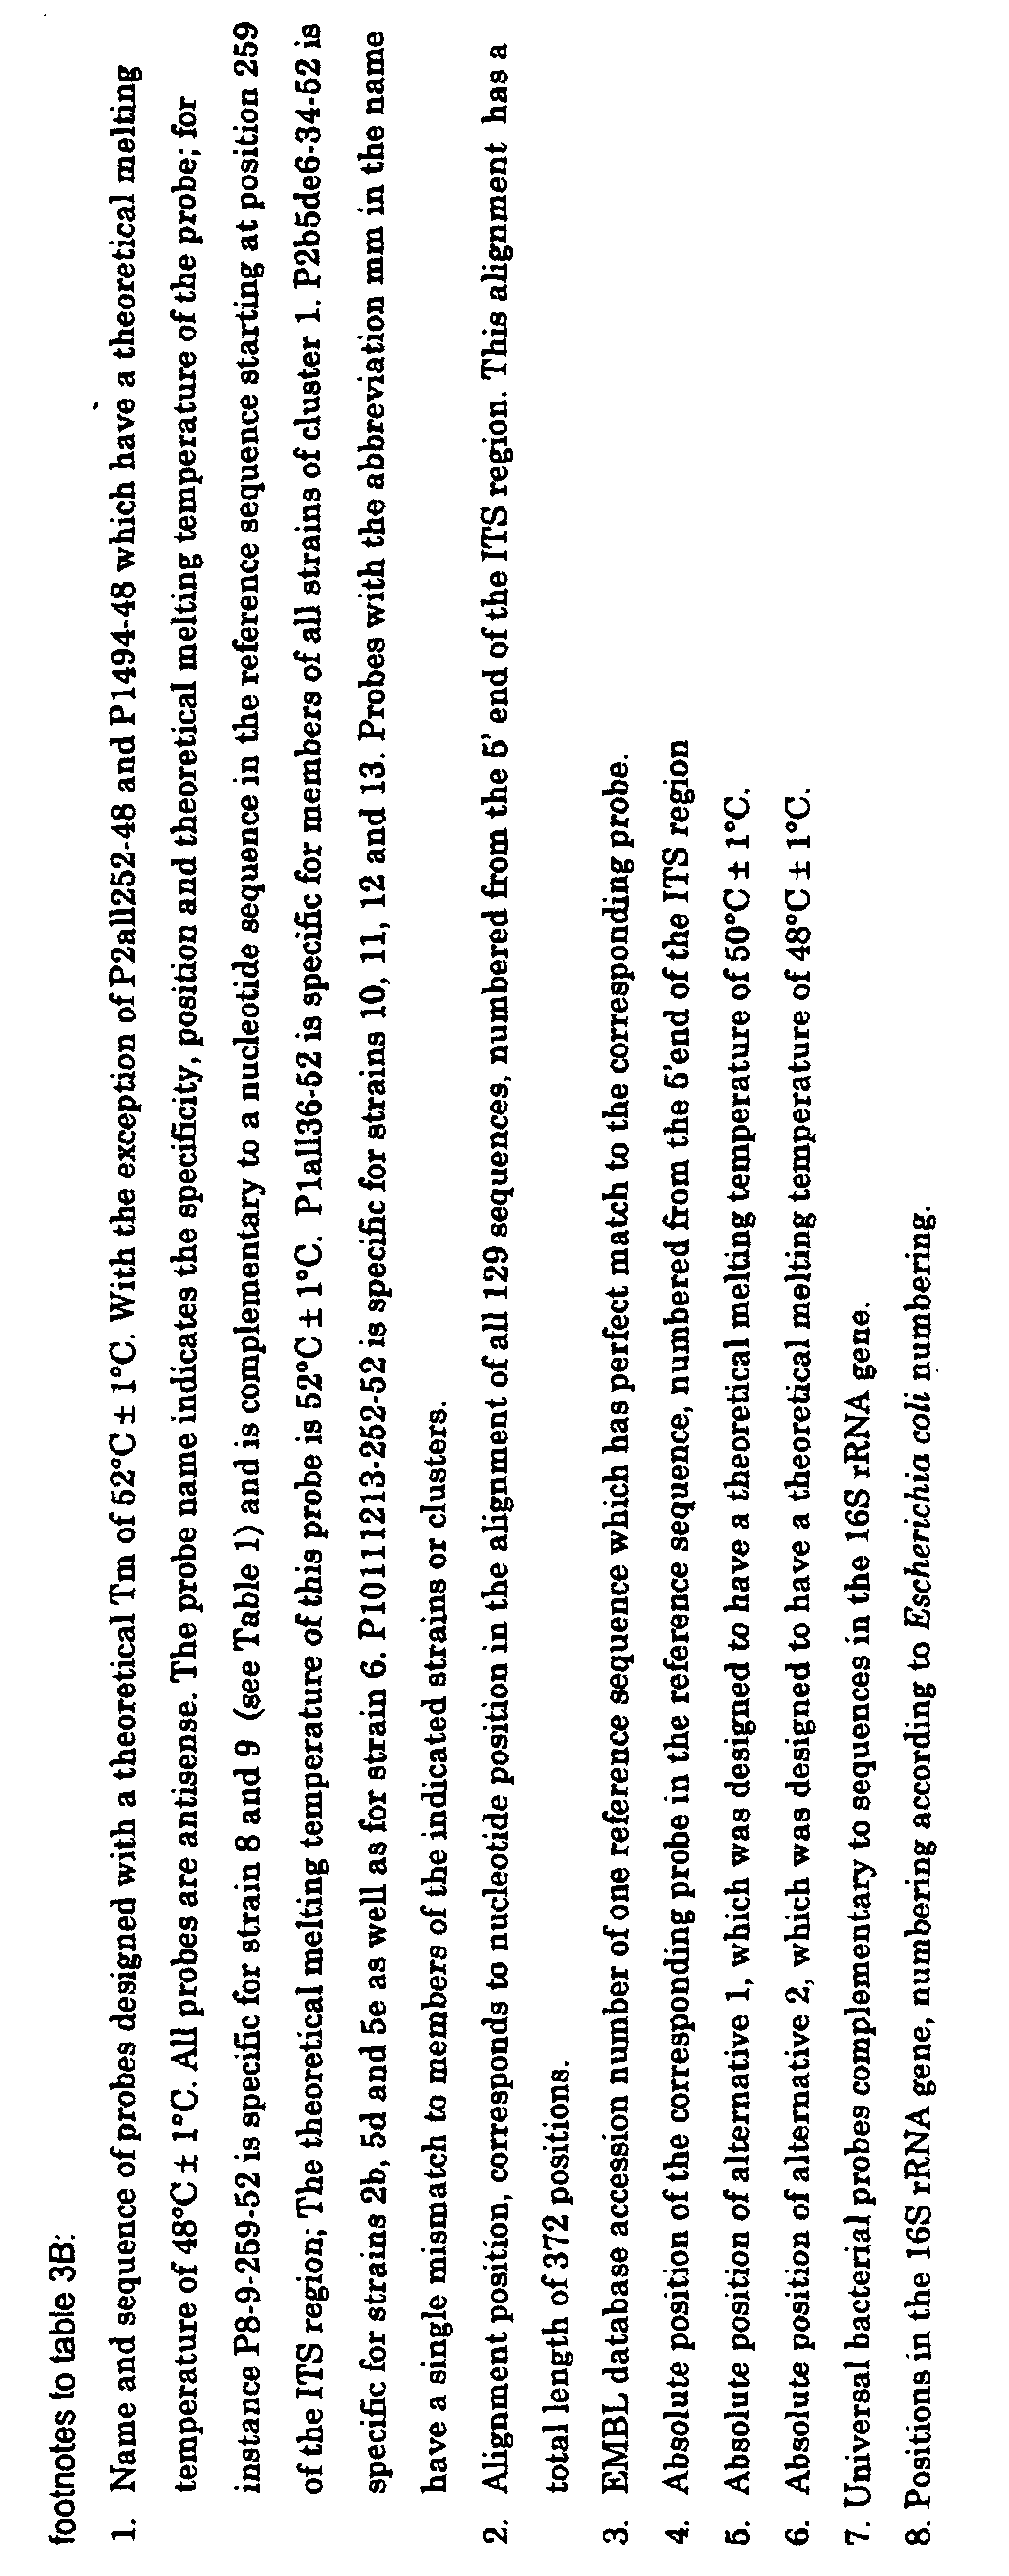
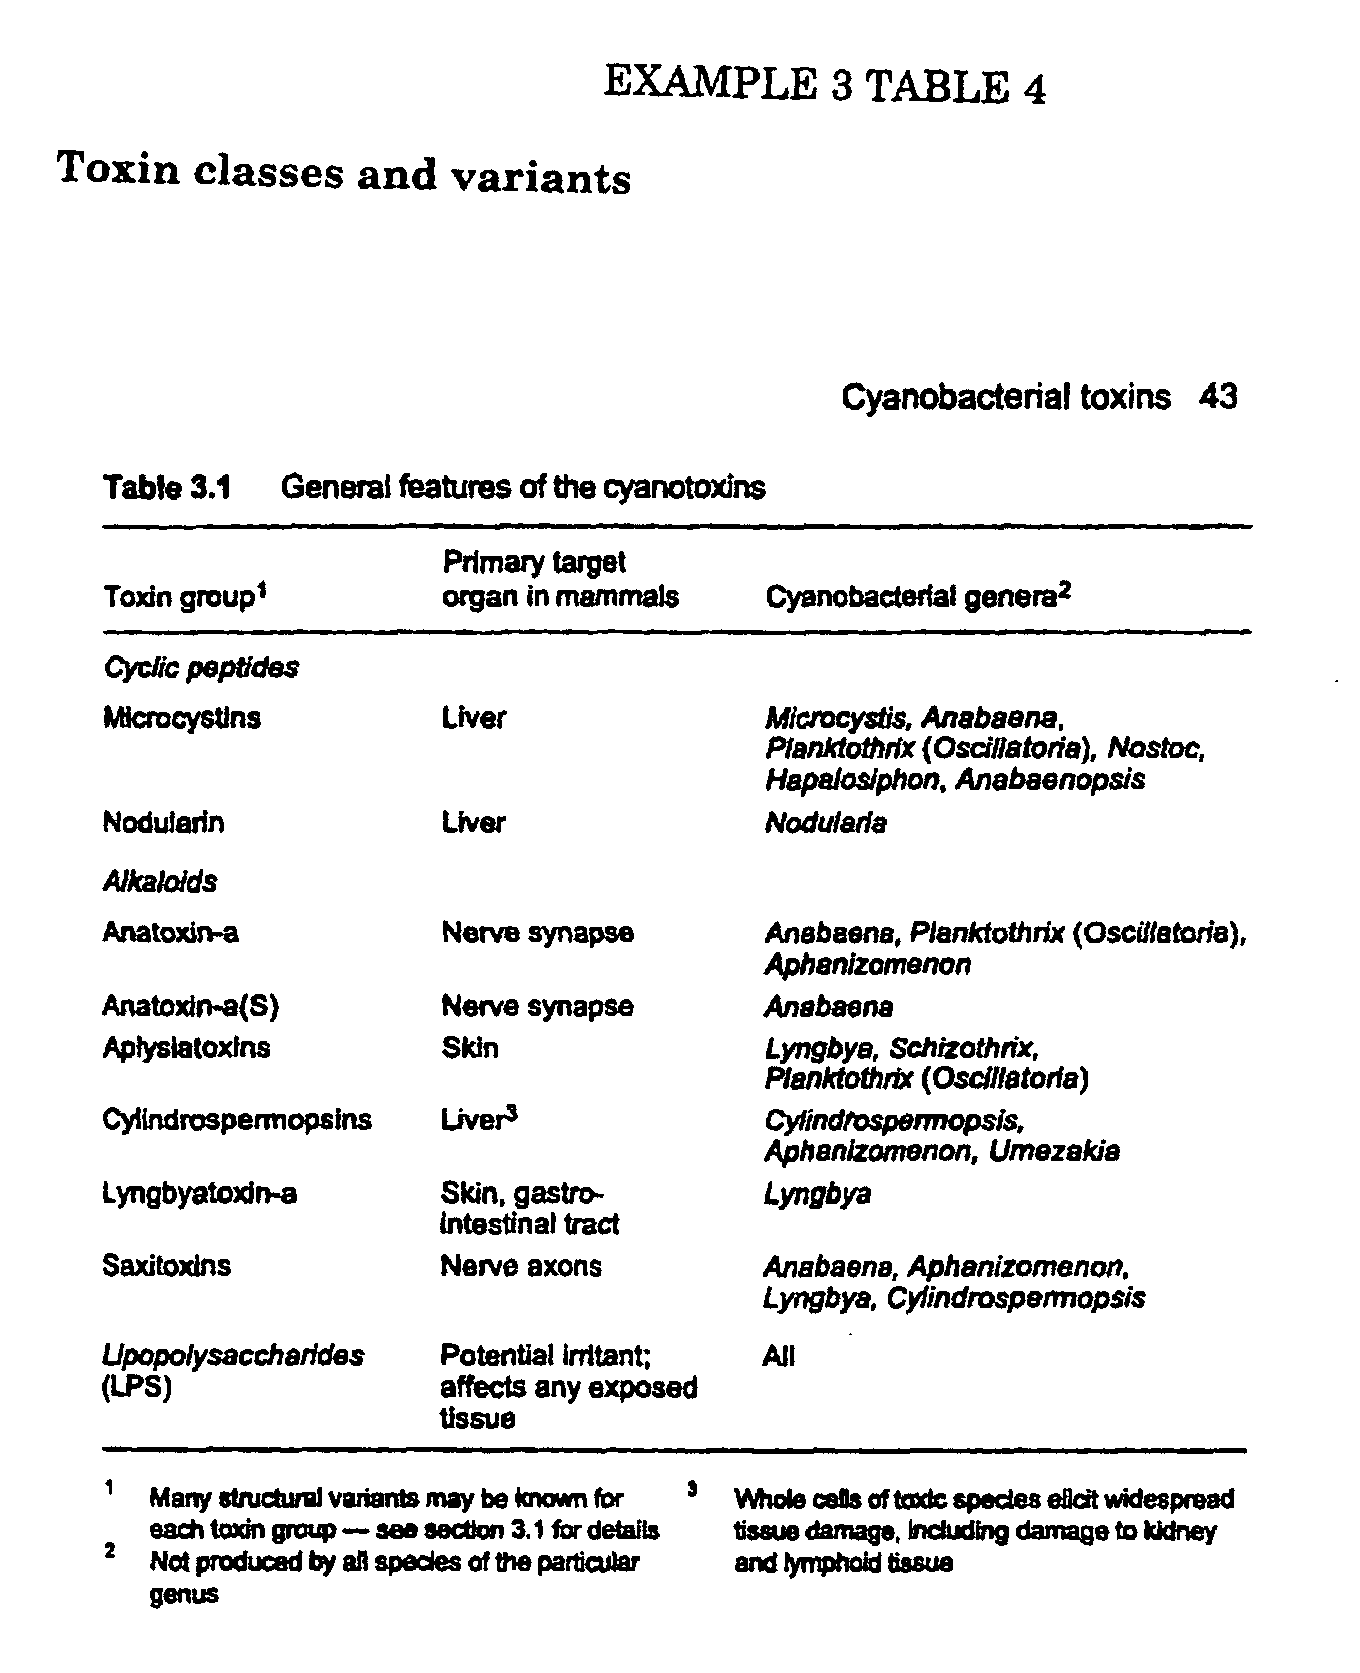


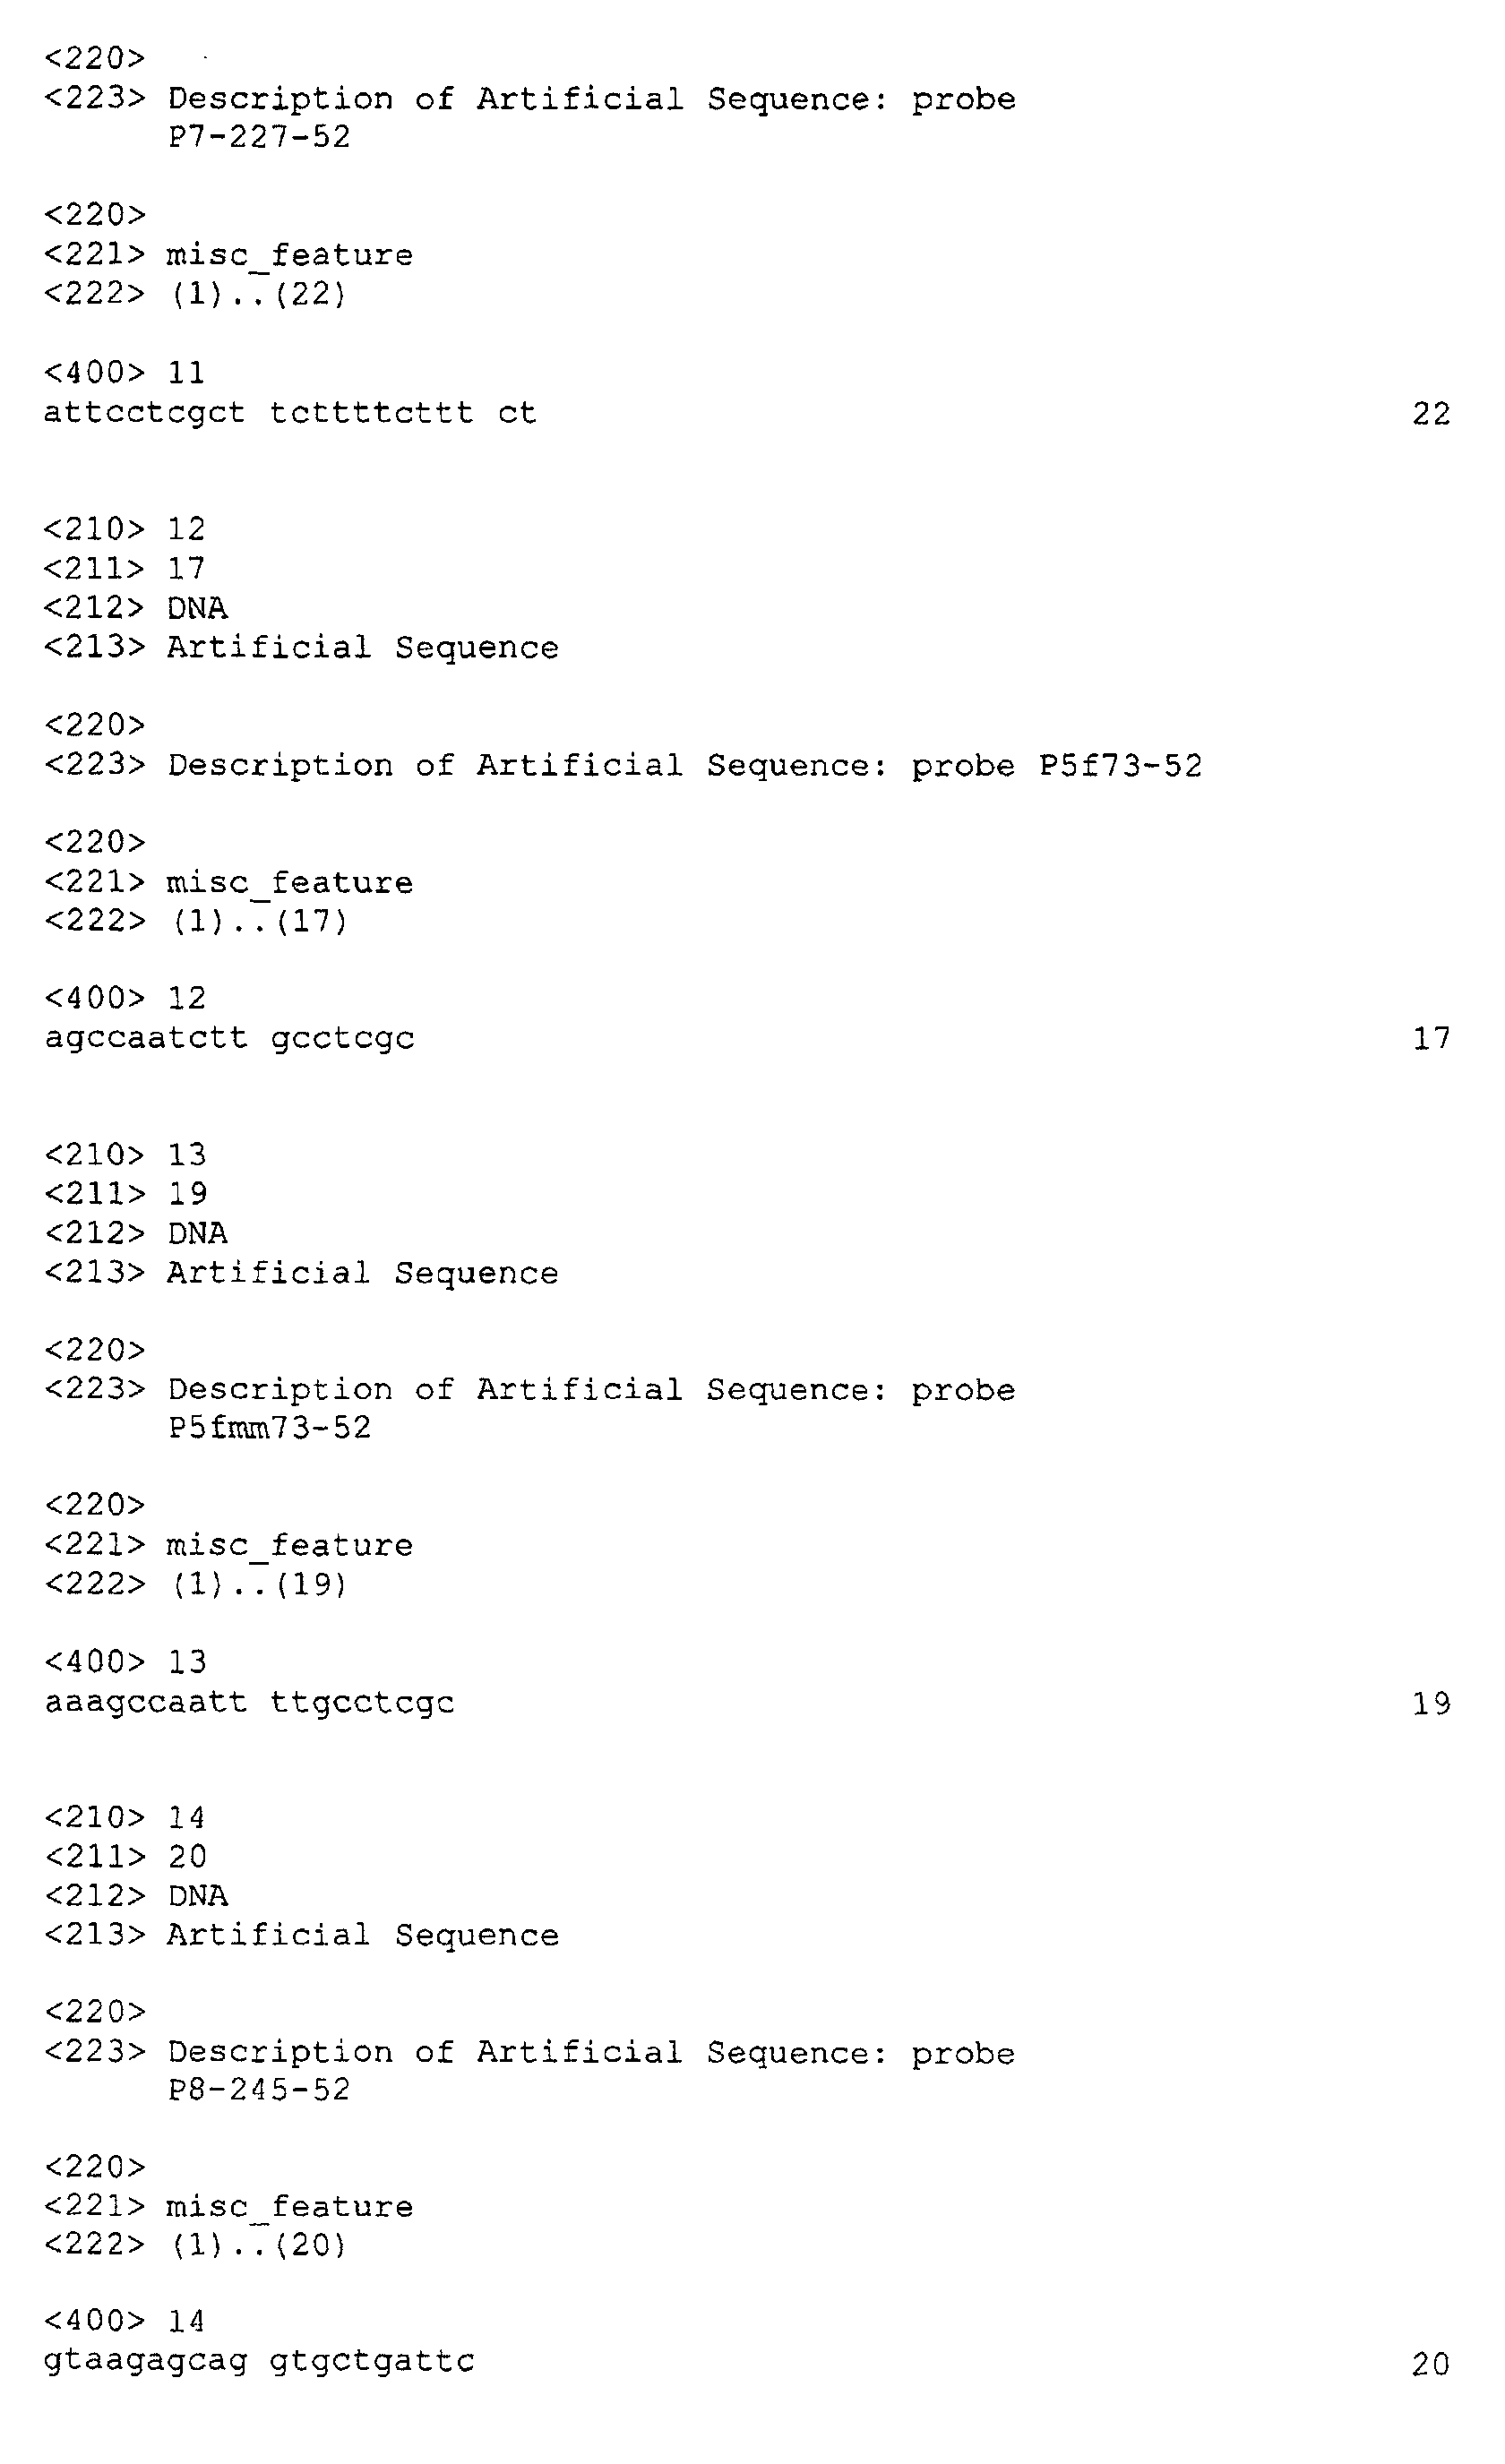


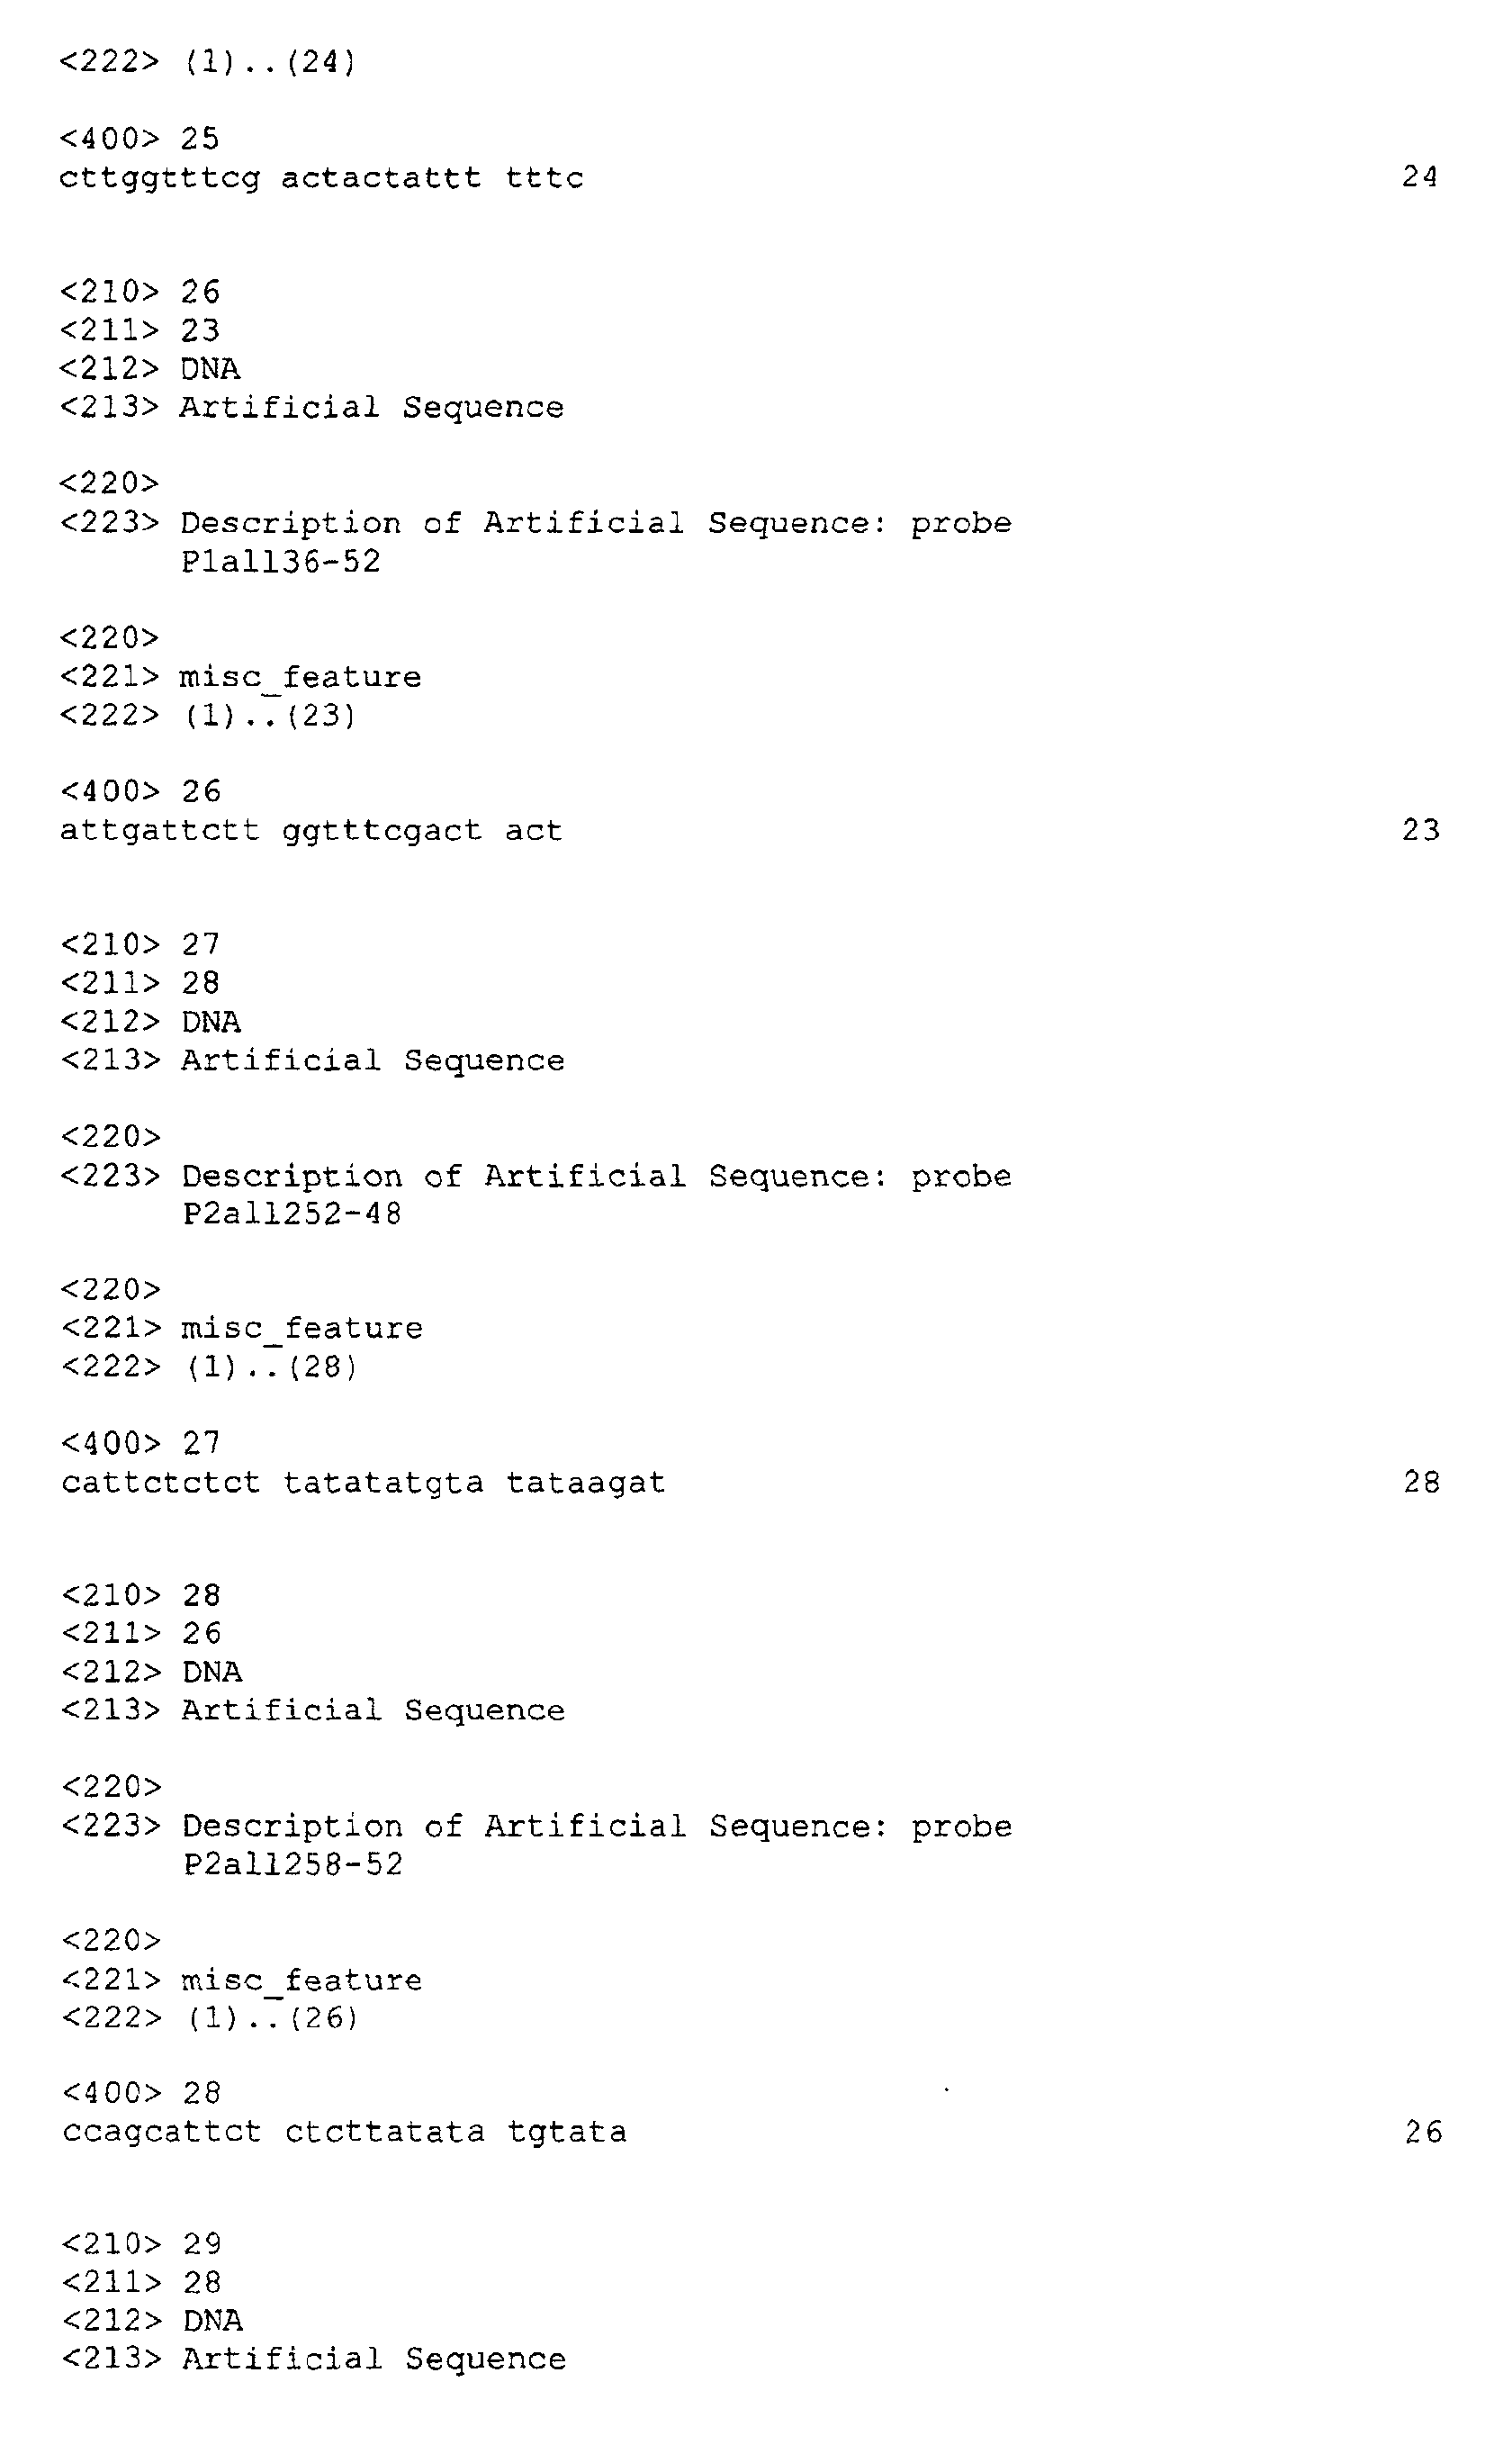
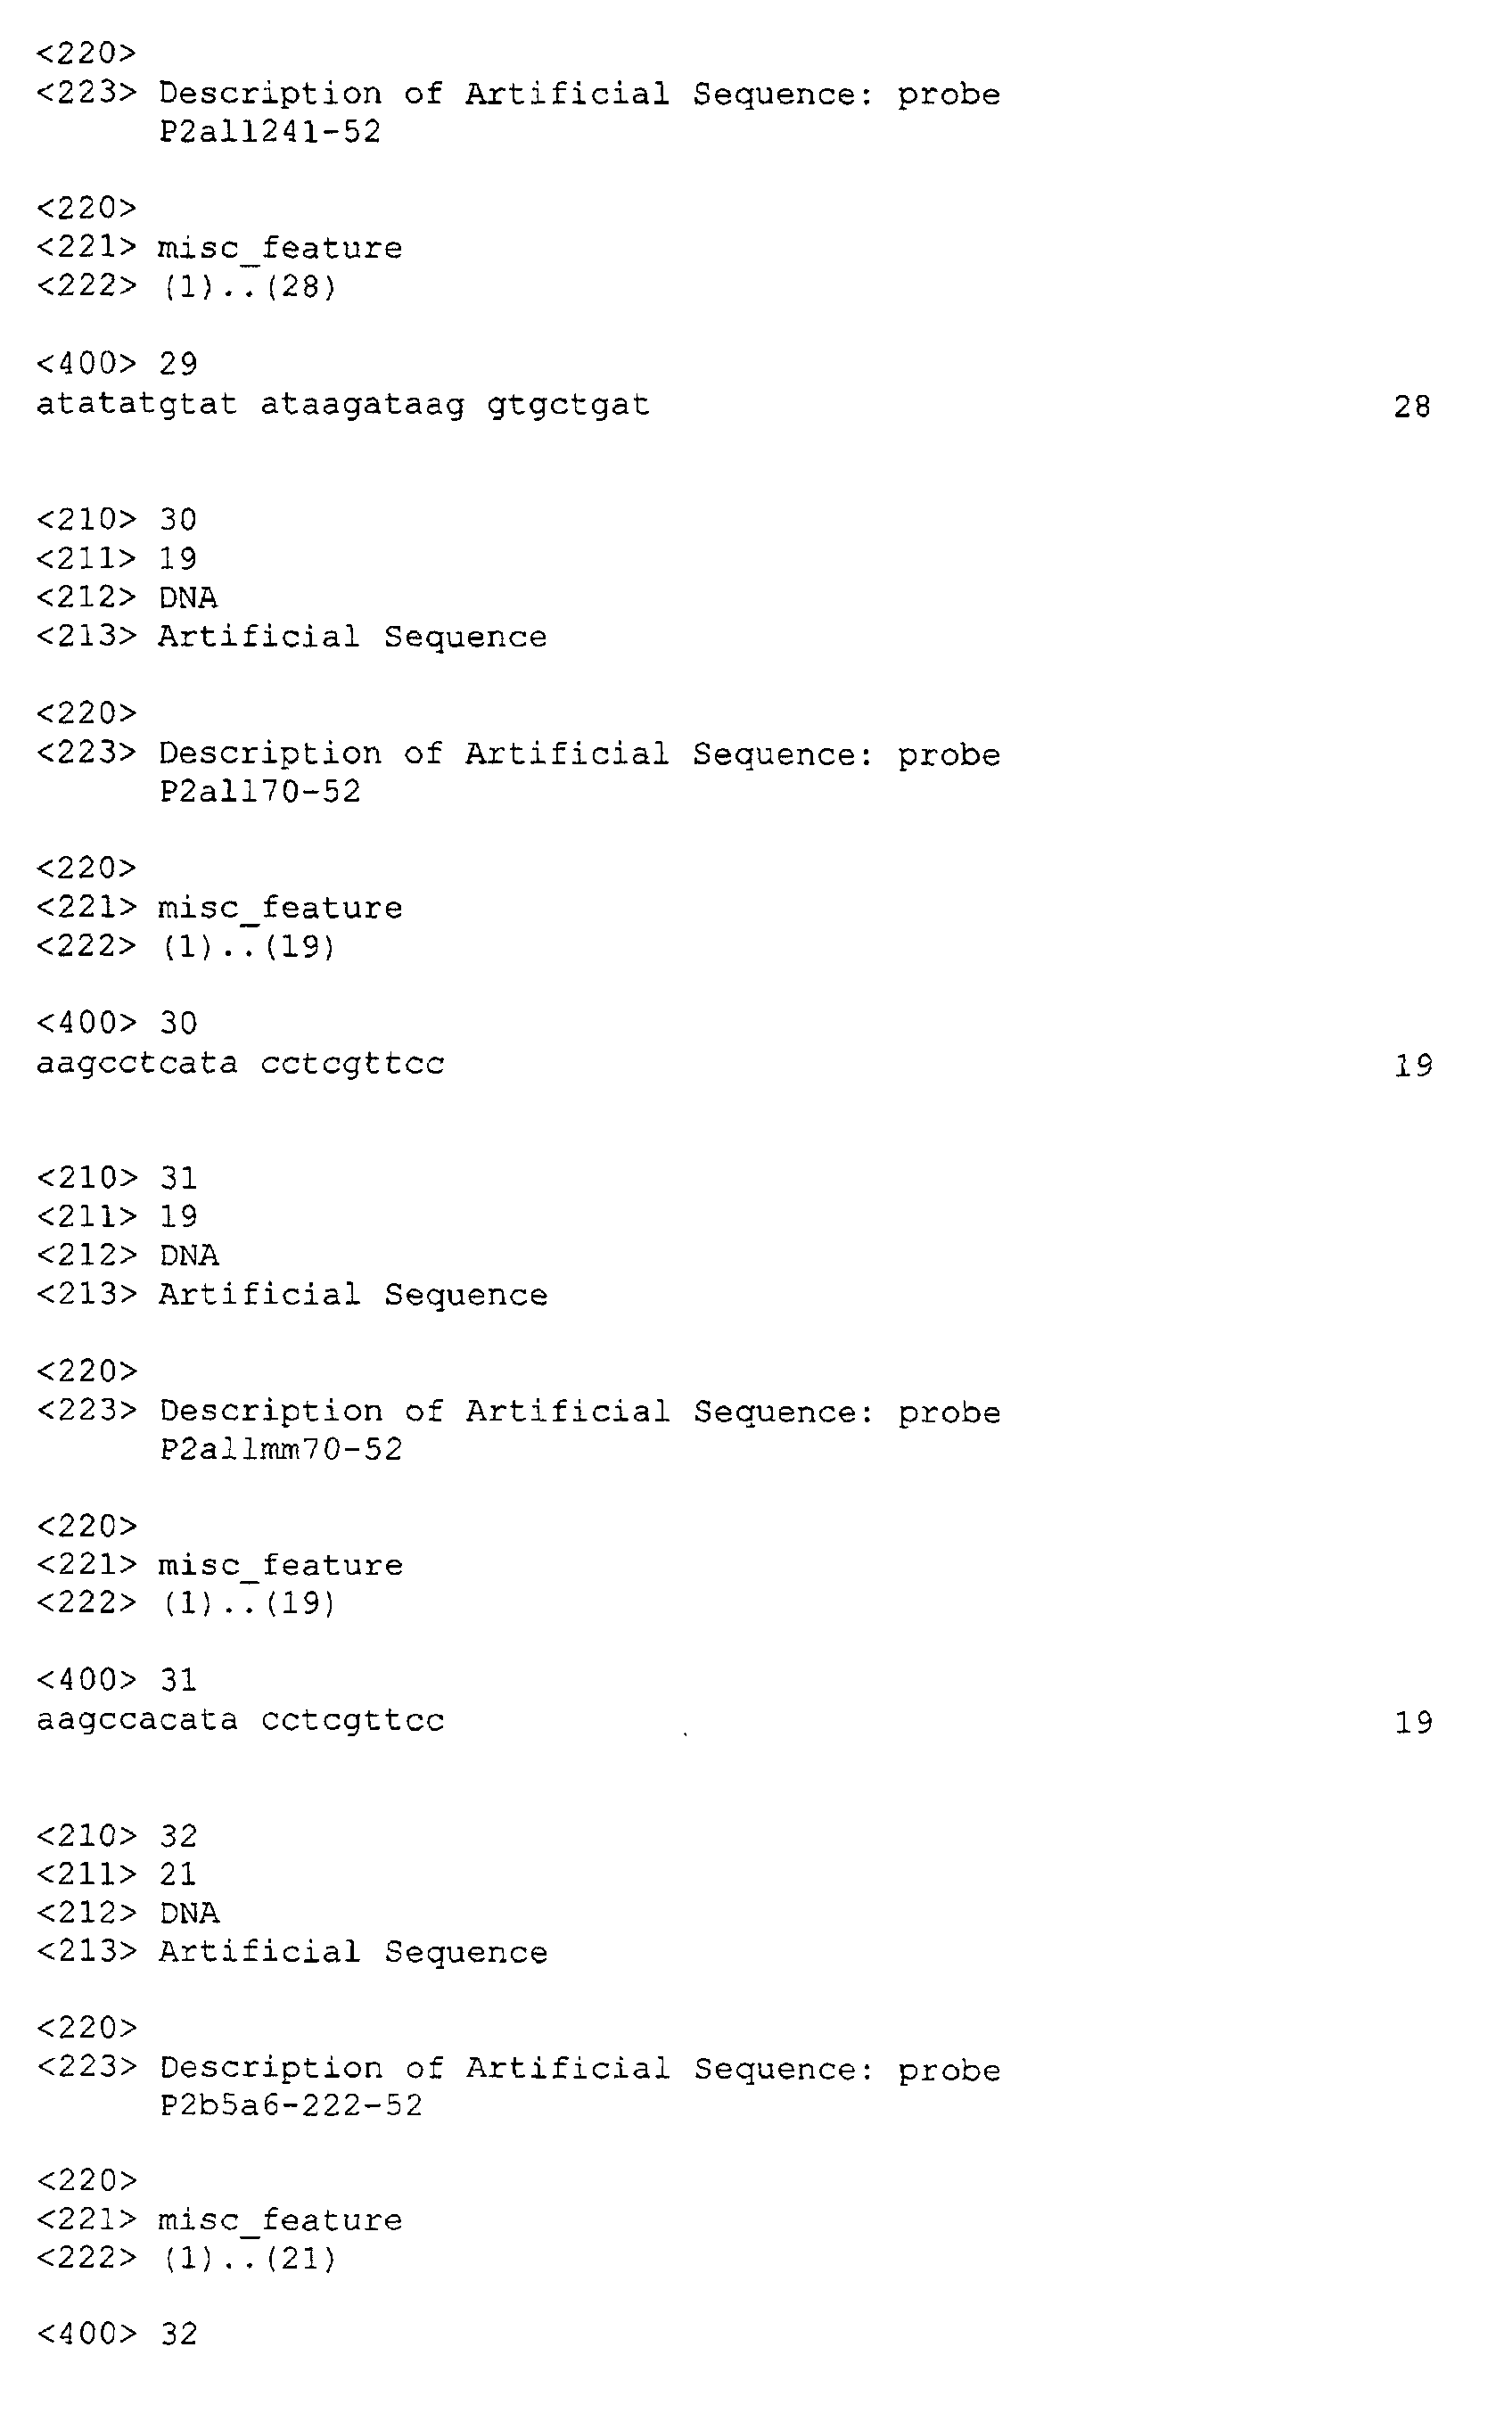


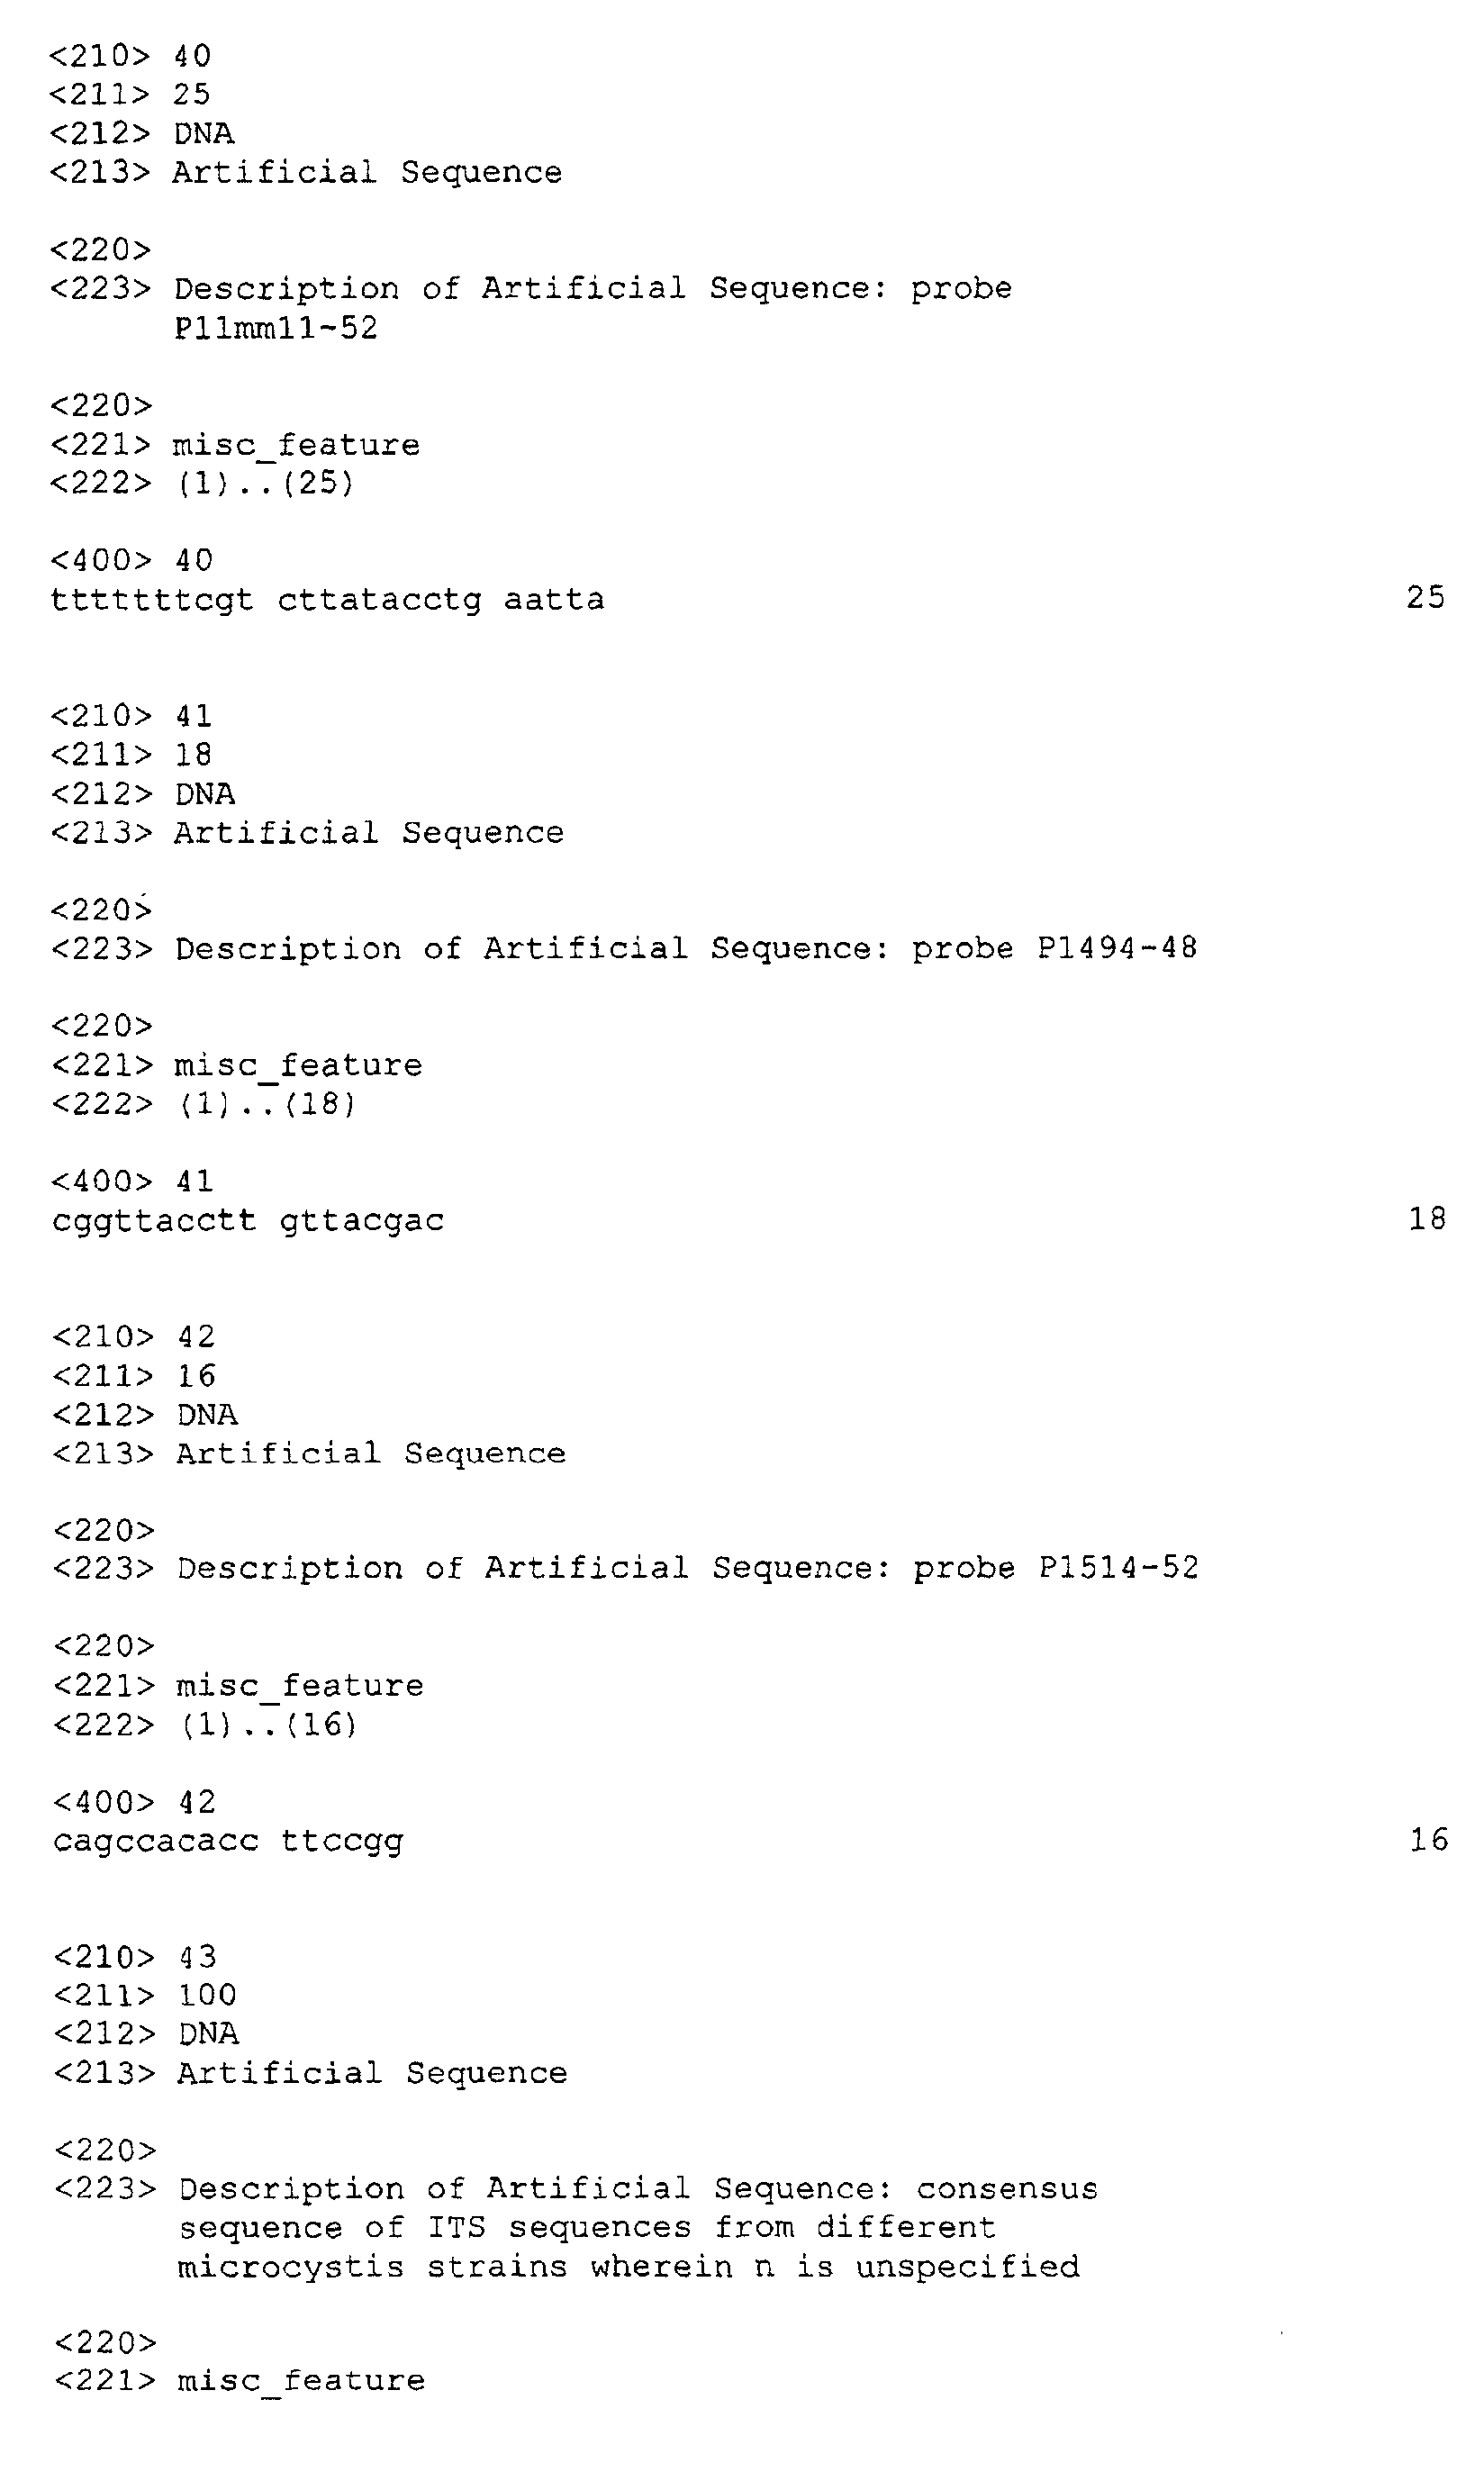
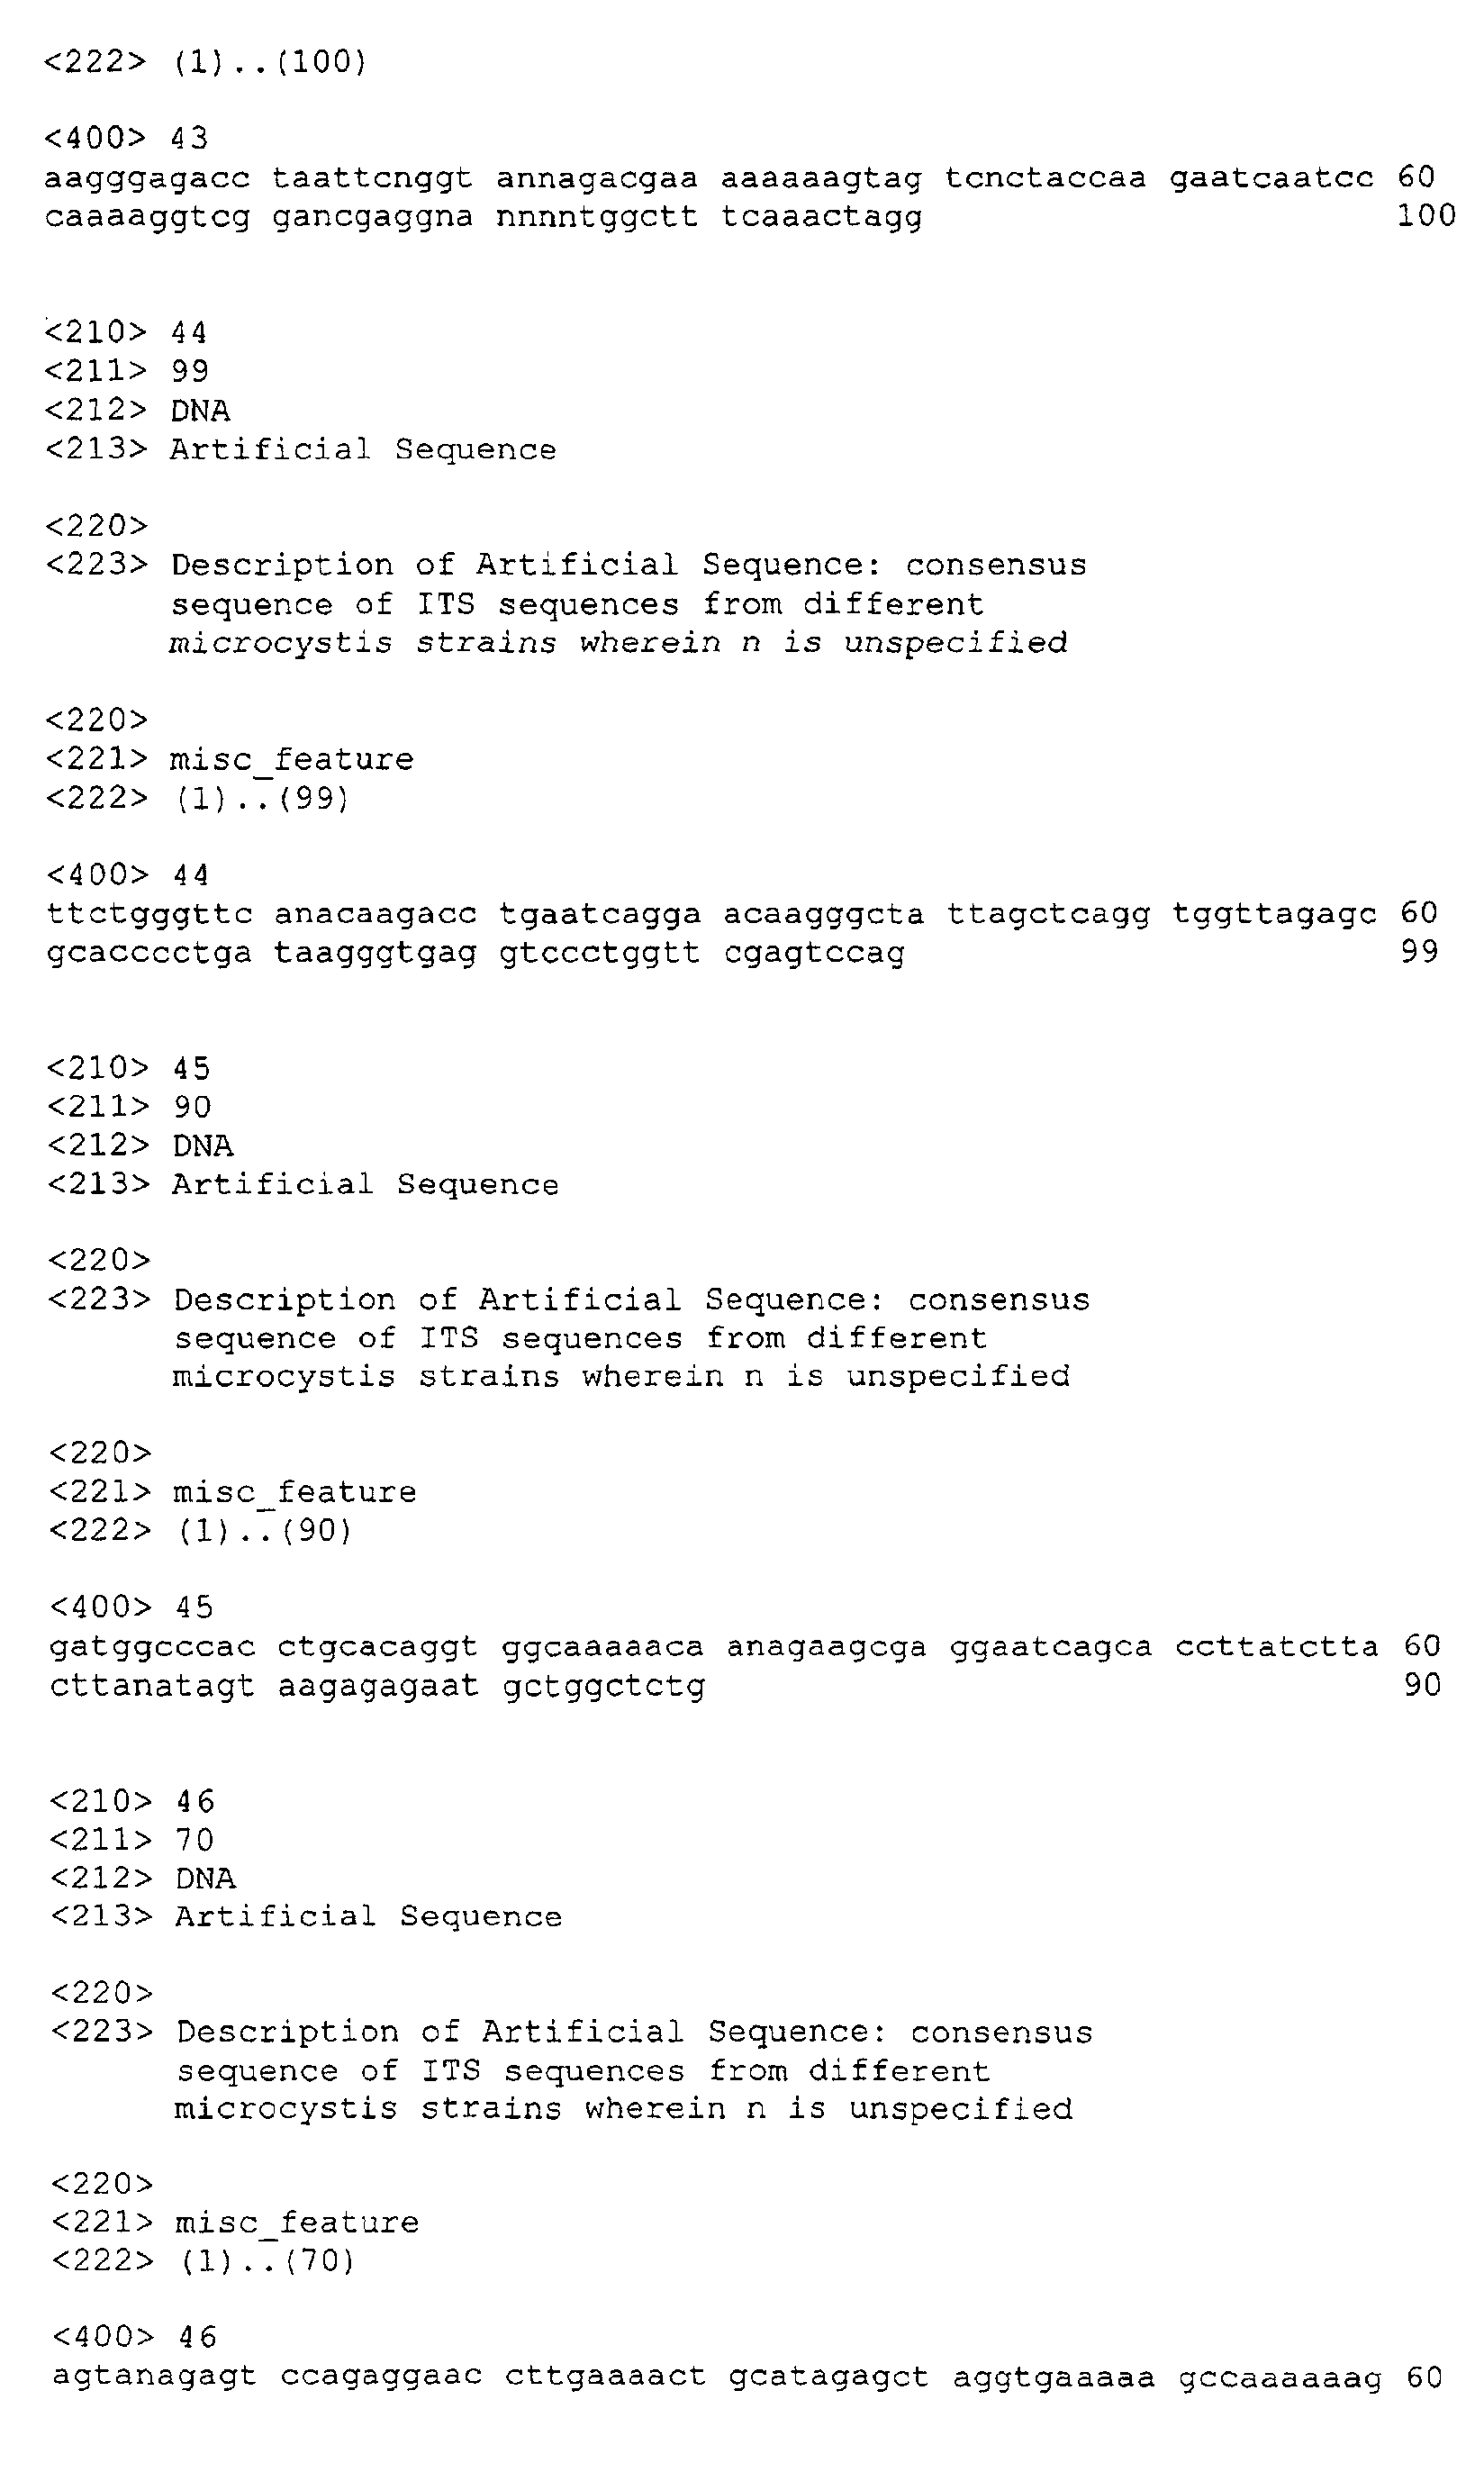

Claims (35)
- A method comprising hybridising a probe from an rRNA-internal transcribed spacer region (ITS) located between sequences from a 16S rRNA gene and a 23S rRNA gene, of a reference cyanobacterium strain, with a preparation comprising nucleic acid from said region derived from a test cyanobacterium and determining whether hybridisation occurs.
- A method according to claim 1, further comprising comparing the hybridisation result with a control hybridisation.
- A method according to claim 1 or claim 2, further comprising classifying said test cyanobacterium on the basis of said hybridisation.
- A method according to claim 3, wherein said classification comprising classifying said test cyanobacterium as a toxin producing strain.
- A method according to claim 3 or claim 4, wherein said classification further comprises classifying said cyanobacterium as a surface layer forming strain.
- A method according to any one of claims 3-5, further comprising classifying the test cyanobacterium as a high toxin producing strain.
- A method according to any one of claims 1-6, wherein said hybridisation comprises hybridising said preparation with a panel of nucleic acid probes wherein said panel comprises said probe and at least one probe derived from the ITS of another reference cyanobacterium strain.
- A method according to claim 7, wherein said panel comprises at least five probes, wherein each of said five probes is derived from ITS sequences of different reference cyanobacterium strains.
- A method according to claim 7 or claim 8, wherein at least one of said probes comprises no mismatches with the sequence of the reference strain the probe is derived from, and at least one mismatch, and preferably at least two mismatches with the sequence of said region in at least one other reference cyanobacterium strain.
- A method according to claim 9, wherein at least five of said probes comprise no mismatches with the sequence of said region in the reference strains they are derived from, and wherein each of said at least five probes comprises at least two mismatches with the sequence of said region in the other strains of said at least five reference strains.
- A method according to any one of claims 1-10, wherein at least one of said probes comprises between 12 and 30 nucleotides.
- A method according to claim 11, wherein said between 12 and 30 nucleotides are arranged consecutively in said region.
- A method according to claim 11 or claim 12, wherein said probe comprises further nucleotides that are not derived from said region.
- A method according to any one of claims 1-13, wherein at least one of said probes comprises a nucleic acid sequence as depicted in table 3A of example 3 or a functional equivalent thereof.
- A method according to any one of claims 7-14, wherein at least two of said probes comprise a nucleic acid sequence as depicted in table 3A of example 3 or a functional equivalent thereof.
- A method according to any one of claims 8-15, wherein at least five of said probes comprise a nucleic acid sequence as depicted in table 3A of example 3 or a functional equivalent thereof.
- A method according to any one of claims 3-16, further comprising hybridising a control probe from said rRNA-internal transcribed spacer region (ITS) located between sequences from a 16S rRNA gene and a 23S rRNA gene, with a preparation comprising nucleic acid from said region derived from a test cyanobacterium and determining whether hybridisation occurs, wherein said control probe comprises sequence divergence with some strains of cyanobacteria, but not with other strains of cyanobacteria.
- A method according to claim 17, wherein said control probe is selective for a cluster of cyanobacteria.
- A method according to claim 18, wherein said control probe is selective for a cluster of cyanobacteria that comprises the strain that said probe is selective for, preferably said control probe comprises a sequence as depicted in table 3B of example 3.
- A method according to any one of claims 1-19, wherein said preparation of nucleic acid of said test cyanobacterium is at least in part prepared through amplification of a sample comprising nucleic acid of said test cyanobacterium.
- A method according to claim 20, wherein said amplification was performed using a cyanobacterium specific primer within the 16S, 23S or 16S-23S rRNA internal transcribed spacer gene sequence.
- A method according to claim 21, wherein said primer comprises a sequence as depicted in table 1 of example 3.
- A nucleic acid comprising a nucleic acid sequence as depicted in table 1 of example 3, or a nucleic acid sequence according to table 3 of example 3 or a functional equivalent thereof.
- A panel of nucleic acids wherein at least one of said nucleic acids comprise a sequence as depicted in table 3A of example 3 or a functional equivalent thereof.
- A panel of nucleic acids wherein at least five of said nucleic acids comprise a sequence as depicted in table 3A of example 3 or a functional equivalent thereof.
- A nucleic acid array comprising a nucleic acid according to claim 23, or a panel of nucleic acids according to claim 24 or claim 25.
- A chip comprising a nucleic acid according to claim 23 or an array according to claim 26.
- An apparatus for analysing hybridisation signals comprising a panel of nucleic acids according to any one of claims 24-26 and/or a chip according to claim 27.
- Use of a nucleic acid according to claim 23, a panel according to claim 24 or claim 25, a chip according to claim 27, or an apparatus according to claim 28, for classifying a cyanobacterium.
- Use of a nucleic acid according to claim 23, a panel according to claim 241 or claim 25, a chip according to claim 27, or an apparatus according to claim 28, for classifying a cyanobacterium as a toxic or non-toxic cyanobacterium strain.
- A method for typing a cyanobacterium isolate in a sample comprising subjecting said ITS sequences from said isolate to a denaturing gradient gel electrophoresis step and typing the strain from said step.
- A method according to claim 31, wherein said typing comprises comparing the result of said step for said isolate with a reference strain.
- A method according to claim 31 or 32; wherein said ITS sequences are provided through amplification of the ITS region of said cyanobacterium isolate.
- A method according to claim 33, wherein said ITS sequences are amplified by using a cyanobacterium specific primer within the 16S, 23S or 16S-23S rRNA internal transcribed spacer gene sequence.
- A method according to claim 34, wherein said cyanobacterium specific primer comprises a sequence as depicted in table 1 of example 3.
Priority Applications (2)
| Application Number | Priority Date | Filing Date | Title |
|---|---|---|---|
| EP03078502A EP1529846A1 (en) | 2003-11-05 | 2003-11-05 | Means and methods for classifying cyanobacteria |
| PCT/NL2004/000782 WO2005045074A2 (en) | 2003-11-05 | 2004-11-05 | Means and methods for classifying cyanobacteria |
Applications Claiming Priority (1)
| Application Number | Priority Date | Filing Date | Title |
|---|---|---|---|
| EP03078502A EP1529846A1 (en) | 2003-11-05 | 2003-11-05 | Means and methods for classifying cyanobacteria |
Publications (1)
| Publication Number | Publication Date |
|---|---|
| EP1529846A1 true EP1529846A1 (en) | 2005-05-11 |
Family
ID=34429440
Family Applications (1)
| Application Number | Title | Priority Date | Filing Date |
|---|---|---|---|
| EP03078502A Withdrawn EP1529846A1 (en) | 2003-11-05 | 2003-11-05 | Means and methods for classifying cyanobacteria |
Country Status (1)
| Country | Link |
|---|---|
| EP (1) | EP1529846A1 (en) |
Cited By (1)
| Publication number | Priority date | Publication date | Assignee | Title |
|---|---|---|---|---|
| CN104899653A (en) * | 2015-06-02 | 2015-09-09 | 北京工商大学 | Lake and reservoir cyanobacterial bloom prediction method based on expert system and cyanobacterial growth mechanism timing model |
-
2003
- 2003-11-05 EP EP03078502A patent/EP1529846A1/en not_active Withdrawn
Non-Patent Citations (5)
| Title |
|---|
| BARRY T ET AL: "The 16s/23s ribosomal spacer region as a target for DNA probes to identify eubacteria.", PCR METHODS AND APPLICATIONS. AUG 1991, vol. 1, no. 1, August 1991 (1991-08-01), pages 51 - 56, XP000609831, ISSN: 1054-9803 * |
| ITEMAN I ET AL: "Comparison of conserved structural and regulatory domains within divergent 16S rRNA-23S rRNA spacer sequences of cyanobacteria.", MICROBIOLOGY (READING, ENGLAND) JUN 2000, vol. 146 ( Pt 6), June 2000 (2000-06-01), pages 1275 - 1286, XP002279654, ISSN: 1350-0872 * |
| LU W ET AL: "IDENTIFICATION OF CYANOBACTERIA BY POLYMORPHISMS OF PCR-AMPLIFIED RIBOSOMAL DNA SPACER REGION", FEMS MICROBIOLOGY LETTERS, AMSTERDAM, NL, vol. 153, no. 1, 1997, pages 141 - 149, XP001190804, ISSN: 0378-1097 * |
| OTSUKA S ET AL: "Phylogenetic relationships between toxic and non-toxic strains of the genus Microcystis based on 16S to 23S internal transcribed spacer sequence.", FEMS MICROBIOLOGY LETTERS. 1 MAR 1999, vol. 172, no. 1, 1 March 1999 (1999-03-01), pages 15 - 21, XP002279653, ISSN: 0378-1097 * |
| WILMOTTE A ET AL: "Structure of the 16 S ribosomal RNA of the thermophilic cyanobacterium Chlorogloeopsis HTF ('Mastigocladus laminosus HTF') strain PCC7518, and phylogenetic analysis.", FEBS LETTERS. 8 FEB 1993, vol. 317, no. 1-2, 8 February 1993 (1993-02-08), pages 96 - 100, XP002279657, ISSN: 0014-5793 * |
Cited By (2)
| Publication number | Priority date | Publication date | Assignee | Title |
|---|---|---|---|---|
| CN104899653A (en) * | 2015-06-02 | 2015-09-09 | 北京工商大学 | Lake and reservoir cyanobacterial bloom prediction method based on expert system and cyanobacterial growth mechanism timing model |
| CN104899653B (en) * | 2015-06-02 | 2018-01-12 | 北京工商大学 | Lake storehouse blue-green alga bloom Forecasting Methodology based on expert system and blue algae growth mechanism temporal model |
Similar Documents
| Publication | Publication Date | Title |
|---|---|---|
| Janse et al. | High-resolution differentiation of cyanobacteria by using rRNA-internal transcribed spacer denaturing gradient gel electrophoresis | |
| Nocker et al. | Genotypic microbial community profiling: a critical technical review | |
| Al-Tebrineh et al. | A multiplex qPCR targeting hepato-and neurotoxigenic cyanobacteria of global significance | |
| Moeseneder et al. | Terminal-restriction fragment length polymorphism (T-RFLP) screening of a marine archaeal clone library to determine the different phylotypes | |
| Vickery et al. | A real-time PCR assay for the rapid determination of 16S rRNA genotype in Vibrio vulnificus | |
| JP2005504508A5 (en) | ||
| Thies et al. | Application of molecular techniques to studies in Rhizobium ecology: a review | |
| AU2013259495B2 (en) | Ion torrent genomic sequencing | |
| NO326359B1 (en) | Method of showing different nucleotide sequences in a single sample as well as kits for carrying out the method | |
| Vandamme et al. | Phylogenetics and systematics | |
| Debruyne et al. | Comparative performance of different PCR assays for the identification of Campylobacter jejuni and Campylobacter coli | |
| EP1176213B1 (en) | Amplification and detection of legionella pneumophila nucleic acids | |
| AU2013205090B2 (en) | Compositions and Methods for Detecting Gastrointestinal Pathogen Nucleic Acid | |
| Dhalluin et al. | Genotypic differentiation of twelve Clostridium species by polymorphism analysis of the triosephosphate isomerase (tpi) gene | |
| EP2492352A1 (en) | Composition, method and kit for detecting bacteria by means of sequencing | |
| WO2005045074A2 (en) | Means and methods for classifying cyanobacteria | |
| Davis et al. | Phytoplasmas associated with grapevine yellows in Israel and Greece belong to the stolbur phytoplasma subgroup, 16SrXII-A | |
| WO1996019585A1 (en) | Typing of microorganisms | |
| Babcock et al. | Rapid screening of a large insert BAC library for specific 16S rRNA genes using TRFLP | |
| Singh et al. | Multilocus sequence typing of Salmonella strains by high-throughput sequencing of selectively amplified target genes | |
| Rademaker et al. | Molecular typing of environmental isolates | |
| Günther et al. | Design and evaluation of an oligonucleotide-microarray for the detection of different species of the genus Kitasatospora | |
| Llop et al. | Tracking Agrobacterium strains by a RAPD system to identify single colonies from plant tumours | |
| JP2010004879A (en) | Method for detecting fungus belonging to genus neosartorya and aspergillus fumigatus | |
| Sood et al. | Fingerprinting of freshly separated and cultured cyanobionts from different Azolla species using morphological and molecular markers |
Legal Events
| Date | Code | Title | Description |
|---|---|---|---|
| PUAI | Public reference made under article 153(3) epc to a published international application that has entered the european phase |
Free format text: ORIGINAL CODE: 0009012 |
|
| AK | Designated contracting states |
Kind code of ref document: A1 Designated state(s): AT BE BG CH CY CZ DE DK EE ES FI FR GB GR HU IE IT LI LU MC NL PT RO SE SI SK TR |
|
| AX | Request for extension of the european patent |
Extension state: AL LT LV MK |
|
| AKX | Designation fees paid | ||
| REG | Reference to a national code |
Ref country code: DE Ref legal event code: 8566 |
|
| STAA | Information on the status of an ep patent application or granted ep patent |
Free format text: STATUS: THE APPLICATION IS DEEMED TO BE WITHDRAWN |
|
| 18D | Application deemed to be withdrawn |
Effective date: 20051112 |