EP1515139A2 - Method of determining the fluid condition of diesel engine lubricant during real time operation - Google Patents
Method of determining the fluid condition of diesel engine lubricant during real time operation Download PDFInfo
- Publication number
- EP1515139A2 EP1515139A2 EP04020736A EP04020736A EP1515139A2 EP 1515139 A2 EP1515139 A2 EP 1515139A2 EP 04020736 A EP04020736 A EP 04020736A EP 04020736 A EP04020736 A EP 04020736A EP 1515139 A2 EP1515139 A2 EP 1515139A2
- Authority
- EP
- European Patent Office
- Prior art keywords
- lubricant
- rul
- determining
- δdz
- value
- Prior art date
- Legal status (The legal status is an assumption and is not a legal conclusion. Google has not performed a legal analysis and makes no representation as to the accuracy of the status listed.)
- Withdrawn
Links
Images


Classifications
-
- G—PHYSICS
- G01—MEASURING; TESTING
- G01N—INVESTIGATING OR ANALYSING MATERIALS BY DETERMINING THEIR CHEMICAL OR PHYSICAL PROPERTIES
- G01N33/00—Investigating or analysing materials by specific methods not covered by groups G01N1/00 - G01N31/00
- G01N33/26—Oils; Viscous liquids; Paints; Inks
- G01N33/28—Oils, i.e. hydrocarbon liquids
- G01N33/2888—Lubricating oil characteristics, e.g. deterioration
-
- F—MECHANICAL ENGINEERING; LIGHTING; HEATING; WEAPONS; BLASTING
- F01—MACHINES OR ENGINES IN GENERAL; ENGINE PLANTS IN GENERAL; STEAM ENGINES
- F01M—LUBRICATING OF MACHINES OR ENGINES IN GENERAL; LUBRICATING INTERNAL COMBUSTION ENGINES; CRANKCASE VENTILATING
- F01M11/00—Component parts, details or accessories, not provided for in, or of interest apart from, groups F01M1/00 - F01M9/00
- F01M11/10—Indicating devices; Other safety devices
-
- G—PHYSICS
- G01—MEASURING; TESTING
- G01N—INVESTIGATING OR ANALYSING MATERIALS BY DETERMINING THEIR CHEMICAL OR PHYSICAL PROPERTIES
- G01N27/00—Investigating or analysing materials by the use of electric, electrochemical, or magnetic means
- G01N27/02—Investigating or analysing materials by the use of electric, electrochemical, or magnetic means by investigating impedance
Definitions
- the present invention relates to monitoring the condition of a fluid such as Diesel engine lubricant while the engine is running and providing an electrical signal indicative of the condition of the fluid insofar as its ability to continue its function to effectively lubricate the running engine.
- a fluid such as Diesel engine lubricant
- a known technique for monitoring engine lubricant during real time operation is that employing impedance spectroscopy wherein a pair of electrodes are immersed in the lubricant sump and one electrode excited with a low level alternating current voltage at a relatively high and then sequentially at a relatively low frequency and from the current measurements at both frequencies the impedance is computed and the differential impedance correlated with known properties of the fluid at various stages of lubricant stressing. The differential impedance may then be compared with the known values in real time to determine from a lookup table of the differential impedance versus known fluid conditions what the instantaneous condition of the fluid is during engine operation.
- U.S. Patent 6,377,052 describes a method of monitoring synthetic motor oil of the type employed in spark ignition gasoline fueled engines in passenger cars utilizing impedance spectroscopy for determining during real time operation the instantaneous remaining useful life (RUL) of the engine lubricant by comparison of impedance calculated from sequential current measurements at different frequencies for engine oil of a known condition.
- Diesel engines it has been desired to also monitor, during real time engine operation the condition of lubricant in compression ignition or Diesel engines.
- the lubricant is blended by the lubricant manufacturer with unique additive systems or constituents to prevent deterioration of the lubricant due to the effects of the products of combustion of Diesel fuel.
- Diesel engine lubricant is formulated with additives having a substantially different chemical composition from that of lubricant formulated for spark ignition engines burning gasoline or other fuels. Accordingly, it has been desired to find techniques and ways of employing impedance spectroscopy to accurately provide an electrical indication, during real time engine operation, of the condition of the lubricant in Diesel engines.
- the present invention employs a probe having a pair of electrodes immersed in the engine lubricant and applies impedance spectroscopy techniques by exciting one probe with a low amplitude alternating current voltage sequentially at relatively high and low frequencies and measuring the current at both frequencies and using the difference in the current as an analog of the impedance change.
- the impedance difference is compared with values measured for samples of Diesel lubricant having known characteristics of additive depletion from a lookup table and from this a percentage RUL determined.
- the method of the present invention utilizes the propensity of the impedance difference (dZ) to increase to a maximum when the fluid is new or partially stressed and the propensity of dZ to decrease from a maximum occurring during moderate stress to its lowest value when the fluid is fully stressed and has reached near zero RUL.
- the method determines the rate of change or slope of the impedance difference ( ⁇ dZ) during a selected sampling interval; and, where ⁇ dZ is positive, the readings are correlated with a first Region of the lookup table of known values of additive depletion; and, where ⁇ dZ is negative from a second Region of the lookup table.
- the tables of known values of fluid condition or RUL are determined individually for each of the parameters (a) - (d) above from laboratory measurements by Fourier Transform Infrared Spectroscopy (FTIR) techniques of lubricant samples taken from Diesel engines at known condition levels of lubricant stressing.
- FTIR Fourier Transform Infrared Spectroscopy
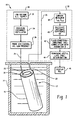
- FIG. 1 is a pictorial and block diagram of the system employing the method of the present invention
- FIGS. 2a, 2b and 2c comprise a block diagram of the signal processing strategy of the method of the present invention
- FIG. 3 is a graph plotting values of POC and dZ for lubricant samples having progressively increased stressed condition
- FIG. 5 is a graph similar to FIG. 3 for TBN or carbonate depletion for progressively stressed lubricant
- FIG. 6 is an FTIR transmittance spectra trace of ZDDP as formulated prior to being added to the lubricant
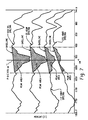
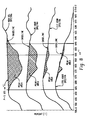
- FIG. 7 is an FTIR transmittance spectra trace of lubricant samples taken from an engine at intervals of increased levels of stressing with the area below the baseline shaded in the frequency range of P-O-C;
- the system of the present invention is indicated generally at 10 which includes a probe indicated generally at 12 having a tubular configuration and comprising an outer pickup or measurement electrode 16 radially spaced from and concentrically surrounding an inner tubular electrode 18, each of which has respectively a connector strip 20, 22 extending axially therefrom for electrical connection thereto.
- An electronic controller 10 has a lead 24 therefrom connected to terminal strip 22 and a lead 26 connected to the terminal strip 20.
- the probe is configured as shown and described in co-pending application Serial No. 10/060,107 Filed January 31, 2002, entitled “Probe Assembly For A Fluid Condition Monitor And Method Of Making Same” published August 5, 2003 as U.S.
- Patent Publication 2003-0141,882 and assigned to the assignee of the present invention.
- other probe configurations may be employed such as planar interdigitated electrodes, or helically configured electrodes as described in the aforesaid U.S. Patents 6,278,281, 6,380,746 and 6,377,052.
- Controller 10 includes a signal generating or excitation section 28 and a signal processing and output section 30.
- the excitation section 28 functions to provide a relatively low amplitude alternating current voltage of not more than about one Volt.
- the probe was excited with 0.750 Volts RMS; however, other voltage levels may be used in order to provide a useable signal-to-noise ratio.
- Section 28 includes the power supply 32 and includes an oscillator 34 which provides a relatively high and low frequency current to a probe excitation circuit 36 which sequentially excites electrode 18 along line 24 at the high and low frequencies.
- the low frequency is chosen at about 30 milliHertz and the high frequency at about 100 Hertz. It will be understood that the low frequency may be varied so long as it is indicative of the electrode surface characteristics and the high frequency varied so long as it is indicative of bulk fluid properties.
- the low frequency is preferably in the range 10 - 100 milliHertz and the high frequency preferably in the range 10-10,000 Hertz.
- the signal processing section receives the probe current along line 26 to the current sensing circuit 38 which provides inputs to computer 40 which calculates the impedance difference dZ.
- Computer 40 provides an input to comparison circuitry 42 which is operative to correlate the impedance difference dZ with known values of a fluid condition parameter X, as will hereinafter be described, which provides an input to computer 44 which determines RUL and provides an output to the display 46.
- the signal processing strategy of the signal generating section 28 and signal processing section 30 of the electronic controller 10 is illustrated wherein upon initiation at step 50, the computer 40 receives a fluid temperature input at step 52 from a temperature sensor (not shown) and proceeds to step 54 to ask whether the temperature of the fluid T f is within minimum and maximum permissible limits T MIN , T MAX . If the determination of step 54 is negative, the system proceeds to hold or stop until the temperature is within the desired limits. When the determination at step 54 is affirmative, the system proceeds to step 56 and the excitation circuitry 36 excites the probe at the high frequency and the current sensor 38 measures the current I HI .
- the system then computes the impedance Z HI at step 58 and proceeds to step 60 where the circuitry 36 excites the probe at the low frequency and sensor 38 measures the current I LO .
- the system then proceeds to step 62 and computes the impedance Z LO from the current measurement I LO .
- the system then proceeds to step 64 and computes the impedance difference ⁇ Z and proceeds to step 66 and takes the absolute value of ⁇ Z as impedance difference dZ.
- step 70 The system then proceeds to step 70 and stores dZ as dZ 1 and then proceeds to step 72 for a predetermined time delay and then proceeds to step 74 and repeats steps 56 through 66 and proceeds to step 76 to store the results as dZ 2 .
- the time delay ⁇ t in step 72 has been found to be satisfactory if set at about two hours; however, any suitable period may be chosen which enables accurate determination of the change in dZ.
- the system through computer 44 then proceeds to step 78 and computes the change ⁇ dZ in dZ.
- step 80 determines whether the computer is negative or the computer proceeds to step 82 and asks whether the absolute value of the slope is equal to or greater than about 0.5. If the determination at step 82 is negative, the system proceeds to step 88.
- step 82 determines whether the negative slope of ⁇ dZ is rather steep. If the determination of step 82 is positive, meaning that the negative slope of ⁇ dZ is rather steep, the computer proceeds to step 83 and selects parameter X from one of the aforesaid parameters and then proceeds to step 84 to determine parameter X from a table of values of X versus dZ from a region II of a table compiled from one of FIGS. 3 through 6. The computer then stores the value determined as X 1 .
- the computer then proceeds to step 94 for a predetermined time delay ⁇ t and then proceeds to step 96 and repeats steps 56 through 90 and stores the result as X 2 at step 98.
- the computer then proceeds to step 100 and computes the rate of decay ⁇ from the difference of X 2 and X 1 divided by ⁇ t.
- the computer then retrieves a stored value of X EOL or the value of the parameter X at the end of the useful life for the lubricant and proceeds to step 104 to compute the remaining useful life (RUL) by subtracting X EOL from X 2 and dividing by the rate of decay ⁇ .
- the computer then outputs a signal to a display at step 106.
- the display may either be a running indicator or an alarm if a threshold level of RUL has been reached.
- the computer when the value of dZ has increased to a level of about twenty percent (20%) of its maximum peak value, the value determining the separation between region one and region two of FIGS. 3 - 6, the computer may be programmed to proceed directly to indicate an RUL of nearly zero.
- a percentage transmission FTIR spectral trace is illustrated for ZDDP in an as-formulated condition prior to blending or addition to the engine lubricant. It will be noted from FIG. 7 that ZDDP undergoes an infrared transmission null at frequencies of 970 cm -1 and 645 cm -1 or, in other words, is completely absorbent at these frequencies. This characteristic of ZDDP has been found to be quite useful in spectroscopy inasmuch as the infrared transmission loss of the lubricant at these frequencies may be treated as an analog or indication of the percentage of the ZDDP remaining or undepleted in the particular sample of lubricant.
- the technique employed utilizes a baseline drawn between the peaks for each sample trace occurring within the frequency band of interest as set forth in Table I. The area formed by the trace under the baseline in the frequency band examined, shown as shaded in FIGS. 7 and 8, is computed and the decrease in the area measured for each sample of known stress level condition.
- the percentage depletion of ZDDP is then known and the sample may be measured with the probe of the present invention and the change in impedance dZ measured and a table of values of percentage depletion as a function of dZ established.
- FIGS. 7 and 8 it will be seen from FIGS. 7 and 8 that if a sample of stress lubricant is analyzed by the aforesaid FTIR technique and the result indicates nearly zero area of the trace under the baseline in the region of observance, there will be nearly no absorbance at the frequency under examination and thus the ZDDP will have been totally depleted.
- a value of the sensor output dZ may be chosen which corresponds to the minimum value of P-O-C in region to representing total depletion of ZDDP; and, this value of dZ may be chosen as the end of life for the lubricant.
- a lookup table of values of dZ as a function of the lubricant condition may be compiled utilizing the spectra at the selected frequencies as an indication of the amount of ZDDP remaining in the lubricant.
- TBN dry acidity TBN (CO3) may also be measured by American Society For Testing Materials (ASTM) standard D4739-2 "Standard Test Method For Base Number Determination By Potentiometric Titration".
- the graphs in FIGS. 3 through 6 are based upon data taken from samples of Diesel engine oil sequentially as the lubricant is progressively stressed as measured by the present technique; and, the value of dZ is computed for the sample according to steps 50 - 70.
- the amount of each of the lubricant blend additives listed in Table I is then determined separately by FTIR laboratory analysis.
- a table of correlated values of dZ for each additive type is then compiled and the data sets may be plotted as has been done in FIGS. 3 - 6.
- the scale on the horizontal or "X" axis in FIGS. 3 through 6 thus represents sequential samples taken at selected intervals in the progressive stressing of the lubricant. It will be understood the zero on the horizontal axis in FIGS.
- One of the additives from the group may then be selected and the data from the table or graph programmed into the computer 40,42 in section 30 of the circuitry 10, thereby enabling real time correlation of dZ with RUL for the lubricant.
- the data for FIGS. 3 - 6 of the present invention was determined from American Petroleum Institute (API) category CH4, CF oil with SAE 25W-40 viscosity rating. It will be understood however that the technique of the present invention may be employed with Diesel lubricants of other API categories (such as CF-4, CG-4 and CF-2 by way of example without limitation and other SAE viscosity ratings such as SAE 30 and SAE 25 W-40 by way of example without limitation.
- API American Petroleum Institute
- computer circuitry 42 may be programmed with a lookup table taken from any one of FIGS. 3 - 6 depending upon which chemical type of blend additive it is desired to track with the monitor. Furthermore, it will be understood that the value of dZ assigned to represent nearly zero RUL may be varied in accordance with engine manufacturers recommendation as to additive depletion; and, thus the threshold of determination at step 83 may be chosen other than 0.2 (20%) of dZ MAX as desired or upon the engine manufacturer's recommendation.
- the present invention thus provides a convenient method of employing impedance spectroscopy to provide an indication of the instantaneous condition of lubricant during real time operation of a Diesel engine.
- the present invention utilizes a probe having spaced electrodes immersed in the lubricant sump with an electronic controller attached to the electrodes such that current measurements, upon low level AC voltage excitation measured sequentially at a relatively high and low frequency, enable an impedance differential to be computed and compared with stored values determined for Diesel lubricant of known condition.
- the electronic controller may then, from the comparison, determine and provide an indication of the remaining useful life of the lubricant or an alarm indication to the engine operator.
Landscapes
- Chemical & Material Sciences (AREA)
- Health & Medical Sciences (AREA)
- Engineering & Computer Science (AREA)
- Life Sciences & Earth Sciences (AREA)
- Analytical Chemistry (AREA)
- General Physics & Mathematics (AREA)
- Pathology (AREA)
- Immunology (AREA)
- General Health & Medical Sciences (AREA)
- Physics & Mathematics (AREA)
- Chemical Kinetics & Catalysis (AREA)
- Biochemistry (AREA)
- Medicinal Chemistry (AREA)
- Oil, Petroleum & Natural Gas (AREA)
- Food Science & Technology (AREA)
- General Chemical & Material Sciences (AREA)
- Electrochemistry (AREA)
- Mechanical Engineering (AREA)
- General Engineering & Computer Science (AREA)
- Lubrication Details And Ventilation Of Internal Combustion Engines (AREA)
- Investigating Or Analyzing Materials By The Use Of Electric Means (AREA)
- Lubricants (AREA)
Abstract
Description
| PARAM. X | Nominal IR Freq. CM-1 | IR Freq. Range CM-1 |
| P-O-C | 970 | 1020 - 912 |
| P = | 655 | 685 - 645 |
| CO3 (TBN) | 860 | 1597 - 1326 |
| | 655, 970 |
Claims (4)
- A method of monitoring the conditions of engine lubricant in real time during operation comprising:(A) immersing a probe (12) with a pair of spaced parallel conductors (16, 18) in the fluid to be monitored;(B) exciting one of said pair of electrodes with an alternating voltage at a first relatively high frequency (56) and exciting said one conductor at a second relatively low frequency (60) and measuring the current at said first and second frequencies (38);(C) computing the bulk fluid impedance at said first frequency (58) and the fluid-electrode interface (surface) impedance at the said second frequency (62) and computing the impedance difference (dZ) (64) therefrom;(D) delaying for a selected time interval (72) and repeating steps (A)-(C) and computing another value of dZ (74, 76);(E) computing the rate of change of dZ (ΔdZ) for a selected time interval (Δt) (78) and determining the value of the remaining useful life (RUL) of the lubricant from the following:(i) determining the value of a physiochemical parameter (X) when ΔdZ is positive from lubricant with known amounts of constituents selected from the group consisting of (a) Phosphorus, Oxygen and Carbon (P-O-C); (b) Phosphorous and double bond Sulphur (P = S); (c) Zincdialkyldithiophosphate (ZDDP); and (d) the Total Base Number TBN by measuring CaCO3 (CO3), from a table of the selected parameter X versus dZ in a first region of the table (90) and determining RUL from a table of RUL versus parameter X (X1) (104);(ii) determining the value of the selected parameter X when ΔdZ (86) is negative from a second region of the table of X versus dZ;(F) repeating steps (B) - (E) after a selected time delay Δt and determining a second value of X (X2) computing the rate of change of X, Ψ = X2 - X1 / Δt (100); and,(G) computing the remaining useful life (RUL) expressed as a percentage by dividing the difference in X from a known XEOL by the rate of change

- The method defined in claim 1, wherein said step (E)(ii) includes determining that ΔdZ has a negative slope greater than about one.
- The method defined in claim 1, wherein the step of exciting one of said electrodes includes applying an alternating current voltage of note more than about one Volt RMS.
- The method defined in claim 1, wherein said step of determining the value of RUL if ΔdZ is negative includes determining if dZ is less than about 25% of dZMAx and if affirmative providing an indication that RUL is near zero.
Applications Claiming Priority (2)
| Application Number | Priority Date | Filing Date | Title |
|---|---|---|---|
| US662588 | 2003-09-15 | ||
| US10/662,588 US6844745B1 (en) | 2003-09-15 | 2003-09-15 | Method of determining the fluid condition of diesel engine lubricant during real time operation |
Publications (2)
| Publication Number | Publication Date |
|---|---|
| EP1515139A2 true EP1515139A2 (en) | 2005-03-16 |
| EP1515139A3 EP1515139A3 (en) | 2005-03-23 |
Family
ID=33565315
Family Applications (1)
| Application Number | Title | Priority Date | Filing Date |
|---|---|---|---|
| EP04020736A Withdrawn EP1515139A3 (en) | 2003-09-15 | 2004-09-01 | Method of determining the fluid condition of diesel engine lubricant during real time operation |
Country Status (9)
| Country | Link |
|---|---|
| US (1) | US6844745B1 (en) |
| EP (1) | EP1515139A3 (en) |
| JP (1) | JP2005091360A (en) |
| KR (1) | KR20050027920A (en) |
| CN (1) | CN1598560A (en) |
| AU (1) | AU2004205345A1 (en) |
| BR (1) | BRPI0404038A (en) |
| CA (1) | CA2481598A1 (en) |
| MX (1) | MXPA04009027A (en) |
Families Citing this family (27)
| Publication number | Priority date | Publication date | Assignee | Title |
|---|---|---|---|---|
| AUPR692201A0 (en) * | 2001-08-09 | 2001-08-30 | Commonwealth Scientific And Industrial Research Organisation | Online fluid contaminant detector |
| US7049831B2 (en) * | 2004-02-16 | 2006-05-23 | Eaton Corporation | Fluid quality control using broad spectrum impedance spectroscopy |
| US6989680B2 (en) * | 2004-02-24 | 2006-01-24 | Eaton Corporation | Detection of coolant contamination in lubricating fluids |
| US6984986B2 (en) * | 2004-02-24 | 2006-01-10 | Eaton Corporation | Situ fluid condition monitoring |
| US7078910B2 (en) * | 2004-03-04 | 2006-07-18 | Eaton Corporation | Fluid formulation evaluation and improvement utilizing broad spectrum impedance spectroscopy |
| US7259575B2 (en) * | 2005-04-08 | 2007-08-21 | The Lubrizol Corporation | Method for on-line fuel-dilution monitoring of engine lubricant |
| US7299682B2 (en) * | 2005-10-14 | 2007-11-27 | The Lubrizol Corporation | Method and apparatus for estimating basicity of a used, all-loss cylinder lubricant |
| US20070289375A1 (en) * | 2006-06-14 | 2007-12-20 | Diba Industries, Inc. | Homogenous Fluid Level Sensing Devices |
| WO2008080108A1 (en) * | 2006-12-22 | 2008-07-03 | Paradigm Sensors, Llc | Impedance spectroscopy (is) methods and systems for characterizing fuel |
| US7940060B2 (en) * | 2007-03-06 | 2011-05-10 | GM Global Technology Operations LLC | Method for measuring the amount of air in a fluid |
| WO2009059189A2 (en) * | 2007-11-02 | 2009-05-07 | Paradigm Sensors Llc | Processing system and method for hand-held impedance spectroscopy analysis device for determining biofuel properties |
| EP2067946B1 (en) * | 2007-12-05 | 2012-07-11 | Iveco Motorenforschung AG | Method and system for dectecting the dilution of the lubricant by the fuel |
| CN101226185B (en) * | 2008-02-18 | 2012-05-30 | 中国人民解放军海军后勤技术装备研究所 | Method for assessing diesel actual abrasion resistance performance |
| DE102008044112A1 (en) * | 2008-11-27 | 2010-06-02 | Robert Bosch Gmbh | Device for removing constituents of an operating fluid for motor vehicles |
| US8710973B2 (en) | 2010-08-18 | 2014-04-29 | GM Global Technology Operations LLC | Automatic engine oil life determination with a factor for oil quality |
| CN102162803A (en) * | 2010-12-10 | 2011-08-24 | 淄博兰雁集团有限责任公司 | On-line detection system for denim fabric dyeing |
| US20130002231A1 (en) * | 2011-07-01 | 2013-01-03 | Amit Bhasin | Electrophoretic breaking rate meter for asphalt emulsions |
| US20130197738A1 (en) * | 2012-02-01 | 2013-08-01 | Afton Chemical Corporation | System and method for determining a lubricant discard interval |
| US8977421B2 (en) | 2012-02-01 | 2015-03-10 | Afton Chemical Corporation | System and method for determining a lubricant discard interval |
| US8965625B2 (en) | 2012-02-01 | 2015-02-24 | Afton Chemical Corporation | System and method for extending a lubricant discard interval |
| CA2891489A1 (en) | 2012-11-19 | 2014-05-22 | Castrol Limited | Container, method and control system |
| US9354221B2 (en) | 2013-04-29 | 2016-05-31 | General Electric Company | Turbomachine lubricating oil analyzer system, computer program product and related methods |
| US9303540B2 (en) | 2013-04-29 | 2016-04-05 | General Electric Company | Turbomachine lubricating oil analyzer apparatus |
| GB201409082D0 (en) | 2014-05-21 | 2014-07-02 | Castrol Ltd | Fluid container |
| US9488612B2 (en) * | 2014-06-04 | 2016-11-08 | Infineum International Limited | Lubricant test method |
| EP3527959B1 (en) * | 2018-02-14 | 2023-11-08 | VEGA Grieshaber KG | Fill level radar with adhesion detector |
| US11092561B2 (en) * | 2018-05-09 | 2021-08-17 | Meas France Sas | Method and system for determining a quality of hydrocarbon fluid |
Family Cites Families (12)
| Publication number | Priority date | Publication date | Assignee | Title |
|---|---|---|---|---|
| US5604441A (en) * | 1995-03-14 | 1997-02-18 | Detroit Diesel Corporation | In-situ oil analyzer and methods of using same, particularly for continuous on-board analysis of diesel engine lubrication systems |
| WO1998046985A1 (en) * | 1997-04-16 | 1998-10-22 | Kaiku Limited | Assessing the composition of liquids |
| US6278281B1 (en) | 1998-12-23 | 2001-08-21 | Eaton Corporation | Fluid condition monitor |
| US6380746B1 (en) | 1999-11-03 | 2002-04-30 | Eaton Corporation | Monitoring fluid condition with a spiral electrode configuration |
| US6377052B1 (en) * | 1999-11-03 | 2002-04-23 | Eaton Corporation | Monitoring fluid condition through an aperture |
| US6509745B1 (en) * | 2000-09-25 | 2003-01-21 | Detroit Diesel Corporation | Method and apparatus for measuring liquid dielectric behavior |
| US6577112B2 (en) * | 2001-03-09 | 2003-06-10 | The Lubrizol Corporation | Method and apparatus for on-line monitoring of quality and/or condition of highly resistive fluids |
| US6433560B1 (en) | 2001-08-31 | 2002-08-13 | Eaton Corporation | Combined fluid condition monitor and fluid level sensor |
| US6590402B2 (en) * | 2001-10-02 | 2003-07-08 | Delphi Technologies, Inc. | Engine oil contamination sensor |
| EP1474676A4 (en) * | 2001-12-20 | 2005-03-09 | Prec Instr Corp | An on-line oil condition sensor system for rotating and reciprocating machinery |
| US6771074B2 (en) * | 2002-01-31 | 2004-08-03 | Eaton Corporation | Probe assembly for a fluid condition monitor and method of making same |
| US6911830B2 (en) * | 2002-08-22 | 2005-06-28 | Delphi Technologies, Inc. | Diesel engine lubricating oil contaminant sensor method |
-
2003
- 2003-09-15 US US10/662,588 patent/US6844745B1/en not_active Expired - Fee Related
-
2004
- 2004-08-31 AU AU2004205345A patent/AU2004205345A1/en not_active Abandoned
- 2004-09-01 EP EP04020736A patent/EP1515139A3/en not_active Withdrawn
- 2004-09-13 KR KR1020040072969A patent/KR20050027920A/en not_active Withdrawn
- 2004-09-14 CA CA002481598A patent/CA2481598A1/en not_active Abandoned
- 2004-09-14 JP JP2004266724A patent/JP2005091360A/en active Pending
- 2004-09-14 BR BR0404038-4A patent/BRPI0404038A/en not_active Application Discontinuation
- 2004-09-15 MX MXPA04009027A patent/MXPA04009027A/en not_active Application Discontinuation
- 2004-09-15 CN CNA2004100778599A patent/CN1598560A/en active Pending
Also Published As
| Publication number | Publication date |
|---|---|
| JP2005091360A (en) | 2005-04-07 |
| BRPI0404038A (en) | 2005-06-07 |
| CN1598560A (en) | 2005-03-23 |
| EP1515139A3 (en) | 2005-03-23 |
| CA2481598A1 (en) | 2005-03-15 |
| US6844745B1 (en) | 2005-01-18 |
| MXPA04009027A (en) | 2005-03-16 |
| AU2004205345A1 (en) | 2005-04-07 |
| KR20050027920A (en) | 2005-03-21 |
Similar Documents
| Publication | Publication Date | Title |
|---|---|---|
| US6844745B1 (en) | Method of determining the fluid condition of diesel engine lubricant during real time operation | |
| US6788072B2 (en) | Apparatus and method for sensing particle accumulation in a medium | |
| US7043402B2 (en) | On-line oil condition sensor system for rotating and reciprocating machinery | |
| KR101730679B1 (en) | Measurement method of degradation/alteration degree of lubricant oil and measurement device thereof | |
| EP0121739B1 (en) | Method and apparatus for evaluating the performance of dielectric substances | |
| US4764258A (en) | Method for evaluating the remaining useful life of a hydrocarbon oil | |
| US4345202A (en) | Method of detecting soot in engine oil using microwaves | |
| JPH0593713A (en) | Perfect oil analysis technique | |
| US4741204A (en) | Measurement of the depletion of basic additives in lubricating oil | |
| CA2488392A1 (en) | Method for analysing a working fluid using impedance spectroscopy | |
| US6850865B2 (en) | Monitoring automatic transmission fluid condition in real time | |
| US6989676B2 (en) | Apparatus and method for sensing particle and water concentrations in a medium | |
| US6839620B1 (en) | Detecting soot during real time operation in diesel engine lubricant | |
| US6989680B2 (en) | Detection of coolant contamination in lubricating fluids | |
| JPS59168322A (en) | Method and device for measuring lubricating oil | |
| CN110470699A (en) | Method and analytical system for determining the quality of an oil | |
| Agoston et al. | Online Application of sensors monitoring lubricating oil properties in biogas engines | |
| Saba et al. | Tandem Technique for Fluid Testing | |
| Ducu et al. | Diagnosing the Operation of a Locomotive Diesel Engine Based on the Analysis of Used Oil in the Period Between Two Technical Revisions | |
| RU2473884C1 (en) | Method of diagnosing machine assemblies based on operating oil parameters | |
| PL239942B1 (en) | Method for determination of the ageing degree of petrols and its application for the assessment of petrols quality |
Legal Events
| Date | Code | Title | Description |
|---|---|---|---|
| PUAI | Public reference made under article 153(3) epc to a published international application that has entered the european phase |
Free format text: ORIGINAL CODE: 0009012 |
|
| PUAL | Search report despatched |
Free format text: ORIGINAL CODE: 0009013 |
|
| AK | Designated contracting states |
Kind code of ref document: A2 Designated state(s): AT BE BG CH CY CZ DE DK EE ES FI FR GB GR HU IE IT LI LU MC NL PL PT RO SE SI SK TR |
|
| AX | Request for extension of the european patent |
Extension state: AL HR LT LV MK |
|
| AK | Designated contracting states |
Kind code of ref document: A3 Designated state(s): AT BE BG CH CY CZ DE DK EE ES FI FR GB GR HU IE IT LI LU MC NL PL PT RO SE SI SK TR |
|
| AX | Request for extension of the european patent |
Extension state: AL HR LT LV MK |
|
| 17P | Request for examination filed |
Effective date: 20050820 |
|
| AKX | Designation fees paid |
Designated state(s): AT BE BG CH CY CZ DE DK EE ES FI FR GB GR HU IE IT LI LU MC NL PL PT RO SE SI SK TR |
|
| STAA | Information on the status of an ep patent application or granted ep patent |
Free format text: STATUS: THE APPLICATION IS DEEMED TO BE WITHDRAWN |
|
| 18D | Application deemed to be withdrawn |
Effective date: 20090401 |