EP1512958B1 - Method for judging graphite texture in gray cast iron, judging program recording medium and judging system - Google Patents
Method for judging graphite texture in gray cast iron, judging program recording medium and judging system Download PDFInfo
- Publication number
- EP1512958B1 EP1512958B1 EP03782901.7A EP03782901A EP1512958B1 EP 1512958 B1 EP1512958 B1 EP 1512958B1 EP 03782901 A EP03782901 A EP 03782901A EP 1512958 B1 EP1512958 B1 EP 1512958B1
- Authority
- EP
- European Patent Office
- Prior art keywords
- graphite
- pieces
- graphite pieces
- spherical
- image
- Prior art date
- Legal status (The legal status is an assumption and is not a legal conclusion. Google has not performed a legal analysis and makes no representation as to the accuracy of the status listed.)
- Expired - Lifetime
Links
Images







Classifications
-
- G—PHYSICS
- G01—MEASURING; TESTING
- G01N—INVESTIGATING OR ANALYSING MATERIALS BY DETERMINING THEIR CHEMICAL OR PHYSICAL PROPERTIES
- G01N21/00—Investigating or analysing materials by the use of optical means, i.e. using sub-millimetre waves, infrared, visible or ultraviolet light
- G01N21/84—Systems specially adapted for particular applications
- G01N21/88—Investigating the presence of flaws or contamination
-
- G—PHYSICS
- G06—COMPUTING OR CALCULATING; COUNTING
- G06T—IMAGE DATA PROCESSING OR GENERATION, IN GENERAL
- G06T7/00—Image analysis
- G06T7/0002—Inspection of images, e.g. flaw detection
- G06T7/0004—Industrial image inspection
-
- G—PHYSICS
- G06—COMPUTING OR CALCULATING; COUNTING
- G06T—IMAGE DATA PROCESSING OR GENERATION, IN GENERAL
- G06T2207/00—Indexing scheme for image analysis or image enhancement
- G06T2207/10—Image acquisition modality
- G06T2207/10056—Microscopic image
-
- G—PHYSICS
- G06—COMPUTING OR CALCULATING; COUNTING
- G06T—IMAGE DATA PROCESSING OR GENERATION, IN GENERAL
- G06T2207/00—Indexing scheme for image analysis or image enhancement
- G06T2207/30—Subject of image; Context of image processing
- G06T2207/30108—Industrial image inspection
- G06T2207/30136—Metal
Definitions
- the present invention relates to a method capable of analyzing an image of a flake graphite structure, a eutectic graphite structure, or a mixture thereof of a gray cast iron to numerically evaluate intrinsic properties of the graphite structure such as shape (length, thickness, etc.), distribution, and density of the graphite pieces quantitatively, easily, and accurately, and further to a recording medium storing a program for carrying out the method and an evaluation system.
- HECHT R. L. ET AL "Effect of graphite flake morphology on the thermal diffusivity of gray cast irons used for automotive brake discs", Journal OF MATERIAL SCIENCE 1999 OCT KLUWER ACADEMIC PUBLISHERS, Vol. 34, No. 19, October 1999, pages 4775-4781 discloses a quantification of graphite flake morphology of various cast iron samples with an image analysis technique.
- an image analysis is performed with an optical microscope and an image analysis software.
- the average graphite shape perimeter, P is divided by the area enclosed, A, and thus a surface-to-volume value is obtained. Further, an aspect ratio, a ratio between a major axis and a minor axis of the graphite flake is calculated.
- the microstructural characteristics are then assigned to different flake types and size classes.
- the present invention has been completed in view of the above object to provide a technology capable of evaluating a graphite structure of a gray cast iron in numerical terms, quantitatively, easily, and accurately, particularly by efficiently using a known image analysis apparatus such as a graphite spheroidizing ratio measuring apparatus.
- the gray cast iron is generally an iron alloy containing 3 to 4% of carbon and 2 to 3% of silicon, and has a structure of the graphite pieces with various shape and size dispersed in an iron matrix.
- carbon in the cast iron is converted into graphite carbon, combined carbon forming cementite, and a trace of carbon forming a solid solution with the iron matrix.
- the graphite pieces which can be observed by examining a polished cast iron sample using a microscope, are composed of the graphite carbon.
- the cementite can be visually observed in pearlite when the polished sample is corroded.
- the graphite structure of the cast iron depends on the state of the graphite carbon and the combined carbon with disregard to the trace solid solution carbon, which cannot be visually observed.
- the ratio of the combined carbon is generally within a range of approximately 0.4 to 0.9%, and the amount of the combined carbon is hardly changed even when the total carbon amount is increased.
- a value calculated by subtracting the amount of the combined carbon from the total carbon amount is the amount of the graphite carbon.
- the amount of the graphite carbon is increased with increase of the total carbon amount, and as a result, the area ratio of the graphite pieces in the iron matrix increases.
- the shape and distribution of the graphite carbon formed in the solidifying process depend mainly on conditions of mixing a matrix metal, melting, teeming, a molten metal treatment, and molding.
- the graphite structure is significantly changed depending on the conditions even if the chemical composition is not modified.
- the graphite pieces are grown to have a large length in thick portions solidified at a low rate, and the graphite pieces are insufficiently grown to be short in thin portions and molten metal stagnant portions solidified at a high rate.
- the invention has been achieved based on an assumption that the state of the graphite structure is closely related with the number of the graphite pieces forming the structure.
- HECHT R. L. ET AL "Effect of graphite flake morphology on the thermal diffusivity of gray cast irons used for automotive brake discs", Journal OF MATERIAL SCIENCE 1999 OCT KLUWER ACADEMIC PUBLISHERS, Vol. 34, No. 19, October 1999, pages 4775-4781 , there is still room for an improvement of the method for evaluating the graphite structure.
- An aspect of the invention described in claim 1 is a method for quantitatively evaluating a graphite structure of a gray cast iron by an image analysis apparatus, characterized by comprising the steps of analyzing a magnified image of the graphite structure, thereby extracting non-spherical graphite pieces of a particular size class contained in the graphite structure to calculate the number and areas of the non-spherical graphite pieces; calculating a thick and thin degree expressing a degree of thickness of the non-spherical graphite pieces based on the number and the areas; and outputting the number and the thick and thin degree of the non-spherical graphite pieces in combination as an evaluation result.
- the magnified image for the image analyzing step may be taken from a microscopic screen image of the graphite structure by an image pickup device (CCD) such as a video camera and a digital camera as described in claim 2. Further, the magnified image may be an image taken by a still camera, which may be read by a scanner, etc., in some cases.
- CCD image pickup device
- the magnified image may be an image taken by a still camera, which may be read by a scanner, etc., in some cases.
- the magnified image is preprocessed to except and eliminate graphite pieces in contact with a frame of the magnified image before extracting the non-spherical graphite pieces of the particular size class, and the number of the extracted non-spherical graphite pieces is corrected by the steps of counting the graphite pieces to be excepted and eliminated; classifying graphite pieces other than the graphite pieces to be excepted and eliminated into a plurality of size classes containing the particular size class, to count a number of the other graphite pieces of each size class; and distributing the graphite pieces to be excepted and eliminated into the size classes proportionally based on a ratio between the numbers of the other graphite pieces, to add a number of the distributed graphite pieces to the numbers of the other graphite pieces.
- an aspect of the invention described in claim 5 is a system for quantitatively evaluating a graphite structure of a gray cast iron by image analysis.
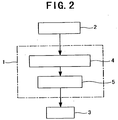
- the system comprises an image analysis unit 1, an image input unit 2 for inputting a magnified image of the graphite structure into the image analysis unit 1, and a display unit 3 for indicating an analysis result.
- the system is characterized in that the image analysis unit 1 comprises a graphite piece number/area calculating unit 4 for analyzing the magnified image of the graphite structure, thereby extracting non-spherical graphite pieces of a particular size class contained in the graphite structure to calculate the number and areas of the non-spherical graphite pieces, and a thick and thin degree calculating unit 5 for calculating a thick and thin degree expressing a degree of thickness of the non-spherical graphite pieces based on the number and the areas, and the number and the thick and thin degree of the non-spherical graphite pieces are visually indicated on the display unit 3 in combination as an evaluation result.
- the image analysis unit 1 comprises a graphite piece number/area calculating unit 4 for analyzing the magnified image of the graphite structure, thereby extracting non-spherical graphite pieces of a particular size class contained in the graphite structure to calculate the number and areas of the non-spherical graphite pieces, and a
- the magnified image is preprocessed to except and eliminate graphite pieces in contact with a frame of the magnified image before extracting the non-spherical graphite pieces of the particular size class, and the image analysis unit comprises a unit 13 ( Fig.
- the graphite structure can be numerically and quantitatively evaluated based on the number of the graphite pieces and the thick and thin degree related therewith.
- the graphite structure can be quantitatively evaluated based on the number of the graphite pieces and the related thick and thin degree, numerically, easily, and accurately.
- the invention is advantageous in that highly reliable evaluation results are obtained without differences between individuals and the actual graphite structure can be easily imagined from the evaluation results.
- Figs. 1 to 3 show a preferred embodiment of the present invention.
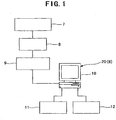
- Fig. 1 schematically shows components of an evaluation system of the invention
- Fig. 2 shows a schematic functional block diagram thereof.
- the system is composed of an image analysis unit 1 of an image analysis apparatus 20 having a personal computer 6 as a main component; an optical metallurgical microscope 7; an image input unit (an image pickup unit) 2 of a CCD camera (a video camera) 8; etc.
- An image taken by the CCD camera 8 is input into the image analysis apparatus 20 through an input port 9.
- the personal computer 6 comprises a memory device such as a hard disk in addition to CPU, ROM, and RAM with a previously installed prescribed image analysis software, and further comprises an input unit of a not shown keyboard or mouse, a display unit 3 of a CRT display 10, an output unit of a printer 11, an external memory device 12 such as MO, etc.
- a memory device such as a hard disk in addition to CPU, ROM, and RAM with a previously installed prescribed image analysis software, and further comprises an input unit of a not shown keyboard or mouse, a display unit 3 of a CRT display 10, an output unit of a printer 11, an external memory device 12 such as MO, etc.
- An evaluation object graphite structure of a gray cast iron is magnified 100 times by the metallurgical microscope 7, and a magnified microscopic image is taken by the CCD camera 8 and input into the image analysis apparatus 20.
- 640 ⁇ 480 pixels (picture elements) of the input 100 times magnified microscopic image is subjected to the image analysis.
- Step S2 of Fig. 3 After the image is input into the image analysis apparatus 20 as shown in Step S1 of Fig. 3 , the input image is binarized into bright and dark to indicate an iron matrix by white color and graphite pieces by black color (Step S2). At the same time, graphite pieces that intersect (cross) or are in contact with the frame of the image are eliminated and excepted (Step S3). Then, in Step S4, only non-spherical graphite pieces having a graphite area ratio of less than 54% are extracted and counted.
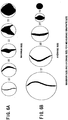
- Figs. 6A and 6B may be used for determining size of each graphite piece to be extracted.
- One is a maximum size method shown in Fig. 6A in which the longest portion of the graphite piece is inscribed in a circle and the diameter of the circle is considered as the size of the graphite piece regardless of the area of the graphite piece.
- the other is an average size method shown in Fig. 6B in which a diameter of a circle having an area equal to that of the graphite piece is considered as the size of the graphite piece regardless of the length of the graphite piece.
- graphite pieces with an average size of 5 ⁇ m or more are extracted.
- the non-spherical graphite pieces having a graphite area ratio of less than 54% and an average size of 5 ⁇ m or more are extracted, and the number of the extracted non-spherical graphite pieces is counted and indicated.
- Graphite pieces with a maximum size (a maximum length) of 10 ⁇ m or more may be extracted without the average size method, and only graphite pieces with a maximum size of 10 ⁇ m or more and an average size of 5 ⁇ m or more may be extracted by using the two methods in combination.
- An example of a state of an extracted graphite piece structure is shown in the upper left of Fig. 13 , the number of the detected graphite pieces being 90 for instance.
- the median of lengths 50 to 150 ⁇ m is 100 ⁇ m, whereby the area of the graphite piece with the median length of 100 ⁇ m is 1006 ⁇ m 2 .
- an assumptive graphite piece with a maximum length (a maximum size) of 100 ⁇ m representative of the graphite pieces with a length of 50 ⁇ m or more and less than 150 ⁇ m is obtained from the shown data, the area of the assumptive graphite piece being 1006 ⁇ m 2 .
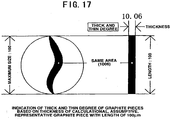
- a value of 10.06 is obtained by dividing the area 1006 ⁇ m 2 by the length 100 ⁇ m as shown in Fig. 17 , and the obtained value is considered as the thick and thin degree (Step S6 of Fig. 3 ) .
- the thick and thin degree corresponds to a width of a rectangle having the same area and the length of 100 ⁇ m, and can provide a practical image of the graphite structure.
- the width 10.06 of the assumptive graphite piece is rounded to be 10.1, and visually shown with the number 90 of the detected graphite pieces as 90 (10.1) in form of "the number of the detected graphite pieces (the thick and thin degree) " (Step S7 of Fig. 3 ).
- the form of the graphite structure is indicated with the thick and thin degree of the graphite components. It should be noted that a series of the above arithmetic processing may be carried out in the image analysis apparatus 20 shown in Fig. 2 .
- a conventional graphite spheroidizing ratio measuring apparatus is used to verify appropriateness and reasonableness of the method of evaluating the graphite structure of the gray cast iron comprising the thick and thin degree evaluation using a 2- or 3-digit value.
- Fig. 4 shows steps of a measurement using a widely known graphite spheroidizing ratio measuring apparatus.
- the graphite spheroidizing ratio measurement all the graphite pieces in the input image are distinguished based on a predetermined size and counted regardless of whether graphite pieces are spherical or non-spherical.
- a structure of flake-like or eutectic graphite pieces was quantitatively evaluated by utilizing this counting function.
- the 640 ⁇ 480 pixels (picture elements) of the 100 times magnified microscopic image input by the video camera 8 (the image pickup device such as a CCD) of Fig. 1 is used as an object of image analysis.
- 1 pixel 1 ⁇ m as describe above.
- An example of the analysis results is shown in Fig. 5 , the numbers of the detected graphite pieces of different spherical or non-spherical (flake-like) shapes according to JIS being separately indicated.
- the two methods of the maximum size method and the average size method can be used for determining the size of each graphite piece to be extracted.
- the graphite spheroidizing ratio measurement is carried out by the maximum size method.
- the two methods are meaningful in some degree, whereby both of the maximum size method and the average size method are used in combination herein.
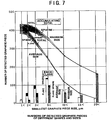
- Fig. 7 shows a result of evaluating the middle graphite structure to measure numbers of graphite pieces of different shapes and sizes as an example.
- the graphite pieces of several size classes were extracted.
- the graphite pieces were classified into seven size classes of 1 ⁇ m or more, 2 ⁇ m or more, 3 ⁇ m or more, 5 ⁇ m or more, 10 ⁇ m or more, 15 ⁇ m or more, and 20 ⁇ m or more with respect to both of the maximum size and the average size.
- the results were shown as numbers of the detected graphite pieces of the size classes, accumulating total numbers, and numbers of the detected graphite pieces by the spherical or non-spherical shapes.
- the graphite piece number obtained by using the maximum size method was larger and the graphite piece number obtained by using the average size method was smaller in each relatively larger size class.
- the graphite piece number obtained by using the average size method was larger and the graphite piece number obtained by using the maximum size method was smaller. This is reasonable for the above-described definitions of the maximum size and the average size.
- the graphite pieces of the size class of 1 ⁇ m or more were counted, substantially all the graphite pieces in the image were detected regardless of the shape, and the total number of the graphite pieces measured by using the maximum size method was about 433, approximately the same as the number measured by using the average size method, about 436.
- the results of measuring the other two samples of the coarse graphite structure and the eutectic graphite structure are not shown.
- the number of the detected graphite pieces of the size class of 1 ⁇ m or more was about 211 in the maximum size method and about 223 in the average size method.
- the number of the detected graphite pieces of the size class of 1 ⁇ m or more was about 1172 in the maximum size method and about 1176 in the average size method.
- the results showed the same tendency as those of the middle graphite structure except for this difference.
- graphite pieces of another sample was divided into maximum size classes of 10 ⁇ m or more and less than 10 ⁇ m or into average size classes of 5 ⁇ m or more and less than 5 ⁇ m, to observe differences between the divided graphite structures.
- Fig. 8 shows the result of dividing the graphite structure into the maximum size classes.
- the maximum size class of less than 10 ⁇ m the most of the detected 134 graphite pieces were point-like, granular, or nubbly, it was impossible to judge whether the pieces were spherical or non-spherical by visual observation, and there was a possibility that a part of the detected pieces was slag or rust in actuality.
- the impression or image of the graphite structure was formed by the graphite pieces with the maximum size of 10 ⁇ m or more, and the graphite pieces with the maximum size of less than 10 ⁇ m were considered as noise not to affect the impression.
- the same observation results were obtained also in the case where the graphite pieces were divided into the average size classes of 5 ⁇ m or more and less than 5 ⁇ m though not shown.
- An object of the invention is to differentiate graphite structures; thereby clarifying differences between the structures.
- the point-like or granular graphite pieces having the maximum size of less than 10 ⁇ m or the average size of less than 5 ⁇ m do not affect the impression of the entire structure, to be nothing but noise. Therefore, the following observations cover only the non-spherical graphite pieces with the maximum size of 10 ⁇ m or more or the average size of 5 ⁇ m or more.
- the results are shown in Fig. 9 .
- the relations between the graphite structure states and the numbers of the detected graphite pieces are shown in the order of the structure densities from the longer flake graphite structures to the minute eutectic graphite structures.
- Data obtained by the maximum size method (dashed lines) and data obtained by the average size method (solid lines) are overlapped. It is clear from the results that the number of the graphite pieces with the average size of 5 ⁇ m or more and the number of the graphite pieces with the maximum size of 10 ⁇ m or more have the most linear relationship with the densities of the graphite structures.
- some of the nubbly, granular, or nearly point-like graphite pieces which have a length smaller than the predetermined maximum size to be removed from the measurement (or detection or extraction) in the maximum size method, have an area more than the predetermined average size.
- minuter graphite structures are more difficult to detect the differences therebetween than structures of relatively larger graphite pieces. It is remarkably preferred that the numbers of the graphite pieces are more precisely obtained even in the case of such minuter graphite structures, and as the conclusion, it is reasonable that the size of the smallest graphite piece to be extracted is determined using not the maximum size method but the average size method to evaluate the graphite structure based on the number of the graphite components.
- Fig. 11 shows a relation between the micrographs and the numbers of the detected flake graphite pieces of the above ten samples of Nos. 1 to 10 as a further example. It is clear that the form of the graphite pieces in each structure has a certain correlation with the number of the detected graphite pieces.
- the samples of Nos. 1 to 10 are shown as K-1 to K-10, and the numbers of the detected non-spherical (flake-like) graphite pieces are shown in parentheses.
- the graphite structures shown in Fig. 12 are different in the thick and thin degrees of the graphite pieces as is clear from the graphite area ratios though they has the same detected graphite piece number of 90.
- the gray cast irons having the different structures are naturally different in mechanical properties, etc. Thus, it must be said that the method of evaluating the graphite structure is not perfect without taking the thick and thin degree into account.
- the simplest is a method comprising comparing the total graphite areas of the structures having the same graphite piece numbers, or a method comprising comparing average areas of the graphite pieces, which are each obtained by dividing the total graphite area by the graphite piece number, and the methods are effective to some extent.
- the structures have different size distributions of the graphite pieces though they have the same graphite piece numbers, whereby the methods of simply comparing the areas of the graphite pieces are not always appropriate.
- the structure having the thick and thin degree of 10.1 shown in the upper left is divided by distributing the graphite pieces into 3 maximum size classes of 10 ⁇ m or more and less than 50 ⁇ m, 50 ⁇ m or more and less than 150 ⁇ m, and 150 ⁇ m or more, and shown in Fig. 13 .
- the upper left of Fig. 13 is the same as that of Fig. 12 .
- the impression of swelling of the graphite pieces in the graphite structure mainly depends on the graphite pieces having a maximum length of 50 ⁇ m or more and less than 150 ⁇ m.
- a plurality of graphite pieces may be linked and recognized as one graphite piece, and the linkage is remarkably increased among the graphite pieces having the maximum length of 150 ⁇ m or more as shown in Fig. 14 .
- the graphite pieces having the maximum length of 150 ⁇ m or more are desirably excepted to prevent the miss-recognition.
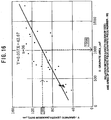
- the maximum sizes (the maximum lengths) and the areas of the above graphite pieces of 50 ⁇ m or more and less than 150 ⁇ m are measured and shown together in Fig. 15 , and the distribution of the graphite pieces is shown as a graph in Fig. 16 .
- An area 1006 ⁇ m 2 of a graphite piece having the median 100 ⁇ m of the lengths can be obtained from Figs. 15 and 16 .
- the assumptive graphite piece with the maximum length (the maximum size) of 100 ⁇ m which may be representative of the graphite pieces, is obtained from the data of the graphite pieces of 50 ⁇ m or more and less than 150 ⁇ m, the area of the assumptive graphite piece is calculated to be 1006 ⁇ m 2 , and a value 10.06 is obtained by dividing the area 1006 ⁇ m 2 by the length 100 ⁇ m as shown in Fig. 17 .
- the value corresponds to the width of the rectangle having the same area and the length of 100 ⁇ m, and can provide a practical image of swelling.
- the width 10.06 of the assumptive graphite piece is rounded to be 10.1, and shown with the number 90 of the detected graphite pieces as 90 (10.1), whereby the thick and thin degree of the graphite components is indicated with the form of the graphite structure.
- Figs. 20 to 24 show a second embodiment of the invention. As shown in the flowchart of Fig.
- the graphite pieces which cross or are in contact with the frame of the magnified image for the image analysis, are not measuring objects to be excepted and eliminated in the preprocessing step regardless of whether the graphite pieces are spherical or non-spherical (See, Step S3 of Figs. 3 and 20 ) .
- the graphite pieces in contact with the frame are excepted and eliminated because they cannot be examined with respect to shape and size of the unshown portions other than the portions shown in the image, and this procedure is unavoidable for the image analysis.
- the graphite spheroidizing ratio can be obtained by measuring the graphite pieces remaining in the frame without serious practical problems.
- the flake graphite structure of the gray cast iron is quantitatively evaluated based on a graphite component piece number, whereby it is never preferred from the viewpoint of the evaluation accuracy that the important graphite piece number is different from the actual one.
- Fig. 21 shows a comparison of structures observed before and after excepting and eliminating graphite pieces which cross or are in contact with a frame of an image (a measurement frame).
- a measurement frame a frame of an image
- the graphite pieces in contact with the frame are excepted and eliminated, there are conspicuous empty spaces in the vicinity of the frame, as shown in the right of Fig. 21 . Only the graphite pieces remaining within the frame are used as the measurement objects, and as a result, the analyzed graphite structure is partly different from the actual structure though the structures are similar.
- the gray cast iron has a content of the thin long graphite pieces much higher than that of a spherical graphite cast iron containing spherical or nubbly graphite pieces.
- the longer flake graphite pieces are more likely to come into contact with the image frame.
- the graphite piece number becomes smaller as the graphite pieces are longer, and thus the graphite structure containing the longer graphite pieces has a higher ratio of the excepted and eliminated graphite pieces in contact with the frame.
- FIG. 22 A specific conspicuous example is shown in Fig. 22 , and the measuring object graphite structure is made very different from the original by excepting and eliminating more than half of the present graphite pieces as shown in the right of the Fig. 22 .
- a structure of extremely long graphite pieces is used in this example, and such a large difference is not observed in common FC-250 graphite structures.
- so-called A-type graphite structures by using an image of 640 ⁇ 480 ⁇ m, approximately 5 to 20% of the graphite pieces are in contact with the frame to be excepted and eliminated unavoidably.
- a graphite structure extremely similar to the original structure with the entire graphite pieces can be reproduced while taking account of the number of the graphite pieces in contact with the frame to be excepted and eliminated by the steps of counting the graphite pieces in contact with the frame to be excepted and eliminated; classifying the graphite pieces remaining in the frame into a plurality of size classes to count the number of the graphite pieces of each size class; calculating the distribution ratio between the numbers of the remaining graphite pieces of the size classes; and distributing the graphite pieces to be excepted and eliminated into the size classes proportionally based on the ratio, to add a number of the distributed graphite pieces to the above numbers.
- Fig. 23 shows a specific example of the steps of Fig. 20
- Steps S1 to S3 of Fig. 20 are equal to those of Fig. 3 .
- the non-spherical graphite pieces having the graphite area ratio of less than 54% and the average size of 5 ⁇ m or more are extracted and separated from the graphite pieces of less than 5 ⁇ m, and the numbers of the classified non-spherical graphite pieces are counted or calculated in Step S4.
- the number of the graphite pieces, which cross or are in contact with the frame of the image to be excepted and eliminated, is 32
- the number of the graphite pieces of less than 5 ⁇ m in the frame is 26
- the number of the graphite pieces of 5 ⁇ m or more is 148.
- the 32 graphite pieces to be excepted and eliminated are classified based on the ratio of the number 26 of the graphite pieces of less than 5 ⁇ m and the number 148 of the graphite pieces of 5 ⁇ m or more remaining in the frame.
- the number 32 of the graphite pieces to be excepted and eliminated is divided into 5 and 27 proportionally based on the ratio of 26: 148 .
- the number 27 is added to the number 148 of the graphite pieces of 5 ⁇ m or more remaining in the frame, thereby correcting the number into 175.
- a virtual graphite structure index of 148 which does not depend on the number of the graphite pieces in contact with the frame to be excepted and eliminated, and a true graphite structure index of 175 approximate to the actual value, which is corrected by proportionally distributing the graphite pieces to be excepted and eliminated, are obtained as the numbers of the graphite pieces with the average size of 5 ⁇ m or more to be extracted.
- Steps S5 and S6 are calculated in Steps S5 and S6 and visually shown together with the above obtained true graphite structure index as 175 (10.1) in Step S7 as the case of Fig. 3 .
- a series of the above arithmetic processing may be carried out in the image analysis apparatus shown in Fig. 24 .
- the apparatus shown in Fig. 24 comprises a unit 13 for proportionally adding the number of the graphite pieces in contact with the image frame to be excepted, and is thereby different from the apparatus shown in Fig. 2 .
- the number of the extracted non-spherical graphite pieces of the particular size class is corrected by proportionally distributing the graphite pieces, which cross or are in contact with the frame of the image to be excepted and eliminated, whereby the accuracy of the graphite structure image analysis can be further improved to provide the highly reliable evaluation results.
Landscapes
- Engineering & Computer Science (AREA)
- Physics & Mathematics (AREA)
- General Physics & Mathematics (AREA)
- Chemical & Material Sciences (AREA)
- Biochemistry (AREA)
- Theoretical Computer Science (AREA)
- Health & Medical Sciences (AREA)
- Life Sciences & Earth Sciences (AREA)
- Quality & Reliability (AREA)
- Analytical Chemistry (AREA)
- Computer Vision & Pattern Recognition (AREA)
- General Health & Medical Sciences (AREA)
- Immunology (AREA)
- Pathology (AREA)
- Length Measuring Devices By Optical Means (AREA)
- Investigating And Analyzing Materials By Characteristic Methods (AREA)
- Image Analysis (AREA)
- Image Processing (AREA)
- Investigating Or Analysing Materials By Optical Means (AREA)
Description
- The present invention relates to a method capable of analyzing an image of a flake graphite structure, a eutectic graphite structure, or a mixture thereof of a gray cast iron to numerically evaluate intrinsic properties of the graphite structure such as shape (length, thickness, etc.), distribution, and density of the graphite pieces quantitatively, easily, and accurately, and further to a recording medium storing a program for carrying out the method and an evaluation system.
- Known technologies in this field are described, for example, in
JP-A-2002-162348 - The above conventional technologies are the most promising methods in practical use among the known graphite structure evaluation methods. However, in the technologies, a resultant graph must be directly read to obtain final evaluation results, whereby the technologies are disadvantageous in that there are often differences between individuals in the results and that it is difficult to imagine the graphite structure by the results, thus there being still room for improvement.
- HECHT R. L. ET AL: "Effect of graphite flake morphology on the thermal diffusivity of gray cast irons used for automotive brake discs", Journal OF MATERIAL SCIENCE 1999 OCT KLUWER ACADEMIC PUBLISHERS, Vol. 34, No. 19, October 1999, pages 4775-4781 discloses a quantification of graphite flake morphology of various cast iron samples with an image analysis technique. For the quantification of the structure, size and shape of the graphite flakes, an image analysis is performed with an optical microscope and an image analysis software. In order to estimate the properties of the graphite from a two-dimensional image, the average graphite shape perimeter, P, is divided by the area enclosed, A, and thus a surface-to-volume value is obtained. Further, an aspect ratio, a ratio between a major axis and a minor axis of the graphite flake is calculated.
The microstructural characteristics are then assigned to different flake types and size classes. - In said prior art document it is shown that the graphite flake morphology and geometry affect the thermal diffusivity, and especially that the diffusivity linearly increases with increasing flake length.
- With the method described in said prior art document, it takes a long time to evaluate the structure of the graphite flakes in each sample. Each flake observed in a microscopic image of the sample has to be evaluated to obtain an average flake length and maximum flake length. After the specification of the average flake length and the maximum flake length, the average surface-to-volume ratio can be calculated for each specific sample. The surface-to-volume ratio can then be assigned to the specific gray cast iron properties.
- Further, it is known an estimation technique of the shape of graphite particles on the basis of the shape factors from ISHIJIMA KENJI ET AL; "Gazo joho shori system ni yoru kinzoku sozai no teiryoka ni kansuru kenkyu (second report)", TOCHIGI-KEN KOGYO SHINKEN KENKYU KIKAN KENKYU SHUROKU Vol. 1988, October 1989, pages 230 - 237.
A further technique for characterization of the graphite in cast irons is also known from LU S-Z ET AL: "An application of fractal geometry to complex microstructures: Numerical characterization of graphite in cast irons", ACTA METALLURGICA & MATERIALIEN, PERGAMON / ELSEVIER SCIENCE LTD, GB, vol. 42, no. 12,1 December 1994 (1994-12-01), pages 4035-4047. - The present invention has been completed in view of the above object to provide a technology capable of evaluating a graphite structure of a gray cast iron in numerical terms, quantitatively, easily, and accurately, particularly by efficiently using a known image analysis apparatus such as a graphite spheroidizing ratio measuring apparatus.
- Various graphite structures in gray cast irons are identified based on shape, size, length, number, and thickness of graphite pieces, density and orientation of distribution of the graphite pieces, etc. The state of the graphite structure is closely related with the number of the graphite pieces forming the structure, and therefore, the state of the graphite structure can be estimated when the number of the graphite pieces is obtained.
- The gray cast iron is generally an iron alloy containing 3 to 4% of carbon and 2 to 3% of silicon, and has a structure of the graphite pieces with various shape and size dispersed in an iron matrix. When a cast iron is solidified, carbon in the cast iron is converted into graphite carbon, combined carbon forming cementite, and a trace of carbon forming a solid solution with the iron matrix. The graphite pieces, which can be observed by examining a polished cast iron sample using a microscope, are composed of the graphite carbon. The cementite can be visually observed in pearlite when the polished sample is corroded. The graphite structure of the cast iron depends on the state of the graphite carbon and the combined carbon with disregard to the trace solid solution carbon, which cannot be visually observed.
- In the case of a gray cast iron having a thickness of 10 to 30 mm, the ratio of the combined carbon is generally within a range of approximately 0.4 to 0.9%, and the amount of the combined carbon is hardly changed even when the total carbon amount is increased. Thus, a value calculated by subtracting the amount of the combined carbon from the total carbon amount is the amount of the graphite carbon. The amount of the graphite carbon is increased with increase of the total carbon amount, and as a result, the area ratio of the graphite pieces in the iron matrix increases.
- The shape and distribution of the graphite carbon formed in the solidifying process depend mainly on conditions of mixing a matrix metal, melting, teeming, a molten metal treatment, and molding. The graphite structure is significantly changed depending on the conditions even if the chemical composition is not modified. As a general tendency, the graphite pieces are grown to have a large length in thick portions solidified at a low rate, and the graphite pieces are insufficiently grown to be short in thin portions and molten metal stagnant portions solidified at a high rate.
- Meanwhile, since the amount of the graphite carbon is constant, a carbon amount of each graphite piece becomes larger and the number of the graphite pieces becomes smaller as the graphite pieces are longer. On the other hand, the number of the graphite pieces becomes larger as the graphite pieces are shorter.
- Accordingly, the invention has been achieved based on an assumption that the state of the graphite structure is closely related with the number of the graphite pieces forming the structure.
In view of HECHT R. L. ET AL: "Effect of graphite flake morphology on the thermal diffusivity of gray cast irons used for automotive brake discs", Journal OF MATERIAL SCIENCE 1999 OCT KLUWER ACADEMIC PUBLISHERS, Vol. 34, No. 19, October 1999, pages 4775-4781, there is still room for an improvement of the method for evaluating the graphite structure. - The aforesaid problem is solved with a method defined in
claim 1. - Further, preferred embodiments are defined in the
dependent claims - According to a further aspect, it is provided a computer-readable recording medium, which is defined in
claim 4. - Additionally, it is also provided a system for quantitatively evaluating a graphite structure of a gray cast iron as defined in
claim 5. A further preferred embodiment of said system is defined inclaim 6. - An aspect of the invention described in
claim 1 is a method for quantitatively evaluating a graphite structure of a gray cast iron by an image analysis apparatus, characterized by comprising the steps of analyzing a magnified image of the graphite structure, thereby extracting non-spherical graphite pieces of a particular size class contained in the graphite structure to calculate the number and areas of the non-spherical graphite pieces; calculating a thick and thin degree expressing a degree of thickness of the non-spherical graphite pieces based on the number and the areas; and outputting the number and the thick and thin degree of the non-spherical graphite pieces in combination as an evaluation result. - The magnified image for the image analyzing step may be taken from a microscopic screen image of the graphite structure by an image pickup device (CCD) such as a video camera and a digital camera as described in
claim 2. Further, the magnified image may be an image taken by a still camera, which may be read by a scanner, etc., in some cases. - In this case, it is preferred from the viewpoint of improving evaluation accuracy that, as described in
claim 3, the magnified image is preprocessed to except and eliminate graphite pieces in contact with a frame of the magnified image before extracting the non-spherical graphite pieces of the particular size class, and the number of the extracted non-spherical graphite pieces is corrected by the steps of counting the graphite pieces to be excepted and eliminated; classifying graphite pieces other than the graphite pieces to be excepted and eliminated into a plurality of size classes containing the particular size class, to count a number of the other graphite pieces of each size class; and distributing the graphite pieces to be excepted and eliminated into the size classes proportionally based on a ratio between the numbers of the other graphite pieces, to add a number of the distributed graphite pieces to the numbers of the other graphite pieces. - Further, an aspect of the invention described in
claim 5 is a system for quantitatively evaluating a graphite structure of a gray cast iron by image analysis. As shown inFig. 2 , the system comprises animage analysis unit 1, animage input unit 2 for inputting a magnified image of the graphite structure into theimage analysis unit 1, and adisplay unit 3 for indicating an analysis result. The system is characterized in that theimage analysis unit 1 comprises a graphite piece number/area calculating unit 4 for analyzing the magnified image of the graphite structure, thereby extracting non-spherical graphite pieces of a particular size class contained in the graphite structure to calculate the number and areas of the non-spherical graphite pieces, and a thick and thindegree calculating unit 5 for calculating a thick and thin degree expressing a degree of thickness of the non-spherical graphite pieces based on the number and the areas, and the number and the thick and thin degree of the non-spherical graphite pieces are visually indicated on thedisplay unit 3 in combination as an evaluation result. - Further, it is preferred in view of the method according to
claim 3 that the magnified image is preprocessed to except and eliminate graphite pieces in contact with a frame of the magnified image before extracting the non-spherical graphite pieces of the particular size class, and the image analysis unit comprises a unit 13 (Fig. 24 ) for correcting the number of the extracted non-spherical graphite pieces of the particular size class by the steps of counting the graphite pieces to be excepted and eliminated; classifying graphite pieces other than the graphite pieces to be excepted and eliminated into a plurality of size classes containing the particular size class, to count a number of the other graphite pieces of each size class; and distributing the graphite pieces to be excepted and eliminated into the size classes proportionally based on a ratio between the numbers of the other graphite pieces, to add a number of the distributed graphite pieces to the numbers of the other graphite pieces, as described inclaim 6.
Thus, in the invention, the graphite structure can be numerically and quantitatively evaluated based on the number of the graphite pieces and the thick and thin degree related therewith.
According to the invention, the graphite structure can be quantitatively evaluated based on the number of the graphite pieces and the related thick and thin degree, numerically, easily, and accurately. Thus, the invention is advantageous in that highly reliable evaluation results are obtained without differences between individuals and the actual graphite structure can be easily imagined from the evaluation results. -
-
Fig. 1 is an explanatory view schematically showing components of an entire evaluation system according to a preferred embodiment of the present invention. -
Fig. 2 is a functional block diagram showing a principal part ofFig. 1 . -
Fig. 3 is a flowchart showing steps of an evaluation method according to the preferred embodiment of the invention. -
Fig. 4 is a flowchart showing steps of an image analysis for measuring a graphite spheroidizing ratio. -
Fig. 5 is an explanatory view showing an analysis result example of the graphite spheroidizing ratio measurement ofFig. 4 . -
Fig. 6A is an explanatory view of a maximum size method
for determining size of graphite pieces. -
Fig. 6B is an explanatory view of an average size method for determining size of graphite pieces. -
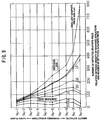
Fig. 7 is a graph showing numbers of detected graphite pieces of different shapes and sizes. -
Fig. 8 is an explanatory view of dividing the graphite structure of the left into graphite pieces having a maximum size of less than 10 µm and graphite pieces having a maximum size of 10 µm or more. -
Fig. 9 is a graph showing a relation between a density of a graphite structure and a number of detected graphite pieces. -
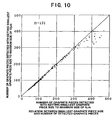
Fig. 10 is a graph showing a relation between a smallest graphite piece size and a number of detected graphite pieces. -
Fig. 11 is an explanatory view showing a relation between a gray cast iron structure and a number of graphite pieces. -
Fig. 12 is an explanatory view showing an example of differences in thick and thin degree between structures having the same number of graphite pieces. -
Fig. 13 is an explanatory view of dividing the graphite structure with a graphite piece number of 90 based on the sizes. -
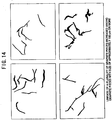
Fig. 14 is an explanatory view of linkage of a plurality of graphite pieces, which is increased among graphite pieces with a size of approximately 150 µm or more. -
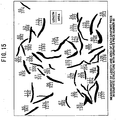
Fig. 15 is an explanatory view showing a result of measuring a length and an area of each graphite piece in the graphite structure with the graphite piece number of 90. -
Fig. 16 is a graph showing a relation between the lengths (the maximum sizes) and the areas of the graphite pieces of the structure ofFig. 15 . -
Fig. 17 is an explanatory view of an embodiment of indication of a thick and thin degree of an assumptive, representative graphite piece having a length of 100 µm. -
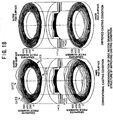
Fig. 18 is an explanatory view showing distribution of graphite pieces in sections of a brake disc rotor made of a cast iron three-dimensionally to improve a condition of casting the brake disc rotor. -
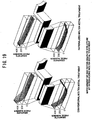
Fig. 19 is an explanatory view showing distribution of graphite pieces in sections of the brake disc rotor three-dimensionally to rationalize a molten metal treatment. -
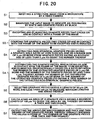
Fig. 20 is a flowchart showing a second embodiment of the invention. -
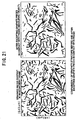
Fig. 21 is an explanatory view of comparing graphite structures observed before and after excepting and eliminating graphite pieces in contact with a frame of an image for analysis. -
Fig. 22 is an explanatory view also of comparing graphite structures observed before and after excepting and eliminating graphite pieces in contact with a frame of an image for analysis. -
Fig. 23 is an explanatory view of adding a number of graphite pieces in contact with an image frame to be excepted and eliminated in a proportional distribution. -
Fig. 24 is a functional block diagram showing a modified example ofFig. 2 . -
Figs. 1 to 3 show a preferred embodiment of the present invention. -
Fig. 1 schematically shows components of an evaluation system of the invention, andFig. 2 shows a schematic functional block diagram thereof. The system is composed of animage analysis unit 1 of animage analysis apparatus 20 having apersonal computer 6 as a main component; an opticalmetallurgical microscope 7; an image input unit (an image pickup unit) 2 of a CCD camera (a video camera) 8; etc. An image taken by theCCD camera 8 is input into theimage analysis apparatus 20 through aninput port 9. Thepersonal computer 6 comprises a memory device such as a hard disk in addition to CPU, ROM, and RAM with a previously installed prescribed image analysis software, and further comprises an input unit of a not shown keyboard or mouse, adisplay unit 3 of aCRT display 10, an output unit of aprinter 11, anexternal memory device 12 such as MO, etc. - An evaluation object graphite structure of a gray cast iron is magnified 100 times by the
metallurgical microscope 7, and a magnified microscopic image is taken by theCCD camera 8 and input into theimage analysis apparatus 20. For example, 640 × 480 pixels (picture elements) of theinput 100 times magnified microscopic image is subjected to the image analysis. The 640-pixels width of the image frame is distributed on a 640-µm scale, whereby there is a relation of 1 pixel = 1 µm. - After the image is input into the
image analysis apparatus 20 as shown in Step S1 ofFig. 3 , the input image is binarized into bright and dark to indicate an iron matrix by white color and graphite pieces by black color (Step S2). At the same time, graphite pieces that intersect (cross) or are in contact with the frame of the image are eliminated and excepted (Step S3). Then, in Step S4, only non-spherical graphite pieces having a graphite area ratio of less than 54% are extracted and counted. - In general, two methods shown in
Figs. 6A and 6B may be used for determining size of each graphite piece to be extracted. One is a maximum size method shown inFig. 6A in which the longest portion of the graphite piece is inscribed in a circle and the diameter of the circle is considered as the size of the graphite piece regardless of the area of the graphite piece. The other is an average size method shown inFig. 6B in which a diameter of a circle having an area equal to that of the graphite piece is considered as the size of the graphite piece regardless of the length of the graphite piece. - In this embodiment, graphite pieces with an average size of 5 µm or more are extracted. As described above, only the non-spherical graphite pieces having a graphite area ratio of less than 54% and an average size of 5 µm or more are extracted, and the number of the extracted non-spherical graphite pieces is counted and indicated. Graphite pieces with a maximum size (a maximum length) of 10 µm or more may be extracted without the average size method, and only graphite pieces with a maximum size of 10 µm or more and an average size of 5 µm or more may be extracted by using the two methods in combination. An example of a state of an extracted graphite piece structure is shown in the upper left of
Fig. 13 , the number of the detected graphite pieces being 90 for instance. - It can be assumed from
Fig. 13 that the impression of the entire graphite structure largely depends on a degree of thickness of the graphite pieces with a maximum length of 50 µm or more and less than 150 µm (which is referred to as a thick and thin degree in this embodiment as hereinafter described) as shown in the lower left. Based on the assumption, only the graphite pieces having a maximum length of 50 µm or more and less than 150 µm are extracted from the non-spherical graphite pieces, and a maximum size (a maximum length) and an area of each graphite piece are measured (Step S5 ofFig. 3 ). The measured maximum length and area of each graphite piece are both shown inFig. 15 , and the distribution thereof is shown as a graph inFig. 16 . Then, the median of the graphite piece lengths is obtained and an area of a graphite piece with the median is calculated by using a relational expression shown inFig. 16 . - In
Fig. 16 , the median of lengths 50 to 150 µm is 100 µm, whereby the area of the graphite piece with the median length of 100 µm is 1006 µm2. Thus, an assumptive graphite piece with a maximum length (a maximum size) of 100 µm representative of the graphite pieces with a length of 50 µm or more and less than 150 µm is obtained from the shown data, the area of the assumptive graphite piece being 1006 µm2. A value of 10.06 is obtained by dividing thearea 1006 µm2 by thelength 100 µm as shown inFig. 17 , and the obtained value is considered as the thick and thin degree (Step S6 ofFig. 3 ) . The thick and thin degree corresponds to a width of a rectangle having the same area and the length of 100 µm, and can provide a practical image of the graphite structure. - Then the width 10.06 of the assumptive graphite piece is rounded to be 10.1, and visually shown with the
number 90 of the detected graphite pieces as 90 (10.1) in form of "the number of the detected graphite pieces (the thick and thin degree) " (Step S7 ofFig. 3 ). The form of the graphite structure is indicated with the thick and thin degree of the graphite components. It should be noted that a series of the above arithmetic processing may be carried out in theimage analysis apparatus 20 shown inFig. 2 . - Next, a conventional graphite spheroidizing ratio measuring apparatus is used to verify appropriateness and reasonableness of the method of evaluating the graphite structure of the gray cast iron comprising the thick and thin degree evaluation using a 2- or 3-digit value.
-
Fig. 4 shows steps of a measurement using a widely known graphite spheroidizing ratio measuring apparatus. As shown inFig. 4 , in the graphite spheroidizing ratio measurement, all the graphite pieces in the input image are distinguished based on a predetermined size and counted regardless of whether graphite pieces are spherical or non-spherical. A structure of flake-like or eutectic graphite pieces was quantitatively evaluated by utilizing this counting function. - For example, the 640 × 480 pixels (picture elements) of the 100 times magnified microscopic image input by the video camera 8 (the image pickup device such as a CCD) of
Fig. 1 is used as an object of image analysis. There is the relation of 1 pixel = 1 µm as describe above. An example of the analysis results is shown inFig. 5 , the numbers of the detected graphite pieces of different spherical or non-spherical (flake-like) shapes according to JIS being separately indicated. - As described above, the two methods of the maximum size method and the average size method can be used for determining the size of each graphite piece to be extracted. According to definition of JIS, the graphite spheroidizing ratio measurement is carried out by the maximum size method. However, the two methods are meaningful in some degree, whereby both of the maximum size method and the average size method are used in combination herein.
- First three samples of a coarse graphite structure with relatively long graphite pieces, a minute eutectic graphite structure, and a middle thereof were prepared.
Fig. 7 shows a result of evaluating the middle graphite structure to measure numbers of graphite pieces of different shapes and sizes as an example. - As shown in
Fig. 7 , the graphite pieces of several size classes were extracted. For example, the graphite pieces were classified into seven size classes of 1 µm or more, 2 µm or more, 3 µm or more, 5 µm or more, 10 µm or more, 15 µm or more, and 20 µm or more with respect to both of the maximum size and the average size. The results were shown as numbers of the detected graphite pieces of the size classes, accumulating total numbers, and numbers of the detected graphite pieces by the spherical or non-spherical shapes. - As shown in
Fig. 7 , the graphite piece number obtained by using the maximum size method was larger and the graphite piece number obtained by using the average size method was smaller in each relatively larger size class. On the other hand, in each smaller size class, the graphite piece number obtained by using the average size method was larger and the graphite piece number obtained by using the maximum size method was smaller. This is reasonable for the above-described definitions of the maximum size and the average size. In contrast, when the graphite pieces of the size class of 1 µm or more were counted, substantially all the graphite pieces in the image were detected regardless of the shape, and the total number of the graphite pieces measured by using the maximum size method was about 433, approximately the same as the number measured by using the average size method, about 436. - The results of measuring the other two samples of the coarse graphite structure and the eutectic graphite structure are not shown. In the case of the coarse graphite structure, the number of the detected graphite pieces of the size class of 1 µm or more was about 211 in the maximum size method and about 223 in the average size method. In the case of the eutectic graphite structure, the number of the detected graphite pieces of the size class of 1 µm or more was about 1172 in the maximum size method and about 1176 in the average size method. The results showed the same tendency as those of the middle graphite structure except for this difference.
- Meanwhile, it was found that spherical graphite pieces were hardly observed in the size class of 5 or 10 µm or more and increased in the smaller size classes as a characteristic common in all the samples.
- Thus, graphite pieces of another sample was divided into maximum size classes of 10 µm or more and less than 10 µm or into average size classes of 5 µm or more and less than 5 µm, to observe differences between the divided graphite structures.
Fig. 8 shows the result of dividing the graphite structure into the maximum size classes. In the maximum size class of less than 10 µm, the most of the detected 134 graphite pieces were point-like, granular, or nubbly, it was impossible to judge whether the pieces were spherical or non-spherical by visual observation, and there was a possibility that a part of the detected pieces was slag or rust in actuality. Further, it was important that, in visual observation, the impression or image of the graphite structure was formed by the graphite pieces with the maximum size of 10 µm or more, and the graphite pieces with the maximum size of less than 10 µm were considered as noise not to affect the impression. The same observation results were obtained also in the case where the graphite pieces were divided into the average size classes of 5 µm or more and less than 5 µm though not shown. - An object of the invention is to differentiate graphite structures; thereby clarifying differences between the structures. In view of the object, the point-like or granular graphite pieces having the maximum size of less than 10 µm or the average size of less than 5 µm do not affect the impression of the entire structure, to be nothing but noise. Therefore, the following observations cover only the non-spherical graphite pieces with the maximum size of 10 µm or more or the average size of 5 µm or more.
- Conditions for measuring the numbers of the graphite pieces in the graphite structure were refined in the above manner, and then an experiment was performed under the refined conditions.
- First, samples with various graphite structures were prepared, and ten samples of Nos. 1 to 10 were selected therefrom in the order from a longer graphite piece structure to a minute eutectic graphite piece structure such that approval was obtained from every one of 5 observers. Then, the graphite pieces were classified into 4 size classes of 5 µm or more, 10 µm or more, 15 µm or more, and 20 µm or more with respect to the maximum size method and the average size method, and the numbers of the non-spherical graphite pieces according to JIS were measured.
- The results are shown in
Fig. 9 . The relations between the graphite structure states and the numbers of the detected graphite pieces are shown in the order of the structure densities from the longer flake graphite structures to the minute eutectic graphite structures. Data obtained by the maximum size method (dashed lines) and data obtained by the average size method (solid lines) are overlapped. It is clear from the results that the number of the graphite pieces with the average size of 5 µm or more and the number of the graphite pieces with the maximum size of 10 µm or more have the most linear relationship with the densities of the graphite structures. More samples were measured with respect to the numbers of the graphite pieces with the average size of 5 µm or more and the number of the graphite pieces with the maximum size of 10 µm or more, to judge which was the most effective method as a standard. The results are shown inFig. 10 . - As is clear from
Fig. 10 , though equal graphite piece numbers are obtained by both the size methods in the large graphite piece structures with a graphite piece number of approximately 300 or less, more graphite pieces are detected by using the average size of 5 µm or more in the relatively minute, nearly eutectic graphite structures with a graphite piece number of more than 300. The reason of this seems that, as described above, the lengths of the graphite pieces are used in the maximum size method and the areas of the graphite pieces are used in the average size method as a measure of the size. Thus, some of the nubbly, granular, or nearly point-like graphite pieces, which have a length smaller than the predetermined maximum size to be removed from the measurement (or detection or extraction) in the maximum size method, have an area more than the predetermined average size. - In the differentiation of the graphite structures, minuter graphite structures are more difficult to detect the differences therebetween than structures of relatively larger graphite pieces. It is remarkably preferred that the numbers of the graphite pieces are more precisely obtained even in the case of such minuter graphite structures, and as the conclusion, it is reasonable that the size of the smallest graphite piece to be extracted is determined using not the maximum size method but the average size method to evaluate the graphite structure based on the number of the graphite components.
- It is clear from the above study results that, by measuring the number of the non-spherical (flake-like) graphite pieces with the average size of 5 µm or more, the graphite structure of the gray cast iron can be reliably evaluated with ease without differences between individuals while calculating the 2- or 3-digit thick and thin degree value as described above.
-
Fig. 11 shows a relation between the micrographs and the numbers of the detected flake graphite pieces of the above ten samples of Nos. 1 to 10 as a further example. It is clear that the form of the graphite pieces in each structure has a certain correlation with the number of the detected graphite pieces. InFig. 11 , the samples of Nos. 1 to 10 are shown as K-1 to K-10, and the numbers of the detected non-spherical (flake-like) graphite pieces are shown in parentheses. - There is a case where graphite structures having the same detected graphite piece numbers are different in thickness of the component graphite pieces, and herein influences of these differences are not necessarily taken into account sufficiently. A degree of the thickness (or the thinness) of the graphite pieces is temporarily referred to as a thick and thin degree, and an example of graphite structures with remarkably different thick and thin degrees are shown in
Fig. 12 . - The graphite structures shown in
Fig. 12 are different in the thick and thin degrees of the graphite pieces as is clear from the graphite area ratios though they has the same detected graphite piece number of 90. The gray cast irons having the different structures are naturally different in mechanical properties, etc. Thus, it must be said that the method of evaluating the graphite structure is not perfect without taking the thick and thin degree into account. - In this case, the simplest is a method comprising comparing the total graphite areas of the structures having the same graphite piece numbers, or a method comprising comparing average areas of the graphite pieces, which are each obtained by dividing the total graphite area by the graphite piece number, and the methods are effective to some extent. However, the structures have different size distributions of the graphite pieces though they have the same graphite piece numbers, whereby the methods of simply comparing the areas of the graphite pieces are not always appropriate.
- Thus, among 4 types of the graphite structures shown in
Fig. 12 , the structure having the thick and thin degree of 10.1 shown in the upper left is divided by distributing the graphite pieces into 3 maximum size classes of 10 µm or more and less than 50 µm, 50 µm or more and less than 150 µm, and 150 µm or more, and shown inFig. 13 . The upper left ofFig. 13 is the same as that ofFig. 12 . As is clear fromFigs. 12 and13 , the impression of swelling of the graphite pieces in the graphite structure mainly depends on the graphite pieces having a maximum length of 50 µm or more and less than 150 µm. Another graphite structure having a different graphite piece number was checked in the same manner for an experiment, and as a result, the graphite pieces with a maximum length of 50 µm or more and less than 150 µm significantly affected the impression of swelling. Therefore, the impression of swelling of the graphite pieces in the entire graphite structure can be shown as the thick and thin degree of the graphite pieces with the maximum length of 50 µm or more and less than 150 µm. - A plurality of graphite pieces may be linked and recognized as one graphite piece, and the linkage is remarkably increased among the graphite pieces having the maximum length of 150 µm or more as shown in
Fig. 14 . The graphite pieces having the maximum length of 150 µm or more are desirably excepted to prevent the miss-recognition. - The maximum sizes (the maximum lengths) and the areas of the above graphite pieces of 50 µm or more and less than 150 µm are measured and shown together in
Fig. 15 , and the distribution of the graphite pieces is shown as a graph inFig. 16 . Anarea 1006 µm2 of a graphite piece having the median 100 µm of the lengths can be obtained fromFigs. 15 and16 . - The assumptive graphite piece with the maximum length (the maximum size) of 100 µm, which may be representative of the graphite pieces, is obtained from the data of the graphite pieces of 50 µm or more and less than 150 µm, the area of the assumptive graphite piece is calculated to be 1006 µm2, and a value 10.06 is obtained by dividing the
area 1006 µm2 by thelength 100 µm as shown inFig. 17 . The value corresponds to the width of the rectangle having the same area and the length of 100 µm, and can provide a practical image of swelling. - Then, the width 10.06 of the assumptive graphite piece is rounded to be 10.1, and shown with the
number 90 of the detected graphite pieces as 90 (10.1), whereby the thick and thin degree of the graphite components is indicated with the form of the graphite structure. - As described above, it is confirmed that the thick and thin degree evaluation using a 2- or 3-digit value is appropriate.
- In production of a brake disc rotor made of a cast iron, distribution of graphite pieces in sections of the brake disc rotor is three-dimensionally shown to improve the casting condition in
Fig. 18 , and distribution of graphite pieces in sections of the brake disc rotor is three-dimensionally shown to rationalize the molten metal treatment inFig. 19 . It is more effective that the numeric values of the graphite structure are shown together with the above-described thick and thin degrees.Figs. 20 to 24 show a second embodiment of the invention. As shown in the flowchart ofFig. 20 , the graphite pieces, which cross or are in contact with the frame of the magnified image for the image analysis, are not measuring objects to be excepted and eliminated in the preprocessing step regardless of whether the graphite pieces are spherical or non-spherical (See, Step S3 ofFigs. 3 and20 ) . The graphite pieces in contact with the frame are excepted and eliminated because they cannot be examined with respect to shape and size of the unshown portions other than the portions shown in the image, and this procedure is unavoidable for the image analysis. - In the measurement of the graphite spheroidizing ratio, even if the number of the extracted graphite pieces for the measurement is slightly less than the actual number thereof, the graphite spheroidizing ratio can be obtained by measuring the graphite pieces remaining in the frame without serious practical problems.
- On the other hand, in the invention, the flake graphite structure of the gray cast iron is quantitatively evaluated based on a graphite component piece number, whereby it is never preferred from the viewpoint of the evaluation accuracy that the important graphite piece number is different from the actual one.
-
Fig. 21 shows a comparison of structures observed before and after excepting and eliminating graphite pieces which cross or are in contact with a frame of an image (a measurement frame). when the graphite pieces in contact with the frame are excepted and eliminated, there are conspicuous empty spaces in the vicinity of the frame, as shown in the right ofFig. 21 . Only the graphite pieces remaining within the frame are used as the measurement objects, and as a result, the analyzed graphite structure is partly different from the actual structure though the structures are similar. - The gray cast iron has a content of the thin long graphite pieces much higher than that of a spherical graphite cast iron containing spherical or nubbly graphite pieces. The longer flake graphite pieces are more likely to come into contact with the image frame. Further, the graphite piece number becomes smaller as the graphite pieces are longer, and thus the graphite structure containing the longer graphite pieces has a higher ratio of the excepted and eliminated graphite pieces in contact with the frame.
- A specific conspicuous example is shown in
Fig. 22 , and the measuring object graphite structure is made very different from the original by excepting and eliminating more than half of the present graphite pieces as shown in the right of theFig. 22 . A structure of extremely long graphite pieces is used in this example, and such a large difference is not observed in common FC-250 graphite structures. However, in the case of evaluating common, so-called A-type graphite structures by using an image of 640 × 480 µm, approximately 5 to 20% of the graphite pieces are in contact with the frame to be excepted and eliminated unavoidably. - Because graphite structures containing similar graphite pieces show similar ratios of the excepted and eliminated graphite pieces, relative comparison of the structures can be carried out without serious practical problems. However, to faithfully reflect the original graphite structure to the evaluation, it is preferable to evaluate also the excepted and eliminated graphite pieces.
- Though it is impossible to measure the shapes and the sizes of the graphite pieces in contact with the frame to be excepted and eliminated as described above, the number thereof can be measured. Further, it is believed that the graphite pieces in contact with the frame have the shapes and the sizes not so different from those of the most graphite pieces remaining in the frame stochastically.
- Thus, a graphite structure extremely similar to the original structure with the entire graphite pieces can be reproduced while taking account of the number of the graphite pieces in contact with the frame to be excepted and eliminated by the steps of counting the graphite pieces in contact with the frame to be excepted and eliminated; classifying the graphite pieces remaining in the frame into a plurality of size classes to count the number of the graphite pieces of each size class; calculating the distribution ratio between the numbers of the remaining graphite pieces of the size classes; and distributing the graphite pieces to be excepted and eliminated into the size classes proportionally based on the ratio, to add a number of the distributed graphite pieces to the above numbers.
-
Fig. 23 shows a specific example of the steps ofFig. 20 , and Steps S1 to S3 ofFig. 20 are equal to those ofFig. 3 . When the graphite pieces, which cross or are in contact with the frame of the image binarized into bright and dark, are excepted and eliminated from the image of the graphite structure (the entire graphite pieces) in Step S3, the number of the graphite pieces to be excepted and eliminated is counted (Step S3-1). Then, as the case ofFig. 3 , the non-spherical graphite pieces having the graphite area ratio of less than 54% and the average size of 5 µm or more are extracted and separated from the graphite pieces of less than 5 µm, and the numbers of the classified non-spherical graphite pieces are counted or calculated in Step S4. - In the example of
Fig. 23 , the number of the graphite pieces, which cross or are in contact with the frame of the image to be excepted and eliminated, is 32, the number of the graphite pieces of less than 5 µm in the frame is 26, and the number of the graphite pieces of 5 µm or more is 148. - Next, as shown in
Fig. 23 in addition to Step S4-1 ofFig. 20 , the 32 graphite pieces to be excepted and eliminated are classified based on the ratio of thenumber 26 of the graphite pieces of less than 5 µm and thenumber 148 of the graphite pieces of 5 µm or more remaining in the frame. Thus, thenumber 32 of the graphite pieces to be excepted and eliminated is divided into 5 and 27 proportionally based on the ratio of 26: 148 . Thenumber 27 is added to thenumber 148 of the graphite pieces of 5 µm or more remaining in the frame, thereby correcting the number into 175. As a result, a virtual graphite structure index of 148, which does not depend on the number of the graphite pieces in contact with the frame to be excepted and eliminated, and a true graphite structure index of 175 approximate to the actual value, which is corrected by proportionally distributing the graphite pieces to be excepted and eliminated, are obtained as the numbers of the graphite pieces with the average size of 5 µm or more to be extracted. - Subsequently the thick and thin degree is calculated in Steps S5 and S6 and visually shown together with the above obtained true graphite structure index as 175 (10.1) in Step S7 as the case of
Fig. 3 . It should be noted that a series of the above arithmetic processing may be carried out in the image analysis apparatus shown inFig. 24 . The apparatus shown inFig. 24 comprises aunit 13 for proportionally adding the number of the graphite pieces in contact with the image frame to be excepted, and is thereby different from the apparatus shown inFig. 2 . - In this embodiment, the number of the extracted non-spherical graphite pieces of the particular size class is corrected by proportionally distributing the graphite pieces, which cross or are in contact with the frame of the image to be excepted and eliminated, whereby the accuracy of the graphite structure image analysis can be further improved to provide the highly reliable evaluation results.
Claims (6)
- A method for quantitatively evaluating a graphite structure of a gray cast iron by an image analysis apparatus (20), comprising using the image analysis apparatus (20) to perform the steps of:analyzing a magnified image of the graphite structure to extract non-spherical graphite pieces contained in the graphite structure having sizes of an area equal to that of a circle having a diameter of 5 µm or more or a maximum length of 10 µm or more, as defined as being within a first range, to calculate a number of the extracted non-spherical graphite pieces;calculating a thick and thin degree expressing a representative degree of thickness of the non-spherical graphite pieces, including measuring a maximum length and an area of each of the non-spherical graphite pieces, contained in the extracted non-spherical graphite pieces, having maximum lengths of 50 µm or more and less than 150 µm, as defined as being within a second range, determining an area of a representative non-spherical graphite piece having maximum length of 100 µm based on the calculated maximum lengths and areas, and dividing the determined area by 100 to obtain the thick and thin degree; andoutputting the calculated number and the thick and thin degree of the non-spherical graphite pieces in combination as an evaluation result.
- The method for evaluating a graphite structure of a gray cast iron according to claim 1, characterized in that the magnified image for the image analyzing step is taken from a microscopic screen image of the graphite structure by an image pickup device (8).
- The method for evaluating a graphite structure of a gray cast iron according to any one of claims 1 or 2, characterized in that the magnified image is preprocessed to except and eliminate graphite pieces in contact with a frame of the magnified image before extracting the non-spherical graphite pieces having sizes within the first range, and
the number of the extracted non-spherical graphite pieces having sizes within the first range is corrected by the steps of
counting the graphite pieces to be excepted and eliminated;
classifying graphite pieces other than the graphite pieces to be excepted and eliminated into a plurality of size classes containing the particular size class of sizes within the first range, to count a number of the other graphite pieces of each size class; and
distributing the graphite pieces to be excepted and eliminated into the size classes proportionally based on a ratio between the numbers of the other graphite pieces, to add a number of the distributed graphite pieces to the numbers of the other graphite pieces. - A computer-readable recording medium storing a program for carrying out the steps recited in any one of claims 1 to 3.
- A system for quantitatively evaluating a graphite structure of a gray cast iron by image analysis, comprising an image analysis unit (1), an image input unit (2) for inputting a magnified image of the graphite structure into the image analysis unit (1), and a display unit (3) for indicating an analysis result,
wherein the image analysis unit (1) comprises a graphite piece number/area calculating unit (4) for analyzing the magnified image of the graphite structure to extract non-spherical graphite pieces contained in the graphite structure having sizes of an area equal to that of a circle having a diameter of 5 µm or more or a maximum length of 10 µm or more, as defined as being within a first range, to calculate a number of the extracted non-spherical graphite pieces, and a thick and thin degree calculating unit (5) for calculating a thick and thin degree expressing a representative degree of thickness of the non-spherical graphite pieces, including a first section for measuring a maximum length and an area of each of the non-spherical graphite pieces, contained in the extracted non-spherical graphite pieces, having maximum lengths of 50 µm or more and less than 150 µm, as defined as being within a second range, a second section for determining an area of a representative non-spherical graphite piece having maximum length of 100 µm based on the calculated maximum lengths and areas, and a third section for dividing the determined area by 100 to obtain the tick and thin degree, and
the number and the thick and thin degree of the non-spherical graphite pieces are visually indicated on the display unit in combination as an evaluation result. - The system for evaluating a graphite structure of a gray cast iron according to claim 5, characterized in that the magnified image is preprocessed to except and eliminate graphite pieces in contact with a frame of the magnified image before extracting the non-spherical graphite pieces having sizes within the first range, and
the image analysis unit (1) comprises a unit for correcting the number of the extracted non-spherical graphite pieces having sizes within the first range by the steps of
counting the graphite pieces to be excepted and eliminated; classifying graphite pieces other than the graphite pieces to be excepted and eliminated into a plurality of size classes containing the particular size class of sizes within the first range, to count a number of the other graphite pieces of each size class; and distributing the graphite pieces to be excepted and eliminated into the size classes proportionally based on a ratio between the numbers of the other graphite pieces, to add a number of the distributed graphite pieces to the numbers of the other graphite pieces.
Applications Claiming Priority (3)
| Application Number | Priority Date | Filing Date | Title |
|---|---|---|---|
| JP2002379728 | 2002-12-27 | ||
| JP2002379728A JP4076438B2 (en) | 2002-12-27 | 2002-12-27 | Evaluation method and evaluation system of graphite structure in gray cast iron |
| PCT/JP2003/016803 WO2004061431A1 (en) | 2002-12-27 | 2003-12-25 | Method for judging graphite texture in gray cast iron, judging program recording medium and judging system |
Publications (3)
| Publication Number | Publication Date |
|---|---|
| EP1512958A1 EP1512958A1 (en) | 2005-03-09 |
| EP1512958A4 EP1512958A4 (en) | 2011-02-16 |
| EP1512958B1 true EP1512958B1 (en) | 2017-09-13 |
Family
ID=32708404
Family Applications (1)
| Application Number | Title | Priority Date | Filing Date |
|---|---|---|---|
| EP03782901.7A Expired - Lifetime EP1512958B1 (en) | 2002-12-27 | 2003-12-25 | Method for judging graphite texture in gray cast iron, judging program recording medium and judging system |
Country Status (6)
| Country | Link |
|---|---|
| US (1) | US7574034B2 (en) |
| EP (1) | EP1512958B1 (en) |
| JP (1) | JP4076438B2 (en) |
| CN (1) | CN100487423C (en) |
| TW (1) | TWI275787B (en) |
| WO (1) | WO2004061431A1 (en) |
Families Citing this family (4)
| Publication number | Priority date | Publication date | Assignee | Title |
|---|---|---|---|---|
| JP5052381B2 (en) * | 2008-03-27 | 2012-10-17 | アイシン高丘株式会社 | Cast iron graphite evaluation method and cast iron graphite evaluation apparatus |
| CN111462221A (en) * | 2020-04-03 | 2020-07-28 | 深圳前海微众银行股份有限公司 | Method, device, device and storage medium for extracting shadow area of object to be detected |
| CN114152617A (en) * | 2021-10-14 | 2022-03-08 | 攀钢集团研究院有限公司 | Method for accurately measuring and reducing proportion and distribution of proeutectoid cementite |
| CN117333558B (en) * | 2023-09-28 | 2024-04-05 | 北方工业大学 | Method and system for analyzing global average gray level change of tundish ink tracing experiment |
Family Cites Families (9)
| Publication number | Priority date | Publication date | Assignee | Title |
|---|---|---|---|---|
| JPS596385B2 (en) * | 1978-05-17 | 1984-02-10 | 矢作製鉄株式会社 | Rapid determination method and device for the degree of graphite nodularity in molten cast iron |
| JPH05273200A (en) * | 1992-03-25 | 1993-10-22 | Riken Corp | Open graphite factor measuring method |
| JP2510947B2 (en) * | 1993-10-15 | 1996-06-26 | 有限会社日本サブランスプローブエンジニアリング | Method for discriminating presence / absence of spheroidizing agent or CV agent in molten cast iron and chilling tendency of flake graphite cast iron, and sampling container used therefor |
| SE504136C2 (en) * | 1995-02-07 | 1996-11-18 | Sintercast Ab | Process for the production of single-piece castings where certain parts contain compact graphite iron and other gray cast iron |
| US6126713A (en) * | 1996-10-24 | 2000-10-03 | Hitachi Metals, Ltd. | Additive for use in producing spheroidal graphite cast iron |
| JPH11304736A (en) * | 1998-04-23 | 1999-11-05 | Nippon Saburansu Probe Engineering:Kk | Method for improving thermal analysis of spherical graphite cast iron |
| JP3612677B2 (en) * | 1998-06-25 | 2005-01-19 | 株式会社ニッサブ | Method for determining graphite shape of spheroidal graphite cast iron and CV-shaped graphite cast iron |
| JP2002162348A (en) | 2000-11-24 | 2002-06-07 | Kimura Chuzosho:Kk | Graphite form determination method |
| JP2002317237A (en) * | 2001-04-23 | 2002-10-31 | Nippon Steel Corp | Centrifugal casting rolls |
-
2002
- 2002-12-27 JP JP2002379728A patent/JP4076438B2/en not_active Expired - Lifetime
-
2003
- 2003-12-25 EP EP03782901.7A patent/EP1512958B1/en not_active Expired - Lifetime
- 2003-12-25 CN CNB2003801006166A patent/CN100487423C/en not_active Expired - Fee Related
- 2003-12-25 TW TW092136911A patent/TWI275787B/en not_active IP Right Cessation
- 2003-12-25 US US10/517,229 patent/US7574034B2/en not_active Expired - Lifetime
- 2003-12-25 WO PCT/JP2003/016803 patent/WO2004061431A1/en not_active Ceased
Non-Patent Citations (1)
| Title |
|---|
| None * |
Also Published As
| Publication number | Publication date |
|---|---|
| TWI275787B (en) | 2007-03-11 |
| US7574034B2 (en) | 2009-08-11 |
| CN1692276A (en) | 2005-11-02 |
| CN100487423C (en) | 2009-05-13 |
| WO2004061431A1 (en) | 2004-07-22 |
| EP1512958A1 (en) | 2005-03-09 |
| JP4076438B2 (en) | 2008-04-16 |
| EP1512958A4 (en) | 2011-02-16 |
| JP2004212114A (en) | 2004-07-29 |
| US20050175232A1 (en) | 2005-08-11 |
| TW200416389A (en) | 2004-09-01 |
Similar Documents
| Publication | Publication Date | Title |
|---|---|---|
| Imasogie et al. | Characterization of graphite particle shape in spheroidal graphite iron using a computer-based image analyzer | |
| Stoudt et al. | The relationship between grain size and the surface roughening behavior of Al-Mg alloys | |
| Ruxanda et al. | Microstructure characterization of ductile thin-wall iron castings | |
| Park et al. | Evaluation of the CellaVision advanced RBC application for detecting red blood cell morphological abnormalities | |
| Paredes-Orta et al. | Method for grain size determination in carbon steels based on the ultimate opening | |
| Schleicher et al. | A quantitative approach to cytoarchitectonics: software and hardware aspects of a system for the evaluation and analysis of structural inhomogeneities in nervous tissue | |
| Weidt et al. | Prediction of porosity characteristics of aluminium castings based on X-ray CT measurements | |
| Benito et al. | Uncovering process-structure relationships associated to the hot isostatic pressing of the high-speed steel PMHS 3-3-4 through novel microstructural characterization methods | |
| US7574034B2 (en) | Method for judging graphite texture in gray cast iron, judging program recording medium and judging system | |
| Blutmager et al. | Abrasive/Erosive wear on MMCs in plastic molds as a function of volumetric flow rates and glass fiber distribution | |
| Murphy et al. | Measurement of powder characteristics and quality for additive manufacturing in aerospace alloys | |
| Lekakh et al. | Micro-CT quantitative evaluation of graphite nodules in SGI | |
| CN113129259A (en) | Casting blank density detection method and system and electronic equipment | |
| Liu et al. | Investigation of evolution of inclusions in 15-5PH stainless steel during hot compression using 3D X-Ray microscopy | |
| Lu et al. | An application of fractal geometry to complex microstructures: numerical characterization of graphite in cast irons | |
| Sjögren et al. | Analysing the deformation behaviour of compacted graphite cast irons using digital image correlation techniques | |
| KR100776078B1 (en) | Method and system for quantitatively evaluating a graphite structure of a gray cast iron by an image analysis apparatus, and a computer-readable recording medium | |
| Wojnar et al. | Quantitative image analysis | |
| Mori et al. | Objective Description of Graphite Morphology in Ductile Cast Iron by Numerical Geometric Parameters | |
| Vander Voort et al. | Image analysis measurements of duplex grain structures | |
| JP2020034372A (en) | Sample analysis method | |
| Lekakh | Communication: characterization of spatial distribution of graphite nodules in cast iron | |
| Tarafder et al. | Stretch-zone analysis by image processing for the evaluation of initiation fracture toughness of a HSLA steel | |
| Ji et al. | X-Ray computed tomographic investigation of high pressure die castings | |
| Vander Voort | Image analysis |
Legal Events
| Date | Code | Title | Description |
|---|---|---|---|
| PUAI | Public reference made under article 153(3) epc to a published international application that has entered the european phase |
Free format text: ORIGINAL CODE: 0009012 |
|
| 17P | Request for examination filed |
Effective date: 20041207 |
|
| AK | Designated contracting states |
Kind code of ref document: A1 Designated state(s): AT BE BG CH CY CZ DE DK EE ES FI FR GB GR HU IE IT LI LU MC NL PT RO SE SI SK TR |
|
| AX | Request for extension of the european patent |
Extension state: AL LT LV MK |
|
| DAX | Request for extension of the european patent (deleted) | ||
| RBV | Designated contracting states (corrected) |
Designated state(s): DE FR GB IT |
|
| A4 | Supplementary search report drawn up and despatched |
Effective date: 20110117 |
|
| 17Q | First examination report despatched |
Effective date: 20110919 |
|
| RIC1 | Information provided on ipc code assigned before grant |
Ipc: G06T 7/00 20170101AFI20161219BHEP |
|
| GRAP | Despatch of communication of intention to grant a patent |
Free format text: ORIGINAL CODE: EPIDOSNIGR1 |
|
| INTG | Intention to grant announced |
Effective date: 20170213 |
|
| GRAJ | Information related to disapproval of communication of intention to grant by the applicant or resumption of examination proceedings by the epo deleted |
Free format text: ORIGINAL CODE: EPIDOSDIGR1 |
|
| REG | Reference to a national code |
Ref country code: DE Ref legal event code: R079 Ref document number: 60350608 Country of ref document: DE Free format text: PREVIOUS MAIN CLASS: G01N0021170000 Ipc: G01N0021880000 |
|
| INTC | Intention to grant announced (deleted) | ||
| GRAP | Despatch of communication of intention to grant a patent |
Free format text: ORIGINAL CODE: EPIDOSNIGR1 |
|
| RIC1 | Information provided on ipc code assigned before grant |
Ipc: G01N 21/88 20060101AFI20170407BHEP Ipc: G06T 7/00 20170101ALI20170407BHEP |
|
| INTG | Intention to grant announced |
Effective date: 20170515 |
|
| GRAS | Grant fee paid |
Free format text: ORIGINAL CODE: EPIDOSNIGR3 |
|
| GRAA | (expected) grant |
Free format text: ORIGINAL CODE: 0009210 |
|
| AK | Designated contracting states |
Kind code of ref document: B1 Designated state(s): DE FR GB IT |
|
| REG | Reference to a national code |
Ref country code: GB Ref legal event code: FG4D |
|
| REG | Reference to a national code |
Ref country code: DE Ref legal event code: R096 Ref document number: 60350608 Country of ref document: DE |
|
| REG | Reference to a national code |
Ref country code: FR Ref legal event code: PLFP Year of fee payment: 15 |
|
| REG | Reference to a national code |
Ref country code: DE Ref legal event code: R097 Ref document number: 60350608 Country of ref document: DE |
|
| PLBE | No opposition filed within time limit |
Free format text: ORIGINAL CODE: 0009261 |
|
| STAA | Information on the status of an ep patent application or granted ep patent |
Free format text: STATUS: NO OPPOSITION FILED WITHIN TIME LIMIT |
|
| 26N | No opposition filed |
Effective date: 20180614 |
|
| PGFP | Annual fee paid to national office [announced via postgrant information from national office to epo] |
Ref country code: GB Payment date: 20221215 Year of fee payment: 20 Ref country code: FR Payment date: 20221216 Year of fee payment: 20 Ref country code: DE Payment date: 20220622 Year of fee payment: 20 |
|
| PGFP | Annual fee paid to national office [announced via postgrant information from national office to epo] |
Ref country code: IT Payment date: 20221230 Year of fee payment: 20 |
|
| REG | Reference to a national code |
Ref country code: DE Ref legal event code: R071 Ref document number: 60350608 Country of ref document: DE |
|
| REG | Reference to a national code |
Ref country code: GB Ref legal event code: PE20 Expiry date: 20231224 |
|
| PG25 | Lapsed in a contracting state [announced via postgrant information from national office to epo] |
Ref country code: GB Free format text: LAPSE BECAUSE OF EXPIRATION OF PROTECTION Effective date: 20231224 |
|
| PG25 | Lapsed in a contracting state [announced via postgrant information from national office to epo] |
Ref country code: GB Free format text: LAPSE BECAUSE OF EXPIRATION OF PROTECTION Effective date: 20231224 |