EP1510937A1 - A method of providing a visualisation graph on a computer and a computer for providing a visualisation graph - Google Patents
A method of providing a visualisation graph on a computer and a computer for providing a visualisation graph Download PDFInfo
- Publication number
- EP1510937A1 EP1510937A1 EP03077697A EP03077697A EP1510937A1 EP 1510937 A1 EP1510937 A1 EP 1510937A1 EP 03077697 A EP03077697 A EP 03077697A EP 03077697 A EP03077697 A EP 03077697A EP 1510937 A1 EP1510937 A1 EP 1510937A1
- Authority
- EP
- European Patent Office
- Prior art keywords
- entities
- graph
- visualisation
- query
- providing
- Prior art date
- Legal status (The legal status is an assumption and is not a legal conclusion. Google has not performed a legal analysis and makes no representation as to the accuracy of the status listed.)
- Ceased
Links
Images




Classifications
-
- G—PHYSICS
- G06—COMPUTING OR CALCULATING; COUNTING
- G06F—ELECTRIC DIGITAL DATA PROCESSING
- G06F16/00—Information retrieval; Database structures therefor; File system structures therefor
- G06F16/90—Details of database functions independent of the retrieved data types
- G06F16/903—Querying
- G06F16/9038—Presentation of query results
Definitions
- the invention relates to a method of providing a visualisation graph on a computer and a computer for providing a visualisation graph.
- Visualisation graphs are tools which allow data to be handled and displayed on a display device according to certain criteria, and are known for example from www.touchgraph.com .
- the primary objective of navigation graphs is to display systems of complex interrelationships between entities, e.g. in a database or the world wide web.
- Visualisation graphs can be based on an ontology including all entity types occurring, where the considered entities are linked to each other by various kinds of relations.
- a visualization graph represents entities as boxes, often referred to as "nodes" of the graph, and relations as lines between the boxes.
- a common way of solving the problem of graphical layout is applying a physical simulation where all entities are treated as masses repulsing each other and the relations are treated as elastic lines trying to pull connected entities together.
- a further problem with conventional visualisation graphs is that when the number of entities becomes large, the display becomes crowded. This leads to an inefficient use of the display. Also, it becomes more difficult for the user to access information easily.
- a further problem with conventional visualisation graphs is that when changes in the graphs are initiated, for example, when a node is double clicked on in order to include further entities related to that node into the graph, conventional repulsion based simulation approaches (which are indeterministic), a problem arises in making room for the entities of the group. In particular, if a node placed close to a second node is "exploded", the repulsion between the entities is so great that the system takes an unacceptable duration to converge. Thus, the user is faced with a graph that is slow to navigate with.
- a further problem with conventional visualisation graphs is that the user has access only to information concerning directly related entities. This is limiting in terms of the information the user can acquire from the system.
- a method of providing a visualisation graph on a computer comprising the steps of:
- a method of providing a visualisation graph on a computer comprising the steps of:
- said selecting step includes abstracting said relations to find said common relation. By abstracting said relations, characteristics are used to identify common relations in such a way that an even distribution of nodes in the graph is achieved.
- a method of providing a visualisation graph on a computer comprising the steps of:
- said node in response to said first predetermined stimulus, remains in said graph to represent said common relation.
- the "group node” is kept in the graph and represents the common relations, while the single group members (entities) have a link to the group node.
- said entities are linked to a further entity or node via a link which represents a relation which may not be common to all entities linked to said first node.
- a method of providing a visualisation graph on a computer comprising the steps of:
- a computer for providing a visualisation graph comprising:
- a computer for providing a visualisation graph comprising:
- a computer for providing a visualisation graph comprising:
- a computer for providing a visualisation graph comprising:
- a program storage device readable by a processing apparatus, said device embodying a program of instructions executable by the processor to perform the steps of the methods of any one of the first to fifth aspects of the present invention.
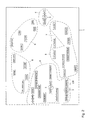
- Figures 1 and 2 show embodiments of the present invention according to a first aspect.
- Figure 1 shows the position of attractors for top-level entity types
- Figure 2 shows the approximate position of attractors for second-level entity types.
- Figure 1 shows details of a visualisation graph 1 wherein a plurality of entities 2 are displayed. Associated with each entity is an attractor 3. The attractors do not appear on the graph to a user, but are schematically depicted as dotted circles 3 .
- the entities 2 are typically modelled as a mass. There is a repulsive force between each pair of entities.
- the repulsive force may be inversely proportional to the distance or the square of the distance, or any other inverse relationship.
- the relations between entities (not shown in Figure 1) are modelled as springs, typically linear springs.
- the model provides damping to ensure that the system converges.
- energy is put into the system, for example, when entities 2 are introduced into the graph or moved, the system is modelled to adopt the lowest energy level.
- the distance and repulsive force is calculated from other entities and nodes. The forces are added to obtain a force vector.
- the reaction of the system in terms of acceleration and deceleration is dependent on the force vector.
- a 360°-approach is proposed.
- the present invention according to this first aspect may be carried out according to one of at least two embodiments.
- a first embodiment is based on a non-deterministic approach, using attractors and repulsive forces.
- a second, alternative embodiment is based on a deterministic approach using a dynamic, but deterministic, subdivision of the screen and screen areas into sectors. The first non-deterministic embodiment is now described:
- the 360° principle may also be used to arrange nodes (refer to Figure 2) in a navigation graph without the use of repulsive forces (which is the case in some conventional visualisation graphs).
- the display which is typically a computer screen, is divided into sectors 4 assigned to the respective top-level entity types 2.
- the size of each sector depends on the number of entities or nodes it contains, including all visible subtypes 6. For example, if a larger number of entities are to be placed in a particular sector, that sector will become larger. It is noted that this embodiment is carried out without repulsion and attractors.
- the sectors are recursively divided into subtype sectors 7 and again, their relative size depends on the number of entities they contain.
- the segmentation of the screen is repeated each time that entities are added to or removed from the graph 1.
- the distance of the entities or nodes to the center of the graph is an oscillating function of the angle in order to avoid collisions (which in the simulative approach are avoided by the repulsive force between entities).
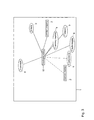
- Figure 3 shows a visualisation graph according to an embodiment of a second aspect of the present invention.
- Figure 3 shows a focus entity 10 with related entities 2 and those comprised in nodes 9, clustered by entity type.
- the dashed lines indicate indirectly related items, "competitors", "market”, selected due to user preferences.
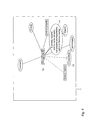
- Figure 4 shows further details of the visualisation graph shown in Figure 3.
- Figure 4 depicts a display of a group's common relations as indicated when a mouse, or other indicator adapted for use with a computer, is passed over the desired node (MouseOver).
- groups of entities 9 with common relations are bundled and displayed as group nodes 9 (Fig. 3). Of all possible groupings those are selected which result in the most even distribution of entities 2(also referred as elements) over the groups and which form groups of entities 2 (elements) which have at least two relations in common.
- the common relations may be explicitly assigned to each entity in a group, but they may also be abstractions of the individual relations.
- This embodiment is shown in Fig. 4, where the common relations of the group " sanitary napkins" are displayed: each of these products has got a relation "refers to German market” and a relation "has property biodegradability". These are direct relations. For example, two products in the group are sold by the company having access to the graph, the remaining products are sold by competing companies. Since the ontology contains the information that all those are companies, a common abstract relation "is sold by some company” is created, which also characterizes the elements of the group.
- the selection code is dynamic resulting in a dynamic grouping of the entities. That is, depending on certain criteria such as the context, the selection and abstraction, if applied, may at different times provide different groupings.
- facets are introduced.
- the user may define facets for each entity type. Facets are predefined groups which are characterized by the entity type of their elements or the kind of relation which connects their elements to the focus entity. In the example, the following facets have been defined for product properties:
- facets are defined, all entities related to the focus entity will be sorted into the corresponding facets (groups) and the dynamic grouping algorithm is used only to subdivide these facets into smaller groups (if possible).
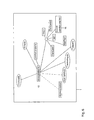
- Figures 5-8 show visualisation graphs according to embodiments of a third aspect of the present invention.
- Figure 5 depicts an exploding group 15, wherein association of members to group remains visible.
- Figure 6 depicts a display of entity type 16 as viewed with the MouseOver function.
- Figure 7 depicts an explosion of a group into subgroups 17.
- Figure 8 depicts the explosion of a subgroup 18.
- an aspect of the present invention allows the formation of groups in a 2D visualisation graph whilst keeping it clear. According to an embodiment of the present invention this is achieved by keeping the space required for the nodes minimal and the origin of the added nodes traceable. Further, the graph is rearranged in a smooth way to avoid confusion of the user. According to an embodiment of the invention, the following steps are taken:
- the resulting representation looks and behaves similar to a "tree view control".
- the main difference is that a tree view represents an existing hierarchical structure, whereas the group nodes in the graph dynamically create a hierarchy-like structure in order to get a clearer graph layout. Also the problem of finding a 2D graph layout does not exist for conventional tree view controls.
- the visualisation graph layout is such that the number of nodes is kept low without missing out potentially relevant information.
- d ⁇ d max the distance is the number of relations on the shortest path between a node and the focus node. Since the number of nodes usually increases exponentially with d max , a value of 1 or 2 is appropriate for most purposes.
- entities of certain types may be included in the graph even if they are far more distant to the focus, if they are considered to be of special interest in the current context either due to their entity type or due to the kind of relations linking them to the focus node.
- the context in this case can be made up, but is not limited, from the following components:
- Figure 9 shows a typical computer arrangement for carrying out the methods according to embodiments of the invention.
- Figure 5 shows a computer 20 including a central processing unit (CPU) 22.
- a display device such as a screen, for displaying a visualisation graph 1.
- the user may use a keyboard 40, mouse 42 or other operating device to communicate with the computer 20 and to instruct the computer to perform a query.
- the database 24 in which data for building the graph may store data locally at the computer 20.
- the database 60 or an additional database may be located remotely from the computer 20.
- the computer is provided with means to remotely access a remote database. For example, using a modem 26 connected via the internet 50 or other network or communications link to the remote database 60.
- the embodiment shown in Figure 9 is a typical internet configuration, other configurations may also be possible. As mentioned, a stand-alone configuration is also envisaged. Further, the database may be distributed over more than one computer. Whilst parts of the processing may be performed on the user's computer, other parts of the processing may be performed remotely at a remote computer.
- the visualisation graph is concerned with aspects of company dealing with personal hygiene products.
- the invention is not limited in this respect.
- the present invention finds application in any sphere where data is to be navigated. In particular, where complex interrelationships of data are to be navigated. Further applications are found where data in one or more databases is somehow related to one another. Further applications include internet applications, where metadata is accessed and used.
- the expression "visualisation graph” is intended to cover visual representations, such as navigation graphs and other such tools.
Landscapes
- Engineering & Computer Science (AREA)
- Databases & Information Systems (AREA)
- Theoretical Computer Science (AREA)
- Computational Linguistics (AREA)
- Data Mining & Analysis (AREA)
- Physics & Mathematics (AREA)
- General Engineering & Computer Science (AREA)
- General Physics & Mathematics (AREA)
- User Interface Of Digital Computer (AREA)
Abstract
Description
It has been found that conventional visualisation graphs suffer drawbacks. One problem with conventional visualisation graphs using a non-deterministic approach is that entities are arranged in a random way because the basic algorithm results in one of many possible configurations representing a local energy minimum. Thus, the orientation within the graph is not optimal.
A further problem with conventional visualisation graphs is that when changes in the graphs are initiated, for example, when a node is double clicked on in order to include further entities related to that node into the graph, conventional repulsion based simulation approaches (which are indeterministic), a problem arises in making room for the entities of the group. In particular, if a node placed close to a second node is "exploded", the repulsion between the entities is so great that the system takes an unacceptable duration to converge. Thus, the user is faced with a graph that is slow to navigate with.
A further problem with conventional visualisation graphs is that the user has access only to information concerning directly related entities. This is limiting in terms of the information the user can acquire from the system.
In particular, it is an object of the present invention to visualize complex interrelationships, for example in a semantic net, in a graph, in a flexible way, allowing the display to be used in an efficient manner.
- providing attractors which attract said entities to a predetermined sector of the
graph depending on their entity type.
By, the introduction of attractors which pull entities to certain sectors of the screen depending on their entity type (thus the name "360° Navigation Graph"), the location of each entity can be predicted without having to carry out a complete, and thus, very complex deterministic approach.
- selecting those entities from said plurality of entities having a common relation
and storing said selected entities as a plurality of groups, representing said
groups on said graph as a plurality of nodes, and representing only those
relations which all of said nodes have in common.
By grouping of entities with common relations and display of the group as one node (represented as an ellipse rather than a box in Figures 3 and 4) in the graph, and by providing lines representing only the relations that all nodes in the graph have in common, an efficient representation of the entities and an efficient use of the graph is achieved. Further, characteristics are used to identify common relations in such a way that a good distribution of nodes is achieved.
- representing a plurality of entities having a common relation as a first node on
said visualisation graph, and in response to a first predetermined stimulus
causing said entities comprised at said node to be displayed, and in response to
a further predetermined stimulus causing said graph to restructure so that
said entities displayed are replaced by said node.
By, providing the possibility to explode such groups (i.e. to display all group entities as separate nodes in the graph) by double-clicking and to put them back into the group again, links between nodes representing relations are kept to a minimum which optimises the energy in the graph. Further, it becomes easier for the user to orientate within the graph, thus, improving his navigation of the information represented in the graph.
By providing in addition, links which may not be common to all members of the group (linked by a common relation to said first node), the user has access to further navigable information.
- displaying entities which are indirectly related to said focus based on said
context and at least one predetermined user preference.
By providing the possibility to display entities which are indirectly related to the "focus" entity based on the current context and user preferences, the user is able to collect additional information even if there is no direct relationship between entities. Thus, allowing the user to "jump" from context to context within the graph. The present invention allows a user to find how large amounts of data are related. The user is able to navigate and explore knowledge domains in a visual way.
- a plurality of attractor codes processable to attract said entities to a predetermined sector of the graph depending on their entity type.
- selection code processable to select those entities from said plurality of entities having a common relation and storing said selected entities as a plurality of groups,
- representation code processable to represent said groups on said graph as a plurality of nodes, wherein only those relations which all of said nodes have in common are represented.
- representation code processable to represent a plurality of entities having a common relation as a node on said visualisation graph, and in response to a predetermined stimulus causing said entities comprised at said node to be displayed, and in response to a further predetermined stimulus causing said graph to restructure so that said entities displayed are replaced by said node.
- display code processable to display entities which are indirectly related to said focus based on said context and at least one predetermined user preference.
Figure 1 shows details of a
To facilitate orientation, certain kinds of
A first embodiment is based on a non-deterministic approach, using attractors and repulsive forces. A second, alternative embodiment, is based on a deterministic approach using a dynamic, but deterministic, subdivision of the screen and screen areas into sectors.
The first non-deterministic embodiment is now described:
It will be understood that the negotiation of sector size determined in accordance with the number of entities and how they are to be distributed causes the graph to have a particular fuzziness. This represents an important attribute of the present invention, and is achieved by the provision of the
The 360° principle may also be used to arrange nodes (refer to Figure 2) in a navigation graph without the use of repulsive forces (which is the case in some conventional visualisation graphs).
Figure 4 shows further details of the visualisation graph shown in Figure 3. In particular, Figure 4 depicts a display of a group's common relations as indicated when a mouse, or other indicator adapted for use with a computer, is passed over the desired node (MouseOver).
As shown in Figures 3 and 4, to avoid a
The selection code is dynamic resulting in a dynamic grouping of the entities. That is, depending on certain criteria such as the context, the selection and abstraction, if applied, may at different times provide different groupings.
In the example, the following facets have been defined for product properties:
Figure 7 depicts an explosion of a group into
As mentioned, in contrast to conventional visualisation graphs, an aspect of the present invention allows the formation of groups in a 2D visualisation graph whilst keeping it clear. According to an embodiment of the present invention this is achieved by keeping the space required for the nodes minimal and the origin of the added nodes traceable. Further, the graph is rearranged in a smooth way to avoid confusion of the user. According to an embodiment of the invention, the following steps are taken:
- before exploding, the group node increases repulsive force proportionally to the number of entities to be inserted in order to make room for the new nodes. The actual insertion begins, when the neighbour nodes have moved sufficiently far away.
- Although the new nodes inserted into to the graph have a direct relation
to the "focus"
node 10, this relation is only displayed indirectly: the new entities are connected to the group node which remains in the graph as "bundler" without label and establishes the relation to the "focus"node 10. Thus the number of lines connected to thecenter node 10 remains low. - While a group "bundler"
node 11 doesn't have a label in order to save space, the group's characteristics are shown when the user moves the mouse pointer over the "bundler"node 11, in the same way as shown in Fig. 4. - Double-clicking a "bundler"
node 11 causes group to collapse again into one node. - The recursive explosion and collapsing of
subgroups 18 is also possible (Fig. 7,8).
In order to enhance navigation of the visualisation graph, entities of certain types may be included in the graph even if they are far more distant to the focus, if they are considered to be of special interest in the current context either due to their entity type or due to the kind of relations linking them to the focus node.
The context in this case can be made up, but is not limited, from the following components:
- Current user's general preferences,
- Context information attached to the "focus" node, and
- Current user's current role and/or session history.
More sophisticated algorithms may be applied to find entities of special interest and it is even possible to let the user create context specific algorithms by means of a scripting language or macro recorder.
The user may use a
The expression "visualisation graph" is intended to cover visual representations, such as navigation graphs and other such tools.
Claims (12)
- A method of providing a visualisation graph on a computer comprising the steps of:characterised by:storing data corresponding to a plurality of entities having a particular type, wherein an ontology includes said entities andwherein said entities are linked to each other by a plurality of relations,in response to a query with respect to an entity selected from said plurality of entities, providing a visualisation graph representing the results of said query,providing attractors which attract said entities to a predetermined sector of the graph depending on their entity type.
- A method of providing a visualisation graph on a computer comprising the steps of:characterised by:storing data corresponding to a plurality of entities, wherein an ontology includes said entities and wherein said entities are linked to each other by a plurality of relations,in response to a query with respect to an entity selected from said plurality of entities, providing a visualisation graph representing the results of said query,selecting those entities from said plurality of entities having at least one common relation and storing said selected entities as a plurality of groups, representing said groups on said graph as a plurality of nodes, and representing only those relations which all of said nodes have in common.
- A method according to claim 2, wherein said selecting step includes abstracting said relations to find said common relation.
- A method of providing a visualisation graph on a computer comprising the steps of:characterised by:storing data corresponding to a plurality of entities, wherein an ontology includes said entities and wherein said entities are linked to each other by a plurality of relations,in response to a query with respect to an entity selected from said plurality of entities, providing a visualisation graph representing the results of said query,representing a plurality of entities having a common relation as a first node on said visualisation graph, and in response to a predetermined stimulus causing said entities comprised at said first node to be displayed, and in response to a further predetermined stimulus causing said graph to restructure so that said entities displayed are replaced by said node.
- A method according to claim 4, wherein, in response to said first predetermined stimulus, said node remains in said graph to represent said common relation.
- A method according to either of claims 4 or 5, wherein said entities are linked to a further entity or node via a link which represents a relation which may not be common to all entities linked to said first node.
- A method of providing a visualisation graph on a computer comprising the steps of:characterised by:storing data corresponding to a plurality of entities, wherein an ontology includes said entities and wherein said entities are linked to each other by a plurality of relations,in response to a query representing a predetermined context corresponding to an entity selected from said plurality of entities, providing a visualisation graph representing the results of said query, wherein the focus of said graph represents said context;displaying entities which are indirectly related to said focus based on said context and at least one predetermined user preference.
- A computer for providing a visualisation graph, said computer comprising:characterised by:a database for storing data corresponding to a plurality of entities having a particular type, wherein an ontology includes said entities and wherein said entities are linked to each other by a plurality of relations,a query interface adapted, so that in response to a query with respect to an entity selected from said plurality of entities, a visualisation graph is provided representing the results of said query,a plurality of attractor codes processable to attract said entities to a predetermined sector of the graph depending on their entity type.
- A computer for providing a visualisation graph, said computer comprising:characterised by:a database for storing data corresponding to a plurality of entities, wherein an ontology includes said entities and wherein said entities are linked to each other by a plurality of relations,a query interface adapted, so that in response to a query with respect to an entity selected from said plurality of entities, a visualisation graph is provided representing the results of said query,selection code processable to select those entities from said plurality of entities having a common relation and storing said selected entities as a plurality of groups,representation code processable to represent said groups on said graph as a plurality of nodes, wherein only those relations which all of said nodes have in common are represented.
- A computer for providing a visualisation graph, said computer comprising:characterised by:a database for storing data corresponding to a plurality of entities, wherein an ontology includes said entities and wherein said entities are linked to each other by a plurality of relations,a query interface adapted, so that in response to a query with respect to an entity selected from said plurality of entities, a visualisation graph is provided representing the results of said query,representation code processable to represent a plurality of entities having a common relation as a node on said visualisation graph, andin response to a predetermined stimulus causing said entities comprised at said node to be displayed, and in response to a further predetermined stimulus causing said graph to restructure so that said entities displayed are replaced by said node.
- A computer for providing a visualisation graph, said computer comprising:characterised by:a database for storing data corresponding to a plurality of entities, wherein an ontology includes said entities and wherein said entities are linked to each other by a plurality of relations,a query interface adapted, so that in response to a query representing a predetermined context corresponding to an entity selected from said plurality of entities, a visualisation graph is provided representing the results of said query, wherein the focus of said graph represents said context;display code processable to display entities which are indirectly related to said focus based on said context and at least one predetermined user preference.
- A program storage device readable by a processing apparatus, said device embodying a program of instructions executable by the processor to perform the steps of any one of claims 1-5.
Priority Applications (13)
| Application Number | Priority Date | Filing Date | Title |
|---|---|---|---|
| EP03077697A EP1510937A1 (en) | 2003-08-29 | 2003-08-29 | A method of providing a visualisation graph on a computer and a computer for providing a visualisation graph |
| EP03078583.6A EP1510938B1 (en) | 2003-08-29 | 2003-11-14 | A method of providing a visualisation graph on a computer and a computer for providing a visualisation graph |
| EP03078586A EP1510941A1 (en) | 2003-08-29 | 2003-11-14 | A method of providing a visualisation graph on a computer and a computer for providing a visualisation graph |
| EP03078584A EP1510939A1 (en) | 2003-08-29 | 2003-11-14 | A method of providing a visualisation graph on a computer and a computer for providing a visualisation graph |
| EP03078585A EP1510940A1 (en) | 2003-08-29 | 2003-11-14 | A method of providing a visualisation graph on a computer and a computer for providing a visualisation graph |
| JP2004246058A JP4672310B2 (en) | 2003-08-29 | 2004-08-26 | Method for providing visualization graph on display screen, computer providing the same, computer program thereof, and storage medium thereof |
| JP2004246056A JP4651329B2 (en) | 2003-08-29 | 2004-08-26 | Method for providing visualization graph on display screen, computer providing the same, computer program thereof, and storage medium thereof |
| JP2004246057A JP4537152B2 (en) | 2003-08-29 | 2004-08-26 | Method for providing a visualization graph on a computer, and computer, user terminal, computer program and storage medium for providing a visualization graph |
| JP2004246055A JP2005100375A (en) | 2003-08-29 | 2004-08-26 | Method for providing a visualization graph on a computer and computer providing a visualization graph |
| US10/927,316 US7720857B2 (en) | 2003-08-29 | 2004-08-27 | Method and system for providing an invisible attractor in a predetermined sector, which attracts a subset of entities depending on an entity type |
| US10/927,458 US7617185B2 (en) | 2003-08-29 | 2004-08-27 | Methods and systems for providing a visualization graph |
| US10/927,315 US7549309B2 (en) | 2003-08-29 | 2004-08-27 | Method and system for restructuring a visualization graph so that entities linked to a common node are replaced by the common node in response to a predetermined stimulus |
| US10/927,313 US7853552B2 (en) | 2003-08-29 | 2004-08-27 | Method and system for increasing a repulsive force between a first node and surrounding nodes in proportion to a number of entities and adding nodes to a visualization graph |
Applications Claiming Priority (1)
| Application Number | Priority Date | Filing Date | Title |
|---|---|---|---|
| EP03077697A EP1510937A1 (en) | 2003-08-29 | 2003-08-29 | A method of providing a visualisation graph on a computer and a computer for providing a visualisation graph |
Publications (1)
| Publication Number | Publication Date |
|---|---|
| EP1510937A1 true EP1510937A1 (en) | 2005-03-02 |
Family
ID=34089670
Family Applications (1)
| Application Number | Title | Priority Date | Filing Date |
|---|---|---|---|
| EP03077697A Ceased EP1510937A1 (en) | 2003-08-29 | 2003-08-29 | A method of providing a visualisation graph on a computer and a computer for providing a visualisation graph |
Country Status (1)
| Country | Link |
|---|---|
| EP (1) | EP1510937A1 (en) |
Cited By (8)
| Publication number | Priority date | Publication date | Assignee | Title |
|---|---|---|---|---|
| US7499928B2 (en) | 2004-10-15 | 2009-03-03 | Microsoft Corporation | Obtaining and displaying information related to a selection within a hierarchical data structure |
| CN102239468A (en) * | 2008-12-02 | 2011-11-09 | 起元技术有限责任公司 | Visualizing relationships between data elements and graphical representations of data element attributes |
| US9116603B2 (en) | 2012-12-26 | 2015-08-25 | Ab Initio Technology Llc | Managing interactions with data having membership in multiple groupings |
| US9852153B2 (en) | 2012-09-28 | 2017-12-26 | Ab Initio Technology Llc | Graphically representing programming attributes |
| CN110019540A (en) * | 2017-07-20 | 2019-07-16 | 阿里巴巴集团控股有限公司 | Implementation method, methods of exhibiting and the device of enterprise's map, equipment |
| US10402069B2 (en) * | 2007-12-18 | 2019-09-03 | International Business Machines Corporation | Logical zooming of a directed graph |
| CN110647574A (en) * | 2019-09-24 | 2020-01-03 | 厦门市美亚柏科信息股份有限公司 | Social network data display method, terminal device and storage medium |
| US11741091B2 (en) | 2016-12-01 | 2023-08-29 | Ab Initio Technology Llc | Generating, accessing, and displaying lineage metadata |
Citations (1)
| Publication number | Priority date | Publication date | Assignee | Title |
|---|---|---|---|---|
| WO2003069506A2 (en) * | 2002-02-12 | 2003-08-21 | Accenture Global Services Gmbh | Display of data element indicia based on data types |
-
2003
- 2003-08-29 EP EP03077697A patent/EP1510937A1/en not_active Ceased
Patent Citations (1)
| Publication number | Priority date | Publication date | Assignee | Title |
|---|---|---|---|---|
| WO2003069506A2 (en) * | 2002-02-12 | 2003-08-21 | Accenture Global Services Gmbh | Display of data element indicia based on data types |
Non-Patent Citations (9)
| Title |
|---|
| BROCKENAUER R ET AL: "Drawing Clusters and Hierarchies", LECTURE NOTES IN COMPUTER SCIENCE/COMPUTATIONAL SCIENCE (CPAIOR 2011), SPRINGER, DE, vol. 2025 / 2001, 1 June 2003 (2003-06-01), pages 193 - 227, XP002283485, ISBN: 978-3-540-24128-7 * |
| EADES P ET AL: "Navigating Clustered Graphs using Force-Directed Methods", JOURNAL OF GRAPH ALGORITHMS AND APPLICATIONS AND APPLICATIONS, BROWN UNIVERSITY, DEPT. OF COMPUTER SCIENCE, PROVIDENCE, RI, US, vol. 4, no. 3, 1 January 2000 (2000-01-01), pages 157 - 181, XP002284042, ISSN: 1526-1719 * |
| FLUIT C, SABOU M, VAN HARMELEN F: "Ontology-based Information Visualisation", FIFTH INTERNATIONAL CONFERENCE ON INFORMATION VISUALISATION (IV'01), 25 July 2001 (2001-07-25) - 27 July 2001 (2001-07-27), London, England, pages 546 - 559, XP002281069 * |
| GRAHAM J. WILLS: "NicheWorks - Interactive Visualization of Very Large Graphs", 1999, pages 190 - 212, XP007906624, Retrieved from the Internet <URL:http://www.amstat.org/PUBLICATIONS/jcgs/pdf99/wills.pdf> * |
| HERMAN I, MELANÇON G, SCOTT MARSHALL M: "Graph visualization and Navigation in Information Visualization: a Survey", IEEE TRANSACTIONS ON VISUALIZATION AND COMPUTER GRAPHICS, vol. 6, no. 1, 2000, pages 24 - 43, XP002281070 * |
| MUTTON P ET AL: "Visualization of semantic metadata and ontologies", SEVENTH INTERNATIONAL CONFERENCE ON INFORMATION VISUALISATION, 16 July 2003 (2003-07-16), pages 300 - 305, XP010648515 * |
| QUANG VINH NGUYEN; MAO LIN HUANG: "A space-optimized tree visualization", INFORMATION VISUALIZATION, 2002. INFOVIS 2002. IEEE SYMPOSIUM, 28 October 2002 (2002-10-28) - 29 October 2002 (2002-10-29), XP010625077 * |
| ROTH A: "Modellierung und Anwendung von Ontologien am Beispiel "Operations Research & Management Science"", 12 July 2002, UNIVERSITÄT PADERBORN, PADERBORN, GERMANY, XP002281071 * |
| XIAOBO WANG ET AL: "Generating customized layouts", 20 September 1995, GRAPH DRAWING. SYMPOSIUM ON GRAPH DRAWING, (PROCEEDINGS OF GRAPH DRAWING '95 - 20-22 SEPT. 1995 - PASSAU, GERMANY), SPRINGER BERLIN HEIDELBERG, BERLIN, HEIDELBERG, PAGE(S) 504 - 515, ISBN: 978-3-540-60723-6, XP019189981 * |
Cited By (18)
| Publication number | Priority date | Publication date | Assignee | Title |
|---|---|---|---|---|
| US7499928B2 (en) | 2004-10-15 | 2009-03-03 | Microsoft Corporation | Obtaining and displaying information related to a selection within a hierarchical data structure |
| US11175810B2 (en) * | 2007-12-18 | 2021-11-16 | International Business Machines Corporation | Logical zooming of a directed graph |
| US10402069B2 (en) * | 2007-12-18 | 2019-09-03 | International Business Machines Corporation | Logical zooming of a directed graph |
| US20190384486A1 (en) * | 2007-12-18 | 2019-12-19 | International Business Machine Corporation | Logical zooming of a directed graph |
| US11354346B2 (en) | 2008-12-02 | 2022-06-07 | Ab Initio Technology Llc | Visualizing relationships between data elements and graphical representations of data element attributes |
| US10860635B2 (en) | 2008-12-02 | 2020-12-08 | Ab Initio Technology Llc | Visualizing relationships between data elements |
| US10191904B2 (en) | 2008-12-02 | 2019-01-29 | Ab Initio Technology Llc | Visualizing relationships between data elements and graphical representations of data element attributes |
| US9875241B2 (en) | 2008-12-02 | 2018-01-23 | Ab Initio Technology Llc | Visualizing relationships between data elements and graphical representations of data element attributes |
| CN102239468A (en) * | 2008-12-02 | 2011-11-09 | 起元技术有限责任公司 | Visualizing relationships between data elements and graphical representations of data element attributes |
| US9767100B2 (en) | 2008-12-02 | 2017-09-19 | Ab Initio Technology Llc | Visualizing relationships between data elements |
| US9852153B2 (en) | 2012-09-28 | 2017-12-26 | Ab Initio Technology Llc | Graphically representing programming attributes |
| US9116603B2 (en) | 2012-12-26 | 2015-08-25 | Ab Initio Technology Llc | Managing interactions with data having membership in multiple groupings |
| US11741091B2 (en) | 2016-12-01 | 2023-08-29 | Ab Initio Technology Llc | Generating, accessing, and displaying lineage metadata |
| US12405949B2 (en) | 2016-12-01 | 2025-09-02 | Ab Initio Technology Llc | Generating, accessing, and displaying lineage metadata |
| CN110019540A (en) * | 2017-07-20 | 2019-07-16 | 阿里巴巴集团控股有限公司 | Implementation method, methods of exhibiting and the device of enterprise's map, equipment |
| CN110019540B (en) * | 2017-07-20 | 2023-09-29 | 阿里巴巴集团控股有限公司 | Implementation method, display method and device and equipment of enterprise map |
| CN110647574A (en) * | 2019-09-24 | 2020-01-03 | 厦门市美亚柏科信息股份有限公司 | Social network data display method, terminal device and storage medium |
| CN110647574B (en) * | 2019-09-24 | 2022-05-03 | 厦门市美亚柏科信息股份有限公司 | Social network data display method, terminal device and storage medium |
Similar Documents
| Publication | Publication Date | Title |
|---|---|---|
| US7853552B2 (en) | Method and system for increasing a repulsive force between a first node and surrounding nodes in proportion to a number of entities and adding nodes to a visualization graph | |
| US7720857B2 (en) | Method and system for providing an invisible attractor in a predetermined sector, which attracts a subset of entities depending on an entity type | |
| US7549309B2 (en) | Method and system for restructuring a visualization graph so that entities linked to a common node are replaced by the common node in response to a predetermined stimulus | |
| EP1510941A1 (en) | A method of providing a visualisation graph on a computer and a computer for providing a visualisation graph | |
| Huang et al. | On-line animated visualization of huge graphs using a modified spring algorithm | |
| US6897885B1 (en) | Invisible link visualization method and system in a hyperbolic space | |
| JP4223133B2 (en) | Interactive activated diffusion visualization method, apparatus and medium using time tube and circular tree | |
| JP4355049B2 (en) | USAGE BASED CIRCUIT AND DISPLAY METHOD, DEVICE AND MEDIUM FOR GENERALIZED GRAPH STRUCTURE | |
| US8056019B2 (en) | System and method for providing a dynamic user interface including a plurality of logical layers | |
| WO2011142720A1 (en) | A self-organizing and contextual graphical user interface | |
| JP2016167303A (en) | Data visualization based on attraction | |
| Andrienko et al. | Intelligent support for geographic data analysis and decision making in the Web | |
| Vande Moere et al. | Visualizing abstract information using motion properties of data-driven infoticles | |
| JP2009211406A (en) | Web browse history display device, method and program and computer readable recording medium | |
| Musial et al. | Application of focus+ context to UML | |
| Freire et al. | A graph-based interface to complex hypermedia structure visualization | |
| Zhang et al. | ZoomRDF: semantic fisheye zooming on RDF data | |
| KR20150102076A (en) | Managing interactions with data having membership in multiple groupings | |
| Wilkins et al. | EvolutionWorks: Towards improved visualization of citation networks | |
| Greffard et al. | Immersive dynamic visualization of interactions in a social network | |
| Roep | Implementing Layout Algorithms Using Cytoscape in ExplorViz | |
| Noppens et al. | Interactive visualization of large OWL instance sets | |
| Noppens et al. | Understanding Large Volumes of Interconnected Individuals by Visual Exploration: (System Description) | |
| Stedile | JMFGraph: a modular framework for drawing graphs in JAVA | |
| Bichler | Visualization framework for information graphs: an incremental approach |
Legal Events
| Date | Code | Title | Description |
|---|---|---|---|
| PUAI | Public reference made under article 153(3) epc to a published international application that has entered the european phase |
Free format text: ORIGINAL CODE: 0009012 |
|
| AK | Designated contracting states |
Kind code of ref document: A1 Designated state(s): AT BE BG CH CY CZ DE DK EE ES FI FR GB GR HU IE IT LI LU MC NL PT RO SE SI SK TR |
|
| AX | Request for extension of the european patent |
Extension state: AL LT LV MK |
|
| 17P | Request for examination filed |
Effective date: 20050623 |
|
| AKX | Designation fees paid |
Designated state(s): AT BE BG CH CY CZ DE DK EE ES FI FR GB GR HU IE IT LI LU MC NL PT RO SE SI SK TR |
|
| RAP1 | Party data changed (applicant data changed or rights of an application transferred) |
Owner name: SAP AG |
|
| 17Q | First examination report despatched |
Effective date: 20061026 |
|
| STAA | Information on the status of an ep patent application or granted ep patent |
Free format text: STATUS: THE APPLICATION HAS BEEN REFUSED |
|
| 18R | Application refused |
Effective date: 20130526 |