EP1505376B1 - Imaging an object with phase determination of a radiation wavefield - Google Patents
Imaging an object with phase determination of a radiation wavefield Download PDFInfo
- Publication number
- EP1505376B1 EP1505376B1 EP04027179.3A EP04027179A EP1505376B1 EP 1505376 B1 EP1505376 B1 EP 1505376B1 EP 04027179 A EP04027179 A EP 04027179A EP 1505376 B1 EP1505376 B1 EP 1505376B1
- Authority
- EP
- European Patent Office
- Prior art keywords
- representation
- intensity
- integral transform
- produce
- wave field
- Prior art date
- Legal status (The legal status is an assumption and is not a legal conclusion. Google has not performed a legal analysis and makes no representation as to the accuracy of the status listed.)
- Expired - Lifetime
Links
- 230000005855 radiation Effects 0.000 title claims abstract description 119
- 238000003384 imaging method Methods 0.000 title claims abstract description 55
- 238000000034 method Methods 0.000 claims abstract description 62
- 230000008859 change Effects 0.000 claims abstract description 49
- 238000012937 correction Methods 0.000 claims abstract description 16
- 230000001131 transforming effect Effects 0.000 claims abstract description 16
- 238000005259 measurement Methods 0.000 claims description 35
- 238000012545 processing Methods 0.000 claims description 12
- 238000004590 computer program Methods 0.000 claims 6
- 239000000835 fiber Substances 0.000 description 27
- 238000009826 distribution Methods 0.000 description 24
- 230000003287 optical effect Effects 0.000 description 13
- 238000005286 illumination Methods 0.000 description 12
- 238000013459 approach Methods 0.000 description 11
- 230000006870 function Effects 0.000 description 9
- 238000000386 microscopy Methods 0.000 description 9
- 230000009466 transformation Effects 0.000 description 7
- KFZMGEQAYNKOFK-UHFFFAOYSA-N Isopropanol Chemical compound CC(C)O KFZMGEQAYNKOFK-UHFFFAOYSA-N 0.000 description 6
- 230000004075 alteration Effects 0.000 description 6
- 238000003325 tomography Methods 0.000 description 6
- 238000011084 recovery Methods 0.000 description 5
- 239000006059 cover glass Substances 0.000 description 4
- 238000000691 measurement method Methods 0.000 description 4
- 230000010363 phase shift Effects 0.000 description 4
- 230000015556 catabolic process Effects 0.000 description 3
- 238000006731 degradation reaction Methods 0.000 description 3
- 230000008569 process Effects 0.000 description 3
- 230000000644 propagated effect Effects 0.000 description 3
- 230000001902 propagating effect Effects 0.000 description 3
- 238000005070 sampling Methods 0.000 description 3
- 238000004088 simulation Methods 0.000 description 3
- 238000005253 cladding Methods 0.000 description 2
- 230000001427 coherent effect Effects 0.000 description 2
- 238000001914 filtration Methods 0.000 description 2
- 239000012530 fluid Substances 0.000 description 2
- 238000005305 interferometry Methods 0.000 description 2
- 230000001678 irradiating effect Effects 0.000 description 2
- 239000013307 optical fiber Substances 0.000 description 2
- 239000006223 plastic coating Substances 0.000 description 2
- 238000002791 soaking Methods 0.000 description 2
- 230000003595 spectral effect Effects 0.000 description 2
- 229920003319 Araldite® Polymers 0.000 description 1
- 238000012935 Averaging Methods 0.000 description 1
- 206010042618 Surgical procedure repeated Diseases 0.000 description 1
- 238000010521 absorption reaction Methods 0.000 description 1
- 230000003044 adaptive effect Effects 0.000 description 1
- 238000004630 atomic force microscopy Methods 0.000 description 1
- 230000008901 benefit Effects 0.000 description 1
- 230000005540 biological transmission Effects 0.000 description 1
- 238000002591 computed tomography Methods 0.000 description 1
- 230000001419 dependent effect Effects 0.000 description 1
- 238000001514 detection method Methods 0.000 description 1
- 238000001493 electron microscopy Methods 0.000 description 1
- 238000007429 general method Methods 0.000 description 1
- 239000004519 grease Substances 0.000 description 1
- 239000011159 matrix material Substances 0.000 description 1
- 238000000399 optical microscopy Methods 0.000 description 1
- 230000000704 physical effect Effects 0.000 description 1
- 229920001296 polysiloxane Polymers 0.000 description 1
- 229910052704 radon Inorganic materials 0.000 description 1
- SYUHGPGVQRZVTB-UHFFFAOYSA-N radon atom Chemical compound [Rn] SYUHGPGVQRZVTB-UHFFFAOYSA-N 0.000 description 1
- 238000004611 spectroscopical analysis Methods 0.000 description 1
- 238000001228 spectrum Methods 0.000 description 1
- 238000012360 testing method Methods 0.000 description 1
- 238000012876 topography Methods 0.000 description 1
- 230000007704 transition Effects 0.000 description 1
- 238000012800 visualization Methods 0.000 description 1
Images


Classifications
-
- G—PHYSICS
- G01—MEASURING; TESTING
- G01J—MEASUREMENT OF INTENSITY, VELOCITY, SPECTRAL CONTENT, POLARISATION, PHASE OR PULSE CHARACTERISTICS OF INFRARED, VISIBLE OR ULTRAVIOLET LIGHT; COLORIMETRY; RADIATION PYROMETRY
- G01J9/00—Measuring optical phase difference; Determining degree of coherence; Measuring optical wavelength
- G01J9/02—Measuring optical phase difference; Determining degree of coherence; Measuring optical wavelength by interferometric methods
-
- G—PHYSICS
- G01—MEASURING; TESTING
- G01B—MEASURING LENGTH, THICKNESS OR SIMILAR LINEAR DIMENSIONS; MEASURING ANGLES; MEASURING AREAS; MEASURING IRREGULARITIES OF SURFACES OR CONTOURS
- G01B9/00—Measuring instruments characterised by the use of optical techniques
- G01B9/02—Interferometers
- G01B9/02083—Interferometers characterised by particular signal processing and presentation
- G01B9/02084—Processing in the Fourier or frequency domain when not imaged in the frequency domain
-
- G—PHYSICS
- G01—MEASURING; TESTING
- G01B—MEASURING LENGTH, THICKNESS OR SIMILAR LINEAR DIMENSIONS; MEASURING ANGLES; MEASURING AREAS; MEASURING IRREGULARITIES OF SURFACES OR CONTOURS
- G01B9/00—Measuring instruments characterised by the use of optical techniques
- G01B9/02—Interferometers
- G01B9/02083—Interferometers characterised by particular signal processing and presentation
-
- G—PHYSICS
- G01—MEASURING; TESTING
- G01J—MEASUREMENT OF INTENSITY, VELOCITY, SPECTRAL CONTENT, POLARISATION, PHASE OR PULSE CHARACTERISTICS OF INFRARED, VISIBLE OR ULTRAVIOLET LIGHT; COLORIMETRY; RADIATION PYROMETRY
- G01J1/00—Photometry, e.g. photographic exposure meter
- G01J1/42—Photometry, e.g. photographic exposure meter using electric radiation detectors
- G01J1/44—Electric circuits
-
- G—PHYSICS
- G01—MEASURING; TESTING
- G01J—MEASUREMENT OF INTENSITY, VELOCITY, SPECTRAL CONTENT, POLARISATION, PHASE OR PULSE CHARACTERISTICS OF INFRARED, VISIBLE OR ULTRAVIOLET LIGHT; COLORIMETRY; RADIATION PYROMETRY
- G01J9/00—Measuring optical phase difference; Determining degree of coherence; Measuring optical wavelength
-
- G—PHYSICS
- G02—OPTICS
- G02B—OPTICAL ELEMENTS, SYSTEMS OR APPARATUS
- G02B27/00—Optical systems or apparatus not provided for by any of the groups G02B1/00 - G02B26/00, G02B30/00
- G02B27/42—Diffraction optics, i.e. systems including a diffractive element being designed for providing a diffractive effect
- G02B27/46—Systems using spatial filters
-
- G—PHYSICS
- G06—COMPUTING; CALCULATING OR COUNTING
- G06T—IMAGE DATA PROCESSING OR GENERATION, IN GENERAL
- G06T5/00—Image enhancement or restoration
- G06T5/10—Image enhancement or restoration using non-spatial domain filtering
-
- G—PHYSICS
- G06—COMPUTING; CALCULATING OR COUNTING
- G06T—IMAGE DATA PROCESSING OR GENERATION, IN GENERAL
- G06T5/00—Image enhancement or restoration
- G06T5/70—Denoising; Smoothing
-
- G—PHYSICS
- G01—MEASURING; TESTING
- G01J—MEASUREMENT OF INTENSITY, VELOCITY, SPECTRAL CONTENT, POLARISATION, PHASE OR PULSE CHARACTERISTICS OF INFRARED, VISIBLE OR ULTRAVIOLET LIGHT; COLORIMETRY; RADIATION PYROMETRY
- G01J3/00—Spectrometry; Spectrophotometry; Monochromators; Measuring colours
- G01J3/28—Investigating the spectrum
- G01J3/2803—Investigating the spectrum using photoelectric array detector
- G01J2003/282—Modified CCD or like
-
- G—PHYSICS
- G01—MEASURING; TESTING
- G01J—MEASUREMENT OF INTENSITY, VELOCITY, SPECTRAL CONTENT, POLARISATION, PHASE OR PULSE CHARACTERISTICS OF INFRARED, VISIBLE OR ULTRAVIOLET LIGHT; COLORIMETRY; RADIATION PYROMETRY
- G01J9/00—Measuring optical phase difference; Determining degree of coherence; Measuring optical wavelength
- G01J9/02—Measuring optical phase difference; Determining degree of coherence; Measuring optical wavelength by interferometric methods
- G01J2009/0203—Phased array of beams
-
- G—PHYSICS
- G06—COMPUTING; CALCULATING OR COUNTING
- G06T—IMAGE DATA PROCESSING OR GENERATION, IN GENERAL
- G06T2207/00—Indexing scheme for image analysis or image enhancement
- G06T2207/20—Special algorithmic details
- G06T2207/20048—Transform domain processing
- G06T2207/20056—Discrete and fast Fourier transform, [DFT, FFT]
Definitions
- This invention relates to the determination of phase of a radiation wave field.
- the invention also relates to a range of applications in which phase information about a radiation wave field can be used.
- the term "radiation wave field" is intended to include all forms of radiation that propagate in a wave like manner including but not limited to examples such as X-rays, visible light and electrons.
- phase measurement techniques include the fields of x-ray imaging, electron microscopy, optical microscopy as well as optical tomography and x-ray phase tomography.
- Phase is typically measured using interferometers of various types.
- the key feature of interferometry is the ability to quantitatively measure the phase of a wave field. Whilst interferometry based techniques retain significant importance it has been recognised that non-interferometric techniques may be used to provide phase information.
- a number of non-interferometric approaches involve attempting to solve a transport of intensity equation for a radiation wave field. This equation relates the irradiance and phase of a paraxial monochromatic wave to its longitudinal irradiance derivative and is described in M.R. Teague, "Deterministic Phase Retrieval: A Green's Function Solution” J. Opt. Soc. Am. 73 1434-1441 (1983 ). The article " Phase imaging by the transport of intensity equation” by N.
- a measurement of phase In combination with a direct measurement of intensity a measurement of phase allows the phase and intensity at any other plane in the radiation wave field to be determined using known techniques.
- the invention also provides the basis for a number of measurement techniques.
- the selected surface can take any form that extends across the direction of propagation of the radiation including planar, part-spherical and part-cylindrical surfaces.
- the first and second integral transforms can be of any suitable type and include approximations employed for computational convenience, speed or efficiency.
- the first and second integral transforms are preferably produced using a Fourier transform. More preferably, the transform is a Fast Fourier transform.
- the method and apparatus provide for determination of phase of a radiation wave field in a manner that is computationally significantly less complex than prior art approaches. This results in significantly lower computation times. In some examples computation times improved by many orders of magnitude have been achieved.
- the first and second differential operators are preferably second order differential operators.
- the first filter is substantially the same as the second filter. It is further preferred that at least one of the first and second filters includes a correction for noise in the representative measure of intensity.
- the first filter can comprise selectively suppressing first higher frequencies of the first integral transform representation.
- the second filter can comprise selectively suppressing second higher frequencies of said second integral transform representation.
- the correction based on the measure of intensity over a selected surface can be a nil correction where the intensity variations are less than a predetermined selected amount.
- the measure of the rate of change of intensity and intensity distribution over the selected surface are produced from measurements of the intensity distribution over at least two surfaces extending across the wave field and spaced apart along the direction of propagation of the radiation.
- the representative measure of rate of change intensity in the direction of radiation propagation is produced by obtaining a first representative measurement over a measurement surface extending across the direction of propagation for radiation of a first energy and obtaining a second representative measurement over said measurement surface for radiation of a second different energy.
- the change in radiation energy can be achieved by changing the X-ray target or by suitable filtering.
- the selected surface for which measurements of intensity and rate of change of intensity are produced is preferably located between two of the spaced apart surfaces over which intensity distribution is measured.
- the selected surface and spaced apart surfaces are planar. It is further preferred that the planes are generally perpendicular to the average direction of propagation of the radiation
- the method and apparatus of this example can be at least partly implemented using a suitably programmed computer.
- the processing means can be any suitable processing means.
- the method and apparatus of this invention can be at least partly implemented using a suitably programmed computer.
- the processing means preferably comprises a suitably programmed computer and the steps of the method are preferably performed using a suitably programmed computer.
- intensity input information may take the form of digitised images or data containing information from such images.
- a dedicated Fast Fourier transform chip can be employed as at least part of the processing means.
- the representative measure of rate of change of intensity is preferably produced by subtraction of representative measurements respectively made at locations over the spaced apart surfaces.
- the representative measures of intensity and rate of change of intensity are obtained by sampling measurements at selected locations over the surface. Preferably the sampling and measurements are made at locations defining a regular array over the surface. This can be readily achieved for example by using a CCD (charge coupled device) as the detector.
- CCD charge coupled device
- the direction of propagation of the radiation wave field is selected to be the z direction of a Cartesian co-ordinate system and x and y components of phase are produced separately.
- the measure of rate of change of intensity is preferably multiplied by the negative of the average wave number of the radiation before the integral transformation into the Fourier domain.
- the representative measure of intensity over the spaced apart surfaces can be obtained by imaging of that surface through an appropriate imaging system. That is, the intensity information may be imaged to a detector rather than measured at the surface.
- the method thus provides for the quantitative and decoupled determination of phase and intensity of a radiation wave field at any surface across the direction of propagation of the radiation. From this phase and intensity determination it is possible to calculate the phase and intensity at any other surface along the direction of propagation. Accordingly, the method provides the basis for a number of measurement techniques.
- an apparatus for imaging an object including
- the radiation used to irradiate the object can be a planar wave field or spherical wave field or an arbitrary wave field. If it is desired to reproduce the phase in the object plane the phase wave field determined by the above method and apparatus is back propagated and the wave field used to irradiate is subtracted.
- the method and apparatus of imaging substantially incorporates the determination of phase as disclosed in relation to the first and second examples.
- the preferred examples described in relation to those aspects above are also applicable to the method and apparatus of imaging.
- the object can be reconstructed in the object plane by back propagating the intensity and quantitative phase information to numerically reconstruct an image of the actual object phase and intensity structure.
- more than two image plane intensity distribution measurements can be made to obtain a better estimate of the rate of change of intensity or intensity derivative.
- one or both of the source to object or object to image plane distances is changed and another intensity distribution measurement is made. The procedure is repeated until the desired number of measurements is made.
- the measurements provide data to which a function can be fitted for the determination of rate of change of intensity.
- the method of imaging an object has particular application to point projection microscopy using X-rays, visible light or electrons.
- Aanother example provides a method of phase amplitude imaging including the steps of
- an apparatus for phase amplitude imaging of an object including a radiation wave field source to irradiate said object; an imaging system to focus radiation from said object to an imaging surface extending across the wave field propagating from the object; means to produce a representative measure of radiation intensity over said imaging surface; said imaging system including selectively operable means to adjust said focus of said radiation to said imaging surface to at least a first focus and a second focus; processing means to:
- the numerical aperture of the irradiating wave field is smaller than the numerical aperture of the imaging system.
- the imaging surface is a detector.
- the detector is of any suitable form, such as for example a CCD camera.
- the first focus corresponds to an in focus image at the surface and the changed focus to a slightly defocussed image.
- Either negative or positive defocus may be used.
- the defocus is preferably small so that degradation in spatial resolution is minimised. In some applications more than two images may be obtained to obtain a better estimate of the rate of change of intensity.
- the method and apparatus for phase amplitude imaging substantially incorporates the determination of phase as disclosed in relation to the first and second examples.
- the preferred aspects of the described in relation to those aspects above are also applicable to the method and apparatus of imaging.
- the method is used for quantitative phase amplitude microscopy.
- the imaging system is a magnification system.
- the surface is preferably planar.
- Figures 1(a) and (b) show a schematic arrangement for phase determination in accordance with this invention where an object is illuminated by plane-wave radiation 2 or point source radiation 2 to produce reflected beams 3.
- an optical beam At each point in space, an optical beam possesses two properties: intensity and phase. Intensity is a measure of the amount of energy flowing through each point, while phase gives a measure of the direction of the energy flow.
- Intensity may be measured directly, for example by recording an image on film.
- Phase is typically measured using interference with a "reference beam”.
- the present method gives a non-interferometric method for measuring phase.
- Intensity can be measured over two parallel planes A, B extending across the direction of propagation of the wave field on the side remote from the incident radiation.
- I is the intensity in the plane
- the gradient operator in the plane is denoted ⁇ ⁇
- k is the wave number of the radiation
- ⁇ l / ⁇ z is the intensity derivative or rate of change of intensity. Note that ⁇ l / ⁇ z is estimated from the difference of the measurements in the planes A & B shown in Figure 1 , while the intensity I is given by the average of the measurements.
- the function f ⁇ ( k x ,k y ) is called the "Fourier transform" off(x,y).
- F denotes Fourier transformation
- F -1 denotes inverse Fourier transformation
- (k x ky) are the Fourier variables conjugate to (x,y)
- k r 2 k x 2 + k y 2 .
- Equation (14) relating to the experimental setup in use to quantify the variables k x , k y .
- Equation (14) relating to the experimental setup in use to quantify the variables k x , k y .
- ⁇ y - 2 ⁇ ⁇ ⁇ z ⁇ 1 N ⁇ x 2 ⁇ F - 1 ⁇ i i 2 + j 2 ⁇ F ⁇ 1 I x y ⁇ F - 1 ⁇ i i 2 + j 2 ⁇ F I + - I .
- the pixel size can be determined directly for example from the CCD detector geometry (in the case of direct imaging), or by existing techniques for calibrating the transverse distance scales (in the case of an imaging system), the defocus distance can be measured directly, and the spectral distribution of the illumination can be determined either by monochromating the incident field or by analysing the spectral distribution of the radiation using existing spectroscopic methods.
- phase-retrieval method implementing the solution of equation (14) can be represented by the flowchart shown in Figure 2 .
- the quantitative determination of phase of a radiation wave field proceeds from a set of intensity measurements ⁇ I n ⁇ over the two spaced apart planes A and B.
- a measurement of central intensity I(x,y) in a selected plane parallel to and midway between the planes A and B is also obtained.
- the intensity measurements are performed over a defined array on each of the two planes A and B and the respective values subtracted to produce a measure of the intensity derivative. This value is multiplied by the negative of the average wave number.
- the data are split into two component sets and a fast Fourier transform is performed to produce the respective x and y components in the Fourier domain.
- a filter is then applied to the Fourier domain representations to correspond to the inversion of a differential operator reflected in the untransformed representation.
- the differential operator is represented by ⁇ x - 1 ⁇ ⁇ ⁇ 2 for the x component and ⁇ y - 1 ⁇ ⁇ ⁇ 2 for the y component.
- An inverse Fourier transform is then performed on each of the x and y components to produce a spatial domain value from which the differential operator has been removed.
- a division by the central intensity I(x,y) obtained by averaging the intensity measurements over planes A and B is then performed if the intensity level is above a selected threshold level.
- the resultant data is again Fourier transformed and multiplied by the same filter to again correspond to the inversion of a differential operator reflected in the untransformed data.
- the differential operator is again represented by ⁇ x - 1 ⁇ ⁇ ⁇ 2 for the x component and ⁇ y - 1 ⁇ ⁇ y ⁇ 2 for the y component .
- the resultant components are again inverse Fourier transformed and summed to provide a retrieved phase measurement.
- the method according to this invention can proceed from any suitable representative determination of intensity derivative or rate of change of intensity over a selected surface extending across the propagation direction and the intensity over that same surface.
- these data can be obtained in a variety of ways and the method implemented to yield phase of the radiation wave field.
- ⁇ y x y F - 1 ⁇ ⁇ y k x k y ⁇ ⁇ F ⁇ 1 I x y ⁇ F - 1 ⁇ ⁇ y k x k y ⁇ ⁇ F k ⁇ ⁇ I ⁇ z
- ⁇ is the regularization parameter used to stabilize the algorithm when noise is present.
- the solution to the transport of intensity equation (1) assumes a perfect imaging system. That is, there are no "aberrations" present in the optical system used to obtain the intensity data which is fed into the algorithm. Of course, no imaging system is perfect.
- the imperfections present in an imaging system may be quantified by a set of numbers: A 1 , A 2 , A 3 , ... which are termed aberration coefficients.
- phase-retrieval algorithm F - 1 F I aberrated x y - 1 - 2 ⁇ ⁇ . ⁇ z . ⁇ ⁇ ⁇ k x 2 + k y 2 - 2 ⁇ m ⁇ n A mn k x m ⁇ k y n , where:
- ⁇ ⁇ k x , k y , ⁇ , A 1 , A 2 , A 3 , ... 1 - 2 ⁇ ⁇ . ⁇ z . ⁇ ⁇ ⁇ k x 2 + k y 2 - 2 ⁇ m ⁇ n A mn k x m ⁇ k y n
- ⁇ I aberrated ( x , y )-1 ⁇ is a measure of rate of change of intensity.
- I 0 intensity is a measurable constant for uniform intensity so that (20) is the same general form as (15). Consequently the special case of aberration can be dealt with by changing the filter in the general method described above.
- FIG. 1(a) A simulation was conducted in accordance with the arrangement shown in Figure 1(a) corresponding to planar illumination.
- the example shows the operation of the method on simulated noise-free data.
- Diffraction patterns are calculated using the "angular-spectrum" formalism, an orthodox procedure.
- Figures 3(a) to 3(f) show images produced in the simulation.
- Figures 4(c) through (e) respectively show the propagated intensity at propagation distances of 199,200 and 201 mm; note the intermixing of information from Figures 4 (a) and (b) in the intensity measurements of Figures 4 (c), (d) and (e ).
- radiation such as X-rays, visible light or electrons from a point source 10 is allowed to propagate through free space to the object 11, located at a distance d so from the source.
- the radiation passes through the object 11, and is allowed to propagate a further distance d od to one of the image planes I 1 , I 2 ... I n in which the intensity of the radiation is detected.
- This detection is performed using a standard device such as a CCD camera, image plate or other device capable of registering and digitising the intensity distribution.
- One or both of the distances d so and/or d sd is then changed so as to introduce defocus into the images and the intensity distribution is measured once again.
- the case of d od 0 corresponding to contact-imaging with zero propagation distance is included as one possible measurement.
- the intensity data is then processed using the above phase recovery method, to recover the decoupled intensity and phase information in the imaging plane.
- Parameters such as wavelength, pixel size, and defocus distances are inserted into the algorithm as explained above, to yield quantitative information about the magnitude of the phase shift in the image plane.
- the intensity and quantitative phase information obtained above can be used to back propagate the light field to the object plane, thereby numerically reconstructing an image of the actual object phase and intensity structure. This can be done using standard diffraction code.
- Figure 6 schematically shows an arrangement for quantitative phase amplitude microscopy.
- a sample is illuminated using a source of white light. Köhler illumination 15, commonly found on optical microscopes.
- the light is transmitted through an object 16 and collected by a microscope imaging system 17 and relayed to a CCD camera 18 or other digital imaging device having a planar imaging surface.
- Three images are collected: an in-focus image, I o , and two slightly out of focus images I + and I - .
- the defocus is obtained by suitable means such as a drive system 19 to adjust the microscope focus knob.
- the defocus introduced is usually quite small so that degradation in spatial resolution is minimised, although the optimal amount of defocus to use is determined by sample properties and imaging geometry such as magnification, numerical apertures, etc.
- the numerical aperture of the condenser is chosen to be less than the numerical aperture of the objective being used. If this is not the case then serious image degradation will occur, although the precise amount by which the condenser and objective numerical apertures should differ involves a tradeoff between image fidelity and spatial resolution, with the optimal difference depending on the sample properties and the optics used.
- Intensity data from the collected images I + and I - are subtracted to produce a representative measure of rate of change of intensity (intensity derivative). From this and the intensity data of collected image I o the method described above can be used to produce quantitative information about the magnitude of the phase shift in the image plane.
- Example 2 for point projection, there may be cases in which it is desirable to take more than two images in order to obtain a better estimate of the intensity derivative dl/dz.
- a function can then be fitted to this data from which dl/dz can be computed and used in the phase determination method in place of the simple subtraction of two images normally used.
- FIG. 7 An experimental implementation is shown in Figure 7 .
- An Olympus BX-60 optical microscope 20 was equipped with a set of UMPlan metallurgical objectives and a universal condenser to provide Köhler illumination.
- Nomarski DIC optics and a set of cover-slip corrected UplanApo objectives were also acquired for this microscope, enabling images to be taken of the same field of view using both phase retrieval and Nomarski DIC for the purposes of qualitative comparison.
- a 12-bit scientific grade Photometrics SenSys CCD camera 21 equipped with a 1300x1035 pixel Kodak KAF-1400 CCD chip was added to the 0.5x video port on the microscope to acquire digital images of the sample.
- phase recovery technique of this embodiment of the invention requires the acquisition of defocused images.
- a stepper motor drive system 22 was attached to the focus knob of the microscope. This stepper motor 22 was attached to the parallel port of a 133MHz Pentium PC 23 also used to control the CCD camera 21, enabling full automation of the acquisition of through-focus image sequences.
- This data acquisition system was linked to custom software written to recover phase images from the CCD images, thereby enabling full automation of the image acquisition and data processing sequences.
- phase imaging using this invention can accurately measure the phase structure of microscopic samples it was necessary to have a sample with a well-characterised geometry and refractive index distribution.
- a 3M F-SN-3224 optical fibre (a commercial fibre made by 3M) was used. Independent measurements of the refractive index distribution obtained using atomic force microscopy and commercial profiling techniques were available enabling accurate prediction of the phase structure of the exit wave field.
- Another advantage of this fibre was that it had three regions of different refractive indices, an inner and outer cladding as well as the core, whereas most fibres simply have a cladding and core. This provided an additional test for the phase imaging system because it had to accurately image three transitions in refractive index rather than just two.
- the optical fibre was imaged side-on so as to obtain a projection of the refractive index through all layers of the fibre structure. This was done by first stripping the plastic sheath from the fibre by soaking it in isopropyl alcohol then using a commercial fibre stripper to remove the plastic coating. A small segment of fibre, typically a strand of approximately one to two centimetres in length, was placed on a microscope slide, immersed in a pool of index matching fluid and covered with a 0.15mm thick cover glass. Any tilt on the cover glass would introduce a spurious tilt into the recovered phase so two small sections of fibre, both of similar diameter to the sample, were placed parallel to and about 0.5cm either side of the main fibre. The cover class was then placed across all three fibres to ensure that it was as parallel to the microscope slide as practically possible.
- Figure 9 shows a comparison of the measured and expected phase profiles with the uncertainties indicated in the figure representing one standard deviation of the data along the length of the fibre. This variation is thought to be primarily due to spatial variations in thickness of the cover glass and microscope slide. As can be seen, the recovered and expected phase profiles are in good agreement with one another, with the predicted profile lying within the error bars of the profile produced using the technique of this invention.
- This example demonstrates the application of quantitative phase microscopy to the three-dimensional imaging of objects through the use of computed-tomography techniques. This is possible using the techniques of this invention because the phase shifts introduced by the object can be directly measured independently of any intensity variations in the object, thus an inverse Radon transform can be used to recover the three-dimensional structure directly from the projection data.
- an inverse Radon transform can be used to recover the three-dimensional structure directly from the projection data.
- the previously described arrangements included a stepper motor drive system 22 attached to the parallel port of the same 133MHz Pentium PC used to control the CCD camera 21 to drive the focus knob of the microscope.
- a second stepper motor 25 was connected to the second channel of the motor drive system 24 for the purposes of rotating the sample.
- This data acquisition system was linked to custom software written to recover phase images from the CCD images, thereby enabling full automation of the image acquisition and data processing sequence.
- Each data set was collected using the same microscope as in Example 3 - an Olympus BX-60 optical microscope equipped with a set of cover-slip corrected UplanApo objectives and a universal condenser to provide Köhler illumination.
- Digital images were captured using a 12-bit Photometrics SenSys CCD camera equipped with a Kodak KAF-1400 1300x1035 pixel CCD chip on the 0.5x video port of the microscope.
- the plastic sheath was removed from a small segment of the end of a section of fibre, typically about one centimetre in length, by soaking the fibre in isopropyl alcohol then using a commercial fibre stripper to remove the plastic coating. The fibre was then cut into a small segment of approximately one inch in length, with the unstripped end then being slid into the end of a 26 gauge, 100mm syringe needle 27 and fixed into position with a small' amount of 5 minute Araldite. A mount 28 was used to attach the needle 27 to stepper motor 25. A pool of index-matching fluid 29 surrounds the fibre 26 as shown in Figure 11 , with a microscope slide 30 affixed underneath the fibre using silicone grease and a 0.15mm thick cover glass 31 placed over the top.
- the images taken were 500x500 pixels in size which conveniently spanned not only the width of the fibre but also the whole region of precession.
- As the refractive index profile of this fibre was known for 632.8nm (HeNe laser) light, a 625 ⁇ 10nm band-pass interference filter was inserted into the illumination system to ensure that the recovered phase profiles were obtained at a wavelength as close as possible to that for which data on the fibre was available.
- Each phase image was processed from images taken at ⁇ 2 ⁇ m either side of best focus, and data was collected from 100 independent angles through 180 degrees equally spaced in steps of 1.8 degrees between images.
- a typical tomographic phase image is shown in Figure 12 .
- the projection data in the form the reconstructed phase images, were then processed into three-dimensional data sets using a simple slice-by-slice implementation of the summation of filtered back-projections algorithm, with code to perform the tomographic reconstruction written in the IDUPV-Wave programming language.
- the data sets were aligned to a common rotation axis by taking profiles through the phase data sets and compiling them into a sinogram.
- a sinusoid was then fitted to prominent features on the data in order to determine the location of the rotation axis and the data was digitally shifted so that the rotation axis coincided with the middle column of the sinogram to simplify the reconstruction process.
- Fitting a curve to the phase profiles also enabled misaligned data sets to be moved back into line, which in turn improved the quality of the reconstructed image.
- This realigned projection data was then transformed into a single slice through the object by back-projecting the collated phase data after filtering the projections to suppress the 1/ r point spread function associated with back-projected reconstructions. These slices through the object were then stacked up on top of each other to produce a full three-dimensional refractive index distribution of the sample.
- FIG. 13 A slice through the reconstructed refractive index distribution is shown in Figure 13 . Note that all three regions of different refractive index are clearly resolved and that these regions form concentric cylinders, as is expected for this sample.
- a line profile through the centre of this reconstruction is shown in Figure 13 (dashed line) alongside the known refractive index distribution for this fibre (solid line). The values in the tomographic reconstruction are very close to those of the known profile, which confirms the quantitative phase tomography technique.
Landscapes
- Physics & Mathematics (AREA)
- General Physics & Mathematics (AREA)
- Engineering & Computer Science (AREA)
- Spectroscopy & Molecular Physics (AREA)
- Signal Processing (AREA)
- Theoretical Computer Science (AREA)
- Mathematical Physics (AREA)
- Optics & Photonics (AREA)
- Analysing Materials By The Use Of Radiation (AREA)
- Investigating Or Analysing Materials By Optical Means (AREA)
- Power Steering Mechanism (AREA)
- Control Of High-Frequency Heating Circuits (AREA)
- Inorganic Insulating Materials (AREA)
- Apparatus For Radiation Diagnosis (AREA)
- Investigating Or Analyzing Materials By The Use Of Ultrasonic Waves (AREA)
- Measurement Of Radiation (AREA)
- Length Measuring Devices By Optical Means (AREA)
Abstract
Description
- This invention relates to the determination of phase of a radiation wave field. The invention also relates to a range of applications in which phase information about a radiation wave field can be used. As used in this specification the term "radiation wave field" is intended to include all forms of radiation that propagate in a wave like manner including but not limited to examples such as X-rays, visible light and electrons.
- Techniques for the measurement of the phase of a radiation wave field have many applications in fundamental physics and as a basis for a number of measurement techniques involving various physical properties. Examples of applications of phase measurement techniques include the fields of x-ray imaging, electron microscopy, optical microscopy as well as optical tomography and x-ray phase tomography.
- Phase is typically measured using interferometers of various types. The key feature of interferometry is the ability to quantitatively measure the phase of a wave field. Whilst interferometry based techniques retain significant importance it has been recognised that non-interferometric techniques may be used to provide phase information. A number of non-interferometric approaches involve attempting to solve a transport of intensity equation for a radiation wave field. This equation relates the irradiance and phase of a paraxial monochromatic wave to its longitudinal irradiance derivative and is described in M.R. Teague, "Deterministic Phase Retrieval: A Green's Function Solution" J. Opt. Soc. Am. 73 1434-1441 (1983). The article "Phase imaging by the transport of intensity equation" by N. Streibl, Opt. Comm. 49 6-10 (1984), describes an approach based on the transport of intensity equation by which phase structure can be rendered visible by the use of defocus and digital subtraction of intensity data obtained at various defocused distances. This approach only provides for phase visualisation and does not provide for the measurement of phase shift. Another approach based on solving the transport of intensity equation is disclosed in T.E. Gureyev, K.A. Nugent, D. Paganin and A. Roberts, "Rapid phase retrieval using a Fast Fourier transform", Adaptive Optics, and T.E. Gureyev and K.A. Nugent, "Rapid quantitative phase imaging using the transport of intensity equation", Opt. Comm., 133 339-346 (1997). This approach allows the phase of a light field to be recovered from two closely spaced intensity measurements when an illuminating beam has an arbitrary, but everywhere non zero intensity distribution limited by rectangular aperture. Whilst this approach can be used for non-uniform intensity distributions the extent of the non uniformity is limited and introduces significant computational complexity. Consequently this approach is not able to cope with non uniformities introduced by some sample absorption profiles or in some intensity illumination distributions. This approach is strictly also only applicable to coherent wave fields.
- The article K.A. Nugent, T.E. Gureyev, D.F. Cookson, D. Paganin and Z. Barnea "Quantitative phase imaging using hard X-rays" (1996) 77 Phys. Rev. Lett. 2961-2964 is also based on a solution to the transport of intensity equation. Again the technique described cannot be applied to a non-uniform intensity distribution.
- Other approaches based on a solution to the transport of intensity equation limited to a requirement of uniformity are described in T.E. Gureyev, K.A. Nugent, A. Roberts "Phase retrieval with the transport-of-intensity equation: matrix solution with the use of Zernike polynomials" J. Opt. Soc. Am. A ) and T.E. Gureyev, A. Roberts and K.A. Nugent "Partially coherent fields, the transport-of-intensity equation, and phase uniqueness", J. Opt. Soc. Am. A ).
- A technique for recovery of phase in the case of non-uniform illumination is described in T.E. Gureyev and K.A. Nugent "Phase retrieval with the transport-of-intensity equation. II. Orthogonal series solution for nonuniform illumination", J. Opt. Soc. Am. A ). This approach is based on a method of orthogonal expansions and can be computationally complex in implementation. In many applications this complexity makes the technique impractical.
- The present invention as been made in view of the problems and provides a solution as claimed in the independent claims. Advantageous and preferred embodiments of the invention are defined by the dependent claims.
- In combination with a direct measurement of intensity a measurement of phase allows the phase and intensity at any other plane in the radiation wave field to be determined using known techniques. The invention also provides the basis for a number of measurement techniques.
- In accordance with a first example there is provided a method of quantitative determination of the phase of a radiation wave field including the steps of
- (a) producing a representative measure of the rate of change of intensity of said radiation wave field over a selected surface extending generally across the wave field;
- (b) producing a representative measure of intensity of said radiation wave field over said selected surface;
- (c) transforming said measure of rate of change of intensity to produce a first integral transform representation and applying to said first integral transform representation a first filter corresponding to the inversion of a first differential operator reflected in said measure of rate of change of intensity to produce a first modified integral transform representation;
- (d) applying an inverse of said first integral transform to said first modified integral transform representation to produce an untransformed representation;
- (e) applying a correction based on said measure of intensity over said selected surface to said untransformed representation;
- (f) transforming the corrected untransformed representation to produce a second integral transform representation and applying to said second integral transform representation a second filter corresponding to the inversion of a second differential operator reflected in the corrected untransformed representation to produce a second modified integral transform representation;
- (g) applying an inverse of said second integral transform to said second modified integral transform representation to produce a measure of phase of said radiation wave field across said selected plane.
- In accordance with a second example there is provided an apparatus for quantitative determination of the phase of a radiation wave field including
- (a) means to produce a representative measure of the rate of change of intensity of said radiation wave field over a selected surface extending generally across the direction of propagation;
- (b) means to produce a representative measure of intensity of said radiation wave field over said selected surface;
- (c) processing means to sequentially
- (I) transform said measure of rate of change of intensity to produce a first integral transform representation;
- (II) apply to said first integral transform representation a first filter corresponding to the inversion of a first differential operator reflected in said measure of rate of change of intensity to produce a first modified integral transform representation;
- (III) apply an inverse of said first integral transform to said first modified integral transform representation to produce an untransformed representation;
- (IV) apply a correction based on said measure of intensity over said selected surface to said untransformed representation;
- (V) transform the corrected untransformed representation to produce a second integral transform representation;
- (VI) apply to said second integral transform representation a second filter corresponding to the inversion of a second differential operator reflected in the corrected untransformed representation to produce a second modified integral transform representation; and
- (VII) apply an inverse of said second integral transform to said second modified integral transform representation to produce a measure of phase of said radiation wave field across said selected plane.
- The selected surface can take any form that extends across the direction of propagation of the radiation including planar, part-spherical and part-cylindrical surfaces.
- The first and second integral transforms can be of any suitable type and include approximations employed for computational convenience, speed or efficiency.
- The first and second integral transforms are preferably produced using a Fourier transform. More preferably, the transform is a Fast Fourier transform. The method and apparatus provide for determination of phase of a radiation wave field in a manner that is computationally significantly less complex than prior art approaches. This results in significantly lower computation times. In some examples computation times improved by many orders of magnitude have been achieved.
- The first and second differential operators are preferably second order differential operators. In the preferred implementation of the method and apparatus the first filter is substantially the same as the second filter. It is further preferred that at least one of the first and second filters includes a correction for noise in the representative measure of intensity.
- In one example the first filter can comprise selectively suppressing first higher frequencies of the first integral transform representation. In this example the second filter can comprise selectively suppressing second higher frequencies of said second integral transform representation.
- The correction based on the measure of intensity over a selected surface can be a nil correction where the intensity variations are less than a predetermined selected amount.
- Preferably, the measure of the rate of change of intensity and intensity distribution over the selected surface are produced from measurements of the intensity distribution over at least two surfaces extending across the wave field and spaced apart along the direction of propagation of the radiation. In another example the invention the representative measure of rate of change intensity in the direction of radiation propagation is produced by obtaining a first representative measurement over a measurement surface extending across the direction of propagation for radiation of a first energy and obtaining a second representative measurement over said measurement surface for radiation of a second different energy. In the case of X-ray radiation, for example, the change in radiation energy can be achieved by changing the X-ray target or by suitable filtering.
- The selected surface for which measurements of intensity and rate of change of intensity are produced is preferably located between two of the spaced apart surfaces over which intensity distribution is measured.
- In the preferred example the selected surface and spaced apart surfaces are planar. It is further preferred that the planes are generally perpendicular to the average direction of propagation of the radiation
- The method and apparatus of this example can be at least partly implemented using a suitably programmed computer. In an example the processing means
- The method and apparatus of this invention can be at least partly implemented using a suitably programmed computer. In an example the processing means preferably comprises a suitably programmed computer and the steps of the method are preferably performed using a suitably programmed computer. In such forms intensity input information may take the form of digitised images or data containing information from such images. In other implementations a dedicated Fast Fourier transform chip can be employed as at least part of the processing means. The representative measure of rate of change of intensity is preferably produced by subtraction of representative measurements respectively made at locations over the spaced apart surfaces. In the preferred example the representative measures of intensity and rate of change of intensity are obtained by sampling measurements at selected locations over the surface. Preferably the sampling and measurements are made at locations defining a regular array over the surface. This can be readily achieved for example by using a CCD (charge coupled device) as the detector.
- In the preferred method the direction of propagation of the radiation wave field is selected to be the z direction of a Cartesian co-ordinate system and x and y components of phase are produced separately.
- In this Cartesian co-ordinate system where the z direction is the direction of propagation of the radiation, the preferred filters are of the form


where - kx, ky are the Fourier variables conjugate to x, y and
- α is a constant determined by noise in the intensity measurements and is equal to zero for a no noise case.
- The measure of rate of change of intensity is preferably multiplied by the negative of the average wave number of the radiation before the integral transformation into the Fourier domain.
- The representative measure of intensity over the spaced apart surfaces can be obtained by imaging of that surface through an appropriate imaging system. That is, the intensity information may be imaged to a detector rather than measured at the surface.
- The method thus provides for the quantitative and decoupled determination of phase and intensity of a radiation wave field at any surface across the direction of propagation of the radiation. From this phase and intensity determination it is possible to calculate the phase and intensity at any other surface along the direction of propagation. Accordingly, the method provides the basis for a number of measurement techniques.
- In a further example there is provided a method of imaging an object including the steps of
- (a) exposing the object to a radiation wave field from a source;
- (b) producing a representative measure of the rate of change of intensity over a selected surface extending generally across the wave field on the side of the object remote from incident radiation;
- (c) producing a representative measure of intensity of said radiation wave field over said selected surface;
- (d) transforming said measure of rate of change of intensity to produce a first integral transform representation and applying to said first integral transform representation a first filter corresponding to the inversion of a first differential operator reflected in said measure of rate of change of intensity to produce a first modified integral transform representation;
- (e) applying an inverse of said first integral transform to said first modified integral transform representation to produce an untransformed representation;
- (f) applying a correction based on said measure of intensity over said selected surface to said untransformed representation;
- (g) transforming the corrected untransformed representation to produce a second integral transform representation and applying to said second integral transform representation a second filter corresponding to the inversion of a second differential operator reflected in the corrected untransformed representation to produce a second modified integral transform representation;
- (h) applying an inverse of said second integral transform to said second modified integral transform representation to produce a measure of phase of said radiation wave field across said selected plane.
- In a still further example there is provided an apparatus for imaging an object including
- (a) a source to irradiate the object with a radiation wave field;
- (b) means to produce a representative measure of the rate of change of intensity of said radiation wave field over a selected surface extending generally across the wave field;
- (c) means to produce a representative measure of intensity of said radiation wave field over said selected surface;
- (d) processing means to sequentially
- (I) transform said measure of rate of change of intensity to produce a first integral transform representation;
- (II) apply to said first integral transform representation a first filter corresponding to inversion of a first differential operator reflected in said measure of rate of change of intensity to produce a first modified integral transform representation;
- (III) apply an inverse of said first integral transform to said first modified integral transform representation to produce an untransformed representation;
- (IV) apply a correction based on said measure of intensity over said selected surface to said untransformed representation;
- (V) transform the corrected untransformed representation to produce a second integral transform representation;
- (VI) apply to said second integral transform representation a second filter corresponding to the inversion of a second differential operator reflected in the corrected untransformed representation to produce a second modified integral transform representation; and
- (VII) apply an inverse of said second integral transform to said second modified integral transform representation to produce a measure of phase of said radiation wave field across said selected plane.
- The radiation used to irradiate the object can be a planar wave field or spherical wave field or an arbitrary wave field. If it is desired to reproduce the phase in the object plane the phase wave field determined by the above method and apparatus is back propagated and the wave field used to irradiate is subtracted.
- The method and apparatus of imaging substantially incorporates the determination of phase as disclosed in relation to the first and second examples. The preferred examples described in relation to determination of phase as disclosed in relation to the first and second aspects of the invention. The preferred examples described in relation to those aspects above are also applicable to the method and apparatus of imaging.
- It is possible in some applications to use a zero object to image plane distance corresponding to contact-imaging with zero propagation distance.
- If desired the object can be reconstructed in the object plane by back propagating the intensity and quantitative phase information to numerically reconstruct an image of the actual object phase and intensity structure.
- In other forms of the method more than two image plane intensity distribution measurements can be made to obtain a better estimate of the rate of change of intensity or intensity derivative. In this case one or both of the source to object or object to image plane distances is changed and another intensity distribution measurement is made. The procedure is repeated until the desired number of measurements is made. The measurements provide data to which a function can be fitted for the determination of rate of change of intensity.
- The method of imaging an object has particular application to point projection microscopy using X-rays, visible light or electrons.
- Aanother example provides a method of phase amplitude imaging including the steps of
- (a) irradiating an object with a radiation wave field;
- (b) focussing radiation from the object through an imaging system to an imaging surface extending across the wave field propagating from the object;
- (c) producing a first representative measure of intensity distribution of radiation over said imaging surface at a first focus of the imaging system;
- (d) introducing a change in focus of the image on said imaging surface through the imaging system;
- (e) producing a second representative measure of intensity distribution over said imaging surface; and
- (f) using said first and second representative measures to produce a representative measure of intensity and a representative measure of rate of change of intensity over a selected surface extending across the wave field;
- (g) transforming said measure of rate of change of intensity to produce a first integral transform representation and applying to said first integral transform representation a first filter corresponding to the inversion of a first differential operator reflected in said measure of rate of change of intensity to produce a first modified integral transform representation;
- (h) applying an inverse of said first integral transform to said first modified integral transform representation to produce an untransformed representation;
- (i) applying a correction based on said measure of intensity over said selected surface to said untransformed representation;
- (j) transforming the corrected untransformed representation to produce a second integral transform representation and applying to said second integral transform representation a second filter corresponding to the inversion of a second differential operator reflected in the corrected untransformed representation to produce a second modified integral transform representation;
- (k) applying an inverse of said second integral transform to said second modified integral transform representation to produce a measure of phase of said radiation wave field across said selected plane.
- In yet another example there is provided an apparatus for phase amplitude imaging of an object including
a radiation wave field source to irradiate said object;
an imaging system to focus radiation from said object to an imaging surface extending across the wave field propagating from the object;
means to produce a representative measure of radiation intensity over said imaging surface;
said imaging system including selectively operable means to adjust said focus of said radiation to said imaging surface to at least a first focus and a second focus;
processing means to: - (i) produce a representative measure of intensity and a representative measure of rate of change of intensity over a selected surface extending across the wave field from representative measures of radiation intensity over said image surface at said first focus and said second focus;
- (ii) transform said measure of rate of change of intensity to produce a first integral transform representation;
- (iii) apply to said first integral transform representation a first filter corresponding to the inversion of a first differential operator reflected in said measure of rate of change of intensity to produce a first modified integral transform representation;
- (iv) apply an inverse of said first integral transform to said first modified integral transform representation to produce an untransformed representation;
- (v) apply a correction based on said measure of intensity over said selected surface to said untransformed representation;
- (vi) transform the corrected untransformed representation to produce a second integral transform representation;
- (vii) apply to said second integral transform representation a second filter corresponding to the inversion of a second differential operator reflected in the corrected untransformed representation to produce a second modified integral transform representation; and
- (viii) apply an inverse of said second integral transform to said second modified integral transform representation to produce a measure of phase of said radiation wave field across said selected plane.
- Preferably, the numerical aperture of the irradiating wave field is smaller than the numerical aperture of the imaging system.
- Preferably, the imaging surface is a detector. The detector is of any suitable form, such as for example a CCD camera.
- Preferably the first focus corresponds to an in focus image at the surface and the changed focus to a slightly defocussed image. Either negative or positive defocus may be used. The defocus is preferably small so that degradation in spatial resolution is minimised. In some applications more than two images may be obtained to obtain a better estimate of the rate of change of intensity.
- The method and apparatus for phase amplitude imaging substantially incorporates the determination of phase as disclosed in relation to the first and second examples. The preferred aspects of the described in relation to those aspects above are also applicable to the method and apparatus of imaging.
- In a preferred application the method is used for quantitative phase amplitude microscopy. In this case the imaging system is a magnification system.
- In the preferred example the surface is preferably planar.
- The invention will now be further described by way of example only, with reference to the drawings in which:
-
Figure 1 is a schematic illustration of an arrangement for determination of phase where an object is illuminated with (a) plane wave radiation and (b) point-source radiation; -
Figure 2 is a flow chart showing an implementation of the method of phase determination in accordance with an embodiment of this invention; -
Figures 3 (a) to (f) are simulated images illustrating phase determination for plane-wave illumination; -
Figures 4 (a) to (m) are a series of images illustrating phase determination and back propagation to another image plane; -
Figure 5 is a schematic representation of an arrangement for point projection microscopy using the method of this invention; -
Figure 6 is a schematic illustration of an arrangement for quantitative phase amplitude microscopy using the method of this invention; -
Figure 7 is a schematic drawing of an exemplary system for quantitative phase amplitude microscopy according to this invention; -
Figure 8(a) to (d) show intensity images and phase images obtained using the system shown inFigure 7 ; -
Figure 9 is a graph showing a comparison of measured and expected phase profiles for the fibre of Example 3. -
Figure 10 is a schematic drawing of an exemplary system for three dimensional optical phase tomography according to this invention. -
Figure 11 is a schematic enlargement of part ofFigure 10 ; -
Figure 12 is a typical tomographic slice through phase image produced in Example 4; and -
Figure 13 shows a comparison of reconstructed refractive index distribution with known refracture index distribution according to Example 4. -
Figures 1(a) and (b) show a schematic arrangement for phase determination in accordance with this invention where an object is illuminated by plane-wave radiation 2 orpoint source radiation 2 to producereflected beams 3. - At each point in space, an optical beam possesses two properties: intensity and phase. Intensity is a measure of the amount of energy flowing through each point, while phase gives a measure of the direction of the energy flow.
- Intensity may be measured directly, for example by recording an image on film. Phase is typically measured using interference with a "reference beam". In contrast the present method gives a non-interferometric method for measuring phase.
- Intensity can be measured over two parallel planes A, B extending across the direction of propagation of the wave field on the side remote from the incident radiation.
- The present invention determines phase by providing a solution to the transport-of-intensity equation:

Figure 1 , while the intensity I is given by the average of the measurements. - In order to obtain a solution to
equation 1 the function A is first defined as:
- Thus equation (1) becomes:

- Making use of a standard identity ∇⊥● ∇⊥ = ∇⊥ 2, this may be written:

where ∇⊥ 2 denotes the two-dimensional Laplacian acting over the surface of the image. This equation has the following symbolic solution:
- If the gradient operator ∇⊥ is applied to both sides of this equation, it becomes:

- The defining equation (2) for the function A allows (6) to be transformed into:

- Dividing both sides by I then yields:

- Taking the two dimensional divergence ∇⊥● of both sides of (8), and again making use of the standard identity ∇⊥ ● ∇⊥ = ∇⊥ 2, then (8) becomes:

- This equation has the following symbolic solution:

- In order to implement a practical solution to equation (10), the following formulae are required. A suitably-well-behaved function f(x,y) may be written in the form of a two-dimensional Fourier integral:

- The function f̂(kx,ky ) is called the "Fourier transform" off(x,y).
- The x derivative of (11) yields:

- Hence the Fourier transform of


- Here, F denotes Fourier transformation, F -1 denotes inverse Fourier transformation, (kx ky) are the Fourier variables conjugate to (x,y), and

- Equations (13) can be used to rewrite equation (10) in the form

- In practice division by intensity is only performed if that intensity is greater than a certain threshold value (eg. 0.1% of the maximum value).
- Division by kr does not take place at the point kr = 0 of Fourier space; instead multiplication by zero takes place at this point. This amounts to taking the Cauchy principal value of the integral operator ∇⊥ -2.
- In order to quantitatively measure the phase of object it is necessary to incorporate some physical constants into the phase recovery algorithm given in Equation (14) relating to the experimental setup in use to quantify the variables kx, ky. This can be done by rewriting equation (14) in the following form suitable for implementation using a fast Fourier transform:


where the image is an N x N array of pixels of size Δx. Thus in addition to measuring the three intensity distributions it is necessary to know the pixel size Δx, defocus distance δz and wavelength λ in order to make a quantitative phase measurement. All of these quantities can be readily determined: the pixel size can be determined directly for example from the CCD detector geometry (in the case of direct imaging), or by existing techniques for calibrating the transverse distance scales (in the case of an imaging system), the defocus distance can be measured directly, and the spectral distribution of the illumination can be determined either by monochromating the incident field or by analysing the spectral distribution of the radiation using existing spectroscopic methods. - An example of the phase-retrieval method implementing the solution of equation (14) can be represented by the flowchart shown in
Figure 2 . As shown inFigure 2 the quantitative determination of phase of a radiation wave field proceeds from a set of intensity measurements {I n } over the two spaced apart planes A and B. A measurement of central intensity I(x,y) in a selected plane parallel to and midway between the planes A and B is also obtained. The intensity measurements are performed over a defined array on each of the two planes A and B and the respective values subtracted to produce a measure of the intensity derivative. This value is multiplied by the negative of the average wave number. The data are split into two component sets and a fast Fourier transform is performed to produce the respective x and y components in the Fourier domain. A filter is then applied to the Fourier domain representations to correspond to the inversion of a differential operator reflected in the untransformed representation. The differential operator is represented by


- It will be apparent that in general the method according to this invention can proceed from any suitable representative determination of intensity derivative or rate of change of intensity over a selected surface extending across the propagation direction and the intensity over that same surface. As will be explained in various examples these data can be obtained in a variety of ways and the method implemented to yield phase of the radiation wave field.
- Rewriting equation (14) with:


gives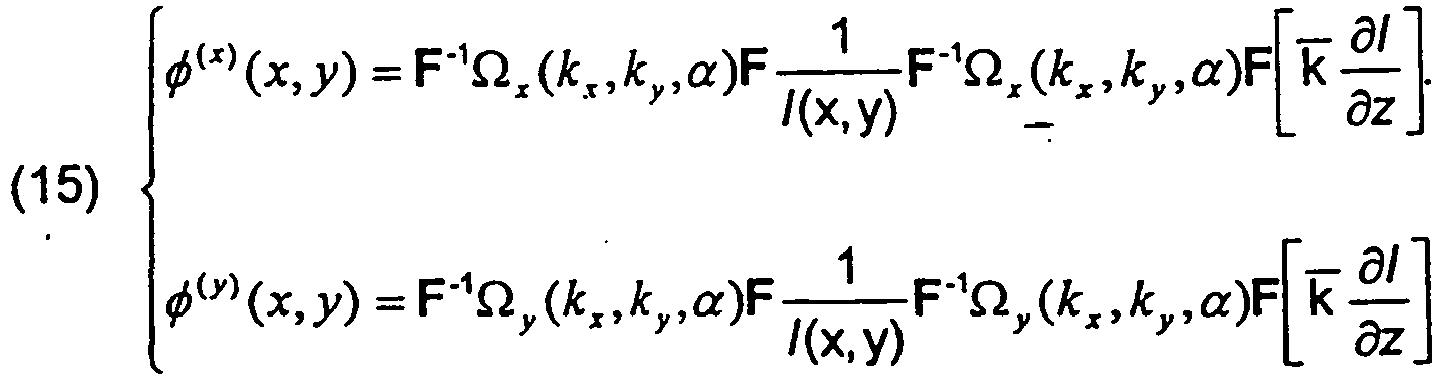
where: - φ(x, y) denotes the recovered phase,
- F denotes Fourier transformation, and F-1 denotes inverse Fourier transformation,
- I(x,y) is the intensity distribution over the plane of interest,
- (x,y) are Cartesian coordinates over the plane of interest,
- (kx ,ky ) are the Fourier variables conjugate to (x,y)
-
k = 2π/λ is the average wavenumber of the radiation, -
λ is the average wavelength of the radiation, - ∂l/∂z is the estimate for the longitudinal intensity derivative,
- α is the regularization parameter used to stabilize the algorithm when noise is present.
- As given above, the solution to the transport of intensity equation (1) assumes a perfect imaging system. That is, there are no "aberrations" present in the optical system used to obtain the intensity data which is fed into the algorithm. Of course, no imaging system is perfect. The imperfections present in an imaging system may be quantified by a set of numbers:

which are termed aberration coefficients. - If intensity data were taken on an imperfect instrument whose imperfections were characterized by a certain set of known aberration coefficients A 1,A 2,A 3,..., it would be desirable if the filters Ωx(kxky,α) and Ω y (kxky,α) present in (15) could be replaced by modified filters which explicitly depend upon the aberration coefficients:

- This would allow the imperfections of the imaging system to be explicitly taken into account, leading to quantitatively correct phase retrieval using aberrated imaging systems. For the special case of a non-absorbing phase object in a radiation wave field of uniform intensity with weak (i.e. much less than 2π radians) phase variations the appropriate modified filters lead to the following functional form for the phase-retrieval algorithm:

where: - I aberrated(x,y) is the aberrated intensity measured at defocus distance δz,
- A mn are the aberration coefficients which characterize the imperfect imaging system.
- If a filter is defined:

- Then (18) becomes:

- The term {Iaberrated (x, y)-1} is a measure of rate of change of intensity. I0 intensity is a measurable constant for uniform intensity so that (20) is the same general form as (15). Consequently the special case of aberration can be dealt with by changing the filter in the general method described above. The x and y component filters Ω x and Ω y are given by

- A simulation was conducted in accordance with the arrangement shown in
Figure 1(a) corresponding to planar illumination. The example shows the operation of the method on simulated noise-free data. Diffraction patterns are calculated using the "angular-spectrum" formalism, an orthodox procedure.Figures 3(a) to 3(f) show images produced in the simulation. - Dimensions of all images are 1.00 cm square and provide a sampling array of 256 x 256 pixels in a plane extending perpendicularly across the propagation direction of the radiation. The wavelength of the light was taken to be 632.8nm. The intensity in the plane z = 0, which varies from 0 to 1 in arbitrary units, is shown in
Figure 3(a) . Within the area of nonzero illumination, the minimum intensity was 30% of the maximum intensity. (The black border around the edge of the intensity image corresponds to zero intensity.) The input phase, which varies from 0 to π radians, is shown inFigure 3(b) . - Images corresponding to planes negatively and positively displaced 2mm from the z=0 plane shown are in
Figures 3(c) and (d) respectively, and have respective maximum intensities of 1.60 and 1.75 arbitrary units; the propagation-induced phase contrast is clearly visible in each of these images. The two defocused images are subtracted to form the intensity derivative, which is shown inFigure 3(e) . - Images shown in
Figures 3(a) and (e) respectively providing measures of intensity and rate of change of intensity across the z=0 plane were then processed according to a computer implementation of the method shown inFigure 2 , in order to yield the recovered phase map given inFigure 3(f) . Note thatFigures 3(b) and (f) are plotted on the same greyscale levels, indicating that the recovered phase is quantitatively correct. -
Figures 4 (a) to (h) shows a series of simulated images illustrating phase determination and subsequent back-propagation to another image plane. All images are 256 pixels x 256 pixels = 1 cm x 1cm in dimensions, with the radiation wavelength equal to 632.8 nm. The intensity and phase of the radiation in a given plane are shown inFigures 4 (a) and (b) respectively.Figures 4(c) through (e) respectively show the propagated intensity at propagation distances of 199,200 and 201 mm; note the intermixing of information fromFigures 4 (a) and (b) in the intensity measurements ofFigures 4 (c), (d) and (e ). Using the images ofFigures 4 (c), (d) and (e) only, the phase-retrieval algorithm obtained the phase map given inFigure 4(f) for the phase of the propagated field atdistance 200 mm. Images of Figures (d) and (f) were used to numerically back-propagate the field back to the initial plane. This gaveFigures 4(g) and (h) for the back-propagated intensity and phase, respectively. These are in excellent agreement withFigures 4 (a) and (b) , thus demonstrating the use of the phase retrieval techniques for the quantitative determination of the amplitude and phase of a field over regions far displaced from those over which intensity measurements are made. Note also that the back-propagation is not restricted to free space; back-propagation can also be effected through a known optical system. - As shown in
Figure 5 , radiation such as X-rays, visible light or electrons from apoint source 10 is allowed to propagate through free space to theobject 11, located at a distance dso from the source. The radiation passes through theobject 11, and is allowed to propagate a further distance dod to one of the image planes I1, I2... In in which the intensity of the radiation is detected. This detection is performed using a standard device such as a CCD camera, image plate or other device capable of registering and digitising the intensity distribution. One or both of the distances dso and/or dsd is then changed so as to introduce defocus into the images and the intensity distribution is measured once again. The case of dod=0 corresponding to contact-imaging with zero propagation distance is included as one possible measurement. - The intensity data is then processed using the above phase recovery method, to recover the decoupled intensity and phase information in the imaging plane. Parameters, such as wavelength, pixel size, and defocus distances are inserted into the algorithm as explained above, to yield quantitative information about the magnitude of the phase shift in the image plane.
- In certain cases a reconstruction of the object in the object plane, as opposed to the downstream diffraction planes I1...In, is desired. In this case the intensity and quantitative phase information obtained above can be used to back propagate the light field to the object plane, thereby numerically reconstructing an image of the actual object phase and intensity structure. This can be done using standard diffraction code.
- In some cases it is desirable to take more than two images in order to obtain a better estimate of the intensity derivative dl/dz, in which case one or both of the distances dso and/or dsd is altered once again and another image taken, with this procedure repeated until the number of desired images is acquired. A function can then be fitted to this data from which dl/dz can be computed and used in the phase recovery algorithm in place of the simple subtraction of two images normally used.
-
Figure 6 schematically shows an arrangement for quantitative phase amplitude microscopy. A sample is illuminated using a source of white light.Köhler illumination 15, commonly found on optical microscopes. The light is transmitted through anobject 16 and collected by amicroscope imaging system 17 and relayed to aCCD camera 18 or other digital imaging device having a planar imaging surface. Three images are collected: an in-focus image, Io, and two slightly out of focus images I+ and I-. The defocus is obtained by suitable means such as adrive system 19 to adjust the microscope focus knob. The defocus introduced is usually quite small so that degradation in spatial resolution is minimised, although the optimal amount of defocus to use is determined by sample properties and imaging geometry such as magnification, numerical apertures, etc. - When taking the images the numerical aperture of the condenser is chosen to be less than the numerical aperture of the objective being used. If this is not the case then serious image degradation will occur, although the precise amount by which the condenser and objective numerical apertures should differ involves a tradeoff between image fidelity and spatial resolution, with the optimal difference depending on the sample properties and the optics used.
- Intensity data from the collected images I+ and I- are subtracted to produce a representative measure of rate of change of intensity (intensity derivative). From this and the intensity data of collected image Io the method described above can be used to produce quantitative information about the magnitude of the phase shift in the image plane.
- As in Example 2 for point projection, there may be cases in which it is desirable to take more than two images in order to obtain a better estimate of the intensity derivative dl/dz. A function can then be fitted to this data from which dl/dz can be computed and used in the phase determination method in place of the simple subtraction of two images normally used.
- It is also possible to operate this system in a reflection geometry to obtain surface topography. The principle of operation is the same, however the optics have to be folded back on themselves to form a reflection geometry - otherwise the process is identical.
- For certain applications it can also be desirable to filter the light to a particular wavelength, although this is not necessary for the described imaging process as it works equally well with white light.
- An experimental implementation is shown in
Figure 7 . An Olympus BX-60optical microscope 20 was equipped with a set of UMPlan metallurgical objectives and a universal condenser to provide Köhler illumination. In order to be able to compare the results with existing imaging modes Nomarski DIC optics and a set of cover-slip corrected UplanApo objectives were also acquired for this microscope, enabling images to be taken of the same field of view using both phase retrieval and Nomarski DIC for the purposes of qualitative comparison. A 12-bit scientific grade PhotometricsSenSys CCD camera 21 equipped with a 1300x1035 pixel Kodak KAF-1400 CCD chip was added to the 0.5x video port on the microscope to acquire digital images of the sample. - The phase recovery technique of this embodiment of the invention requires the acquisition of defocused images. A stepper
motor drive system 22 was attached to the focus knob of the microscope. Thisstepper motor 22 was attached to the parallel port of a133MHz Pentium PC 23 also used to control theCCD camera 21, enabling full automation of the acquisition of through-focus image sequences. This data acquisition system was linked to custom software written to recover phase images from the CCD images, thereby enabling full automation of the image acquisition and data processing sequences. - In order to demonstrate that phase imaging using this invention can accurately measure the phase structure of microscopic samples it was necessary to have a sample with a well-characterised geometry and refractive index distribution. A 3M F-SN-3224 optical fibre (a commercial fibre made by 3M) was used. Independent measurements of the refractive index distribution obtained using atomic force microscopy and commercial profiling techniques were available enabling accurate prediction of the phase structure of the exit wave field. Another advantage of this fibre was that it had three regions of different refractive indices, an inner and outer cladding as well as the core, whereas most fibres simply have a cladding and core. This provided an additional test for the phase imaging system because it had to accurately image three transitions in refractive index rather than just two.
- The optical fibre was imaged side-on so as to obtain a projection of the refractive index through all layers of the fibre structure. This was done by first stripping the plastic sheath from the fibre by soaking it in isopropyl alcohol then using a commercial fibre stripper to remove the plastic coating. A small segment of fibre, typically a strand of approximately one to two centimetres in length, was placed on a microscope slide, immersed in a pool of index matching fluid and covered with a 0.15mm thick cover glass. Any tilt on the cover glass would introduce a spurious tilt into the recovered phase so two small sections of fibre, both of similar diameter to the sample, were placed parallel to and about 0.5cm either side of the main fibre. The cover class was then placed across all three fibres to ensure that it was as parallel to the microscope slide as practically possible.
- Images of the fibre were taken using an Olympus 40x 0.7NA UplanApo objective, which meant that a 500x500 pixel image conveniently spanned the whole width of the fibre, and the condenser was set at NA=0.2. The fibre's refractive index profiles were known for 632.8nm (HeNe laser) light, so a 625± 10nm band-pass interference filter was inserted into the illumination system to ensure that the recovered phase profiles were obtained at a wavelength as close as possible to that for which data was available on the fibre. An intensity image of this sample in the plane of best focus and at ± 2µm either side of best focus is shown in
Figure 8 , alongside a phase image recovered from the two defocused images using the phase-retrieval algorithm described above. Note that the fibre is virtually invisible in the in-focus image and barely visible in slightly defocused images, whilst both the fibre and the regions of different refractive index, including the 4µm diameter core, are clearly visible in the phase image. -
Figure 9 shows a comparison of the measured and expected phase profiles with the uncertainties indicated in the figure representing one standard deviation of the data along the length of the fibre. This variation is thought to be primarily due to spatial variations in thickness of the cover glass and microscope slide. As can be seen, the recovered and expected phase profiles are in good agreement with one another, with the predicted profile lying within the error bars of the profile produced using the technique of this invention. - This example demonstrates the application of quantitative phase microscopy to the three-dimensional imaging of objects through the use of computed-tomography techniques. This is possible using the techniques of this invention because the phase shifts introduced by the object can be directly measured independently of any intensity variations in the object, thus an inverse Radon transform can be used to recover the three-dimensional structure directly from the projection data. Although the experimental demonstration provided is in the optical regime, the same principles are equally applicable to X-ray, electron and neutron phase tomography.
- For the purposes of collecting three dimensional data sets the same optical microscope described in the previous example is used with the addition of a
rotation stage 24 for the purposes of rotating the sample within the confines of the optical microscope imaging area as shown inFigure 10 . Therotation stage 24 is shown in greater detail inFigure 11 . - The previously described arrangements included a stepper
motor drive system 22 attached to the parallel port of the same 133MHz Pentium PC used to control theCCD camera 21 to drive the focus knob of the microscope. Asecond stepper motor 25 was connected to the second channel of themotor drive system 24 for the purposes of rotating the sample. This data acquisition system was linked to custom software written to recover phase images from the CCD images, thereby enabling full automation of the image acquisition and data processing sequence. Each data set was collected using the same microscope as in Example 3 - an Olympus BX-60 optical microscope equipped with a set of cover-slip corrected UplanApo objectives and a universal condenser to provide Köhler illumination. Digital images were captured using a 12-bit Photometrics SenSys CCD camera equipped with a Kodak KAF-1400 1300x1035 pixel CCD chip on the 0.5x video port of the microscope. - To prepare the
fibre sample 26 for imaging the plastic sheath was removed from a small segment of the end of a section of fibre, typically about one centimetre in length, by soaking the fibre in isopropyl alcohol then using a commercial fibre stripper to remove the plastic coating. The fibre was then cut into a small segment of approximately one inch in length, with the unstripped end then being slid into the end of a 26 gauge,100mm syringe needle 27 and fixed into position with a small' amount of 5 minute Araldite. Amount 28 was used to attach theneedle 27 tostepper motor 25. A pool of index-matchingfluid 29 surrounds thefibre 26 as shown inFigure 11 , with amicroscope slide 30 affixed underneath the fibre using silicone grease and a 0.15mmthick cover glass 31 placed over the top. - Transmission intensity images were collected in the same way as described in Example 3 above using an Olympus 20x 0.45NA UMPlan objective with the condenser set at NA=0.1. The images taken were 500x500 pixels in size which conveniently spanned not only the width of the fibre but also the whole region of precession. As the refractive index profile of this fibre was known for 632.8nm (HeNe laser) light, a 625± 10nm band-pass interference filter was inserted into the illumination system to ensure that the recovered phase profiles were obtained at a wavelength as close as possible to that for which data on the fibre was available. Each phase image was processed from images taken at ± 2µm either side of best focus, and data was collected from 100 independent angles through 180 degrees equally spaced in steps of 1.8 degrees between images. A typical tomographic phase image is shown in
Figure 12 . - The projection data, in the form the reconstructed phase images, were then processed into three-dimensional data sets using a simple slice-by-slice implementation of the summation of filtered back-projections algorithm, with code to perform the tomographic reconstruction written in the IDUPV-Wave programming language. First, the data sets were aligned to a common rotation axis by taking profiles through the phase data sets and compiling them into a sinogram. A sinusoid was then fitted to prominent features on the data in order to determine the location of the rotation axis and the data was digitally shifted so that the rotation axis coincided with the middle column of the sinogram to simplify the reconstruction process. Fitting a curve to the phase profiles also enabled misaligned data sets to be moved back into line, which in turn improved the quality of the reconstructed image. This realigned projection data was then transformed into a single slice through the object by back-projecting the collated phase data after filtering the projections to suppress the 1/r point spread function associated with back-projected reconstructions. These slices through the object were then stacked up on top of each other to produce a full three-dimensional refractive index distribution of the sample.
- A slice through the reconstructed refractive index distribution is shown in
Figure 13 . Note that all three regions of different refractive index are clearly resolved and that these regions form concentric cylinders, as is expected for this sample. A line profile through the centre of this reconstruction is shown inFigure 13 (dashed line) alongside the known refractive index distribution for this fibre (solid line). The values in the tomographic reconstruction are very close to those of the known profile, which confirms the quantitative phase tomography technique.
Claims (19)
- A method of forming a phase image of an object by solving a transport of intensity equation including the steps of:(a) exposing the object (1, 11) to a radiation wave field (3) with a given wavenumber from a source (10);(b) obtaining two intensity images on respectively two spaced apart surfaces (A, B) extending across the direction of propagation of the radiation wave field (3);(c) subtracting the two intensity images in order to produce a measure of the rate of change of intensity of the radiation in the direction of propagation of the radiation wave field (3);(d) obtaining an intensity image on a selected surface extending across the direction of propagation of said radiation wave field on the side of the object (1, 11) remote from the incident radiation;(e) multiplying said measure of rate of change of intensity by the negative of the average wavenumber
λ , transforming the result to produce a first integral transform representation, and applying to said first integral transform representation a correspondingly transformed filter corresponding in the untransformed representation to the inversion of a differential operator to produce a first modified integral transform representation;(f) applying an inverse of said first integral transform to said first modified integral transform representation to produce an untransformed representation;(g) applying a correction based on said obtained intensity image on said selected surface to said untransformed representation by dividing said untransformed representation by said obtained intensity image on said selected surface;(h) transforming the corrected untransformed representation to produce a second integral transform representation and applying to said second integral transform representation said correspondingly transformed filter to produce a second modified integral transform representation;(i) applying an inverse of said second integral transform to said second modified integral transform representation to produce a measure of phase of said radiation wave field across said selected surface; and(j) forming a phase image of the object (1, 11) from the measure of the phase of said radiation wave field (3). - A method as claimed in claim 1 including the step of producing said intensity image on said selected surface from said two intensity images on said two spaced apart surfaces (A, B).
- A method as claimed in either claim 1 or 2 wherein said selected surface is between said two spaced apart surfaces (A, B).
- A method as claimed in claim 2 wherein said selected surface is one of said two spaced apart surfaces (A, B).
- A method as claimed in any one of claims 1 to 4 wherein said two spaced apart surfaces (A, B) are substantially parallel.
- A method as claimed in any one of claims 1 to 4 wherein said two spaced apart surfaces (A, B) are substantially planar.
- An apparatus for forming a phase image of an object by solving a transport of intensity equation, including:(a) a source (10) to irradiate the object (1, 11) with a radiation wave field with a given wavenumber;(b) means for obtaining two intensity images of the radiation on respectively two spaced apart surfaces (A, B) extending across the direction of propagation of the radiation wave field and for subtracting the two intensity images in order to produce a measure of the rate of change of intensity of said radiation in the direction of propagation of the radiation wave field;(c) means for obtaining an intensity image of said radiation on a selected surface extending across the direction of propagation of the radiation wave field on the side of the object (1, 11) remote from the incident radiation;(d) processing means to sequentially:(i) multiply said measure of rate of change of intensity by the negative of the average wavenumber
λ ;(ii) transform the result to produce a first integral transform representation; and(iii) apply to said first integral transform representation a correspondingly transformed filter corresponding in the untransformed representation to the inversion of a differential operator to produce a first modified integral transform representation;(iv) apply an inverse of said first integral transform to said first modified integral transform representation to produce an untransformed representation;(v) apply a correction based on said obtained intensity image on said selected surface to said untransformed representation by dividing said untransformed representation by said intensity image on said selected surface;(vi) transform the corrected untransformed representation to produce a second integral transform representation;(vii) apply to said second integral transform representation said correspondingly transformed filter to produce a second modified integral transform representation;(viii) apply an inverse of said second integral transform to said second modified integral transform representation to produce a measure of phase of said radiation wave field across said selected surface; and(ix) forming a phase image of the object (1, 11) from the measure of the phase of said radiation wave field. - An apparatus as claimed in claim 7, wherein said selected surface is between said two spaced apart surfaces (A, B).
- An apparatus as claimed in claim 7, wherein said selected surface is one of said two spaced apart surfaces (A, B).
- An apparatus as claimed in any one of claims 7 to 9, including detector means positioned to directly detect intensity on said two spaced apart surfaces (A, B).
- An apparatus as claimed in any one of claims 7 to 9, including detector means to produce said intensity images on at least one of said two spaced apart surfaces (A, B) and imaging means to image that surface onto the detector.
- An apparatus as claimed in any one of claims 7 to 11 wherein said two spaced apart surfaces (A, B) are substantially parallel.
- A computer program for processing a measure of the rate of change of intensity of a radiation wave field with a given wavenumber obtained by subtraction of two intensity images on respectively two spaced apart surfaces (A, B) extending across a direction of propagation of the radiation wave field and an intensity image of said radiation on a selected surface extending across the direction of propagation of the radiation wave field, to provide a phase image of an object by solving a transport of intensity equation, said program including:(a) code for multiplying said measure of rate of change of intensity by the negative of the average wavenumber
λ , for transforming the result to produce a first integral transform representation, and for applying to said first integral transform representation a correspondingly transformed filter corresponding in the untransformed representation to the inversion of a differential operator to produce a first modified integral transform representation;(b) code for applying an inverse of said first integral transform to said first modified integral transform representation to produce an untransformed representation;(c) code for applying a correction based on said intensity image on said selected surface to said untransformed representation by dividing said untransformed representation by said intensity image on said selected surface;(d) code for transforming the corrected untransformed representation to produce a second integral transform representation and applying to said second integral transform representation a said correspondingly transformed filter to produce a second modified integral transform representation;(e) code for applying an inverse of said second integral transform to said second modified integral transform representation
all of which code provide a measure of the phase of the radiation wave field; and(f) code for producing a phase image of the object (1, 11) from the measure of the phase of the radiation wave field. - A computer program as claimed in claim 13, wherein said program includes code for producing said intensity image on said selected surface from two intensity images on respectively two spaced apart surfaces (A, B) extending across the direction of propagation of the radiation wave field
- A computer program as claimed in either claim 13 or 14, wherein said computer program is stored on computer readable storage media.
- A computer readable storage medium, characterized by a computer program as claimed in either claim 13 or 14.
- A method of forming a phase image of an object by solving a transport of intensity equation including the steps of:(a) exposing the object (11) to a radiation wave field with a given wavenumber from a source (10);(b) obtaining two intensity images on a surface (I1, I2,..., In) extending across the direction of propagation of the radiation wave field, by producing first representative measurements corresponding to intensity over said surface (I1, I2,..., In), changing the distance (dso) between said source (10) and said object (11), and producing second representative measurements corresponding to intensity over said surface (I1, I2,..., In) for the changed distance (dso) between said source (10) and said object (11);(c) subtracting the two intensity images in order to produce a measure of the rate of change of intensity of the radiation in the direction of propagation of the radiation wave field;(d) obtaining an intensity image on a selected surface extending across the direction of propagation of said radiation wave field on the side of the object (11) remote from the incident radiation;(e) multiplying said measure of rate of change of intensity by the negative of the average wavenumber
λ , transforming the result to produce a first integral transform representation, and applying to said first integral transform representation a correspondingly transformed filter corresponding in the untransformed representation to the inversion of a differential operator to produce a first modified integral transform representation;(f) applying an inverse of said first integral transform to said first modified integral transform representation to produce an untransformed representation;(g) applying a correction based on said obtained intensity image on said selected surface to said untransformed representation by dividing said untransformed representation by said obtained intensity image on said selected surface;(h) transforming the corrected untransformed representation to produce a second integral transform representation and applying to said second integral transform representation said correspondingly transformed filter to produce a second modified integral transform representation;(i) applying an inverse of said second integral transform to said second modified integral transform representation to produce a measure of phase of said radiation wave field across said selected surface; and(j) forming a phase image of the object (11) from the measure of the phase of said radiation wave field. - An apparatus for forming a phase image of an object by solving a transport of intensity equation, including:(a) a source (10) to irradiate the object (11) with a radiation wave field with a given wavenumber;(b) means for obtaining two intensity images on a surface (I1, I2,..., In) extending across the direction of propagation of the radiation wave field, by producing first representative measurements corresponding to intensity over said surface (I1, I2,..., In) and, after the distance (dso) between said source (10) and said object (11) has been changed, producing second representative measurements corresponding to intensity over said surface (I1, I2,..., In) for the changed distance (dso) between said source (10) and said object (11);(c) means for subtracting the two intensity images in order to produce a measure of the rate of change of intensity of said radiation in the direction of propagation of the radiation wave field;(d) means for obtaining an intensity image of said radiation on a selected surface extending across the direction of propagation of the radiation wave field on the side of the object (11) remote from the incident radiation;(e) processing means to sequentially:(i) multiply said measure of rate of change of intensity by the negative of the average wavenumber
λ ;(ii) transform the result to produce a first integral transform representation; and(iii) apply to said first integral transform representation a correspondingly transformed filter corresponding in the untransformed representation to the inversion of a differential operator to produce a first modified integral transform representation;(iv) apply an inverse of said first integral transform to said first modified integral transform representation to produce an untransformed representation;(v) apply a correction based on said obtained intensity image on said selected surface to said untransformed representation by dividing said untransformed representation by said intensity image on said selected surface;(vi) transform the corrected untransformed representation to produce a second integral transform representation;(vii) apply to said second integral transform representation said correspondingly transformed filter to produce a second modified integral transform representation;(viii) apply an inverse of said second integral transform to said second modified integral transform representation to produce a measure of phase of said radiation wave field across said selected surface; and(ix) forming a phase image of the object (11) from the measure of the phase of said radiation wave field. - A computer program for processing a measure of the rate of change of intensity of a radiation wave field with a given wavenumber obtained by subtraction of two intensity images on a surface (I1, I2,..., In) extending across a direction of propagation of the radiation wave field, the two intensity images corresponding to different distances (dso) between source (10) and object (11), and an intensity image of said radiation on a selected surface extending across the direction of propagation of the radiation wave field, to provide a phase image of an object by solving a transport of intensity equation, said program including:(a) code for multiplying said measure of rate of change of intensity by the negative of the average wavenumber
λ , for transforming the result to produce a first integral transform representation, and for applying to said first integral transform representation a correspondingly transformed filter corresponding in the untransformed representation to the inversion of a differential operator to produce a first modified integral transform representation;(b) code for applying an inverse of said first integral transform to said first modified integral transform representation to produce an untransformed representation;(c) code for applying a correction based on said intensity image on said selected surface to said untransformed representation by dividing said untransformed representation by said intensity image on said selected surface;(d) code for transforming the corrected untransformed representation to produce a second integral transform representation and applying to said second integral transform representation a said correspondingly transformed filter to produce a second modified integral transform representation;(e) code for applying an inverse of said second integral transform to said second modified integral transform representation
all of which code provide a measure of the phase of the radiation wave field; and(f) code for producing a phase image of the object (1, 11) from the measure of the phase of the radiation wave field.
Applications Claiming Priority (3)
| Application Number | Priority Date | Filing Date | Title |
|---|---|---|---|
| AUPP690098 | 1998-11-02 | ||
| AUPP6900A AUPP690098A0 (en) | 1998-11-02 | 1998-11-02 | Phase determination of a radiation wave field |
| EP99957223A EP1127252B1 (en) | 1998-11-02 | 1999-11-01 | Phase determination of a radiation wave field |
Related Parent Applications (1)
| Application Number | Title | Priority Date | Filing Date |
|---|---|---|---|
| EP99957223A Division EP1127252B1 (en) | 1998-11-02 | 1999-11-01 | Phase determination of a radiation wave field |
Publications (2)
| Publication Number | Publication Date |
|---|---|
| EP1505376A1 EP1505376A1 (en) | 2005-02-09 |
| EP1505376B1 true EP1505376B1 (en) | 2015-05-27 |
Family
ID=3811114
Family Applications (2)
| Application Number | Title | Priority Date | Filing Date |
|---|---|---|---|
| EP04027179.3A Expired - Lifetime EP1505376B1 (en) | 1998-11-02 | 1999-11-01 | Imaging an object with phase determination of a radiation wavefield |
| EP99957223A Expired - Lifetime EP1127252B1 (en) | 1998-11-02 | 1999-11-01 | Phase determination of a radiation wave field |
Family Applications After (1)
| Application Number | Title | Priority Date | Filing Date |
|---|---|---|---|
| EP99957223A Expired - Lifetime EP1127252B1 (en) | 1998-11-02 | 1999-11-01 | Phase determination of a radiation wave field |
Country Status (15)
| Country | Link |
|---|---|
| US (2) | US6885442B1 (en) |
| EP (2) | EP1505376B1 (en) |
| JP (1) | JP4391698B2 (en) |
| KR (1) | KR100642388B1 (en) |
| CN (1) | CN100402996C (en) |
| AT (1) | ATE290687T1 (en) |
| AU (1) | AUPP690098A0 (en) |
| BR (1) | BR9914976A (en) |
| CA (1) | CA2348912C (en) |
| DE (1) | DE69924136T2 (en) |
| ES (1) | ES2239854T3 (en) |
| RU (1) | RU2237871C2 (en) |
| TW (1) | TW487810B (en) |
| WO (1) | WO2000026622A1 (en) |
| ZA (1) | ZA200103169B (en) |
Cited By (1)
| Publication number | Priority date | Publication date | Assignee | Title |
|---|---|---|---|---|
| DE102016114375A1 (en) | 2016-08-03 | 2018-02-08 | Humboldt-Universität Zu Berlin | Device for generating an image series |
Families Citing this family (30)
| Publication number | Priority date | Publication date | Assignee | Title |
|---|---|---|---|---|
| AUPR672601A0 (en) * | 2001-07-31 | 2001-08-23 | Iatia Imaging Pty Ltd | Apparatus and method of imaging an object |
| AUPR830801A0 (en) * | 2001-10-16 | 2001-11-08 | Iatia Imaging Pty Ltd | Phase determination of a radiation wavefield |
| US20070182844A1 (en) * | 2003-03-09 | 2007-08-09 | Latia Imaging Pty Ltd | Optical system for producing differently focused images |
| US20060258018A1 (en) * | 2003-09-23 | 2006-11-16 | Curl Claire L | Method and apparatus for determining the area or confluency of a sample |
| KR20060129433A (en) * | 2004-03-01 | 2006-12-15 | 이아티아 이미징 피티와이 엘티디 | Method and apparatus for producing an image containg depth information |
| GB0409572D0 (en) * | 2004-04-29 | 2004-06-02 | Univ Sheffield | High resolution imaging |
| WO2006039368A2 (en) * | 2004-10-01 | 2006-04-13 | Indiana University Research And Technology Corporation | Phase determination system and method |
| FR2881520B1 (en) * | 2005-02-03 | 2007-10-12 | Lyuboshenko Igor | OBTAINING A PHASE IMAGE FROM AN INTENSITY IMAGE |
| DE102007009661A1 (en) * | 2006-08-31 | 2008-03-13 | Carl Zeiss Sms Gmbh | Method and device for the spatially resolved determination of the phase and amplitude of the electromagnetic field in the image plane of an image of an object |
| DE102006061978A1 (en) * | 2006-12-21 | 2008-06-26 | Forschungszentrum Jülich GmbH | Electron microscope and method for measuring defocus spread |
| US7564545B2 (en) * | 2007-03-15 | 2009-07-21 | Kla-Tencor Technologies Corp. | Inspection methods and systems for lithographic masks |
| WO2009009831A1 (en) * | 2007-07-18 | 2009-01-22 | Iatia Imaging Pty Ltd | Method and apparatus for determining the surface profile of an object |
| ES2369432B2 (en) * | 2007-09-27 | 2012-05-03 | Universidade De Santiago De Compostela | PROCEDURE FOR THE OPTIMIZATION OF THE MEASUREMENT OF THE DIRECTIONAL DERIVATIVE OF THE INTENSITY OF ELECTROMAGNETIC AND DEVICE RADIATION FOR ITS PUTTING INTO PRACTICE. |
| JP2009186679A (en) * | 2008-02-05 | 2009-08-20 | Olympus Corp | Observation device |
| DE102009019514A1 (en) | 2009-04-30 | 2010-11-11 | Siemens Aktiengesellschaft | CT system and method for phase contrast and absorption imaging |
| GB2542911B (en) | 2011-10-14 | 2017-07-26 | Solentim Ltd | Method of and apparatus for analysis of a sample of biological tissue cells |
| US9423307B2 (en) | 2013-02-20 | 2016-08-23 | Mesa Photonics, LLC | Method and apparatus for determining wave characteristics using interaction with a known wave |
| DE102016203275B4 (en) * | 2016-02-29 | 2019-07-18 | Carl Zeiss Industrielle Messtechnik Gmbh | Method and apparatus for determining a defocus value and method and apparatus for image-based determination of a dimensional size |
| JP2018180296A (en) * | 2017-04-13 | 2018-11-15 | 横河電機株式会社 | Microscope system, microscope, processing device and camera for microscope |
| CN107942147B (en) * | 2017-11-15 | 2019-09-20 | 北京邮电大学 | A kind of measurement method and device of the far-field pattern of antenna |
| US10274378B1 (en) | 2018-04-26 | 2019-04-30 | Mesa Photonics, LLC | Method and apparatus for determining wave characteristics using constrained interactions of waves |
| FR3091347B1 (en) * | 2018-12-26 | 2021-11-05 | Commissariat Energie Atomique | Method for characterizing a sample by phase imaging |
| US11501420B2 (en) | 2019-09-26 | 2022-11-15 | Perkinelmer Cellular Technologies Germany Gmbh | Reconstructing phase images with deep learning |
| US11362481B2 (en) | 2020-05-01 | 2022-06-14 | Mesa Photonics, LLC | Method and apparatus for measuring optical pulses |
| US11237059B1 (en) * | 2020-12-14 | 2022-02-01 | Gerchberg Ophthalmic Dispensing, PLLC | Totagraphy: Coherent diffractive/digital information reconstruction by iterative phase recovery using special masks |
| CN112540460A (en) * | 2020-12-29 | 2021-03-23 | 华东交通大学 | Optical system design method based on combination of TIR and microlens array |
| CN113376448B (en) * | 2021-04-29 | 2023-02-28 | 北京邮电大学 | Method and device for quiet zone phase recovery in compact range test |
| CN117957575A (en) * | 2021-09-14 | 2024-04-30 | 深圳帧观德芯科技有限公司 | X-ray imaging in an extended microscope |
| WO2023165667A1 (en) * | 2022-03-01 | 2023-09-07 | Danmarks Tekniske Universitet | Light-field imaging based on tilt-aberration |
| CN116399551B (en) * | 2023-06-06 | 2023-08-04 | 中国航空工业集团公司沈阳空气动力研究所 | Model three-dimensional density field measurement method for hypersonic wind tunnel |
Family Cites Families (13)
| Publication number | Priority date | Publication date | Assignee | Title |
|---|---|---|---|---|
| US4309602A (en) * | 1979-11-01 | 1982-01-05 | Eikonix Corportation | Wavefront sensing by phase retrieval |
| US4690555A (en) * | 1985-11-01 | 1987-09-01 | Hughes Aircraft Company | Solid-state wavefront slope determination |
| CH678663A5 (en) | 1988-06-09 | 1991-10-15 | Zeiss Carl Fa | |
| JP2563134B2 (en) | 1989-01-25 | 1996-12-11 | 日本電子株式会社 | Scanning transmission type phase contrast electron microscope |
| JP3039563B2 (en) | 1990-11-29 | 2000-05-08 | 株式会社日立製作所 | Scanning electron microscope and scanning electron microscope method |
| US5367375A (en) * | 1992-02-07 | 1994-11-22 | Hughes Aircraft Company | Spatial wavefront evaluation by intensity relationship |
| KR960019415A (en) * | 1994-11-23 | 1996-06-17 | 윤종용 | Plasma display panel |
| US5633714A (en) * | 1994-12-19 | 1997-05-27 | International Business Machines Corporation | Preprocessing of image amplitude and phase data for CD and OL measurement |
| AUPN201295A0 (en) | 1995-03-28 | 1995-04-27 | Commonwealth Scientific And Industrial Research Organisation | Simplified conditions and configurations for phase-contrast imaging with hard x-rays |
| JPH09187455A (en) | 1996-01-10 | 1997-07-22 | Hitachi Ltd | Phase type x-ray ct apparatus |
| AU716800B2 (en) * | 1996-12-24 | 2000-03-09 | Xrt Limited | Phase retrieval in phase contrast imaging |
| US5841125A (en) * | 1997-06-06 | 1998-11-24 | Trw Inc. | High energy laser focal sensor (HELFS) |
| US6219142B1 (en) * | 1997-10-17 | 2001-04-17 | Southwest Sciences Incorporated | Method and apparatus for determining wave characteristics from wave phenomena |
-
1998
- 1998-11-02 AU AUPP6900A patent/AUPP690098A0/en not_active Abandoned
-
1999
- 1999-11-01 US US09/830,393 patent/US6885442B1/en not_active Expired - Lifetime
- 1999-11-01 CN CNB99812916XA patent/CN100402996C/en not_active Expired - Fee Related
- 1999-11-01 EP EP04027179.3A patent/EP1505376B1/en not_active Expired - Lifetime
- 1999-11-01 KR KR1020017005491A patent/KR100642388B1/en not_active IP Right Cessation
- 1999-11-01 RU RU2001115107A patent/RU2237871C2/en not_active IP Right Cessation
- 1999-11-01 BR BR9914976-1A patent/BR9914976A/en not_active IP Right Cessation
- 1999-11-01 CA CA002348912A patent/CA2348912C/en not_active Expired - Fee Related
- 1999-11-01 DE DE69924136T patent/DE69924136T2/en not_active Expired - Lifetime
- 1999-11-01 EP EP99957223A patent/EP1127252B1/en not_active Expired - Lifetime
- 1999-11-01 AT AT99957223T patent/ATE290687T1/en not_active IP Right Cessation
- 1999-11-01 JP JP2000579955A patent/JP4391698B2/en not_active Expired - Fee Related
- 1999-11-01 WO PCT/AU1999/000949 patent/WO2000026622A1/en active IP Right Grant
- 1999-11-01 ES ES99957223T patent/ES2239854T3/en not_active Expired - Lifetime
- 1999-11-02 TW TW088119033A patent/TW487810B/en not_active IP Right Cessation
-
2001
- 2001-04-18 ZA ZA200103169A patent/ZA200103169B/en unknown
-
2004
- 2004-11-02 US US10/979,554 patent/US7039553B2/en not_active Expired - Lifetime
Cited By (2)
| Publication number | Priority date | Publication date | Assignee | Title |
|---|---|---|---|---|
| DE102016114375A1 (en) | 2016-08-03 | 2018-02-08 | Humboldt-Universität Zu Berlin | Device for generating an image series |
| WO2018024726A1 (en) | 2016-08-03 | 2018-02-08 | Humboldt-Universität Zu Berlin | Apparatus for generating an image series |
Also Published As
| Publication number | Publication date |
|---|---|
| RU2237871C2 (en) | 2004-10-10 |
| ES2239854T3 (en) | 2005-10-01 |
| KR20010080375A (en) | 2001-08-22 |
| AUPP690098A0 (en) | 1998-11-26 |
| US6885442B1 (en) | 2005-04-26 |
| US7039553B2 (en) | 2006-05-02 |
| US20050062957A1 (en) | 2005-03-24 |
| EP1505376A1 (en) | 2005-02-09 |
| EP1127252A4 (en) | 2002-03-13 |
| EP1127252A1 (en) | 2001-08-29 |
| ZA200103169B (en) | 2002-08-19 |
| DE69924136D1 (en) | 2005-04-14 |
| WO2000026622A1 (en) | 2000-05-11 |
| TW487810B (en) | 2002-05-21 |
| ATE290687T1 (en) | 2005-03-15 |
| JP4391698B2 (en) | 2009-12-24 |
| CA2348912C (en) | 2008-01-08 |
| CN1334916A (en) | 2002-02-06 |
| BR9914976A (en) | 2001-07-24 |
| EP1127252B1 (en) | 2005-03-09 |
| CN100402996C (en) | 2008-07-16 |
| KR100642388B1 (en) | 2006-11-03 |
| DE69924136T2 (en) | 2006-04-13 |
| JP2002529689A (en) | 2002-09-10 |
| CA2348912A1 (en) | 2000-05-11 |
Similar Documents
| Publication | Publication Date | Title |
|---|---|---|
| EP1505376B1 (en) | Imaging an object with phase determination of a radiation wavefield | |
| US7649160B2 (en) | Wave front sensing method and apparatus | |
| Williams et al. | Fresnel coherent diffractive imaging: treatment and analysis of data | |
| US20120179425A1 (en) | Method and apparatus for retrieving a phase of a wavefield | |
| EP2890975B1 (en) | Estimation of background radiation from ptychography | |
| Bostan et al. | Variational phase imaging using the transport-of-intensity equation | |
| US8045161B2 (en) | Robust determination of the anisotropic polarizability of nanoparticles using coherent confocal microscopy | |
| Dong et al. | Automatic filtering for zero-order and twin-image elimination in off-axis digital holography | |
| US8693091B2 (en) | Optical microscope system and method carried out therewith for reconstructing an image of an object | |
| Fürhapter et al. | Spiral phase microscopy | |
| AU766636B2 (en) | Phase determination of a radiation wave field | |
| Larkin et al. | Direct method for phase retrieval from the intensity of cylindrical wave fronts | |
| CN110619680A (en) | Three-dimensional fault phase microscope reconstruction method based on figure variation | |
| Kovalev et al. | Optical wavefields measurement by digital holography methods | |
| WO2003034010A1 (en) | Phase determination of a radiation wavefield | |
| Preza et al. | Image reconstruction for three-dimensional transmitted-light DIC microscopy | |
| Leischner et al. | Resolution of ultramicroscopy and field of view analysis | |
| Chamgoulov et al. | Optical computed-tomography micoscope using digital spatial light modulation | |
| GB2474442A (en) | Retrieving a phase of a wavefield | |
| Wei et al. | Single-shot lensless imaging based on iterative denoising phase retrieval | |
| DE102021214363A1 (en) | Method for areal, spatially resolved determination of at least one structural parameter | |
| Memarzadeh | Noninterferometric tomographic reconstruction of 3D static and dynamic amplitude and phase objects | |
| Haeberlé et al. | Improving the 2-D resolution in fluorescence microscopy by non rotationally symmetric apodization and image recombination or restoration | |
| von Hofsten et al. | Simulation of partially coherent image formation in x-ray microscopy | |
| Luo et al. | Optical Ptychographic Phase Tomography |
Legal Events
| Date | Code | Title | Description |
|---|---|---|---|
| PUAI | Public reference made under article 153(3) epc to a published international application that has entered the european phase |
Free format text: ORIGINAL CODE: 0009012 |
|
| AC | Divisional application: reference to earlier application |
Ref document number: 1127252 Country of ref document: EP Kind code of ref document: P |
|
| AK | Designated contracting states |
Kind code of ref document: A1 Designated state(s): AT BE CH CY DE DK ES FI FR GB GR IE IT LI LU MC NL PT SE |
|
| AX | Request for extension of the european patent |
Extension state: AL LT LV MK |
|
| 17P | Request for examination filed |
Effective date: 20050620 |
|
| AKX | Designation fees paid |
Designated state(s): DE ES FR GB IT |
|
| 17Q | First examination report despatched |
Effective date: 20071127 |
|
| GRAP | Despatch of communication of intention to grant a patent |
Free format text: ORIGINAL CODE: EPIDOSNIGR1 |
|
| INTG | Intention to grant announced |
Effective date: 20141202 |
|
| GRAS | Grant fee paid |
Free format text: ORIGINAL CODE: EPIDOSNIGR3 |
|
| GRAA | (expected) grant |
Free format text: ORIGINAL CODE: 0009210 |
|
| AC | Divisional application: reference to earlier application |
Ref document number: 1127252 Country of ref document: EP Kind code of ref document: P |
|
| AK | Designated contracting states |
Kind code of ref document: B1 Designated state(s): DE ES FR GB IT |
|
| REG | Reference to a national code |
Ref country code: GB Ref legal event code: FG4D |
|
| REG | Reference to a national code |
Ref country code: DE Ref legal event code: R096 Ref document number: 69945341 Country of ref document: DE Effective date: 20150702 |
|
| PG25 | Lapsed in a contracting state [announced via postgrant information from national office to epo] |
Ref country code: ES Free format text: LAPSE BECAUSE OF FAILURE TO SUBMIT A TRANSLATION OF THE DESCRIPTION OR TO PAY THE FEE WITHIN THE PRESCRIBED TIME-LIMIT Effective date: 20150527 |
|
| REG | Reference to a national code |
Ref country code: DE Ref legal event code: R097 Ref document number: 69945341 Country of ref document: DE |
|
| PLBE | No opposition filed within time limit |
Free format text: ORIGINAL CODE: 0009261 |
|
| STAA | Information on the status of an ep patent application or granted ep patent |
Free format text: STATUS: NO OPPOSITION FILED WITHIN TIME LIMIT |
|
| PG25 | Lapsed in a contracting state [announced via postgrant information from national office to epo] |
Ref country code: IT Free format text: LAPSE BECAUSE OF FAILURE TO SUBMIT A TRANSLATION OF THE DESCRIPTION OR TO PAY THE FEE WITHIN THE PRESCRIBED TIME-LIMIT Effective date: 20150527 |
|
| 26N | No opposition filed |
Effective date: 20160301 |
|
| REG | Reference to a national code |
Ref country code: FR Ref legal event code: PLFP Year of fee payment: 18 |
|
| PGFP | Annual fee paid to national office [announced via postgrant information from national office to epo] |
Ref country code: FR Payment date: 20161125 Year of fee payment: 18 Ref country code: GB Payment date: 20161124 Year of fee payment: 18 Ref country code: DE Payment date: 20161125 Year of fee payment: 18 |
|
| REG | Reference to a national code |
Ref country code: DE Ref legal event code: R119 Ref document number: 69945341 Country of ref document: DE |
|
| GBPC | Gb: european patent ceased through non-payment of renewal fee |
Effective date: 20171101 |
|
| REG | Reference to a national code |
Ref country code: FR Ref legal event code: ST Effective date: 20180731 |
|
| PG25 | Lapsed in a contracting state [announced via postgrant information from national office to epo] |
Ref country code: FR Free format text: LAPSE BECAUSE OF NON-PAYMENT OF DUE FEES Effective date: 20171130 Ref country code: DE Free format text: LAPSE BECAUSE OF NON-PAYMENT OF DUE FEES Effective date: 20180602 |
|
| PG25 | Lapsed in a contracting state [announced via postgrant information from national office to epo] |
Ref country code: GB Free format text: LAPSE BECAUSE OF NON-PAYMENT OF DUE FEES Effective date: 20171101 |