EP1499108A2 - Color saturation adjustment - Google Patents
Color saturation adjustment Download PDFInfo
- Publication number
- EP1499108A2 EP1499108A2 EP04016480A EP04016480A EP1499108A2 EP 1499108 A2 EP1499108 A2 EP 1499108A2 EP 04016480 A EP04016480 A EP 04016480A EP 04016480 A EP04016480 A EP 04016480A EP 1499108 A2 EP1499108 A2 EP 1499108A2
- Authority
- EP
- European Patent Office
- Prior art keywords
- data values
- initial
- gray
- ratio
- cmy
- Prior art date
- Legal status (The legal status is an assumption and is not a legal conclusion. Google has not performed a legal analysis and makes no representation as to the accuracy of the status listed.)
- Granted
Links
Images



Classifications
-
- H—ELECTRICITY
- H04—ELECTRIC COMMUNICATION TECHNIQUE
- H04N—PICTORIAL COMMUNICATION, e.g. TELEVISION
- H04N1/00—Scanning, transmission or reproduction of documents or the like, e.g. facsimile transmission; Details thereof
- H04N1/46—Colour picture communication systems
- H04N1/56—Processing of colour picture signals
- H04N1/60—Colour correction or control
- H04N1/6002—Corrections within particular colour systems
- H04N1/6005—Corrections within particular colour systems with luminance or chrominance signals, e.g. LC1C2, HSL or YUV
-
- H—ELECTRICITY
- H04—ELECTRIC COMMUNICATION TECHNIQUE
- H04N—PICTORIAL COMMUNICATION, e.g. TELEVISION
- H04N1/00—Scanning, transmission or reproduction of documents or the like, e.g. facsimile transmission; Details thereof
- H04N1/46—Colour picture communication systems
- H04N1/56—Processing of colour picture signals
- H04N1/60—Colour correction or control
- H04N1/6016—Conversion to subtractive colour signals
- H04N1/6022—Generating a fourth subtractive colour signal, e.g. under colour removal, black masking
Definitions
- the subject disclosure is generally directed to adjusting color saturation.
- Color printers typically employ a plurality of inks of different primary colors to generate a spectrum of colors. For example, many color printers use four ink colors: cyan (C), magenta (M), yellow (Y) and black (K). Color images are formed on a receiving substrate or medium by placing combinations of zero or more dots of C, M, Y or K ink at each pixel location. Cyan, magenta and yellow are typically employed since a wide range of colors can be produced by different combinations of these inks.
- determining a relative amount of chroma comprises calculating (1 - RATIO) wherein RATIO is a ratio between a minimum of the initial primary color data values and a maximum of the initial primary color data values.
- producing color saturation adjusted primary color data comprises:
- FIG. 1 is a schematic block diagram of an embodiment of a printing system.
- FIG. 2 is a schematic diagram of an embodiment of an image processing pipeline.
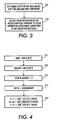
- FIG. 3 is a schematic flow diagram of an embodiment of a color saturation adjustment procedure.
- FIG. 4 is a schematic flow diagram of an embodiment of another color saturation adjustment procedure.
- FIG. 5 is a simplification of equations of a step of the procedure of FIG. 4.
- FIG. 6 is a schematic flow diagram of an embodiment of a gray balance adjustment and color saturation adjustment procedure.
- FIG. 7 is a simplification of equations of a step of the procedure of FIG. 6.
- FIG. 8 is a schematic diagram of an embodiment of an image processing pipeline that employs the procedure of FIG. 6.
- FIG. 1 is a schematic block diagram of an embodiment of a printing apparatus that includes an interface 31 that receives print data, for example from a host computer, and stores the print data in a buffer memory 33.
- a processor 35 is configured to process the print data to produce bit mapped raster data that is stored in a memory 37.
- a print engine 39 prints an image pursuant to the bit map raster data generated by the processor 35.
- the print engine 39 can be an electrophotographic print engine or an ink jet print engine, for example.
- FIG. 2 is a block diagram of an embodiment of a portion of an image processing pipeline for a color printer.
- partial gray replacement is performed on input primary color data such as CMYK (cyan, magenta, yellow, black), wherein some amounts of CMY are replaced with black.
- color saturation adjustment is performed, and at 114 gray balance adjustment is performed.
- gray balance adjustment can be performed prior to color saturation adjustment.
- linearization is performed so that substantially equal changes in C, M or Y tends to produce substantially equal changes in visual perception, for example.
- 117 half-toning is performed, and at 117 printing takes place.
- FIG. 3 is a schematic flow diagram of an embodiment of a procedure for color saturation adjustment of non-black color data such as input CMY data for a pixel of an image or gray balanced CMY data, and can be employed to adjust the color saturation or intensity of some or all of the pixels of an image, as desired.
- non-black color data such as input CMY data for a pixel of an image or gray balanced CMY data
- the CMY data values for a pixel contain a gray component if all of the CMY data values for a pixel are non-zero.
- the gray component can comprise for example the minimum of the C, M and Y data values.
- the CMY data values for a pixel are color saturation adjusted pursuant to color saturation curves only if the C, M and Y data values are not equal (i.e., non-gray and not equal to zero).
- FIG. 4 is a schematic flow diagram of an embodiment of a procedure for color saturation adjusting non-black primary color data such as CMY data for a pixel of an image, and can be employed to adjust the color saturation of non-gray balanced CMY data, for example.
- a GRAY component is set to the minimum of the initial C, M and Y data values for a pixel.
- MAXCMY is set to the maximum of the initial C, M and Y data values for a pixel.
- the procedure is stopped if the maximum MAXCMY of the initial C, M and Y values is zero (i.e., if all of the C, M and Y values are zero), and the CMY data values for this pixel are not adjusted.
- a RATIO of the GRAY component to MAXCMY is calculated.
- saturation adjusted CMY data values are calculated by adding to each of the initial CMY values a product of: (1) the difference between a corresponding maximum saturation adjusted value SAT_C(C), SAT_M(M), or SAT_Y(Y), and the initial C, M or Y value, and (2) one minus the RATIO calculated previously.
- the maximum saturation adjusted values SAT_C(C), SAT_M(M) and SAT_Y(Y) are what the saturation adjusted CMY values would be set to if there is no gray component, and can be obtained from saturation curves that can be implemented as a look-up table that is indexed by the initial C, M and Y data values, for example.
- each saturation curve can for example be a sigmoid function wherein color is reduced for lighter colors and is increased for darker colors.
- the saturation curve values are less than the initial color values for lighter colors, and are greater than the initial color values for darker colors.
- the same saturation curve can be used for all non-black primary colors.
- RATIO can be considered as defining the relative amount of gray in the initial CMY data values.
- (1-RATIO) can be expressed as (MAXCMY - GRAY)/MAXCMY, and thus can be considered as defining the relative amount of chroma or non-gray in the initial CMY data values.
- (MAXCMY - GRAY) can be considered as a chroma component of the initial CMY data values.
- RATIO can also be conveniently considered as a relative gray component while (1-RATIO) can be conveniently considered as a relative non-gray or chroma component.
- the amount of saturation adjustment for the initial CMY data values increases with the relative amount of chroma that is contained in the initial CMY data.
- the amount of saturation adjustment is a function of the relative amount of chroma (1-RATIO) in the initial CMY data.
- RATIO is equal to zero
- (1-RATIO) is 1
- maximum saturation adjustment is performed.
- RATIO is 1
- (1-RATIO) is zero
- no saturation adjustment is performed.
- the amount of saturation adjustment can be a linear or non-linear function of the relative amount of chroma in the initial CMY data, wherein maximum saturation adjustment is performed for data without a gray component and where no saturation adjustment is performed for gray colors.
- RATIO can be a linear or non-linear function of the relative amount of gray in the initial CMY data, and is equal to 1 for gray colors and is equal to 0 for data without a gray component.
- (1-RATIO) can be a linear or non-linear function of the relative amount of chroma in the initial CMY data, and is equal to 0 for gray colors and is equal to 1 for data without a gray component.
- each of the saturation adjusted CMY data values is the sum of (1) the product of the initial C, M, or Y data value and RATIO, and (2) the product of the corresponding maximum saturation adjusted value SAT_C(C), SAT_M(M) or SAT_Y(Y) and (1 - RATIO).
- color saturation adjustment can be considered as the sum of a portion of the initial color data value and a portion of the corresponding maximum saturation adjusted value, wherein the portion of the initial color data value is a function of the relative amount of gray and wherein the portion of the corresponding maximum saturation adjusted value is a function of the relative amount of chroma in the initial CMY data values.
- FIG. 6 is a schematic flow diagram of an embodiment of a procedure for gray balancing and color saturation adjusting non-gray balanced non-black primary color data such as CMY data for a pixel of an image, and can be employed to gray balance and color saturation adjust some or all of the pixels of an image, as desired.
- a GRAY component is set to the minimum of the initial or input C, M and Y data values for a pixel.
- MAXCMY is set to the maximum of the initial C, M and Y data values for a pixel.
- the procedure is stopped if the maximum MAXCMY of the initial C, M and Y values is zero (i.e., if all of the initial C, M and Y values are zero), and the CMY data values for this pixel are not adjusted.
- a RATIO of the GRAY component to MAXCMY is calculated.
- gray balanced and saturation adjusted output CMY data values are calculated by adding to each of the initial CMY values (A) a product of: (1) the difference between the corresponding maximum gray balance adjusted value GRAYBAL_C(C), GRAYBAL_M(M) or GRAYBAL_Y(Y), and the initial C, M or Y value, and (2) the RATIO calculated previously, and (B) a product of: (1) the difference between the corresponding maximum saturation adjusted value SAT_C(C), SAT_M(M) or SAT_Y(Y), and the initial C, M or Y value, and (2) one minus the RATIO calculated previously.
- each of the gray balanced and saturation adjusted CMY data values is the sum of (1) the product of the corresponding maximum gray balance adjusted value GRAYBAL_C(C), GRAYBAL_M(M) or GRAYBAL_Y(Y), and RATIO, and (2) the product of a corresponding maximum saturation adjusted value SAT_C(C), SAT_M(M) or SAT_Y(Y) and (1 - RATIO).
- gray balancing and color saturation adjusting are performed on data that has not been gray balanced, for example, and for each of the C, M and Y colors, a portion of the corresponding maximum gray balance adjusted value GRAYBAL_C(C), GRAYBAL_M(M) or GRAYBAL_Y(Y) is added to a portion of the corresponding maximum saturation adjusted value SAT_C(C), SAT_M(M) or SAT_Y(Y) and (1 - RATIO).
- the procedure of FIG. 6 combines the functions of gray balancing and color saturation adjustment, and can be employed in an embodiment of a portion of an image processing pipeline as set forth in FIG. 8 wherein gray balancing and color saturation adjustment are performed at 113'.
- RATIO can be considered as defining the relative amount of gray in the initial CMY data values.
- (1-RATIO) can be expressed as (MAXCMY - GRAY)/MAXCMY, and thus can be considered as defining the relative amount of chroma or non-gray in the original CMY data values.
- (MAXCMY - GRAY) can be considered as a chroma component of the initial CMY data values.
- RATIO can also be conveniently considered as a relative gray component while (1-RATIO) can be conveniently considered as a relative non-gray or chroma component.
- the amount of gray balancing that is performed in the procedure of FIG. 5 increases with the relative amount of gray that is contained in the initial CMY data.
- the portions of the maximum gray balance adjusted values that contribute to the gray balanced and color saturation adjusted CMY data values are functions of the relative gray component RATIO.
- the amount of gray balancing is a function of the relative amount of gray in the initial CMY data, and less gray results in less gray balancing while more gray results in more gray balancing.
- the initial values of C, M and Y are all non-zero and equal (i.e., gray)
- RATIO is 1 and full gray balancing is performed. If at least one of the original values of C, M and Y is zero (i.e., the gray component is zero), RATIO is zero and no gray balancing is performed.
- the amount of saturation adjustment increases with the relative amount of chroma that is contained in the initial CMY data.
- the portions of the maximum color saturation adjusted values that contribute to the gray balanced and saturation adjusted CMY data values are functions of the relative chroma component (1-RATIO).
- the amount of saturation adjustment is a function of the relative amount of chroma (1-RATIO) in the CMY data, and more chroma results in more saturation adjustment while less chroma results in less saturation adjustment.
- RATIO is equal to zero
- (1-RATIO) is 1, and maximum saturation adjustment is performed.
- RATIO is 1
- (1-RATIO) is zero
- no saturation adjustment is performed.
- the amount of gray balancing can be a linear or non-linear function of the relative amount of gray
- the amount of saturation adjustment can be a linear or non-linear function of the relative amount of chroma in the initial CMY data.
- RATIO can be a linear or non-linear function of the relative amount of gray in the initial CMY data, and is equal to 1 for gray colors and is equal to 0 for data without a gray component.
- (1-RATIO) can be a linear or non-linear function of the relative amount of chroma in the initial CMY data, and is equal to 0 for gray colors and is equal to 1 for data without a gray component.
- the maximum saturation adjusted values SAT_C(C), SAT_M(M) and SAT_Y(Y) can be obtained from saturation curves that can be implemented as a look-up table that is indexed by the C, M and Y data values, for example.
- the color saturation curves can be sigmoid functions as discussed previously relative to the procedure of FIG. 4.
- color saturation adjustment can be considered as the sum of a portion of the corresponding maximum gray balance adjusted value and a portion of the corresponding maximum saturation adjusted value, wherein the portion of the maximum gray balance adjusted value is a function of the relative amount of gray in the initial CMY data values, and wherein the portion of the corresponding maximum saturation adjusted value is a function of the relative amount of chroma in the initial CMY data values.
- the gray balanced and saturation adjusted data value comprises the sum of a gray balanced component and a saturation adjusted component.
- the maximum gray balance adjusted values GRAYBAL_C(C), GRAYBAL_M(M) and GRAYBAL_Y(Y) are obtained from gray balancing curves that can be implemented as a look-up table that is indexed by the initial CMY values, for example.
- the gray balancing curves can be arrived at empirically by printing a plurality of color samples or patches, and then selecting gray patches from the printed color patches, for example by initial visual sorting and then electro-optical measurement. A curve fitting procedure is then performed on the CMY values of the selected gray patches to approximate the ink combinations needed to obtain grays of different densities.
- the gray balancing curves can also be arrived at empirically by printing a plurality of color patches or samples that encompass predetermined gray targets, and measuring the color of the color samples to obtain their colorimetric values.
- the color samples can include non-neutral colors, and preferably define a volume that surrounds or encompasses the predetermined gray targets.
- the CMY values of the color samples are then interpolated in a color space such as L*a*b, for example using tetrahedral interpolation, to determine discrete CMY combinations that substantially match the predetermined gray targets. Curve fitting can then be performed on the discrete CMY combinations to arrive at the gray balancing curves.
- Tetrahedral interpolation can be accomplished for example by employing Delauney tessellation to tessellate the space covered by the color sample colorimetric data values. Delauney tessellation fills that space with non-overlapping tetrahedra.
- the tetrahedron that encompasses the gray target is first located, and barycentric weights are calculated and applied to the four vertices of the tetrahedron to obtain the CMY values for the gray target.
- the color samples can be selected such that the predetermined gray targets are encompassed by the space defined by the tetrahedra employed for tetrahedral interpolation.
- the gray balancing curves can be configured to track the density characteristic of the black ink used by the printer, for example.
Landscapes
- Engineering & Computer Science (AREA)
- Multimedia (AREA)
- Signal Processing (AREA)
- Facsimile Image Signal Circuits (AREA)
- Color, Gradation (AREA)
- Color Image Communication Systems (AREA)
- Image Processing (AREA)
- Record Information Processing For Printing (AREA)
Abstract
Description
The object is solved by methods as described in the appended claims and the following description.
In one embodiment of the method of claim 7, determining a relative amount of chroma comprises calculating (1 - RATIO) wherein RATIO is a ratio between a minimum of the initial primary color data values and a maximum of the initial primary color data values.
In a further embodiment producing color saturation adjusted primary color data comprises:
- determining whether the initial primary color data values are all zero;
- determining whether the initial primary color data values are equal; and
- producing color saturation adjusted primary color data values if the initial primary color data values are not all zero and if the initial primary color data values are not equal.
In a further embodiment the initial primary color data values comprise gray balanced primary color data values.
In a further embodiment the method further includes gray balance adjusting the color saturation adjusted primary color data values.
In a further embodiment producing color saturation adjusted primary color data comprises:
- for each of the initial primary color data values, producing a
color saturation adjusted primary color data value by adding to the initial
primary color data value a product of (1) a difference between a maximum
saturation adjusted value for the primary color data value and the original
primary color data value, and (2) one minus a ratio between a minimum of
the initial primary color data values and a maximum of the initial primary
color data values.
According to yet another aspect a method of adjusting initial primary color data values, comprises: - determining a relative amount of gray in the initial primary color data values;
- determining a relative amount of chroma in the initial primary color data values;
- for each of the initial primary color data values, adding a portion of the initial data value and a portion of a corresponding maximum color saturation adjusted value to produce respective color saturation adjusted primary color data values; and
In a further embodiment the initial primary color data values comprise non-gray balanced primary color data values.
In a further embodiment the initial primary color data values comprise gray balanced primary color data values.
In a further embodiment determining a relative amount of gray comprises calculating a ratio between a minimum of the initial primary color data values and a maximum of the initial primary color data values.
In a further embodiment determining a relative amount of chroma comprises calculating (1 - RATIO) wherein RATIO is a ratio between a minimum of the initial primary color data values and a maximum of the initial primary color data values.
In a further embodiment determining a relative amount of gray comprises determining a relative amount of gray using:
- determining a relative amount of chroma comprises calculating (1 - RATIO); and
- adding a portion of the initial data value and a portion of a
corresponding maximum color saturation adjusted value to produce
respective color saturation adjusted primary color data values comprises:
Claims (10)
- A method of adjusting initial CMY data values comprising:determining a relative amount of chroma in the initial CMY data values; andproducing color saturation adjusted CMY data values as a function of the relative amount of chroma in the initial CMY data values.
- The method of claim 1 wherein the initial CMY data values comprise gray balanced CMY data values.
- The method of claim 1 wherein the initial CMY data values comprise non-gray balanced CMY data values.
- The method of claim 1 further including gray balance adjusting the color saturation adjusted CMY data values.
- The method of claim 1 wherein determining a relative amount of chroma comprises calculating (1 - RATIO) wherein RATIO is a ratio between a minimum of the initial CMY data values and a maximum of the initial CMY data values.
- The method of claim 1 wherein producing color saturation adjusted CMY data values comprises producing color saturation adjusted CMY data values using:
- A method of adjusting initial primary color data values, comprising:determining a relative amount of chroma in the initial primary data values; andproducing color saturation adjusted primary data values as a function of the relative amount of chroma in the initial primary color data values.
- The method of claim 7 wherein the initial primary color data values comprise gray balanced primary color data values.
- The method of claim 7 wherein the initial primary color data values comprise non-gray balanced primary color data values.
- The method of claim 7 further including gray balance adjusting the color saturation adjusted primary color data values.
Applications Claiming Priority (2)
| Application Number | Priority Date | Filing Date | Title |
|---|---|---|---|
| US10/620,261 US7355753B2 (en) | 2003-07-14 | 2003-07-14 | Color saturation adjustment |
| US620261 | 2003-07-14 |
Publications (3)
| Publication Number | Publication Date |
|---|---|
| EP1499108A2 true EP1499108A2 (en) | 2005-01-19 |
| EP1499108A3 EP1499108A3 (en) | 2006-02-08 |
| EP1499108B1 EP1499108B1 (en) | 2012-05-09 |
Family
ID=33477093
Family Applications (1)
| Application Number | Title | Priority Date | Filing Date |
|---|---|---|---|
| EP04016480A Expired - Lifetime EP1499108B1 (en) | 2003-07-14 | 2004-07-13 | Color saturation adjustment |
Country Status (4)
| Country | Link |
|---|---|
| US (1) | US7355753B2 (en) |
| EP (1) | EP1499108B1 (en) |
| JP (1) | JP4578163B2 (en) |
| CN (1) | CN100457467C (en) |
Families Citing this family (8)
| Publication number | Priority date | Publication date | Assignee | Title |
|---|---|---|---|---|
| JP4189328B2 (en) * | 2004-01-16 | 2008-12-03 | セイコーエプソン株式会社 | Image processing apparatus, image display apparatus, image processing method, and image processing program |
| JP2006042267A (en) * | 2004-07-30 | 2006-02-09 | Canon Inc | Image processing method, image processing apparatus, and program |
| US8014024B2 (en) * | 2005-03-02 | 2011-09-06 | Xerox Corporation | Gray balance for a printing system of multiple marking engines |
| US8149454B2 (en) * | 2005-06-09 | 2012-04-03 | Xerox Corporation | Color printing |
| JP4464420B2 (en) * | 2007-04-18 | 2010-05-19 | キヤノン株式会社 | Image processing apparatus, image processing method, and program |
| US20110063858A1 (en) * | 2009-09-17 | 2011-03-17 | Sergio Alejandro Ortiz-Gavin | Hexadecimal RGB and CMYK Light Reflecting Surfaces and Techniques |
| JP5617567B2 (en) * | 2010-11-30 | 2014-11-05 | コニカミノルタ株式会社 | Calibration system, calibration method and program |
| CN103465624B (en) * | 2013-09-03 | 2015-09-16 | 天津市汇源印刷有限公司 | A kind of novel printing ink optimization |
Family Cites Families (39)
| Publication number | Priority date | Publication date | Assignee | Title |
|---|---|---|---|---|
| DE3109190C2 (en) * | 1981-03-11 | 1985-07-11 | Dr.-Ing. Rudolf Hell Gmbh, 2300 Kiel | Process for the reproduction of colored originals in four-color printing with color removal |
| DE3629396C2 (en) * | 1986-08-29 | 1993-12-23 | Agfa Gevaert Ag | Electronic image processing method |
| GB2213674B (en) | 1988-01-11 | 1992-01-08 | Xerox Corp | Method for improving the printed appearance of computer-generated color images |
| JPH02208646A (en) * | 1989-02-08 | 1990-08-20 | Fuji Xerox Co Ltd | Density correcting system for film image reader |
| JP2756040B2 (en) * | 1991-01-30 | 1998-05-25 | 富士写真フイルム株式会社 | UCR amount determination method and image processing apparatus |
| US5231504A (en) * | 1991-12-30 | 1993-07-27 | Xerox Corporation | Method for improved color reproduction using linear mixing calculations based on positional relationships between an original color and an achromatic region in a linear mixing space |
| EP0741042B1 (en) * | 1992-09-30 | 2002-08-28 | Hewlett-Packard Company, A Delaware Corporation | Method of reducing ink migration in digital color printing |
| US5359436A (en) * | 1992-11-12 | 1994-10-25 | Linotype-Hell Ag | Black recalculation for arbitrary HSL corrections in CMY color space |
| US5452017A (en) * | 1992-12-31 | 1995-09-19 | Hickman; Charles B. | Method and apparatus for electronic image color modification using hue and saturation levels |
| DE69413575T2 (en) * | 1993-02-12 | 1999-05-20 | Eastman Kodak Co., Rochester, N.Y. | Method and device for transforming input color sizes into an input color space into output color sizes into an output color space |
| US5604567A (en) * | 1994-06-03 | 1997-02-18 | Xerox Corporation | Printer color and gray balance adjustment system |
| EP0791266B1 (en) | 1994-09-16 | 2000-07-12 | Heidelberger Druckmaschinen Aktiengesellschaft | Black recalculation for arbitrary hsl corrections in cmy color space |
| US5790769A (en) * | 1995-08-04 | 1998-08-04 | Silicon Graphics Incorporated | System for editing time-based temporal digital media including a pointing device toggling between temporal and translation-rotation modes |
| JP3335507B2 (en) * | 1995-09-19 | 2002-10-21 | 京セラミタ株式会社 | Color image adjustment apparatus and color image adjustment method |
| US5710824A (en) * | 1996-03-13 | 1998-01-20 | Xerox Corporation | System to improve printer gamut |
| JPH09261497A (en) * | 1996-03-22 | 1997-10-03 | Minolta Co Ltd | Image forming device |
| JPH09321999A (en) * | 1996-05-24 | 1997-12-12 | Fuji Photo Film Co Ltd | Color conversion accuracy correction method |
| JPH1013697A (en) | 1996-06-18 | 1998-01-16 | Canon Inc | Image processing apparatus and method |
| JP3843170B2 (en) * | 1997-08-25 | 2006-11-08 | 富士写真フイルム株式会社 | Color correction function setting method |
| US6084689A (en) * | 1998-03-11 | 2000-07-04 | Colorbus, Inc. | Method and apparatus for saturation compensation in total ink limited output |
| JP3903083B2 (en) * | 1999-03-11 | 2007-04-11 | 富士フイルム株式会社 | Image processing apparatus, method, and recording medium |
| CN1245663C (en) * | 1999-05-12 | 2006-03-15 | 光宝科技股份有限公司 | Ways to Improve Printing Quality |
| JP2001136399A (en) * | 1999-11-04 | 2001-05-18 | Matsushita Electric Ind Co Ltd | Color chart for color proofing and color proofing device |
| JP2001218078A (en) * | 1999-11-25 | 2001-08-10 | Fuji Photo Film Co Ltd | Chroma correction apparatus and method |
| US7242503B2 (en) * | 1999-12-20 | 2007-07-10 | Fujifilm Corporation | Image reading method |
| JP4282877B2 (en) * | 2000-06-19 | 2009-06-24 | 富士通株式会社 | Color image processing method |
| JP3638870B2 (en) * | 2000-07-07 | 2005-04-13 | 株式会社沖データ | Color image density adjustment method and apparatus and color sample sheet |
| JP2002135611A (en) * | 2000-10-25 | 2002-05-10 | Matsushita Electric Ind Co Ltd | Color chart for color proofing and color image output device |
| US6972869B2 (en) * | 2000-12-18 | 2005-12-06 | Xerox Corporation | Mapping color to colorant amounts when colorants have similar hue |
| CN1142523C (en) * | 2001-02-20 | 2004-03-17 | 矽统科技股份有限公司 | Method for increasing image color saturation |
| JP4666274B2 (en) * | 2001-02-20 | 2011-04-06 | 日本電気株式会社 | Color image processing apparatus and method |
| JP3760815B2 (en) * | 2001-07-27 | 2006-03-29 | 株式会社日立製作所 | Video display device |
| JP4197858B2 (en) * | 2001-08-27 | 2008-12-17 | 富士通株式会社 | Image processing program |
| US20050213125A1 (en) * | 2002-08-19 | 2005-09-29 | Paul Reed Smith Guitars, Limited Partnership | Method of color accentuation with compensation and adjustment |
| US7042521B2 (en) * | 2002-08-29 | 2006-05-09 | Samsung Electronics Co., Ltd. | Method for color saturation adjustment in an RGB color system |
| EP1398956A1 (en) * | 2002-09-05 | 2004-03-17 | Hewlett Packard Company, a Delaware Corporation | 4-dimensional gray neutrality calibration |
| US7375849B2 (en) * | 2002-10-15 | 2008-05-20 | Xerox Corporation | Balancing grays on color printers |
| US7453591B2 (en) * | 2003-07-14 | 2008-11-18 | Xerox Corporation | Color saturation adjustment |
| JP4311411B2 (en) * | 2006-04-03 | 2009-08-12 | セイコーエプソン株式会社 | Color conversion table generation device, display device, color conversion table generation method, and display device manufacturing method |
-
2003
- 2003-07-14 US US10/620,261 patent/US7355753B2/en not_active Expired - Fee Related
-
2004
- 2004-07-09 JP JP2004202601A patent/JP4578163B2/en not_active Expired - Fee Related
- 2004-07-13 EP EP04016480A patent/EP1499108B1/en not_active Expired - Lifetime
- 2004-07-14 CN CNB2004100712021A patent/CN100457467C/en not_active Expired - Fee Related
Also Published As
| Publication number | Publication date |
|---|---|
| CN1576027A (en) | 2005-02-09 |
| JP4578163B2 (en) | 2010-11-10 |
| JP2005035298A (en) | 2005-02-10 |
| US7355753B2 (en) | 2008-04-08 |
| US20050012944A1 (en) | 2005-01-20 |
| CN100457467C (en) | 2009-02-04 |
| EP1499108A3 (en) | 2006-02-08 |
| EP1499108B1 (en) | 2012-05-09 |
Similar Documents
| Publication | Publication Date | Title |
|---|---|---|
| EP0590921B1 (en) | Color printer calibration and printing method and corresponding printing system | |
| EP0820189B1 (en) | Method and apparatus for converting color space | |
| EP0833499B1 (en) | Inter-separation color image processing using error diffusion | |
| EP1638313B1 (en) | Calibration of color devices | |
| US7453591B2 (en) | Color saturation adjustment | |
| EP1499108B1 (en) | Color saturation adjustment | |
| US7375849B2 (en) | Balancing grays on color printers | |
| US8149454B2 (en) | Color printing | |
| CA2444319C (en) | Balancing grays on color printers | |
| US6559982B1 (en) | Accurate monitor to printer color reproduction technique | |
| US7417766B2 (en) | Calibration of color devices | |
| WO2008124007A1 (en) | Adjusting colorants specified in a digital image | |
| JPH08331365A (en) | Image processing apparatus and method thereof |
Legal Events
| Date | Code | Title | Description |
|---|---|---|---|
| PUAI | Public reference made under article 153(3) epc to a published international application that has entered the european phase |
Free format text: ORIGINAL CODE: 0009012 |
|
| AK | Designated contracting states |
Kind code of ref document: A2 Designated state(s): AT BE BG CH CY CZ DE DK EE ES FI FR GB GR HU IE IT LI LU MC NL PL PT RO SE SI SK TR |
|
| AX | Request for extension of the european patent |
Extension state: AL HR LT LV MK |
|
| PUAL | Search report despatched |
Free format text: ORIGINAL CODE: 0009013 |
|
| AK | Designated contracting states |
Kind code of ref document: A3 Designated state(s): AT BE BG CH CY CZ DE DK EE ES FI FR GB GR HU IE IT LI LU MC NL PL PT RO SE SI SK TR |
|
| AX | Request for extension of the european patent |
Extension state: AL HR LT LV MK |
|
| 17P | Request for examination filed |
Effective date: 20060808 |
|
| AKX | Designation fees paid |
Designated state(s): DE FR GB |
|
| 17Q | First examination report despatched |
Effective date: 20061228 |
|
| GRAP | Despatch of communication of intention to grant a patent |
Free format text: ORIGINAL CODE: EPIDOSNIGR1 |
|
| GRAS | Grant fee paid |
Free format text: ORIGINAL CODE: EPIDOSNIGR3 |
|
| GRAA | (expected) grant |
Free format text: ORIGINAL CODE: 0009210 |
|
| AK | Designated contracting states |
Kind code of ref document: B1 Designated state(s): DE FR GB |
|
| REG | Reference to a national code |
Ref country code: GB Ref legal event code: FG4D |
|
| REG | Reference to a national code |
Ref country code: DE Ref legal event code: R096 Ref document number: 602004037709 Country of ref document: DE Effective date: 20120712 |
|
| PLBE | No opposition filed within time limit |
Free format text: ORIGINAL CODE: 0009261 |
|
| STAA | Information on the status of an ep patent application or granted ep patent |
Free format text: STATUS: NO OPPOSITION FILED WITHIN TIME LIMIT |
|
| 26N | No opposition filed |
Effective date: 20130212 |
|
| REG | Reference to a national code |
Ref country code: DE Ref legal event code: R097 Ref document number: 602004037709 Country of ref document: DE Effective date: 20130212 |
|
| PGFP | Annual fee paid to national office [announced via postgrant information from national office to epo] |
Ref country code: GB Payment date: 20130626 Year of fee payment: 10 |
|
| PGFP | Annual fee paid to national office [announced via postgrant information from national office to epo] |
Ref country code: DE Payment date: 20130621 Year of fee payment: 10 |
|
| PGFP | Annual fee paid to national office [announced via postgrant information from national office to epo] |
Ref country code: FR Payment date: 20130722 Year of fee payment: 10 |
|
| REG | Reference to a national code |
Ref country code: DE Ref legal event code: R119 Ref document number: 602004037709 Country of ref document: DE |
|
| GBPC | Gb: european patent ceased through non-payment of renewal fee |
Effective date: 20140713 |
|
| REG | Reference to a national code |
Ref country code: FR Ref legal event code: ST Effective date: 20150331 |
|
| PG25 | Lapsed in a contracting state [announced via postgrant information from national office to epo] |
Ref country code: DE Free format text: LAPSE BECAUSE OF NON-PAYMENT OF DUE FEES Effective date: 20150203 |
|
| REG | Reference to a national code |
Ref country code: DE Ref legal event code: R119 Ref document number: 602004037709 Country of ref document: DE Effective date: 20150203 |
|
| PG25 | Lapsed in a contracting state [announced via postgrant information from national office to epo] |
Ref country code: GB Free format text: LAPSE BECAUSE OF NON-PAYMENT OF DUE FEES Effective date: 20140713 Ref country code: FR Free format text: LAPSE BECAUSE OF NON-PAYMENT OF DUE FEES Effective date: 20140731 |