EP1489865A1 - Method and system for analysing data quality measurements in wireless data communication networks - Google Patents
Method and system for analysing data quality measurements in wireless data communication networks Download PDFInfo
- Publication number
- EP1489865A1 EP1489865A1 EP03076894A EP03076894A EP1489865A1 EP 1489865 A1 EP1489865 A1 EP 1489865A1 EP 03076894 A EP03076894 A EP 03076894A EP 03076894 A EP03076894 A EP 03076894A EP 1489865 A1 EP1489865 A1 EP 1489865A1
- Authority
- EP
- European Patent Office
- Prior art keywords
- indicator
- quality
- data transfer
- data network
- download
- Prior art date
- Legal status (The legal status is an assumption and is not a legal conclusion. Google has not performed a legal analysis and makes no representation as to the accuracy of the status listed.)
- Withdrawn
Links
- 238000000034 method Methods 0.000 title claims abstract description 34
- 238000005259 measurement Methods 0.000 title claims abstract description 30
- 238000004891 communication Methods 0.000 title description 6
- 238000012546 transfer Methods 0.000 claims abstract description 34
- 238000012545 processing Methods 0.000 claims abstract description 7
- 238000003012 network analysis Methods 0.000 claims abstract description 3
- 238000013507 mapping Methods 0.000 claims description 28
- 238000004590 computer program Methods 0.000 claims description 6
- 238000012935 Averaging Methods 0.000 claims description 4
- 238000004458 analytical method Methods 0.000 abstract description 17
- 238000013459 approach Methods 0.000 description 15
- 230000006399 behavior Effects 0.000 description 8
- 230000004044 response Effects 0.000 description 8
- 230000008447 perception Effects 0.000 description 4
- 230000008901 benefit Effects 0.000 description 3
- 238000010586 diagram Methods 0.000 description 3
- 230000015654 memory Effects 0.000 description 3
- 238000012805 post-processing Methods 0.000 description 3
- 238000001303 quality assessment method Methods 0.000 description 3
- 238000012360 testing method Methods 0.000 description 3
- 230000015556 catabolic process Effects 0.000 description 2
- 230000003247 decreasing effect Effects 0.000 description 2
- 238000006731 degradation reaction Methods 0.000 description 2
- 230000000694 effects Effects 0.000 description 2
- 230000002411 adverse Effects 0.000 description 1
- 230000005540 biological transmission Effects 0.000 description 1
- 230000002301 combined effect Effects 0.000 description 1
- 230000000052 comparative effect Effects 0.000 description 1
- 230000002596 correlated effect Effects 0.000 description 1
- 230000000875 corresponding effect Effects 0.000 description 1
- 238000007405 data analysis Methods 0.000 description 1
- 230000001419 dependent effect Effects 0.000 description 1
- 239000000796 flavoring agent Substances 0.000 description 1
- 235000019634 flavors Nutrition 0.000 description 1
- 230000006870 function Effects 0.000 description 1
- 230000000977 initiatory effect Effects 0.000 description 1
- 239000004065 semiconductor Substances 0.000 description 1
- 230000011664 signaling Effects 0.000 description 1
- 230000036962 time dependent Effects 0.000 description 1
Images


Classifications
-
- H—ELECTRICITY
- H04—ELECTRIC COMMUNICATION TECHNIQUE
- H04W—WIRELESS COMMUNICATION NETWORKS
- H04W24/00—Supervisory, monitoring or testing arrangements
Definitions
- the invention relates to data communication systems, and more particularly relates to a method and system for measuring end-to-end perceived data quality in wireless data communication systems.
- the present invention relates to field measurements because these measurements provide the best correlation with user perception.
- the present invention particularly focuses on the end-to-end perceived quality for a service that will be broadly used on wireless data networks: downloading files using FTP (File Transfer Protocol).
- FTP File Transfer Protocol
- One such system comprises a means for obtaining information related to a location of the mobile wireless device within the wireless data network, a means for establishing a data call between the mobile wireless device and the wireless data network via an electromagnetic signal, a means for obtaining information related to the quality of data service associated with the data call, and a means for correlating the information related to the quality of data service with the information related to the location of the mobile wireless device.
- a major drawback of existing systems for measuring data quality in wireless communication networks is that it is not clear how the lower layer indicator measurements, like amount of resources allocated, relate to the perception of the performance of the wireless data service by the user.
- An example of these indicators for GPRS networks is number of used timeslots, bit/frame error rates, carrier/interference ratio C/I and coding scheme usage, cell reselections, etc.
- the aim of the present invention is to provide a method and system to assess the end-to-end perceived quality by the user.
- a method for determining a quality indicator for end-to-end data transfer in a data network comprising measuring at least one system performance indicator using a predefined data transfer type specimen, and deriving the quality indicator for at least one other data transfer type from the at least one performance indicator.
- the at least one system performance indicator may be a measured parameter which is indirectly or directly linked to the quality indicator to be estimated.
- the at least one system performance indicator may in a first embodiment comprise an indirect quality indicator, i.e. an indicator which may be measured, but is not directly related to a perceived quality.
- the system performance indicator may e.g. be at least one low level data network performance parameter as normally measured for assessing network performance.
- the method further comprises mapping the at least one low level data network performance parameter to the quality indicator.
- the quality indicator may be an estimated session time for the at least one other data transfer type (or directly related thereto, the throughput speed for the at least one other data transfer type).
- the low level data network performance parameters may e.g. be the percentage of time in which a specific coding scheme is used in the downlink, or the number of used timeslots during the download.
- these performance parameters show a high correlation with actual session times, and can thus be used to derive estimated session times from data gathered from a single large file FTP download.
- the measured C/I value Carrier/Interference ratio
- the measured C/I value may advantageously be used as low level performance parameter, e.g. in combination with the Number of used time slot parameter.
- the mapping of the measured parameters using the low level performance parameters may be a linear mapping (using a single parameter) or a multidimensional mapping, e.g. using two parameters (two-dimensional mapping).
- a linear mapping using a single parameter
- a multidimensional mapping e.g. using two parameters (two-dimensional mapping).
- the measured low level performance parameters are modified to model more accurately the estimation of the session time.
- Integer values of the at least one low level data network performance parameter may e.g. be mapped to real values.
- the number of used timeslots (an integer value) may be mapped to real values (integer value 1 is mapped as real value x1; integer value 2 is mapped as real value x2), and the percentage of time that a parameter has values in a predefined range may be clipped (e.g. at 5%).
- good results have been achieved when the number of used time slots are mapped differently, i.e. different values for x1 and x2.
- the at least one system performance indicator is a direct quality indicator.
- the at least one system performance indicator is the measured throughput speed of a download of the predefined data transfer type specimen (e.g. a 512 kByte file), and the quality indicator is derived from the measured throughput speed using a moving window averaging estimation, in which the size of the moving window corresponds to the at least one other data transfer type.
- the at least one other data transfer type may e.g. be an FTP download of a smaller size file.
- a final quality indicator is calculated in a further embodiment from the percentage increase in the quality indicator (such as the estimated session time) for the at least one other data transfer type. This allows to obtain a final quality figure, e.g. on a scale from 1-5, which allows easier interpretation and comparison.
- Underlying causes in the system may be determined from further analysis of the contribution of each low level performance parameter to the estimated session time.
- direct and/or statistical back mapping of the at least one system performance indicator may be used. In this manner, it is e.g. possible to determine whether voice congestion or cell reselection is the major source of bad performance, by looking at the contributions of various low level data network performance parameters to the derived quality indicator.
- the predefined data transfer type specimen as used for measuring the at least one system performance indicator (indirect or direct) in all of the above described embodiments may e.g. be a FTP download of a large size file (e.g. 512 kByte).
- the quality indicator for data transfer types may then be derived from this at least one system performance indicator.
- Other data transfer types may be FTP downloads of different size of files (e.g. 4, 32 and 128 kByte), a browsing session, audio streaming data, video streaming data, chat sessions, etc..
- the present method allows to derive a number of quality indicators for different types of data transfers using only a single field measurement (the large file size download).
- the quality indicator is e.g. a session time, such as the sum of the response time and download time in an FTP session.
- the present invention relates to a measurement system for determining a quality indicator for end-to-end data transfer in a wireless data network, comprising a data network analysis system connected to the wireless data transfer network for measuring at least one system performance indicator using a predefined data transfer type specimen, in which the measurement system is further equipped with processing means which are arranged for deriving the quality indicator for at least one other data transfer type from the at least one performance indicator. Furthermore, the processing means may be arranged to execute the method according to one of the present methods.
- This measurement system provides advantages analogue to the advantages described above in relation to the present method.
- the present invention relates to a computer program comprising computer readable software instructions, which when loaded on a computer system, provides the computer system with the functionality of the method according to one of the present methods. Also, the present invention relates to a computer program product, such as a floppy disc or CDROM, comprising a computer program according to the present invention.
- FIG 1 a schematic diagram is shown of a measurement system 10, in which the present invention may be embodied.
- the data network as used in the following exemplary embodiments of the present invention is a GPRS network 1 (General Packet Radio Service), to which many users may be connected using wireless terminals 8 (only one shown in figure 1).
- the GPRS network 1 may be connected to further data or voice networks, to which further systems (e.g. an FTP server or a web site host server) may be connected to allow a user mobile access.
- the GPRS network 1 is optimised for data transfer.
- the present invention is explained using a GPRS network 1, the person skilled in the art will understand the invention may also be applied in other types of data transfer networks.
- the measurement system 10 may be connected to the GPRS-network 1 using a proper wireless terminal 7 and a dedicated interface 6.
- the measurement system 10 comprises a processing system 2 (which may comprise one or more processors or other processing means), connected to input/output elements 5 (such as a keyboard, mouse, trackball, etc.), a display 4 (such as a monitor or LCD display), and memory 3, e.g. in the form of a hard disk, semiconductor memory (ROM, RAM, etc.) or removable memory means (floppy disc, CDROM, etc.).
- the processor 2 is arranged to execute a software program (e.g. stored in one of the memories 3) which comprises program code which allows the processor 2 to execute the present method.
- the basic start point of the end-to-end GPRS quality measurements (which may provide a quality indicator) is the quality as perceived by the user.
- FTP file downloads, browsing sessions, streaming audio/video data, chat sessions, etc. the determining factors are:
- the main causes for low performance within the GPRS network 1 are:
- the congestion influence is pre-dominantly seen in the time dependent behaviour of the quality. Congestion comes in two different flavours, voice congestion and data congestion. Voice congestion can be detected by looking at the number of used time slots. Data congestion is more difficult to detect.
- bad radio conditions and cell reselections The influence of bad radio conditions and cell reselections is pre-dominantly seen in the location dependent behaviour of the quality.
- Bad radio conditions can be detected from C/I measurements, bit/frame error rates and coding scheme usage.
- Cell reselections can be detected by looking at the number of used time slots, which drops to zero when a cell reselection occurs. With voice congestion this drop in number of used time slots rarely goes to zero.
- Server/Core network performance is mostly out of the control of a service provider and will especially dominate performance for high speed links.
- server performance should generally not be the limiting factor but it is clear that in assessing GPRS quality over the Internet the server and the public domain part of the connection that is used may have a significant influence. Therefore measurements that use public domain servers are not suited for field measurements. Two different approaches are possible to solve the problem:
- relevant lower layer indicators e.g. at the physical, network, transport layer
- relevant lower layer indicators are measured during an FTP download for each of the four different files sizes. From possible indicators the combination that gives the best mapping from indicators to session (download) time is searched for.
- the mapping of these indicators should have a direct interpretation as to what the underlying reason is for the low GPRS performance (i.e. long download times).
- the indicators that are found are the same for all four different downloads, but only the mappings from indicators to download time is different.
- This second approach can also be applied for browsing quality assessments.
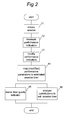
- figure 2 shows a flow chart of an embodiment of the present method.
- the measurement is started by initiating a large file size (e.g. 512 kByte) download (block 11).
- performance indicators such as throughput speed, number of used time slots, percentage of time in which a specific coding scheme is used, measured C/I value, etc are measured in block 12, and when needed, one or more of these performance parameters are modified (see below) in block 13.
- the (modified) performance parameters are mapped to an estimated session time using a predefined mapping function (see also the explanation below).
- the estimated session time may be used directly as and end-to-end perceived quality indicator, or a further quality indicator (e.g. using a scale of one to five) may be derived (block 15).
- the largest file download does not need any post processing since quality is measured directly from the download time of this 512 kByte file. For statistical reliability one can follow the recommendation to use the variation over 10 downloads to estimate fluctuations in quality.
- the three small file quality measurements can be derived from the large file 512 kByte download by measuring the average application throughput with a running moving window with the three different time windows (4, 12 and 40 s) for the three different file sizes (4, 32 and 128 kByte).
- the download time for a 128 kByte file is about 40 seconds, corresponding to a throughput of 3.2 kByte/s. This is valid for a terminal which uses three timeslots in a downlink. Tests have shown that the predicted session time is correct for these ideal circumstances..
- mappings are searched for, preferably using the same combination of lower layer indicators for all four file sizes but with a different mapping.
- These lower layer indicators are less influenced by the transport/application layer behaviour for large file downloads and will thus also allow correct quality predictions on the 4kByte time scale.
- the mapping should allow to analyse the underlying cause for bad performance.
- lower layer indicators were correlated with a single linear mapping between download time and indicator, for all four different files sizes (4, 32, 128 and 512 kByte). The best indicators were:
- the indicator number of used timeslots is influenced by both cell-reselections and voice congestion.
- cell-reselections the number of used timeslots is zero during the reselection process while for voice congestion it is decreased, e.g. from 3 down to 1. It turned out that the impact of a lower average number of used timeslots was far less in the case of voice congestion than in the case of cell reselections.
- the final two-dimensional mapping that is used in the mapping tool gives an better correlation between model prediction and measured download time over all download times using the same indicator set for all four file sizes (4, 32, 128, 512 kByte).
- This correlation is up to a level that can be used in a tool, especially when it is combined with the analysis of the first assessment approach (see below).
- An example of the relation between measured and predicted download time is given in Figure 3 for the 32kByte case for which the fastest download time is 12 seconds. Few points, indicated with arrows in Figure 3, show a significant deviation from the regression line that can be derived from these measurement points. This is caused by a limitation of the used measurement equipment that could not correctly measure the utilisation of the used time slots in downlink.
- an FTP download quality assessment tool is implemented as a post processing on the analysis tool output that uses the following strategy:
- the tool allows to further analyse the underlying cause of bad performance by:
- Figure 4 shows an example of the estimated download time of a 4 kByte file from the download of a large 512 kByte file under bad circumstances using the lower layer prediction.
- the present invention can also be applied for other data transfer types than the FTP file download as discussed in the example above.
- Further possible applications in which end-to-end perceived quality can be determined using the present invention include, but are not limited to, browsing, streaming audio, streaming video, chatting etc.
- other (combinations of) performance indicators direct performance indicator(s) such as throughput speed, or indirect performance indicator(s) such as number of used cells, etc (see above) may be used.
- This section deals with the problem of how to interpret the time variant behaviour for each of the three file sizes (4, 32, 128 kByte, coinciding with the time scales of 4, 12 and 40 seconds).
- For the largest file (512 kByte) quality is measured directly from the download time of the file and time variant behaviour has to be assessed on the basis of multiple downloads (e.g. 10 downloads as recommended).
- the basic idea in the data interpretation is that the download time has to vary over more than 25% in order to have a perceptual effect and has to vary by a factor of two for perceiving a significant degradation.
- quality categorization can be used for both FTP download and browsing. This leads to the following quality classes using the ITU-T 5 point rating scale.
- a first global quality analysis in the final post processing tool is carried out by calculating the percentage poor or bad as is commonly used in speech transmission quality assessment. This percentage is calculated from the lower layer indicators as well as from the application throughput (see above). This allows for an easy to interpret small set of quality numbers. For each of the three FTP download time scales and the single browsing time scale, two quality numbers in the form of a percentage poor or bad, are thus given. When they are about the same the degradation is not caused by data congestion, when they are significantly different data congestions plays an important role.
Landscapes
- Engineering & Computer Science (AREA)
- Computer Networks & Wireless Communication (AREA)
- Signal Processing (AREA)
- Mobile Radio Communication Systems (AREA)
- Communication Control (AREA)
Abstract
Measurement system and method for determining a quality indicator for
end-to-end data transfer in a wireless data network (1). A data network analysis
system (10) is connected to the wireless data network (1) for measuring at least
one system performance indicator using a predefined data transfer specimen.
The measurement system (10) is further equipped with processing means (2)
which are arranged for deriving the quality indicator for at least one other data
transfer type from the at least one performance indicator. The present system
and method also allow to analyse the contributions to the quality indicator for
determining underlying causes for bad performance.
Description
The invention relates to data communication systems, and more particularly
relates to a method and system for measuring end-to-end perceived data
quality in wireless data communication systems.
With the introduction of wireless data networks it has become important to
measure the end-to-end perceived quality for the different types of services that
can be used over a (wireless) data network. It is already common practice to
measure the lower layer data quality of a network, for example on the physical,
transport or network layers. But for the broad acceptance of wireless data
networks, and for the resulting commercial success, it is necessary to assess
how the user of these wireless services will perceive the quality of the service.
To be able to assess the perceived quality based on lower layer measurements
it is necessary to determine which lower layer measurements best correlate
with the perceived quality.
The present invention relates to field measurements because these
measurements provide the best correlation with user perception. The present
invention particularly focuses on the end-to-end perceived quality for a service
that will be broadly used on wireless data networks: downloading files using
FTP (File Transfer Protocol). However, it will be clear to the person skilled in the
art that end-to-end quality determination in other types of data transfer
(browsing, audio/video data streaming, chatting) also may benefit from the
present invention.
Tools for performing field measurements on the lower layer data quality in
wireless communication networks are known, see for example
US2002/0155816, which discloses systems and methods for measuring data
quality in a wireless communication network. One such system comprises a
means for obtaining information related to a location of the mobile wireless
device within the wireless data network, a means for establishing a data call
between the mobile wireless device and the wireless data network via an
electromagnetic signal, a means for obtaining information related to the quality
of data service associated with the data call, and a means for correlating the
information related to the quality of data service with the information related to
the location of the mobile wireless device.
A drawback of these existing data quality measurements systems is that it is
not known how the lower layer measurements correlate to the perception of the
user of the wireless data services.
A major drawback of existing systems for measuring data quality in wireless
communication networks is that it is not clear how the lower layer indicator
measurements, like amount of resources allocated, relate to the perception of
the performance of the wireless data service by the user. An example of these
indicators for GPRS networks is number of used timeslots, bit/frame error rates,
carrier/interference ratio C/I and coding scheme usage, cell reselections, etc.
The aim of the present invention is to provide a method and system to
assess the end-to-end perceived quality by the user.
It is another aim of the present invention to provide a system for identifying
underlying causes for bad performance.
According to the present invention, a method is provided for determining a
quality indicator for end-to-end data transfer in a data network, e.g. the
download and/or response time or network throughput in a GPRS network,
comprising measuring at least one system performance indicator using a
predefined data transfer type specimen, and deriving the quality indicator for at
least one other data transfer type from the at least one performance indicator.
The at least one system performance indicator may be a measured
parameter which is indirectly or directly linked to the quality indicator to be
estimated.
The at least one system performance indicator may in a first embodiment
comprise an indirect quality indicator, i.e. an indicator which may be measured,
but is not directly related to a perceived quality. The system performance
indicator may e.g. be at least one low level data network performance
parameter as normally measured for assessing network performance. The
method further comprises mapping the at least one low level data network
performance parameter to the quality indicator. The quality indicator may be an
estimated session time for the at least one other data transfer type (or directly
related thereto, the throughput speed for the at least one other data transfer
type).
The low level data network performance parameters may e.g. be the
percentage of time in which a specific coding scheme is used in the downlink,
or the number of used timeslots during the download. In the case of FTP
downloads, these performance parameters show a high correlation with actual
session times, and can thus be used to derive estimated session times from
data gathered from a single large file FTP download. For browsing, it has been
found that the measured C/I value (Carrier/Interference ratio) may
advantageously be used as low level performance parameter, e.g. in
combination with the Number of used time slot parameter.
The mapping of the measured parameters using the low level performance
parameters may be a linear mapping (using a single parameter) or a multidimensional
mapping, e.g. using two parameters (two-dimensional mapping).
For FTP downloads, correlations between actual session times and estimated
session times have been found, with the combination of the two previously
mentioned low level parameters providing the best result. For browsing, good
results have been achieved using the parameters number of used time slots
and averaged measured C/I value.
In a further embodiment, the measured low level performance parameters
are modified to model more accurately the estimation of the session time.
Integer values of the at least one low level data network performance
parameter may e.g. be mapped to real values. For example, for FTP
downloads, the number of used timeslots (an integer value) may be mapped to
real values (integer value 1 is mapped as real value x1; integer value 2 is
mapped as real value x2), and the percentage of time that a parameter has
values in a predefined range may be clipped (e.g. at 5%). For browsing, good
results have been achieved when the number of used time slots are mapped
differently, i.e. different values for x1 and x2.
In a further group of embodiments, which may advantageously be used for
determining estimated session times as quality indicators for FTP downloads,
the at least one system performance indicator is a direct quality indicator. In this
case, the at least one system performance indicator is the measured
throughput speed of a download of the predefined data transfer type specimen
(e.g. a 512 kByte file), and the quality indicator is derived from the measured
throughput speed using a moving window averaging estimation, in which the
size of the moving window corresponds to the at least one other data transfer
type. The at least one other data transfer type may e.g. be an FTP download of
a smaller size file.
A final quality indicator is calculated in a further embodiment from the
percentage increase in the quality indicator (such as the estimated session
time) for the at least one other data transfer type. This allows to obtain a final
quality figure, e.g. on a scale from 1-5, which allows easier interpretation and
comparison.
Underlying causes in the system may be determined from further analysis of
the contribution of each low level performance parameter to the estimated
session time. To allow for analyzing the underlying causes for bad
performance, direct and/or statistical back mapping of the at least one system
performance indicator may be used. In this manner, it is e.g. possible to
determine whether voice congestion or cell reselection is the major source of
bad performance, by looking at the contributions of various low level data
network performance parameters to the derived quality indicator.
The predefined data transfer type specimen as used for measuring the at
least one system performance indicator (indirect or direct) in all of the above
described embodiments may e.g. be a FTP download of a large size file (e.g.
512 kByte). The quality indicator for data transfer types may then be derived
from this at least one system performance indicator. Other data transfer types
may be FTP downloads of different size of files (e.g. 4, 32 and 128 kByte), a
browsing session, audio streaming data, video streaming data, chat sessions,
etc..
The present method allows to derive a number of quality indicators for
different types of data transfers using only a single field measurement (the large
file size download). The quality indicator is e.g. a session time, such as the sum
of the response time and download time in an FTP session.
In a further aspect, the present invention relates to a measurement system
for determining a quality indicator for end-to-end data transfer in a wireless data
network, comprising a data network analysis system connected to the wireless
data transfer network for measuring at least one system performance indicator
using a predefined data transfer type specimen, in which the measurement
system is further equipped with processing means which are arranged for
deriving the quality indicator for at least one other data transfer type from the at
least one performance indicator. Furthermore, the processing means may be
arranged to execute the method according to one of the present methods. This
measurement system provides advantages analogue to the advantages
described above in relation to the present method.
In an even further aspect, the present invention relates to a computer
program comprising computer readable software instructions, which when
loaded on a computer system, provides the computer system with the
functionality of the method according to one of the present methods. Also, the
present invention relates to a computer program product, such as a floppy disc
or CDROM, comprising a computer program according to the present invention.
The present invention will now be explained in further detail using a number
of exemplary embodiments, with reference to the accompanying drawings.
In figure 1, a schematic diagram is shown of a measurement system 10, in
which the present invention may be embodied. The data network as used in the
following exemplary embodiments of the present invention is a GPRS network 1
(General Packet Radio Service), to which many users may be connected using
wireless terminals 8 (only one shown in figure 1). Also, the GPRS network 1
may be connected to further data or voice networks, to which further systems
(e.g. an FTP server or a web site host server) may be connected to allow a user
mobile access. The GPRS network 1 is optimised for data transfer. Although
the present invention is explained using a GPRS network 1, the person skilled
in the art will understand the invention may also be applied in other types of
data transfer networks.
The measurement system 10 may be connected to the GPRS-network 1
using a proper wireless terminal 7 and a dedicated interface 6. The
measurement system 10 comprises a processing system 2 (which may
comprise one or more processors or other processing means), connected to
input/output elements 5 (such as a keyboard, mouse, trackball, etc.), a display
4 (such as a monitor or LCD display), and memory 3, e.g. in the form of a hard
disk, semiconductor memory (ROM, RAM, etc.) or removable memory means
(floppy disc, CDROM, etc.). The processor 2 is arranged to execute a software
program (e.g. stored in one of the memories 3) which comprises program code
which allows the processor 2 to execute the present method.
The basic start point of the end-to-end GPRS quality measurements (which
may provide a quality indicator) is the quality as perceived by the user. For data
services (FTP file downloads, browsing sessions, streaming audio/video data,
chat sessions, etc.) the determining factors are:
- The response time, the time it takes to receive the first response
- The download time, the time it takes to send/receive the data
- The variation in response time
- The variation in download time
- The way the data is presented to the user
- The data integrity, meaning that the data is transported without errors
For normal data services the TCP layer guarantees the integrity.
It has been found that the combined effect of response and download time is
the most significant factor that determines the end-to-end perceived quality.
With FTP there is in general no distinction made between download time and
response time and FTP download time (or session time) is in this report used to
indicate the time between start and stop of the FTP session. With browsing
there is in general a distinction made between download time and response
time and in this report the sum of the two is referred to as browsing time (or
session time).
The main causes for low performance within the GPRS network 1 are:
- Congestion, too many active users
- Bad radio conditions, low C/I (carrier/interference ratio) sometimes leading to cell reselections
- Cell reselections
- Server/Core network performance
The congestion influence is pre-dominantly seen in the time dependent
behaviour of the quality. Congestion comes in two different flavours, voice
congestion and data congestion. Voice congestion can be detected by looking
at the number of used time slots. Data congestion is more difficult to detect.
The influence of bad radio conditions and cell reselections is pre-dominantly
seen in the location dependent behaviour of the quality. Bad radio conditions
can be detected from C/I measurements, bit/frame error rates and coding
scheme usage. Cell reselections can be detected by looking at the number of
used time slots, which drops to zero when a cell reselection occurs. With voice
congestion this drop in number of used time slots rarely goes to zero.
Server/Core network performance is mostly out of the control of a service
provider and will especially dominate performance for high speed links. For low
speed links, server performance should generally not be the limiting factor but it
is clear that in assessing GPRS quality over the Internet the server and the
public domain part of the connection that is used may have a significant
influence. Therefore measurements that use public domain servers are not
suited for field measurements. Two different approaches are possible to solve
the problem:
- Using a reference connection with a reference server both outside the public domain
- Comparing the GPRS performance with a standard fixed line performance and then estimate the influence of the public domain part of the connection
Two different approaches were taken in the data analysis. In the first
approach the throughput speed at the application layer for a 512 kByte file
download is averaged over three different time scales that approximately
coincide with the download of the file sizes of 4, 32 and 128 kByte. From this
averaged throughput direct predictions can be made for the download times of
the 4, 32 and 128 kByte files from the 512 kByte file. This allows a direct quality
analysis for FTP downloads for all four different file sizes (4, 32, 128 and 512
kByte), but does not allow to find the underlying causes for bad performance.
In the second approach relevant lower layer indicators (e.g. at the physical,
network, transport layer) are measured during an FTP download for each of the
four different files sizes. From possible indicators the combination that gives the
best mapping from indicators to session (download) time is searched for. The
mapping of these indicators should have a direct interpretation as to what the
underlying reason is for the low GPRS performance (i.e. long download times).
Preferably the indicators that are found are the same for all four different
downloads, but only the mappings from indicators to download time is different.
This second approach can also be applied for browsing quality assessments.
In general, figure 2 shows a flow chart of an embodiment of the present
method. The measurement is started by initiating a large file size (e.g. 512
kByte) download (block 11). During the download, performance indicators (such
as throughput speed, number of used time slots, percentage of time in which a
specific coding scheme is used, measured C/I value,...) are measured in block
12, and when needed, one or more of these performance parameters are
modified (see below) in block 13. In the next step (block 14), the (modified)
performance parameters are mapped to an estimated session time using a
predefined mapping function (see also the explanation below). The estimated
session time may be used directly as and end-to-end perceived quality
indicator, or a further quality indicator (e.g. using a scale of one to five) may be
derived (block 15). Also, it is possible to analyse the various contributions of
each of the performance parameters to the quality indicator (block 16) to
determine the underlying causes of a bad performance.
In the following, separate descriptions will be given for the exemplary
determination of quality indicators for FTP file downloads and browsing using a
GPRS network 1.
To keep the amount of final data manageable the following file sizes can be
used for FTP download testing:
- 4 kByte, with download times between 4 and about 10 seconds
- 32 kByte, with download times between 12 and about 30 seconds
- 128 kByte, with download times between 40 and about 100 seconds
- 512 kByte, with download times between 140 and about 300 seconds
The largest file download does not need any post processing since quality is
measured directly from the download time of this 512 kByte file. For statistical
reliability one can follow the recommendation to use the variation over 10
downloads to estimate fluctuations in quality.
Using the first assessment approach the three small file quality
measurements can be derived from the large file 512 kByte download by
measuring the average application throughput with a running moving window
with the three different time windows (4, 12 and 40 s) for the three different file
sizes (4, 32 and 128 kByte). In ideal circumstances, the download time for a
128 kByte file is about 40 seconds, corresponding to a throughput of 3.2
kByte/s. This is valid for a terminal which uses three timeslots in a downlink.
Tests have shown that the predicted session time is correct for these ideal
circumstances..
Under bad circumstances, the throughput speed will vary. Tests have shown
that in this case, the method provides a sufficiently accurate estimated session
time.
For the smaller size files, comparative results have been obtained using the
window averaging method.
This leads to the conclusion that application throughput as measured using a
large file (512 kByte) download can be used for assessing the download quality
from the point of the user for file sizes of 32 kByte and larger. For these file
sizes the throughput variations on the application level caused by the TCP layer
are acceptable. For file sizes below 32 kByte one should be aware that
fluctuations up to 70% can be caused by the current TCP/IP stack behaviour.
Although this direct approach allows to quantify the quality it does not allow
to find the underlying causes for bad performance. Therefore the next step is to
analyse the data with the second assessment approach.
As explained above the second assessment approach analyses the
download results for 4, 32,128 and 512 kByte files over a wide range of network
conditions and tries to find lower layer indicators that best correlate with the
download time. For each of the four file sizes mappings are searched for,
preferably using the same combination of lower layer indicators for all four file
sizes but with a different mapping. These lower layer indicators are less
influenced by the transport/application layer behaviour for large file downloads
and will thus also allow correct quality predictions on the 4kByte time scale.
Furthermore the mapping should allow to analyse the underlying cause for bad
performance. In a first analysis lower layer indicators were correlated with a
single linear mapping between download time and indicator, for all four different
files sizes (4, 32, 128 and 512 kByte). The best indicators were:
- The percentage of time that a specific coding scheme is used in the downlink,
- The number of used time slots in the downlink.
When searching for the best two-dimensional mapping the afore mentioned
indicator set gave the best correlation of all possible pairs.
A first detailed analysis showed that data congestion and voice congestion
are the main effects that need to be modelled accurately in order to get higher
correlations.
The indicator number of used timeslots is influenced by both cell-reselections
and voice congestion. With cell-reselections the number of used timeslots is
zero during the reselection process while for voice congestion it is decreased,
e.g. from 3 down to 1. It turned out that the impact of a lower average number
of used timeslots was far less in the case of voice congestion than in the case
of cell reselections.
An effective way of modelling can be carried out in mapping the use of 1 and
2 time slots, as occurs with voice congestion, to the real values x1 and x2
respectively (i.e. all occurrences of 1 time slot are substituted by x1 and 2 by
x2, effectively decreasing the impact of the use of 1 and 2 timeslots). This
modified indicator (modified low level performance indicator) is denoted by
MOD(UsedTimeslotsDL).
A second detailed analysis showed that the indicator for percentage of time a
specific coding scheme is used, had little influence in the range between 0 and
5%. This is most probably caused by the fact that signalling information is
always coded with the specific coding scheme so that the coding scheme
usage below a certain percentage gives no information about the quality of the
channel. This can be taken into account by mapping all values between 0 and 5
% to 5% (clipping). This modified indicator is denoted by
MOD(CodingSchemeDL).
The final two-dimensional mapping that is used in the mapping tool gives an
better correlation between model prediction and measured download time over
all download times using the same indicator set for all four file sizes (4, 32, 128,
512 kByte). This correlation is up to a level that can be used in a tool, especially
when it is combined with the analysis of the first assessment approach (see
below). An example of the relation between measured and predicted download
time is given in Figure 3 for the 32kByte case for which the fastest download
time is 12 seconds. Few points, indicated with arrows in Figure 3, show a
significant deviation from the regression line that can be derived from these
measurement points. This is caused by a limitation of the used measurement
equipment that could not correctly measure the utilisation of the used time slots
in downlink.
Based on the two assessment approaches an FTP download quality
assessment tool is implemented as a post processing on the analysis tool
output that uses the following strategy:
- The input to the tool is the raw output from a 512 kByte download using the analysis tool application.
- For the file sizes of 32 kByte and 128 kByte the application throughput is averaged over the correct time scale (12 and 40 seconds respectively) and used as direct quality indicator (first assessment approach).
- The lower layer indicator percentage of time a specific coding scheme is used in %, is clipped. All values between 0 % and 5 are mapped to 5% to cope with the problem of performance saturation that occurs when the use of the specific coding scheme is below 5%.
- The lower layer indicator values number of used timeslots are modified in such a way that the difference in impact between a lower average number of used timeslots due to voice congestion and a lower average number of used timeslots due to cell reselections, is modelled correctly. This is carried out by mapping the use of 1 and 2 time slots, as occurs with voice congestion, to the real values x1 and x2 respectively. Note that this mapping gives a larger weight on time intervals for which no slots are available at all (due to cell reselections).
From the above mentioned modified lower layer indicators the download time
for each of the three file sizes (4, 32 and 128 kByte) is predicted by (second
assessment approach) using the following mappings:
- a1 - b1*MOD(UsedTimeslotsDL) + c1*MOD(CodingSchemeDL)
- a2 - b2*MOD(UsedTimeslotsDL) + c2*MOD(CodingSchemeDL)
- a3 - b3*MOD(UsedTimeslotsDL) + c3*MOD(CodingSchemeDL)
The tool allows to further analyse the underlying cause of bad performance
by:
- Checking the prediction difference between the download time derived from the application throughput (first assessment approach) with the download time derived from the lower layer mapping (second assessment approach). A large difference indicates a limitation in the measurement equipment that could not correctly measure the utilisation of the used time slots in downlink (see arrows in Fig. 3).
- Analysing if the main contribution comes from either the MOD(CodingSchemeDL), indicating poor radio performance, or from MOD(UsedTimeslotsDL), indicating voice congestion or cell reselection.
- Analysing the distribution of the number of used timeslots indicator.
When many zero's are present cell reselection dominates the quality,
when the
values 1 and 2 dominate the distribution, voice congestion dominates the quality.
Figure 4 shows an example of the estimated download time of a 4 kByte file
from the download of a large 512 kByte file under bad circumstances using the
lower layer prediction.
The present invention can also be applied for other data transfer types than
the FTP file download as discussed in the example above. Further possible
applications in which end-to-end perceived quality can be determined using the
present invention include, but are not limited to, browsing, streaming audio,
streaming video, chatting etc. For each of the different types of applications,
other (combinations of) performance indicators (direct performance indicator(s)
such as throughput speed, or indirect performance indicator(s) such as number
of used cells, etc (see above)) may be used.
This section deals with the problem of how to interpret the time variant
behaviour for each of the three file sizes (4, 32, 128 kByte, coinciding with the
time scales of 4, 12 and 40 seconds). For the largest file (512 kByte) quality is
measured directly from the download time of the file and time variant behaviour
has to be assessed on the basis of multiple downloads (e.g. 10 downloads as
recommended).
The basic idea in the data interpretation is that the download time has to vary
over more than 25% in order to have a perceptual effect and has to vary by a
factor of two for perceiving a significant degradation. The idea of quality
categorization can be used for both FTP download and browsing. This leads to
the following quality classes using the ITU-T 5 point rating scale.
- % increase in download / browsing time < 25: Excellent quality
- 25 ≤ % increase in download / browsing time < 50: Good quality
- 50 ≤ % increase in download / browsing time < 100: Fair quality
- 100 ≤ % increase in download / browsing time < 200: Poor quality
- % increase in download / browsing time ≥ 200: Bad quality
Using this categorization one can quantify the time variant behaviour of the
network, over the duration of the 512 kByte download, for each of the three file
sizes for FTP download and for the browsing session. If a complete quality
analysis is required one should thus calculate the percentages in each class
(i.e. % excellent, % good, etc.) and use those five numbers to quantify the end-to-end
quality for each of the four file sizes and the browsing session
separately. For quantifying the time variant behaviour on the largest time scale
(>140 s) one has to perform multiple FTP downloads of the 512 kByte file.
A first global quality analysis in the final post processing tool is carried out by
calculating the percentage poor or bad as is commonly used in speech
transmission quality assessment. This percentage is calculated from the lower
layer indicators as well as from the application throughput (see above). This
allows for an easy to interpret small set of quality numbers. For each of the
three FTP download time scales and the single browsing time scale, two quality
numbers in the form of a percentage poor or bad, are thus given. When they
are about the same the degradation is not caused by data congestion, when
they are significantly different data congestions plays an important role.
By a further analysis of the lower layer indicators one can find the cause for
bad performance. When the average MOD(CodingSchemeDL) is high and C/I
is low, then bad radio performance dominates the quality. When the average
MOD(UsedTimeslotsDL) is low then voice congestion or cell reselection
dominates the quality. By checking the distribution of the indicator number of
used timeslots one can distinguish voice congestion from cell reselections.
When many zero's are present cell reselection dominates the quality, when the
values 1 and 2 dominate the distribution, voice congestion dominates the
quality.
For the person skilled in the art, it will be clear that the above exemplary
embodiments are only described for a better understanding. The exemplary
embodiments are not meant to limit the scope of this application, which is
defined by the appended claims.
Claims (13)
- Method for determining a quality indicator for end-to-end data transfer in a wireless data network (1), comprising
measuring at least one system performance indicator using a predefined data transfer type specimen, and
deriving the quality indicator for at least one other data transfer type from the at least one performance indicator. - Method according to claim 1, in which the at least one system performance indicator comprises at least one low level data network performance parameter, and the method further comprises mapping the at least one low level data network performance parameter to the quality indicator.
- Method according to claim 2, in which the mapping is a linear mapping, e.g. a linear two-dimensional mapping.
- Method according to claim 2 or 3, in which the at least one low level data network performance parameter is a modified low level data network performance parameter.
- Method according to claim 4, in which integer values of the at least one low level data network performance parameter are mapped to real values.
- Method according to one of the claims 1 through 5, in which the at least one system performance indicator is the throughput speed, and the quality indicator is derived from the measured throughput speed using a moving window averaging estimation, in which the size of the moving window corresponds to the at least one other data transfer type.
- Method according to one of the claims 2 through 6, in which a final indicator for the at least one other data transfer type.
- Method according to one of the claims 2 through 7, in which the method further comprises the step of analysing the contribution of each of the at least one low level data network performance parameter.
- Method according to one of the claims 1 through 8, in which the predefined data transfer type specimen is a FTP download of a large size data file, e.g. 512 kByte.
- Measurement system for determining a quality indicator for end-to-end data transfer in a wireless data network (1), comprising
a data network analysis system (10) connected to the wireless data network (1) for measuring at least one system performance indicator using a predefined data transfer specimen,
in which the measurement system (10) is further equipped with processing means (2) which are arranged for deriving the quality indicator for at least one other data transfer type from the at least one performance indicator. - Measurement system according to claim 10, in which the processing means (2) are arranged to execute the method according to one of the claims 2 through 9.
- Computer program comprising computer readable software instructions, which when loaded on a computer system, provides the computer system with the functionality of the method according to one of the claims 1 through 9.
- Computer program product comprising a computer program according to claim 12.
Priority Applications (5)
| Application Number | Priority Date | Filing Date | Title |
|---|---|---|---|
| EP03076894A EP1489865A1 (en) | 2003-06-18 | 2003-06-18 | Method and system for analysing data quality measurements in wireless data communication networks |
| US10/558,769 US20070030815A1 (en) | 2003-06-18 | 2004-06-16 | Method and system for analysing data quality measurements in wireless data communication networks |
| JP2006515976A JP2006527937A (en) | 2003-06-18 | 2004-06-16 | Method and system for analyzing data quality measurements in a wireless data communication network |
| PCT/EP2004/006538 WO2004114701A2 (en) | 2003-06-18 | 2004-06-16 | Method and system for analysing data quality measurements in wireless data communication networks |
| EP04739997A EP1656806A2 (en) | 2003-06-18 | 2004-06-16 | Method and system for analysing data quality measurements in wireless data communication networks |
Applications Claiming Priority (1)
| Application Number | Priority Date | Filing Date | Title |
|---|---|---|---|
| EP03076894A EP1489865A1 (en) | 2003-06-18 | 2003-06-18 | Method and system for analysing data quality measurements in wireless data communication networks |
Publications (1)
| Publication Number | Publication Date |
|---|---|
| EP1489865A1 true EP1489865A1 (en) | 2004-12-22 |
Family
ID=33395916
Family Applications (2)
| Application Number | Title | Priority Date | Filing Date |
|---|---|---|---|
| EP03076894A Withdrawn EP1489865A1 (en) | 2003-06-18 | 2003-06-18 | Method and system for analysing data quality measurements in wireless data communication networks |
| EP04739997A Withdrawn EP1656806A2 (en) | 2003-06-18 | 2004-06-16 | Method and system for analysing data quality measurements in wireless data communication networks |
Family Applications After (1)
| Application Number | Title | Priority Date | Filing Date |
|---|---|---|---|
| EP04739997A Withdrawn EP1656806A2 (en) | 2003-06-18 | 2004-06-16 | Method and system for analysing data quality measurements in wireless data communication networks |
Country Status (4)
| Country | Link |
|---|---|
| US (1) | US20070030815A1 (en) |
| EP (2) | EP1489865A1 (en) |
| JP (1) | JP2006527937A (en) |
| WO (1) | WO2004114701A2 (en) |
Cited By (4)
| Publication number | Priority date | Publication date | Assignee | Title |
|---|---|---|---|---|
| EP1679835A1 (en) * | 2005-01-07 | 2006-07-12 | Koninklijke KPN N.V. | Method, device and system for predicting a data session time |
| EP1681884A1 (en) * | 2005-01-13 | 2006-07-19 | LG Electronics Inc. | Apparatus and method for checking performance of wireless data network |
| WO2011115625A1 (en) * | 2010-03-19 | 2011-09-22 | Velocent Systems Incorporated | Method and apparatus pertaining to assessing ordinary end-to-end performance of a mobile data network |
| EP2733872A1 (en) * | 2006-03-03 | 2014-05-21 | KTFreetel Co., Ltd. | Method for measuring quality of wireless network |
Families Citing this family (9)
| Publication number | Priority date | Publication date | Assignee | Title |
|---|---|---|---|---|
| DE602006011557D1 (en) * | 2005-11-07 | 2010-02-25 | Accenture Global Services Gmbh | Network performance management |
| JP2010288116A (en) * | 2009-06-12 | 2010-12-24 | Kddi Corp | Mobile service area quality survey method and program |
| US9210050B2 (en) * | 2009-07-09 | 2015-12-08 | Centurylink Intellectual Property Llc | System and method for a testing vector and associated performance map |
| US9727873B1 (en) * | 2011-02-23 | 2017-08-08 | Amazon Technologies, Inc. | Digital returns |
| JP2013131926A (en) * | 2011-12-21 | 2013-07-04 | Kyocera Corp | Relay device and communication control method |
| US10679140B2 (en) * | 2014-10-06 | 2020-06-09 | Seagate Technology Llc | Dynamically modifying a boundary of a deep learning network |
| US11120377B2 (en) * | 2017-12-29 | 2021-09-14 | The Nielsen Company (Us), Llc | Methods, systems, articles of manufacture and apparatus to calibrate payload information |
| CN114615558A (en) * | 2018-11-22 | 2022-06-10 | 华为技术有限公司 | Method and device for determining network performance bottleneck value and storage medium |
| CN113656292B (en) * | 2021-08-04 | 2022-05-17 | 航天中认软件测评科技(北京)有限责任公司 | Multi-dimensional cross-space-time basic software performance bottleneck detection method |
Family Cites Families (7)
| Publication number | Priority date | Publication date | Assignee | Title |
|---|---|---|---|---|
| JPH1168849A (en) * | 1997-08-12 | 1999-03-09 | Kokusai Denshin Denwa Co Ltd <Kdd> | Traffic generator and method for determining traffic generation function |
| US6775240B1 (en) * | 1999-09-21 | 2004-08-10 | Lucent Technologies Inc. | System and methods for measuring quality of communications over packet networks |
| AU2001285068A1 (en) * | 2000-08-17 | 2002-02-25 | Trendium, Inc. | Methods, systems, and computer program products for managing a service provided by a network |
| US6807156B1 (en) * | 2000-11-07 | 2004-10-19 | Telefonaktiebolaget Lm Ericsson (Publ) | Scalable real-time quality of service monitoring and analysis of service dependent subscriber satisfaction in IP networks |
| JP3769468B2 (en) * | 2001-03-21 | 2006-04-26 | 株式会社エヌ・ティ・ティ・ドコモ | Communication quality control method, communication quality control system, packet analysis device, and data transmission terminal device |
| ES2283387T3 (en) * | 2001-08-09 | 2007-11-01 | Ascom (Schweiz) Ag | ANALYSIS OF A DATA TRANSMISSION SYSTEM. |
| JP3721160B2 (en) * | 2002-11-29 | 2005-11-30 | Necインフロンティア株式会社 | Wireless LAN system, communication terminal, LAN control device, and QoS control method |
-
2003
- 2003-06-18 EP EP03076894A patent/EP1489865A1/en not_active Withdrawn
-
2004
- 2004-06-16 EP EP04739997A patent/EP1656806A2/en not_active Withdrawn
- 2004-06-16 JP JP2006515976A patent/JP2006527937A/en active Pending
- 2004-06-16 US US10/558,769 patent/US20070030815A1/en not_active Abandoned
- 2004-06-16 WO PCT/EP2004/006538 patent/WO2004114701A2/en not_active Ceased
Non-Patent Citations (1)
| Title |
|---|
| No Search * |
Cited By (6)
| Publication number | Priority date | Publication date | Assignee | Title |
|---|---|---|---|---|
| EP1679835A1 (en) * | 2005-01-07 | 2006-07-12 | Koninklijke KPN N.V. | Method, device and system for predicting a data session time |
| WO2006072466A1 (en) * | 2005-01-07 | 2006-07-13 | Koninklijke Kpn N.V. | Method, device and system for predicting a data session time |
| JP2008527812A (en) * | 2005-01-07 | 2008-07-24 | コニンクリーケ・ケイピーエヌ・ナムローゼ・フェンノートシャップ | Method, device, and system for predicting data session time |
| EP1681884A1 (en) * | 2005-01-13 | 2006-07-19 | LG Electronics Inc. | Apparatus and method for checking performance of wireless data network |
| EP2733872A1 (en) * | 2006-03-03 | 2014-05-21 | KTFreetel Co., Ltd. | Method for measuring quality of wireless network |
| WO2011115625A1 (en) * | 2010-03-19 | 2011-09-22 | Velocent Systems Incorporated | Method and apparatus pertaining to assessing ordinary end-to-end performance of a mobile data network |
Also Published As
| Publication number | Publication date |
|---|---|
| US20070030815A1 (en) | 2007-02-08 |
| EP1656806A2 (en) | 2006-05-17 |
| WO2004114701A2 (en) | 2004-12-29 |
| WO2004114701A8 (en) | 2005-02-10 |
| JP2006527937A (en) | 2006-12-07 |
Similar Documents
| Publication | Publication Date | Title |
|---|---|---|
| US7984126B2 (en) | Executable application network impact and load characteristic estimation system | |
| US20070030815A1 (en) | Method and system for analysing data quality measurements in wireless data communication networks | |
| CN111327471B (en) | Network quality analysis method, device, computer equipment and storage medium | |
| CN107786994B (en) | User perception quality difference analysis method and system for end-to-end wireless service | |
| CN104378220A (en) | Method, device, user terminal and network server for evaluating user experience quality | |
| US10979335B2 (en) | Network link performance | |
| EP3593493B1 (en) | Prediction of a performance indicator | |
| CN113207146B (en) | Wireless communication network quality monitoring system and method | |
| US9419872B2 (en) | Method, system, and apparatus for node status detection in distributed system | |
| CN101292459B (en) | Method and apparatus for estimating voice quality | |
| KR101210926B1 (en) | Server, apparatus and method for allocating cost of dynamic routing | |
| JP2003037649A (en) | Content distribution completion time estimation method, recording medium, and program | |
| CN114938339A (en) | Data processing method and related device | |
| US7657388B2 (en) | Quality assessment tool | |
| CN108521435B (en) | Method and system for user network behavior portrayal | |
| CN117202236A (en) | Base station health determination method, device, electronic equipment and storage medium | |
| JP2007036839A (en) | Quality degradation isolation device, isolation system, and isolation method in a packet switching network | |
| US20040162684A1 (en) | Quality assessment tool | |
| KR20050054665A (en) | Apparatus and method for measuring service quality by requirement of customer | |
| US20030031136A1 (en) | Analysis of a data transmission system | |
| JP3747001B2 (en) | Packet switching network quality judgment method and apparatus using test packets | |
| JP5150386B2 (en) | Electromagnetic noise diagnostic device, electromagnetic noise diagnostic system, and electromagnetic noise diagnostic method | |
| CN105517087B (en) | User perceives the method and device of assessment | |
| JP4866376B2 (en) | User experience quality measurement apparatus and user experience quality measurement method | |
| CN119232745B (en) | A data processing method and system based on communication network |
Legal Events
| Date | Code | Title | Description |
|---|---|---|---|
| PUAI | Public reference made under article 153(3) epc to a published international application that has entered the european phase |
Free format text: ORIGINAL CODE: 0009012 |
|
| AK | Designated contracting states |
Kind code of ref document: A1 Designated state(s): AT BE BG CH CY CZ DE DK EE ES FI FR GB GR HU IE IT LI LU MC NL PT RO SE SI SK TR |
|
| AX | Request for extension of the european patent |
Extension state: AL LT LV MK |
|
| 17P | Request for examination filed |
Effective date: 20050622 |
|
| AKX | Designation fees paid |
Designated state(s): AT BE BG CH CY CZ DE DK EE ES FI FR GB GR HU IE IT LI LU MC NL PT RO SE SI SK TR |
|
| STAA | Information on the status of an ep patent application or granted ep patent |
Free format text: STATUS: THE APPLICATION HAS BEEN WITHDRAWN |
|
| 18W | Application withdrawn |
Effective date: 20051114 |