Field of the invention
The present invention relates to a method and a system for measuring the
transmission quality of a system under test, an input signal entered into the system
under test and an output signal resulting from the system under test being processed
and mutually compared.
Prior art
Such a method and system are known from ITU-T recommendation P.862,
"Telephone transmission quality, telephone installations, local line networks - Methods
for objective and subjective assessment of quality - Perceptual evaluation of speech
quality (PESQ), an objective method for end-to-end speech qualtity assessment of
narrow-bank telephone networks and speech codecs", ITU-T 02.2001 [8].
Also, the article by J. Beerends et al. "Perceptual Evaluation of Speech Quality
(PESQ) The New ITU Standard for end-to-end Speech Quality Assessment Part II -
Psychoacoustic Model", J. Audio Eng. Soc., Vol. 50, no. 10, October 2002, describes
such a method and system [9].
A disadvantage is present in the P.862 method and system, as the method and
system applied in the standard quality measurement does not correctly compensate for
large variations in frequency response of the system under test and for large differences
in local power between input and output signal. This may result in a bad correlation
between the scores of perceived quality of speech as provided by the method and
system and the perceived quality of speech as evaluated by test persons.
Summary of the invention
The present invention seeks to provide an improvement of the correlation
between the perceived quality of speech as measured by the P.862 method and system
and the actual quality of speech as perceived by test persons.
According to the present invention, a method according to the preamble defined
above is provided, in which the compensation of linear frequency response and time
varying gain comprises an iterative loop having at least three calculations of
compensations, each calculation comprising one of a calculation of a compensation of
linear frequency response and a calculation of a local power scaling factor.
The present invention is based on the understanding that in certain circumstances
(presence of noise, presence of large frequency response deviations in system under
test) the existing standardized method does not correctly measure the perceived quality
of speech.
If a frequency compensation is calculated in the presence of noise a wrong
estimate of the frequency response function will arise in frequency regions where there
is little energy. If a local temporal scaling factor is calculated on a signal that has
passed through a system which shows large deviations in the frequency response the
local scaling factor cannot be calculated correctly. Both effects have to be calculated
correctly in order to be able to predict the subjectively perceived quality of speech
signals.
A correction may be implemented according to the present invention by replacing
the calculation of a linear frequency compensation and the calculation of a local power
scaling factor by an iterative calculation of the frequency compensation and local
scaling factor. By first calculating a rough estimate of the necessary frequency
compensation, i.e. by not compensating to the amount that one would normally carry
out, one obtains a signal in time from which better estimations can be made regarding
the local temporal scaling factor that is necessary for correctly predicting the final
perceived quality. After this local scaling calculation one obtains a time signal from
which a better estimation can be made for the necessary frequency compensation.
Overall, this will improve the performance of the speech quality prediction using
the method according to the invention. Also, in other circumstances, this adaptation of
the standardized method and system will not have a negative influence in other
circumstances.
The calculation of the local power scaling factor may be implemented as
described in the ITU-T Recommendation P.862, or alternatively as described in the
non-prepublished applicant's European patent application 02075973 [10], which is
included herein by reference.
In a particular advantageous embodiment, the iterative loop comprises a
calculation of a first partial linear frequency compensation and application of the first
partial linear frequency compensation to the pitch power density of the input signal,
followed by a calculation of a local power scaling factor and application of the local
power scaling factor to the pitch power density of the output signal, followed by a
calculation of a second partial linear frequency compensation and application of the
linear frequency compensation to the partially compensated pitch power density of the
input signal. In a further embodiment, the application of the compensations to the pitch
power densities of the input and output signal are interchanged, i.e. the first and second
partial linear frequency compensations are applied to the pitch power density of the
output signal, and the local power scaling factor is applied to the pitch power density of
the input signal. These embodiments require only very little changes to the existing
standardised P.862 method, while improving its performance.
In a further embodiment, the partial linear frequency compensation is a first
estimate which is lower than the linear frequency compensation one would use for
correct evaluation of the linear distortion (as prescribed in e.g. the ITU-T
Recommendation P.862), e.g. 50% of the amplitude correction of the normal linear
frequency compensation. This partial compensation can also be carried out frequency
dependent, e.g. by having limited frequency ranges over which a larger partial
compensation is carried out than over other frequency ranges. One can e.g. only
compensate frequency response compensations as found with close microphone
techniques that result in a low frequency boost below about 500 Hz.
In a second aspect, the present invention relates to a system for measuring the
transmission quality of an audio transmission system as defined in the preamble above,
in which the compensation means comprise an iterative loop having at least three
calculations of a compensation, each calculation comprising one of a calculation of a
compensation of linear frequency response and a calculation of a local power scaling
factor. This system, and the systems as defined in the dependent claims, provides
advantages comparable to the advantages of the method as described above.
Short description of drawings
The present invention will be discussed in more detail below, using a number of
exemplary embodiments, with reference to the attached drawings, in which
Detailed description of exemplary embodiments
Fig. 1 shows schematically a known set-up of an application of an objective
measurement technique which is based on a model of human auditory perception and
cognition, and which follows the ITU-T Recommendation P.862 [8], for estimating the
perceptual quality of speech links or codecs. The acronym used for this technique or
device is PESQ (Perceptual Evaluation of Speech Quality). It comprises a system or
telecommunications network under test 10, hereinafter referred to as system 10 for
briefness' sake, and a quality measurement device 11 for the perceptual analysis of
speech signals offered. A speech signal X0(t) is used, on the one hand, as an input
signal of the system 10 and, on the other hand, as a first input signal X(t) of the device
11. An output signal Y(t) of the system 10, which in fact is the speech signal X0(t)
affected by the system 10, is used as a second input signal of the device 11. An output
signal Q of the device 11 represents an estimate of the perceptual quality of the speech
link through the system 10. Since the input end and the output end of a speech link,
particularly in the event it runs through a telecommunications network, are remote, for
the input signals of the quality measurement device 11 use is made in most cases of
speech signals X(t) stored on data bases. Here, as is customary, speech signal is
understood to mean each sound basically perceptible to the human hearing, such as
speech and tones. The system under test 10 may of course also be a simulation system,
which simulates a telecommunications network. The device 11 carries out a main
processing step which comprises successively, in a pre-processing section 11.1, a step
of pre-processing carried out by pre-processing means 12, in a processing section 11.2,
a further processing step carried by first and second signal processing means 13 and 14,
and, in a signal combining section 11.3, a combined signal processing step carried out
by signal differentiating means 15 and modelling means 16. In the pre-processing step
the signals X(t) and Y(t) are prepared for the step of further processing in the means 13
and 14, the pre-processing including power level scaling and time alignment
operations. The further processing step implies mapping of the (degraded) output signal
Y(t) and the reference signal X(t) on representation signals R(Y) and R(X) according to
a psycho-physical perception model of the human auditory system. During the
combined signal processing step a differential or disturbance signal D is determined by
the differentiating means 15 from said representation signals, which is then processed
by modelling means 16 in accordance with a cognitive model, in which certain
properties of human testees have been modelled, in order to obtain the quality signal Q.
In a first step executed by the PESQ system a series of delays between original
input and degraded output are computed, one for each time interval for which the delay
is significantly different from the previous time interval. For each of these intervals a
corresponding start and stop point is calculated. The alignment algorithm is based on
the principle of comparing the confidence of having two delays in a certain time
interval with the confidence of having a single delay for that interval. The algorithm
can handle delay changes both during silences and during active speech parts.
Based on the set of delays that are found the PESQ system compares the original
(input) signal with the aligned degraded output of the device under test using a
perceptual model. The key to this process is transformation of both the original and the
degraded signals to internal representations (LX, LY), analogous to the psychophysical
representation of audio signals in the human auditory system, taking account of
perceptual frequency (Bark) and loudness (Sone). This is achieved in several stages:
time alignment, level alignment to a calibrated listening level, time-frequency mapping,
frequency warping, and compressive loudness scaling.
The internal representation is processed to take account of effects such as local
gain variations and linear filtering that may - if they are not too severe - have little
perceptual significance. This is achieved by limiting the amount of compensation and
making the compensation lag behind the effect. Thus minor, steady-state differences
between original and degraded are compensated. More severe effects, or rapid
variations, are only partially compensated so that a residual effect remains and
contributes to the overall perceptual disturbance. This allows a small number of quality
indicators to be used to model all subjective effects. In the PESQ system, two error
parameters are computed in the cognitive model; these are combined to give an
objective listening quality MOS (Mean Opinion Score). The basic ideas used in the
PESQ system are described in the bibliography references [1] to [5].
The perceptual model in the prior-art PESQ system
In Fig. 2, a part of an implementation of the device 11 (i.e. the perceptual model
part) is illustrated, comprising in essence the first and second signal processing means
13 and 14, and the differentiating means 15 as described above.
The perceptual model of a PESQ system, shown in figure 2, is used to calculate a
distance between the original and degraded speech signal ("PESQ score"). This may be
passed through a monotonic function to obtain a prediction of a subjective MOS for a
given subjective test. The PESQ score is mapped to a MOS-like scale.
Absolute hearing threshold
The absolute hearing threshold P 0(f) is interpolated to get the values at the center
of the Bark bands that are used. These values are stored in an array and are used in
Zwicker's loudness formula.
The power and loudness scaling factors
There are arbitrary gain constants following the FFT for time-frequency analysis
and in the loudness calculation only meant for calibrating the system
IRS-receive filtering
If it is assumed that the listening tests were carried out using an IRS (intermediate
reference system) receive or a modified IRS receive characteristic in the handset the
necessary filtering to the speech signals is applied in the pre-processing (section 11.1 in
Fig. 1), resulting in signals XIRSS(t) and YIRSS(t).
Computation of the active speech time interval
If the original and degraded speech file start or end with large silent intervals, this
could influence the computation of certain average distortion values over the files.
Therefore, an estimate is made of the silent parts at the beginning and end of these files.
Short term FFT or time frequency decomposition
The human ear performs a time-frequency transformation. In the PESQ system
this is implemented by a short term FFT with overlap between successive time
windows (frames). The power spectra - the sum of the squared real and squared
imaginary parts of the complex FFT components - are stored in separate real valued
arrays for the original and degraded signals. Phase information within a single Hanning
window is discarded in the PESQ system and all calculations are based on only the
power representations PXWIRSS(f)n and PYWIRSS(f)n. The start points of the windows in
the degraded signal are shifted over the delay. The time axis of the original speech
signal is left as is. If the delay increases, parts of the degraded signal are omitted from
the processing, while for decreases in the delay parts are repeated.
Calculation of the pitch power densities
The Bark scale reflects that at low frequencies, the human hearing system has a
finer frequency resolution than at high frequencies. This is implemented by binning
FFT bands and summing the corresponding powers of the FFT bands with a
normalization of the summed parts. The warping function that maps the frequency scale
in Hertz to the pitch scale in Bark does not exactly follow the values given in the
literature. The resulting signals are known as the pitch power densities PPXWIRSS(f)n and
PPYWIRSS(f)n.
Compensation of the original pitch power density (linear frequency response
compensation)
To deal with filtering in the system under test, the power spectrum of the original
and degraded pitch power densities are averaged over time. This average is calculated
over speech active frames only using time-frequency cells whose power is a certain
fraction above the absolute hearing threshold. Per modified Bark bin, a partial
compensation factor is calculated from the ratio of the degraded spectrum to the
original spectrum. The original pitch power density PPXWIRSS(f)n of each frame n is then
multiplied with this partial compensation factor to equalize the original to the degraded
signal. This results in an inversely filtered original pitch power density PPX'WIRSS(f)n
This partial compensation is used because severe filtering can be disturbing to the
listener. The compensation is carried out on the original signal because the degraded
signal is the one that is judged by the subjects in an ACR experiment.
Compensation of the distorted pitch power density (time-varying gain compensation)
Short-term gain variations are partially compensated by processing the pitch
power densities frame by frame (i.e. local compensation). For the original and the
degraded pitch power densities, the sum in each frame n of all values that exceed the
absolute hearing threshold is computed. The ratio of the power in the original and the
degraded files is calculated and bounded to a predetermined range. A first order low
pass filter (along the time axis) is applied to this ratio. The distorted pitch power
density in each frame, n, is then multiplied by this ratio, resulting in the partially gain
compensated distorted pitch power density PPY'WIRSS(f)n.
This partial compensation or calculation of local scaling factor may be
implemented using the embodiment described in the applicant's pending, non-prepublished
European patent application 02075973.4, which is incorporated herein by
reference (see specifically Fig. 3).
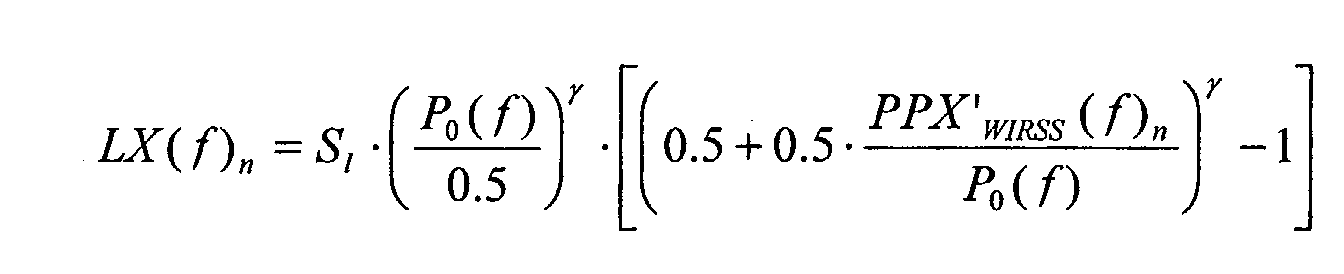
Calculation of the loudness densities
After compensation for filtering and short-term gain variations, the original and
degraded pitch power densities are transformed to a Sone loudness scale using
Zwicker's law [7].
with
P 0(
f) the absolute threshold and
S1 the loudness scaling factor.
Above 4 Bark, the Zwicker power, γ , is 0.23, the value given in the literature. Below 4
Bark, the Zwicker power is increased slightly to account for the so-called recruitment
effect. The resulting two-dimensional arrays
LX(f)n and
LY(f)n are called loudness
densities.
The signed difference between the distorted and original loudness density is
computed. When this difference is positive, components such as noise have been added.
When this difference is negative, components have been omitted from the original
signal. This difference array is called the raw disturbance density.
The minimum of the original and degraded loudness density is computed for each
time frequency cell. These minima are multiplied by 0.25. The corresponding two-dimensional
array is called the mask array. The following rules are applied in each
time-frequency cell:
- If the raw disturbance density is positive and larger than the mask value, the mask
value is subtracted from the raw disturbance.
- If the raw disturbance density lies in between plus and minus the magnitude of the
mask value the disturbance density is set to zero.
- If the raw disturbance density is more negative than minus the mask value, the mask
value is added to the raw disturbance density.
The net effect is that the raw disturbance densities are pulled towards zero. This
represents a dead zone before an actual time frequency cell is perceived as distorted.
This models the process of small differences being inaudible in the presence of loud
signals (masking) in each time-frequency cell. The result is a disturbance density as a
function of time (window number
n) and frequency,
D(f)n.
This perceptual subtraction of the loudness densities LX(f)n and LY(f)n resulting in
the disturbance density D(f)n, may be implemented as described with reference to Fig. 4
of the applicant's pending, non-prepublished European patent application 02075973.4,
which is incorporated herein by reference.
Cell-wise multiplication with an asymmetry factor
The asymmetry effect is caused by the fact that when a codec distorts the input
signal it will in general be very difficult to introduce a new time-frequency component
that integrates with the input signal, and the resulting output signal will thus be
decomposed into two different percepts, the input signal and the distortion, leading to
clearly audible distortion [2]. When the codec leaves out a time-frequency component
the resulting output signal cannot be decomposed in the same way and the distortion is
less objectionable. This effect is modelled by calculating an asymmetrical disturbance
density DA(f)n per frame by multiplication of the disturbance density D(f)n with an
asymmetry factor. This asymmetry factor equals the ratio of the distorted and original
pitch power densities raised to the power of 1.2. If the asymmetry factor is less than 3 it
is set to zero. If it exceeds 12 it is clipped at that value. Thus only those time frequency
cells remain, as non-zero values, for which the degraded pitch power density exceeded
the original pitch power density.
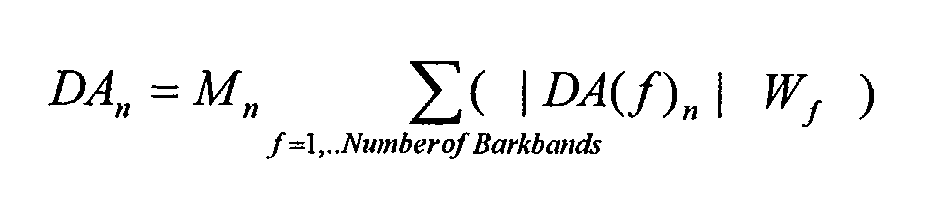
Aggregation of the disturbance densities
The disturbance density
D(f)n and asymmetrical disturbance density
DA(f)n are
integrated (summed) along the frequency axis using two different
Lp norms and a
weighting on soft frames (having low loudness):
with
Mn a multiplication factor,
1/(
power of original frarne plus a constant)0.04,
resulting in an emphasis of the disturbances that occur during silences in the original
speech fragment, and
Wf a series of constants proportional to the width of the modified
Bark bins. After this multiplication the frame disturbance values are limited to a
maximum of 45. These aggregated values,
Dn and
DAn, are called frame disturbances.
If the distorted signal contains a decrease in the delay larger than 16 ms (half a
window) the repeat strategy is modified. It was found to be better to ignore the frame
disturbances during such events in the computation of the objective speech quality. As
a consequence frame disturbances are zeroed when this occurs. The resulting frame
disturbances are called D'n and DA 'n.
Realignment of bad intervals
Consecutive frames with a frame disturbance above a threshold are called bad
intervals. In a minority of cases the objective measure predicts large distortions over a
minimum number of bad frames due to incorrect time delays observed by the
preprocessing. For those so-called bad intervals a new delay value is estimated by
maximizing the cross correlation between the absolute original signal and absolute
degraded signal adjusted according to the delays observed by the preprocessing. When
the maximal cross correlation is below a threshold, it is concluded that the interval is
matching noise against noise and the interval is no longer called bad, and the
processing for that interval is halted. Otherwise, the frame disturbance for the frames
during the bad intervals is recomputed and, if it is smaller replaces the original frame
disturbance. The result is the final frame disturbances D"n and DA"n that are used to
calculate the perceived quality.
Aggregation of the disturbance within split second intervals
Next, the frame disturbance values and the asymmetrical frame disturbance
values are aggregated over split second intervals of 20 frames (accounting for the
overlap of frames: approx. 320 ms) using L6 norms, a higher p value as in the
aggregation over the speech file length. These intervals also overlap 50 per cent and no
window function is used.
Aggregation of the disturbance over the duration of the signal
The split second disturbance values and the asymmetrical split second
disturbance values are aggregated over the active interval of the speech files (the
corresponding frames) now using L2 norms. The higher value of p for the aggregation
within split second intervals as compared to the lowerp value of the aggregation over
the speech file is due to the fact that when parts of the split seconds are distorted that
split second loses meaning, whereas if a first sentence in a speech file is distorted the
quality of other sentences remains intact.
Computation of the PESQ score
The final PESQ score is a linear combination of the average disturbance value
and the average asymmetrical disturbance value.
The above described PESQ method (as prescribed in the ITU-T Recommendation
P.862) has the disadvantage that it can not deal correctly with speech signals with large
differences in frequency response variations. The frequency response variation
compensation and local power scaling compensation are being calculated incorrectly,
resulting in a wrong calculation of the speech quality of a system 10.
The present invention is based on the understanding that if a frequency
compensation is calculated in the presence of noise a wrong estimate of the frequency
response function will arise in frequency regions where there is little energy. If a local
temporal scaling factor is calculated on a signal that has passed through system which
shows large deviations in the frequency response the local scaling factor cannot be
calculated correctly. Both effects have to be calculated correctly in order to be able to
predict the subjectively perceived quality of speech signals.
In Fig. 3, a particular advantageous embodiment of the perceptual model part of
the PESQ method is illustrated, corresponding to the illustration of Fig. 2. However, the
calculation of the linear frequency compensation and the calculation of the local power
scaling factor are different.
The linear frequency response compensation calculation and local power scaling
factor calculation are put in an iterative loop. First, a rough estimate of the necessary
frequency compensation is calculated. Next a partial linear frequency compensation is
calculated which is lower than the linear frequency compensation one would use for
correct evaluation of the linear distortion, e.g. 50% of the amplitude correction of the
normal linear frequency compensation. This partial compensation can also be carried
out by having limited frequency ranges over which a larger partial compensation is
carried out than over other frequency ranges. One can e.g. only compensate frequency
response variations as found with close microphone techniques that result in a low
frequency boost below about 500 Hz.
By not compensating to the amount that one would normally carry out, one
obtains a signal in time PPX'WIRSS(f)n, from which better estimations can be made
regarding the local temporal scaling factor that is necessary for correctly predicting the
final perceived quality. After this local scaling calculation, applied to the degraded
signal PPYWIRSS(f)n one obtains a time signal PPY'WIRSS(f)n from which a better
estimation can be made for the final necessary frequency compensation. The final
frequency compensation (i.e. compensation for the remaining frequency deviations)
applied to the partially compensated signal PPX'WIRSS(f)n results in a final signal
PPX"WIRSS(f)n. The resulting signals PPY'WIRSS(f)n and PPX"WIRSS(f)n, are then further
processed as described above (warping to loudness scale and subsequent steps).
For the person skilled in the art, it will be clear that further modifications can be
made to the present embodiment. The amount of partial compensation can be adapted
to the experimental context. Also it is possible to first calculate and apply a partial
local power scaling factor compensation, then calculate and apply the linear frequency
response compensation and finally calculate and apply a final local power scaling
factor. Also it is within the scope of the present invention to use more than three substeps
in the iterative calculation steps.
References incorporated herein by reference
[1] BEERENDS (J.G.), STEMERDINK (J.A.): A Perceptual Speech-Quality
Measure Based on a Psychoacoustic Sound Representation, J. Audio Eng. Soc., Vol. 42,
No. 3, pp. 115-123, March 1994.
[2] BEERENDS (J.G.): Modelling Cognitive Effects that Play a Role in the
Perception of Speech Quality, Speech Quality Assessment, Workshop papers, Bochum,
pp. 1-9, November 1994.
[3] BEERENDS (J.G.): Measuring the quality of speech and music codecs, an
integrated psychoacoustic approach, 98th AES Convention, pre-print No. 3945, 1995.
[4] HOLLIER (M.P.), HAWKSFORD (M.O.), GUARD (D.R.): Error activity and
error entropy as a measure of psychoacoustic significance in the perceptual domain,
IEE Proceedings - Vision, Image and Signal Processing, 141 (3), 203-208, June 1994.
[5] RIX (A.W.), REYNOLDS (R.), HOLLIER (M.P.): Perceptual measurement of
end-to-end speech quality over audio and packet-based networks, 106th AES
Convention, pre-print No. 4873, May 1999.
[6] HOLLIER (M.P.), HAWKSFORD (M.O.), GUARD (D.R.), Characterisation of
communications systems using a speech-like test stimulus, Journal of the AES, 41 (12),
1008-1021, December 1993.
[7] ZWICKER (Feldtkeller): Das Ohr als Nachrichtenempfänger, S. Hirzel Verlag,
Stuttgart, 1967.
[8] ITU-T recommendation P.862, "Perceptual evaluation of speech quality (PESQ),
an objective method for en-to-end speech qualtity assessment of narrow-band telephone
networks and speech codecs", ITU-T 02.2001
[9] BEERENDS (J.G.); HEKSTRA (A.P.); RIX (A.W.); HOLLIER (M.P.),
Perceptual Evaluation of Speech Quality (PESQ) The New ITU Standard for ENd-to-End
Speech Quality Assessment Part II - Psychoacoustic Model, J. Audio Eng. Soc.,
Vol. 50, no. 10, October 2002.
[10] European patent application EP02075973, Koninklijke KPN N.V.