CROSS REFERENCE TO RELATED APPLICATIONS
-
This patent application is related to simultaneously filed European Patent
Application No. (Agent's Ref: J00046341 EP) and
corresponding U.S. Patent Application No. 10/374,914, filed 25 February, 2003,
both entitled METHOD OF CONSTRAINTS CONTROL FOR OSCILLOSCOPE-TIMEBASE
SUBSECTION AND DISPLAY PARAMETERS, which are
incorporated herein by reference in their entirety.
FIELD OF THE INVENTION:
-
The invention relates generally to signal acquisition systems and, more
particularly, to a method and apparatus for providing constraint control of
vertical display parameters.
BACKGROUND OF THE INVENTION
-
Signal acquisition devices such as digital storage oscilloscopes (DSOs)
use a display grid that is fixed at eight divisions vertically by ten divisions
horizontally. The eight by ten division grid is the same size as the grids initially
etched into the glass of the cathode ray tube (CRT) such as provided by the
earlier analog oscilloscopes. The eight by ten division grid has lingered despite
the fact that most engineering applications requiring the graphing of data are
not limited to an eight by ten graticule. That is, in virtually all disciplines of
science, data is typically graphed with scales that provide an appearance
adapted for ease of interpreting the data. One disadvantage of the current
standard oscilloscope approach is that as data is zoomed on the display, the
graticules are still fixed as eight by ten rather than providing a constant frame of
reference to the acquired waveform parameters.
SUMMARY OF INVENTION
-
These and other deficiencies of the prior art are addressed by the
present invention of a method and apparatus for constraining vertical
parameters such as Volts per division and resolution, such that data may be
presented in a more useful manner (i.e., having an appropriate scale and/or
graticule for ease of data interpretation).
-
An apparatus according to one embodiment of the invention comprises: a
signal acquisition device, for constraining a signal under test (SUT) according to
an amplitude range parameter and generating a stream of acquired samples
representing a constrained SUT; and a controller, for generating a display signal
suitable for use by a display device and including constrained SUT waveform
imagery visually cooperating with amplitude segment delineators; the controller,
in a first mode of operation, adapting a number of amplitude segment
delineators in response to the amplitude range parameter.
BRIEF DESCRIPTION OF THE DRAWINGS
-
The teachings of the present invention can be readily understood by
considering the following detailed description in conjunction with the
accompanying drawings, in which:
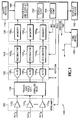
- FIG. 1 depicts a high level block diagram of a signal acquisition system
according to an embodiment of the present invention;
- FIG. 2 depicts a high level block diagram of a processing and display
controller suitable for use in the signal acquisition system of FIG. 1;
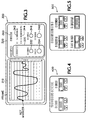
- FIGS. 3-5 depict user interface screens suitable for use in an
embodiment of the present invention;
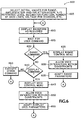
- FIG. 6 depicts a flow diagram of a method according to an embodiment
of the invention; and
- FIGS. 7A-7E depict graphical representations of waveforms useful in
understanding the present invention.
-
-
To facilitate understanding, identical reference numerals have been
used, where possible, to designate identical elements that are common to the
figures.
DETAILED DESCRIPTION OF THE INVENTION
-
The subject invention will be described within the context of a signal
acquisition device such as a digital signal oscilloscope (DSO). However, it will
be appreciated that the subject invention has applicability to other signal
acquisition devices and, more particularly, those signal acquisition devices or
display devices providing time-based display of acquired data or other
information.
-
The invention enables the management amplitude parameters in
conjunction with display parameters in a manner facilitating both control and
ease of use. The invention as applied to, for example, a DSO enables more
intuitive user interaction and simplified maintenance and design of the DSO.
-
The invention implements a Volts per division control system which
operates differently in each of two modes. In a first mode, display grids are
locked to the waveform. In a second mode, display grids are locked to the
display frame.
-
FIG. 1 depicts a high level block diagram of a signal acquisition system
according to an embodiment of the present invention. Specifically, the system
100 of FIG. 1 receives a plurality of input signals under test (SUT) denoted as
signals under test SUT1 - SUTN (collectively signals under test SUT).
-
The system 100 of FIG. 1 comprises a plurality of preliminary amplifiers
1101 - 110N (collectively preliminary amplifiers 110), a track and hold circuit 120,
a plurality of analog-to-digital (A/D) converters 1301 - 130N (collectively A/D
converters 130), a plurality of decimators 1401 - 140N (collectively decimators
140), a plurality of acquisition memories 1501 150N (collectively acquisition
memory 150), a processing and display controller 160, an input device 170, a
timebase 180 and a display device 190. It is noted that the system 100 of FIG.
1 implements N input channels, where N is an integer, though a single channel
may also be implemented within the context of the present invention.
-
Each of N input channels receives a respective signal under test SUT,
which SUT is then amplified by a respective preamp 110 and processed by the
track and hold circuit 120. The track and hold circuit 120, illustratively an
analog multiplexer, holds each SUT steady for a period of time sufficient to
enable acquisition by a respective A/D converter 130.
-
The preamps 110 are responsive to a preamp control signal PAC
provided by the processing and display controller 160 to perform any or all of an
attenuation function, an amplification function, a range adjust function and a
range offset function. In one mode of operation, the preamp control signal PAC
causes the preamps 110 to amplify their respective signals under test to levels
sufficient to utilize substantially all of the dynamic range of their corresponding
A/D converters. In other modes of operation, such as discussed in more detail
below with respect to the vertical control aspects of the present invention, the
preamps 110 are caused to amplify their respective signals under test to
normalize or otherwise conform subsequent acquired sample streams to a
desired vertical parameter.
-
The A/D converters 130 receive and digitize their respective signals
under test in response to a sample clock signal S produced by the timebase
180 to produce thereby respective sample streams. The sample clock signal S
is preferably a clock signal adapted to cause the A/D converters 130 to operate
at a maximum sampling rate, though other sampling rates may be selected.
The timebase 180 is responsive to a timebase control signal TBC produced by
the controller 160 to change frequency and/or pulse width parameters
associated with the sample clock signal S. Optionally, the A/D converters 130
include a controllable Voltage reference source (not shown) that produces a
Voltage reference used by the A/D converter 130 to establish the full scale
Voltage range of the input signal range (i.e., the Voltage level of the signal
provided by the preamp 110 causing a maximum digital output from the A/D
converter). The controllable Voltage reference source is controlled by a signal
REFCON produced by the processing and display controller 160. By
decreasing the reference voltage level utilized by the A/D converter, the
magnitude of the SUT producing the maximum magnitude output sample is
reduced. Similarly, by increasing the reference voltage level utilized by the A/D
converter, the magnitude of the SUT producing the maximum magnitude output
sample is increased.
-
The sample streams produced by the A/D converters 130 are coupled to
respective decimators 140. Each decimator 140 processes its received
digitized signal under test according to a respective processing algorithm or
decimation mode, such as a sub-sampling mode, a peak detection mode (e.g.,
min-max detection), a high resolution mode (e.g., a box-car averaging mode) or
other mathematical function, algorithm or mode. The mode of operation of each
decimator 140 may be preprogrammed such as with an application specific
integrated circuit (ASIC) or field programmable gate array (FPGA), or may be
programmed "on the fly" in response to a decimator control signal DC produced
by the processing and display controller 160. The decimators 140 may utilize
different respective functions, the same respective functions or a combination
thereof.
-
The decimators 140 process respective received sample streams to
produce respective decimated sample streams in response to respective
received sample streams. For example, in response to receiving a digital
sample stream from first A/D converter 1301, first decimator 1401, produces a
corresponding decimated sample stream. The decimated sample streams
produced by the decimators 140 are stored in corresponding portions of
acquisition memory 150. The acquisition memory 150 may be a contiguous or
non-contiguous memory and may, optionally, allocate respective portions to the
respective decimators 140.
-
The processing and display controller 160 is used to manage the various
operations of the signal acquisition system 100. The processing and display
controller 160 performs various processing and analysis operations on the data
samples stored within the acquisition memory 150. An embodiment of the
processing and display controller 160 will be described in more detail below with
respect to FIG. 2.
-
The processing and display controller 160 receives user commands via
the input device 170, illustratively a keypad or pointing device. The processing
and display controller 160 provides image-related data to the display device
190, illustratively a cathode ray tube (CRT), liquid crystal display (LCD) or other
display device. The display device 190 may also comprises a touch screen
device such that the display device 190 provides both user input and user
output functionality. This touch screen embodiment is especially useful within
the context of user interface functionality described in more detail below.
-
The processing and display controller 160 includes a horizontal control
function 162 and a vertical control function 164. The horizontal control function
162 adapts and/or constrains horizontal display parameters (i.e., signal time
parameters) of waveforms presented via the display device 190. The vertical
control function 164 adapts and/or constrains vertical display parameters (i.e.,
signal amplitude parameters) of waveforms presented via the display device
190. The horizontal and vertical control functions will be discussed in more
detail below with respect to FIGS. 2-6.
-
Within the context of the present invention, the various operations
described herein may be conceptualized as producing a display signal suitable
for use by a display device wherein imagery associated with multiple layers is
provided. Specifically, a waveform layer may include waveform image data, a
control layer may include control image data and a grid layer may include grid
image data. In one embodiment of the invention, the control and grid layer
information are combined within a single layer. In another embodiment, a single
image layer is used to represent all information including waveform, control and
grid information.
-
FIG. 2 depicts a high level block diagram of a controller suitable for use
in the signal acquisition system 100 of FIG. 1. Specifically, the controller 200 of
FIG. 2 may be employed to implement functions of the processing and display
controller 160. The controller 200 may also be used to implement various
functions within the system 100 of FIG. 1 in which software and/or firmware
functionality is described.
-
The controller 200 of FIG. 2 comprises a processor 230 as well as
memory 240 for storing various control programs and other programs 244 and
data 246. The memory 240 may also store an operating system 242 supporting
the programs 244, such as the Windows® operating system manufactured by
Microsoft Corporation of Redmond, Washington. Other operating systems,
frameworks and environments suitable for performing the tasks described
herein will also be appreciated by those skilled in the art and informed by the
teachings of the present invention. For example, the various operating systems
utilized by Apple Computer Corporation of Cupertino, California and the various
Unix-derived operating systems may also be utilized within the context of the
present invention.
-
The processing 230 cooperates with conventional support circuitry such
as power supplies, clock circuits, cache memory and the like as well as circuits
that assist in executing the software routines stored in the memory 240. As
such, it is contemplated that some of the steps discussed herein as software
processes may be implemented within hardware, for example as circuitry that
cooperates with the processor 230 to perform various steps. The controller 200
also contains input/output (I/O) circuitry 210 that forms an interface between the
various functional elements communicating with the controller 200. Although
the controller 200 is depicted as a general purpose computer that is
programmed to perform various control functions in accordance with the present
invention, the invention can be implemented in hardware as, for example, an
application specific integrated circuit (ASIC) or field programmable gate array
(FPGA). As such, the process steps described herein are intended to be
broadly interpreted as being equivalently performed by software, hardware or a
combination thereof.
-
The programs 244 stored within the memory 240 may include programs
adapted to implement the horizontal control function 162 and vertical control
function 164 provided by the processing and display controller 160. The
programs 244 may also include programs adapted to provide the various user
interface functions, system control functions and display/image modification
functions discussed herein.
-
The signal acquisition system 100 of FIG. 1 generally receives signals
under test (SUT) which are digitized, decimated and subsequently processed to
derive respective waveforms for display. The displayed waveforms have
associated with them a horizontal parameter and vertical parameter. The
horizontal parameter comprises a time parameter while the vertical parameter
comprises an amplitude parameter. Control circuitry is responsive to user
inputs to adjust the timebase (i.e., time per horizontal division) and amplitude
(i.e., Volts per vertical division) of displayed waveform(s). That is, in an
oscilloscope having a display device including a grid pattern, a user may select
the number of Volts represented by each vertical segment and the amount of
time represented by each horizontal segment.
-
Within the context of the present invention, a vertical channel range
parameter is controlled via a user interface. The vertical channel range
parameter specifies a usable Voltage range of a vertical amplifier and A/D
converter within a particular channel. The vertical channel range parameter,
when adjusted, changes input channel attenuation and/or gain settings of a
vertical amplifier. For example, within the system 100 of FIG. 1, the preamplifier
control signal (PAC) provided by the processing and display controller 160 may
be used to adapt preamplifier gain settings to attenuate and/or increase a gain
function imparted to a received signal under test. Unlike the known vertical
scale control, the vertical channel range parameter is not coupled to a fixed
display graticule. For example, vertical scale controls on current DSOs are
typically provided in units of Volts per division, which assumes a fixed display
grid. By contrast, where a variable or controllable display grid is provided in
accordance with the present invention, the vertical range control is specified in
units of Volts, amps, ohms or whatever unit is appropriate for the SUT and input
probe providing the SUT. The vertical range is the maximum peak-to-peak
signal that the vertical channel can pass without clipping. Volts per division in
this case depends upon the number of display divisions distributed over the
vertical range.
-
The vertical channel offset parameter controls where a zero reference is
located within the specified vertical range. Thus, the vertical channel offset
parameter controls the vertical position of an input waveform within the range of
the A/D converter processing the corresponding SUT.
-
A display frame is a region on a display screen that bounds the region in
which an acquired waveform will be displayed along with its graticules. The
vertical range of an acquired signal is preferably displayed over the full vertical
height of the display frame when a zoom mode of operation is not active.
Derived waveforms such as mathematical functions or reference waveforms
have their respective vertical scale and offset parameters specified with respect
to the vertical frame and number of grids that are in use. The scale for a display
readout is preferably specified as units per division. The vertical height of the
display frame will be referred to herein as the vertical display range.
Additionally, there may be any number of display frames in effect
simultaneously on the display, which display frames may be of various sizes
and proportions.
-
Derived waveforms such as mathematically derived waveforms based
upon acquired signals under test are displayed within the frame according to
user specified range and offset parameters. In this case, range does not mean
a maximum clipping range; rather, in this case range means that a user has
selected a vertical range of the mathematical function that will fit within the
vertical range of the display frame.
-
A display parameter "vertical units per division" within the present
invention results in the vertical gain remaining constant while the distance
between vertical grids and the number of grids that cover a vertical frame
changes. That is, the vertical grids which are delineated by horizontal lines
increase or decrease in relative distance to each other in response to the
vertical units per division control. A user may change the vertical gain of an
input channel using the vertical range control while maintaining a constant
Voltage per division on the display device. There are several ways to control
the vertical units per division; namely: (1) choose the vertical units per division
from a conventional list of 1-2-5 sequences of "nice" values; (2) allow any
arbitrary value to be assigned via the input device; and (3) allow the user to
specify how many vertical grid lines will be caused to fit within the vertical range
of the display frame. For the first two methods, the grids are preferably locked
to constant reference points with respect to the display waveform. For the third
method, the grids are preferably locked with respect to the frame to provide
operation similar to that of a conventional oscilloscope display.
-
The present invention allows for the display of multiple waveforms having
different scales within one frame. In one embodiment, multiple waveforms
having different scales are plotted in the same display frame along with
respective different display grids. When a waveform is selected, the grids for
that waveform are also displayed, which is somewhat analogous to the current
DSO behavior wherein graticule scale readout numbers are for a currently
displayed waveform.
-
A vertical grid offset parameter specifies the position of vertical grid lines
with respect to the waveform vertical reference marker. Thus, the vertical grid
offset causes the display grids to move vertically while the waveform and a
frame remain fixed in a position on the display. The vertical grid offset
parameter is not appropriate for the third mode of operation discussed above
wherein grids are fixed with respect to the frame.
-
FIG. 3 depicts a user interface suitable for use in an embodiment of the
present invention. The user interface 300 of FIG. 3 is suitable for display on, for
example, a touch screen display device such as discussed above with respect
to FIG. 1. That is, the objects displayed within the context of the user interface
(and its submenus) are optionally responsive to direct user manipulation to
provide the various functionality described herein.
-
The user interface 300 of FIG. 3 comprises a waveform display region
310 and a control region 320. The waveform display region 310 displays one or
more waveforms for a peak-to-peak amplitude or range that is controlled by the
user. The waveform display region 310 is depicted as comprising a plurality of
horizontal lines delineating discrete portions of the vertical display range. A
Volts (or other unit) per division parameter is represented by the portion of
range between adjacent horizontal lines. Also shown in the waveform display
region 310 is a reference marker which indicates the point within the displayable
range at which an initial vertical grid delineator is located. While not shown,
vertical lines delineating a time per division parameter are normally displayed
with the horizontal lines to form thereby a display grid. The acquired waveforms
are nominally fit to the width of the waveform display region 310. The acquired
waveforms are displayed with a duration parameter and range parameter
adapted to fit, respectively, the width and height of the display frame when a
zoom mode is off.
-
The control region 320 comprises a horizontal signal acquisition control
region 330 and a display control region 340. The display control region 340
comprises a grid lock to waveform (GRID LOCK WFM) control 342, a grid lock
to frame control 344, a position control 346 and a units per division control 348.
The grid lock to waveform control 342, when enabled, places the signal
acquisition device in a first mode of operation wherein the grid lines delineating
the Volts per division parameter are locked to waveform such that an increase
in the range parameter results in an increase in the number of such grid lines.
The grid lock to frame control 344, when enabled, places the signal acquisition
device in a second mode of operation wherein the horizontal grid lines
delineating the Volts per division parameter are locked to the display frame
such that increases in the range parameter do not result in an increase in such
grid lines. The position control 346 enables adjustments in Voltage or offsets of
the displayed waveform. Such Voltage offsets are especially useful in aligning
portions of interest of a displayed waveform to grid lines to assist a user in
analyzing the waveform. The units per division control 348 is used to adjust the
displayed Volts per division parameter.
-
The vertical signal control region 330 includes a position control 332 and
a range control 334. The position control 332 is used to control a vertical grid
offset parameter to increase or decrease the vertical offset of the displayed
waveform from a nominal position. The actual position of the initial portion of
the displayed waveform within the display frame is indicated by the reference
marker within the waveform display region 310. The range control 334
determines the vertical range of the signals under test processed to generate
the displayed waveform. The vertical range control 334 may cause
amplification or attenuation of the signal under test via the preamplifier 110,
amplification or attenuation of the signal under test by changing the reference
Voltages used by the A/D converters 130 and/or amplification or attenuation of
the signals under test using the processing capabilities within the decimators
140.
-
In a first mode of operation, the grid lines are locked to the waveform. In
this mode of operation, adjusting a "Volts per division" parameter results in the
number of grids that cover an acquired waveform range to be variable. The
-
In the first mode of operation, the grid lines are locked to the waveform.
In this mode of operation, adjusting a "Volts per division" parameter results in
the number of grids that cover an acquired waveform range to be variable. The
grids locked to the waveform mode of operation is invoked by a user selecting
the "on" position of the grid lock WFM control 342. An advantage of using this
control is that constraints on the range parameter imposed by requirements for
specific values of Volts per division on the screen are relieved. Thus, the user
may now change the vertical range while maintaining a constant Volts per
division on the display, which was not possible with previous oscilloscope range
and display constraint controls. In this manner, better control of the range
parameter is provided in order to bring more signal range on screen while the
number of grids increases as the time per grid is kept constant.
-
Preferably, the reference grid is drawn at the reference marker position
when a "grid offset" or position control is set to zero. All other vertical grids
delineated by horizontal lines are spaced with respect to this reference grid
position. Adjusting the position control moves the grids with respect to the
reference marker position. When a display zoom function is used, the grids
scale along with the waveform and maintain their same relationship with respect
to the waveform. Volts per division is then specified in exact 1-2-5 sequences
when incrementing with a knob such as units per division control 348.
However, it will be appreciated that the user may also enter Volts per division
information through other devices such as a keypad or pointing device.
-
In the second mode of operation, the grids are locked to the display
frame. In this mode of operation, adjusting a "Volts per division" parameter
does not change the number of grids that cover an acquired waveform range.
This mode of operation is invoked by, for example, a user selecting the "on"
position for the grid lock frame control 344. This mode allows the user to have
a view of the waveform similar to current oscilloscopes but with some additional
capability. Specifically, in this second mode of operation, the vertical grid lines
drawn horizontally are fixed with respect to the display frame. The difference is
that the user is not limited to always having eight or ten divisions as with current
oscilloscopes; rather, users may choose any number of grid lines and/or the
Volts per division between grid lines. It is noted that adjusting the Volts per
division parameter will not change the acquisition parameters. The Volts per
division parameter is a display grid control, not an acquisition parameter control.
Only the range control will result in a change to acquisition parameters.
-
There are several techniques contemplated by the inventor for specifying
the Volts per division (which determines the number of displayed vertical grids).
In a first technique, the number of horizontal grid lines to be drawn is specified
directly by the user. This first technique in conjunction with the range selection
determines the Volts per division readout. When fixing the number of grid lines
using this first technique, the Volts per division values are used to divide the
range. That is, the conventional 1-2-5 values common on oscilloscopes will not
necessarily be the Volts per division values selected using this technique. In a
second technique, the number of grids is specified by entering a specific time
per division number. In this manner, very "nice" or conventional time per
division grid values are attained. These grid values may comprise the
conventional 1-2-5 values, or may comprise any other values desired by a user.
Given this method of entry, the number of grids fixed to a frame is determined
by the current range and the requested Volts per division.
-
FIG. 4 depicts an exemplary user interface organization of range
controls. The vertical channel submenu 400 of FIG. 4 may be invoked by
selecting one of the controls within the vertical signal control region 330 of the
user interface 300 of FIG. 3. The vertical channel submenu 400 of FIG. 4 may
also be selected directly or accessed via a remote computing device.
Specifically, the vertical channel control interface 400 of FIG. 4 enables user
selection of range and offset parameters.
-
A selected range display object displays a currently selected range
(illustratively 10.0 Volts). Increment and decrement objects proximate the range
display object may be used to increment or decrement the selected range. As
previously noted, incrementing or decrementing the selected range comprises
amplifying or attenuating a received SUT or modifying the reference Voltage of
the corresponding A/D converter.
-
A selected offset display object displays a currently selected offset
(illustratively 0.0 Volts). Increment and decrement objects proximate the offset
display object may be used to increment or decrement the offset.
-
FIG. 5 depicts an exemplary user interface organization of vertical grid
controls. Specifically, the vertical grid control interface 500 of FIG. 5 enables
user selection of Volts per division, grid position, number of grids and grid lock
mode.
-
A selected position or offset display object displays the grid position
(illustratively 0.0 Volts) as offset from a reference position (illustratively a first or
origin grid delineation, center of frame position or edge of frame position).
Increment and decrement objects proximate the position display object may be
used to increase or decrease the Voltage offset of the grid from the reference
position.
-
A selected Volts per division display object displays a currently selected
Volts per division (illustratively 1.0 Volts). Increment and decrement objects
proximate the Volts per division display object may be used to increment or
decrement the selected Volts per division associated with each vertical division.
-
A selected number of grids display object is used to display the presently
selected number of grids (illustratively 10). Increment and decrement objects
proximate the grid number display object may be used to increment or
decrement the selected number of grids.
-
A grid lock mode indicator object is used to display the presently selected
grid lock mode (illustratively WAVEFORM). As previously noted, the grid may
be locked to a waveform (via control 342) or locked to a frame (via control 344).
The grid may also remain unlocked.
-
FIG. 6 depicts a flow diagram of a method according to an embodiment
of the invention. The method 600 of FIG. 6 is suitable for use in the signal
acquisition system 100 of FIG. 1 to provide to a user control functionality in
accordance with the present invention. Specifically, the method 600 of FIG. 6 is
entered at step 605 where initial values for range, amplification and/or
attenuation, A/D reference level, decimator function, number of grid lines,
Voltage per division and the like are selected. Step 605 may be implemented
as, for example, a portion of an automatic triggering or setup routine adapted for
initially acquiring a signal under test. Step 605 may also be implemented by
selecting default values or utilizing the most recent values.
-
At step 610, the waveform as acquired is displayed. That is, at step 610
the waveform(s) associated with one or more acquired signals under test are
displayed utilizing range parameters and grid display parameters initially
selected at step 605 or subsequently modified as discussed below with respect
to steps 615-660.
-
At step 615, the method waits for a user command. Upon receiving a
user command, at step 620 a determination is made as to whether the received
user command comprises a range command. If the command is not a range
command, then at step 640 the method determines whether the user command
comprises a display command. If the user command is not a timebase
command or display command, then at step 660 the method executes some
other command (e.g., screen intensity, system setup, system configuration and
the like) and returns to step 610.
-
In the case of a range command, at step 625 a range control menu is
displayed. That is, at step 625 a user interface such as the range control menu
discussed above with respect to FIG. 4 is displayed for user interaction. At step
630, the method allows user interaction with the range control menu within the
various constraints discussed above. Upon the conclusion of user interaction at
step 630, the method at step 635 adapts the various range parameters of the
acquisition system 100 to those at step 630. The method then returns to step
610 to display the waveform(s) as acquired according to the new range
parameters.
-
In the case of a display command, at step 645 a user interface such as
the display control menu discussed above with respect to FIG. 5 is displayed for
user interaction. At step 650, the method allows user interaction with the
display control menu within the various constraints discussed above. Upon
conclusion of the user interaction at step 650, the method at step 655 adapts
the various display parameters of the acquisition system 100 to those selected
at step 650. The method then returns to step 610 to display the waveform(s) as
acquired according to the new display parameters.
-
The following examples demonstrate how control of the various
parameters affects the waveform, frame and grid display. These are cases
where the grids are fixed with respect to the horizontal trigger position and are
independent of the display frame (i.e., the grids are locked to the waveform).
-
In a grid lock to frame mode of operation, the vertical grid lines are fixed
in position with respect to the display frame. A user may specify the number of
grids to be drawn within the frame. Therefore, the distance from the top to
bottom of the frame is determined by the vertical range control, which control
adjusts the channel gain as previously discussed. The Voltage per division of
the display is then determined by the number of grids specified to be within the
frame. If the user specifies eight grid lines, then the display in this mode of
operation will look similar to that of a standard oscilloscope. The user may
adjust the units per division control to specify an exact 1-2-5 sequence of
choices. The user may also specify any arbitrary units per division. Adjusting
units per division will not change the gain of the vertical channel; rather, such
adjustment only affects the grids within the display frame.
-
In a grid lock to waveform mode of operation, the vertical display grids
are locked with respect to the waveform and not to the display frame. The
reference grid line is drawn horizontally at the position of the waveform ground
reference marker. Remaining grids are drawn with a spacing from the
reference grid marker that is determined by the grid scale (i.e., the units per
division such as Volts per division, amps per division, ohms per division and the
like). The grid lock to waveform mode of operation will be visually depicted
below with respect to FIGS. 7A-7E.
-
FIG. 7A depicts an exemplary display of a sine wave function displayed
at a range (R) of 1.0 Volts and a Voltage per division V/d of 0.1 Volts per
division. It can be seen that the 1.0 Voltage range is divided into ten 0.1 Volt
divisions.
-
FIG. 7B depicts the sine wave function display of FIG. 7A after user
adjustment of the vertical range control to select a setting of 2.0 Volts. That is,
FIG. 7B depicts the sine wave function of FIG. 7A displayed at a range (R) of
2.0 Volts and a Volts per division V/d of 0.1 Volts per division. It can be seen
that the 2 Volt vertical range is divided into twenty 0.1 Volt segments.
-
FIG. 7C depicts an exemplary display of the sine wave function of FIG.
7A that is displayed at a range (R) of 2.0 Volts and a Volts per division (t/d) of
0.2 Volts per division. The display of FIG. 7C is the result of user manipulation
during the display of FIG. 7B in which the vertical range was left set to 2.0 Volts,
but the Volts per division parameter was set to 0.2 Volts per division, thereby
reducing the number of delineated grids by a factor of 2. It should be noted that
the sine wave presented in each of the display diagrams of FIGS. 7A-7C begins
at a location of 0 Volts (i.e., the reference grid is located at the center of the
range).
-
FIG. 7D depicts an exemplary display of the sine wave function of FIG.
7A that is displayed at a range (R) of 2.0 Volts, a Volts per division (V/d) of 0.4
Volts per division, and a vertical offset (OFF) of 0.15 Volts. It will be noted that
the peak-to-peak height of the waveform does not change between FIGS. 7C
and 7D, though the number of grids is reduced by half (due to doubling of the
Voltage per division) and the entire waveform and grids are offset in the frame
by 0.15 Volts due to user adjustment of the vertical offset parameter.
-
FIG. 7E depicts an exemplary display of the sine wave function of FIG.
7A that is displayed at a range (R) of 1.0 Volts, a Volts per division (V/d) of 0.4
Volts per division and an offset (OFF) of 0.15 Volts. It will be noted that the
waveform displayed at FIG. 7E has a peak-to-peak size double that of the
waveform displayed in FIG. 7D due to changing the vertical range from 2.0
Volts to 1.0 Volts. Moreover, since the Volts per division control was left
constant, there are less grids displayed on the display frame. Finally, since the
vertical offset is still at 0.15 Volts, the waveform reference marker and zero grid
line move with respect to the frame.
-
The above-described invention advantageously provides a means to
unify the control of primary vertical acquisition parameters such as amplifier
gain or attenuation, A/D converter reference value and decimator function in
terms of higher level user interface parameters of range and offset, as well as in
terms of the display parameters of units per division or number of grids. When
the grids are locked to the waveform, they will scale with the waveform when a
zoom function is in use. The invention operates to relieve design constraints on
oscilloscope or other signal acquisition device designers to allow a much larger
choice of possible input channel ranges within the oscilloscope or signal
acquisition system vertical control circuitry while still allowing for a relatively
straight forward implementation of the improved vertical control and display
model represented by the range and offset controls discussed herein.
-
The invention provides to a user a new and more meaningful gain control
unit for acquisition channels that is decoupled from the display parameters.
Specifically, the gain is specified in terms of a new parameter denoted as the
vertical range that represents the peak-to-peak Voltage that an input channel
can provide at its output into acquisition memory. The specification of gain is no
longer ambiguous as it is within current oscilloscopes within the marketplace
(e.g., with current DSOs it is necessary to know that the vertical channel range
is fixed over some specified number of divisions when zoom is off to determine
what the range is). Moreover, when zoom mode is active in current
oscilloscopes, the zoom scale factor must be included to calculate the range.
By contrast, in the present invention the range may be directly specified via the
user interface control and is denoted as vertical range, which reads out in the
menu directly.
-
In addition, the invention provides increased flexibility in the manner in
which vertical grids are controlled on the display. The user may specify any
number of vertical grids that are fixed with respect to the frame, not just eight as
is now the current practice. In addition, the new model allows for the novel
approach of letting a user specify Volts per division for grids that are fixed in
position with respect to a waveform's reference marker. This provides
increased utility for the user such as the ability to specify that grids are spaced
at a level of steps that an output of a D/A converter is intended to operate. The
new grid with respect to these steps will indicate visually the linearity and
evenness of the D/A converter steps.
-
While the foregoing is directed to the preferred embodiment of the
present invention, other and further embodiments of the invention may be
devised without departing from the basic scope thereof, and the scope thereof
is determined by the claims that follow.