EP1430071B1 - Secreted and cell surface genes expressed in benign and malignant colorectal tumors - Google Patents
Secreted and cell surface genes expressed in benign and malignant colorectal tumors Download PDFInfo
- Publication number
- EP1430071B1 EP1430071B1 EP02773302A EP02773302A EP1430071B1 EP 1430071 B1 EP1430071 B1 EP 1430071B1 EP 02773302 A EP02773302 A EP 02773302A EP 02773302 A EP02773302 A EP 02773302A EP 1430071 B1 EP1430071 B1 EP 1430071B1
- Authority
- EP
- European Patent Office
- Prior art keywords
- subject
- renal dipeptidase
- mrna
- renal
- dipeptidase
- Prior art date
- Legal status (The legal status is an assumption and is not a legal conclusion. Google has not performed a legal analysis and makes no representation as to the accuracy of the status listed.)
- Expired - Lifetime
Links
- 108090000623 proteins and genes Proteins 0.000 title abstract description 78
- 210000004027 cell Anatomy 0.000 title description 13
- 206010009944 Colon cancer Diseases 0.000 title description 6
- 208000013489 benign neoplasm of large intestine Diseases 0.000 title description 2
- 206010028980 Neoplasm Diseases 0.000 claims abstract description 85
- 108090000204 Dipeptidase 1 Proteins 0.000 claims abstract description 79
- 102000003850 Dipeptidase 1 Human genes 0.000 claims abstract description 78
- 238000001514 detection method Methods 0.000 claims abstract description 24
- 108020004999 messenger RNA Proteins 0.000 claims description 51
- 238000000034 method Methods 0.000 claims description 38
- 201000002758 colorectal adenoma Diseases 0.000 claims description 30
- 210000002919 epithelial cell Anatomy 0.000 claims description 27
- 239000003112 inhibitor Substances 0.000 claims description 27
- 210000004369 blood Anatomy 0.000 claims description 16
- 239000008280 blood Substances 0.000 claims description 16
- 210000003608 fece Anatomy 0.000 claims description 15
- 102000004856 Lectins Human genes 0.000 claims description 7
- 108090001090 Lectins Proteins 0.000 claims description 7
- 239000002523 lectin Substances 0.000 claims description 7
- 101710154606 Hemagglutinin Proteins 0.000 claims description 5
- 101710093908 Outer capsid protein VP4 Proteins 0.000 claims description 5
- 101710135467 Outer capsid protein sigma-1 Proteins 0.000 claims description 5
- 101710176177 Protein A56 Proteins 0.000 claims description 5
- 235000008995 european elder Nutrition 0.000 claims description 5
- 239000000185 hemagglutinin Substances 0.000 claims description 5
- 210000003734 kidney Anatomy 0.000 claims description 5
- 210000000512 proximal kidney tubule Anatomy 0.000 claims description 5
- 230000002285 radioactive effect Effects 0.000 claims description 5
- 240000006028 Sambucus nigra Species 0.000 claims description 4
- 235000003142 Sambucus nigra Nutrition 0.000 claims description 4
- 230000004807 localization Effects 0.000 claims description 4
- 238000003757 reverse transcription PCR Methods 0.000 claims description 4
- 244000046052 Phaseolus vulgaris Species 0.000 claims description 3
- 235000010627 Phaseolus vulgaris Nutrition 0.000 claims description 3
- 238000009396 hybridization Methods 0.000 claims description 3
- 238000002591 computed tomography Methods 0.000 claims description 2
- 239000002872 contrast media Substances 0.000 claims 1
- 238000003499 nucleic acid array Methods 0.000 claims 1
- 230000014509 gene expression Effects 0.000 abstract description 39
- 208000003200 Adenoma Diseases 0.000 abstract description 34
- 230000009826 neoplastic cell growth Effects 0.000 abstract description 9
- 210000002966 serum Anatomy 0.000 abstract description 6
- 201000009030 Carcinoma Diseases 0.000 abstract description 4
- 210000001072 colon Anatomy 0.000 abstract description 3
- 230000002829 reductive effect Effects 0.000 abstract description 3
- 208000008636 Neoplastic Processes Diseases 0.000 abstract description 2
- 239000000439 tumor marker Substances 0.000 abstract description 2
- 102100021466 Sarcoma antigen 1 Human genes 0.000 description 24
- 235000002020 sage Nutrition 0.000 description 24
- 101000821981 Homo sapiens Sarcoma antigen 1 Proteins 0.000 description 23
- 235000018102 proteins Nutrition 0.000 description 22
- 102000004169 proteins and genes Human genes 0.000 description 22
- 102100033468 Lysozyme C Human genes 0.000 description 20
- 108010062010 N-Acetylmuramoyl-L-alanine Amidase Proteins 0.000 description 20
- 239000003550 marker Substances 0.000 description 20
- 108010014251 Muramidase Proteins 0.000 description 19
- 229960000274 lysozyme Drugs 0.000 description 19
- 235000010335 lysozyme Nutrition 0.000 description 19
- 239000004325 lysozyme Substances 0.000 description 19
- 238000003753 real-time PCR Methods 0.000 description 18
- 208000001333 Colorectal Neoplasms Diseases 0.000 description 16
- 210000001519 tissue Anatomy 0.000 description 16
- 241000282414 Homo sapiens Species 0.000 description 14
- 239000002299 complementary DNA Substances 0.000 description 14
- 239000000758 substrate Substances 0.000 description 14
- 108010014691 Lithostathine Proteins 0.000 description 13
- 201000011510 cancer Diseases 0.000 description 13
- 102000016997 Lithostathine Human genes 0.000 description 12
- 239000000523 sample Substances 0.000 description 12
- 238000007901 in situ hybridization Methods 0.000 description 10
- 238000004458 analytical method Methods 0.000 description 9
- 210000002540 macrophage Anatomy 0.000 description 9
- 206010001233 Adenoma benign Diseases 0.000 description 7
- 102100024633 Carbonic anhydrase 2 Human genes 0.000 description 7
- 101710167917 Carbonic anhydrase 2 Proteins 0.000 description 7
- 230000000112 colonic effect Effects 0.000 description 7
- 210000004877 mucosa Anatomy 0.000 description 7
- 108091032973 (ribonucleotides)n+m Proteins 0.000 description 6
- 102100022749 Aminopeptidase N Human genes 0.000 description 6
- 238000002474 experimental method Methods 0.000 description 6
- 230000001613 neoplastic effect Effects 0.000 description 6
- 229920001184 polypeptide Polymers 0.000 description 6
- 108090000765 processed proteins & peptides Proteins 0.000 description 6
- 102000004196 processed proteins & peptides Human genes 0.000 description 6
- 239000000047 product Substances 0.000 description 6
- 108700018351 Major Histocompatibility Complex Proteins 0.000 description 5
- 239000003795 chemical substances by application Substances 0.000 description 5
- 238000003384 imaging method Methods 0.000 description 5
- 230000003211 malignant effect Effects 0.000 description 5
- 230000002438 mitochondrial effect Effects 0.000 description 5
- 230000020382 suppression by virus of host antigen processing and presentation of peptide antigen via MHC class I Effects 0.000 description 5
- 102000004190 Enzymes Human genes 0.000 description 4
- 108090000790 Enzymes Proteins 0.000 description 4
- 238000003556 assay Methods 0.000 description 4
- 239000011324 bead Substances 0.000 description 4
- 230000000694 effects Effects 0.000 description 4
- 229940088598 enzyme Drugs 0.000 description 4
- 238000002372 labelling Methods 0.000 description 4
- 238000012360 testing method Methods 0.000 description 4
- 102100024533 Carcinoembryonic antigen-related cell adhesion molecule 1 Human genes 0.000 description 3
- 101710190843 Carcinoembryonic antigen-related cell adhesion molecule 1 Proteins 0.000 description 3
- 108010016626 Dipeptides Proteins 0.000 description 3
- 108010000518 Dual-Specificity Phosphatases Proteins 0.000 description 3
- 102000002266 Dual-Specificity Phosphatases Human genes 0.000 description 3
- 101000847107 Homo sapiens Tetraspanin-8 Proteins 0.000 description 3
- 101000658574 Homo sapiens Transmembrane 4 L6 family member 1 Proteins 0.000 description 3
- -1 MIC-1 Proteins 0.000 description 3
- 102100037942 Suppressor of tumorigenicity 14 protein Human genes 0.000 description 3
- 102100032802 Tetraspanin-8 Human genes 0.000 description 3
- 102100034902 Transmembrane 4 L6 family member 1 Human genes 0.000 description 3
- 239000002253 acid Substances 0.000 description 3
- 150000001413 amino acids Chemical class 0.000 description 3
- 125000004429 atom Chemical group 0.000 description 3
- 238000009739 binding Methods 0.000 description 3
- 239000003153 chemical reaction reagent Substances 0.000 description 3
- 210000000349 chromosome Anatomy 0.000 description 3
- 238000002052 colonoscopy Methods 0.000 description 3
- 230000003247 decreasing effect Effects 0.000 description 3
- 210000000981 epithelium Anatomy 0.000 description 3
- 238000000338 in vitro Methods 0.000 description 3
- 230000005764 inhibitory process Effects 0.000 description 3
- 230000003902 lesion Effects 0.000 description 3
- 102100022476 Adenosylhomocysteinase 3 Human genes 0.000 description 2
- 102000013455 Amyloid beta-Peptides Human genes 0.000 description 2
- 108010090849 Amyloid beta-Peptides Proteins 0.000 description 2
- 206010006187 Breast cancer Diseases 0.000 description 2
- 108010049990 CD13 Antigens Proteins 0.000 description 2
- 108010033547 Carbonic Anhydrase I Proteins 0.000 description 2
- 102100025518 Carbonic anhydrase 1 Human genes 0.000 description 2
- 102100034231 Cell surface A33 antigen Human genes 0.000 description 2
- 102100030099 Chloride anion exchanger Human genes 0.000 description 2
- 102000004127 Cytokines Human genes 0.000 description 2
- 108090000695 Cytokines Proteins 0.000 description 2
- 108020004414 DNA Proteins 0.000 description 2
- 102100036504 Dehydrogenase/reductase SDR family member 9 Human genes 0.000 description 2
- 102100040553 FXYD domain-containing ion transport regulator 3 Human genes 0.000 description 2
- 101710198536 FXYD domain-containing ion transport regulator 3 Proteins 0.000 description 2
- 201000006107 Familial adenomatous polyposis Diseases 0.000 description 2
- 102100039558 Galectin-3 Human genes 0.000 description 2
- 206010056740 Genital discharge Diseases 0.000 description 2
- 102000003886 Glycoproteins Human genes 0.000 description 2
- 108090000288 Glycoproteins Proteins 0.000 description 2
- 102100022664 Guanylate cyclase activator 2B Human genes 0.000 description 2
- 102100027685 Hemoglobin subunit alpha Human genes 0.000 description 2
- 108010014594 Heterogeneous Nuclear Ribonucleoprotein A1 Proteins 0.000 description 2
- 102000017013 Heterogeneous Nuclear Ribonucleoprotein A1 Human genes 0.000 description 2
- 101000822527 Homo sapiens Adenosylhomocysteinase 3 Proteins 0.000 description 2
- 101000757160 Homo sapiens Aminopeptidase N Proteins 0.000 description 2
- 101000996823 Homo sapiens Cell surface A33 antigen Proteins 0.000 description 2
- 101000727806 Homo sapiens Chloride anion exchanger Proteins 0.000 description 2
- 101000928746 Homo sapiens Dehydrogenase/reductase SDR family member 9 Proteins 0.000 description 2
- 101001009007 Homo sapiens Hemoglobin subunit alpha Proteins 0.000 description 2
- 101001034844 Homo sapiens Interferon-induced transmembrane protein 1 Proteins 0.000 description 2
- 101000728095 Homo sapiens Plasma membrane calcium-transporting ATPase 1 Proteins 0.000 description 2
- 101000735558 Homo sapiens Protein-arginine deiminase type-2 Proteins 0.000 description 2
- 101001077369 Homo sapiens Receptor of activated protein C kinase 1 Proteins 0.000 description 2
- 101000587717 Homo sapiens Sulfide:quinone oxidoreductase, mitochondrial Proteins 0.000 description 2
- 101000680271 Homo sapiens Transmembrane protein 59 Proteins 0.000 description 2
- 101000942334 Homo sapiens Uncharacterized protein C11orf86 Proteins 0.000 description 2
- 108010048077 Inositol 1,4,5-trisphosphate 3-kinase Proteins 0.000 description 2
- 102100036405 Inositol-trisphosphate 3-kinase A Human genes 0.000 description 2
- 102100040021 Interferon-induced transmembrane protein 1 Human genes 0.000 description 2
- 108010063954 Mucins Proteins 0.000 description 2
- 102100022678 Nucleophosmin Human genes 0.000 description 2
- 108010025568 Nucleophosmin Proteins 0.000 description 2
- 102100034539 Peptidyl-prolyl cis-trans isomerase A Human genes 0.000 description 2
- 102100022239 Peroxiredoxin-6 Human genes 0.000 description 2
- 101710185569 Peroxiredoxin-6 Proteins 0.000 description 2
- 102100031538 Phosphatidylcholine-sterol acyltransferase Human genes 0.000 description 2
- 102100027330 Phosphoribosylaminoimidazole carboxylase Human genes 0.000 description 2
- 108090001050 Phosphoric Diester Hydrolases Proteins 0.000 description 2
- 102000004861 Phosphoric Diester Hydrolases Human genes 0.000 description 2
- 102100029751 Plasma membrane calcium-transporting ATPase 1 Human genes 0.000 description 2
- 108010029485 Protein Isoforms Proteins 0.000 description 2
- 102000001708 Protein Isoforms Human genes 0.000 description 2
- 102100036352 Protein disulfide-isomerase Human genes 0.000 description 2
- 102100035735 Protein-arginine deiminase type-2 Human genes 0.000 description 2
- 108700020978 Proto-Oncogene Proteins 0.000 description 2
- 102000052575 Proto-Oncogene Human genes 0.000 description 2
- 102100025234 Receptor of activated protein C kinase 1 Human genes 0.000 description 2
- 102100021443 Rho GTPase-activating protein 8 Human genes 0.000 description 2
- 102100031138 Sulfide:quinone oxidoreductase, mitochondrial Human genes 0.000 description 2
- 102100026640 Tight junction protein ZO-3 Human genes 0.000 description 2
- 102100022075 Transmembrane protein 59 Human genes 0.000 description 2
- 102100032541 Uncharacterized protein C11orf86 Human genes 0.000 description 2
- 230000004913 activation Effects 0.000 description 2
- 108010005168 alpha 2 subunit adaptor protein complex 2 Proteins 0.000 description 2
- 230000003321 amplification Effects 0.000 description 2
- 238000013459 approach Methods 0.000 description 2
- 230000015572 biosynthetic process Effects 0.000 description 2
- 210000004556 brain Anatomy 0.000 description 2
- 239000006285 cell suspension Substances 0.000 description 2
- 230000001413 cellular effect Effects 0.000 description 2
- 230000008859 change Effects 0.000 description 2
- 208000029664 classic familial adenomatous polyposis Diseases 0.000 description 2
- 238000003776 cleavage reaction Methods 0.000 description 2
- 238000011161 development Methods 0.000 description 2
- 230000018109 developmental process Effects 0.000 description 2
- 201000010099 disease Diseases 0.000 description 2
- 208000037265 diseases, disorders, signs and symptoms Diseases 0.000 description 2
- 238000005516 engineering process Methods 0.000 description 2
- 230000002550 fecal effect Effects 0.000 description 2
- 230000012010 growth Effects 0.000 description 2
- 230000003394 haemopoietic effect Effects 0.000 description 2
- 229910052736 halogen Inorganic materials 0.000 description 2
- 150000002367 halogens Chemical group 0.000 description 2
- 238000011065 in-situ storage Methods 0.000 description 2
- 230000002779 inactivation Effects 0.000 description 2
- 230000002401 inhibitory effect Effects 0.000 description 2
- 238000005259 measurement Methods 0.000 description 2
- 230000007246 mechanism Effects 0.000 description 2
- 210000005170 neoplastic cell Anatomy 0.000 description 2
- 238000003199 nucleic acid amplification method Methods 0.000 description 2
- 108010035774 phosphoribosylaminoimidazole carboxylase Proteins 0.000 description 2
- 210000002307 prostate Anatomy 0.000 description 2
- 108020003519 protein disulfide isomerase Proteins 0.000 description 2
- 230000004044 response Effects 0.000 description 2
- 230000007017 scission Effects 0.000 description 2
- 230000035945 sensitivity Effects 0.000 description 2
- 238000013518 transcription Methods 0.000 description 2
- 230000035897 transcription Effects 0.000 description 2
- 238000013519 translation Methods 0.000 description 2
- 102100038369 1-acyl-sn-glycerol-3-phosphate acyltransferase beta Human genes 0.000 description 1
- 101710092561 1-acyl-sn-glycerol-3-phosphate acyltransferase beta Proteins 0.000 description 1
- WRGQSWVCFNIUNZ-GDCKJWNLSA-N 1-oleoyl-sn-glycerol 3-phosphate Chemical compound CCCCCCCC\C=C/CCCCCCCC(=O)OC[C@@H](O)COP(O)(O)=O WRGQSWVCFNIUNZ-GDCKJWNLSA-N 0.000 description 1
- 102100027833 14-3-3 protein sigma Human genes 0.000 description 1
- 108050008974 14-3-3 protein sigma Proteins 0.000 description 1
- QZDDFQLIQRYMBV-UHFFFAOYSA-N 2-[3-nitro-2-(2-nitrophenyl)-4-oxochromen-8-yl]acetic acid Chemical compound OC(=O)CC1=CC=CC(C(C=2[N+]([O-])=O)=O)=C1OC=2C1=CC=CC=C1[N+]([O-])=O QZDDFQLIQRYMBV-UHFFFAOYSA-N 0.000 description 1
- YHPKGSLWSUCJQK-UHFFFAOYSA-N 2-[[2-[[2-[[2-[[2-[[2-[[5-amino-2-[[2-[(2,4-diamino-4-oxobutanoyl)amino]-4-methylpentanoyl]amino]-5-oxopentanoyl]amino]-4-methylpentanoyl]amino]-4-methylpentanoyl]amino]-4-methylsulfanylbutanoyl]amino]-3-carboxypropanoyl]amino]-5-(diaminomethylideneamino) Chemical compound NC(N)=NCCCC(C(=O)NC(C(C)C)C(O)=O)NC(=O)C(CC(O)=O)NC(=O)C(CCSC)NC(=O)C(CC(C)C)NC(=O)C(CC(C)C)NC(=O)C(CCC(N)=O)NC(=O)C(CC(C)C)NC(=O)C(N)CC(N)=O YHPKGSLWSUCJQK-UHFFFAOYSA-N 0.000 description 1
- KPGXRSRHYNQIFN-UHFFFAOYSA-N 2-oxoglutaric acid Chemical compound OC(=O)CCC(=O)C(O)=O KPGXRSRHYNQIFN-UHFFFAOYSA-N 0.000 description 1
- 102100026163 39S ribosomal protein L12, mitochondrial Human genes 0.000 description 1
- 102100033051 40S ribosomal protein S19 Human genes 0.000 description 1
- 102100023415 40S ribosomal protein S20 Human genes 0.000 description 1
- 102100037513 40S ribosomal protein S23 Human genes 0.000 description 1
- 102100022721 40S ribosomal protein S25 Human genes 0.000 description 1
- 102100037663 40S ribosomal protein S8 Human genes 0.000 description 1
- 102100027271 40S ribosomal protein SA Human genes 0.000 description 1
- 102100033416 60S acidic ribosomal protein P1 Human genes 0.000 description 1
- 102100021546 60S ribosomal protein L10 Human genes 0.000 description 1
- 102100025643 60S ribosomal protein L12 Human genes 0.000 description 1
- 102100037965 60S ribosomal protein L21 Human genes 0.000 description 1
- 102100021308 60S ribosomal protein L23 Human genes 0.000 description 1
- 102100023247 60S ribosomal protein L23a Human genes 0.000 description 1
- 102100040131 60S ribosomal protein L37 Human genes 0.000 description 1
- 102100035988 60S ribosomal protein L39 Human genes 0.000 description 1
- 102100040623 60S ribosomal protein L41 Human genes 0.000 description 1
- 102100039601 ARF GTPase-activating protein GIT1 Human genes 0.000 description 1
- 101710194905 ARF GTPase-activating protein GIT1 Proteins 0.000 description 1
- 102100025581 ATP synthase subunit delta, mitochondrial Human genes 0.000 description 1
- 101710173256 ATP synthase subunit delta, mitochondrial Proteins 0.000 description 1
- 101710093498 Actin, gamma Proteins 0.000 description 1
- 108010063503 Actinin Proteins 0.000 description 1
- 102000010825 Actinin Human genes 0.000 description 1
- 102000057234 Acyl transferases Human genes 0.000 description 1
- 108700016155 Acyl transferases Proteins 0.000 description 1
- 102100034540 Adenomatous polyposis coli protein Human genes 0.000 description 1
- 101710136834 Adenylyl cyclase-associated protein Proteins 0.000 description 1
- 102100038910 Alpha-enolase Human genes 0.000 description 1
- 102100039160 Amiloride-sensitive amine oxidase [copper-containing] Human genes 0.000 description 1
- 101710099461 Aminopeptidase N Proteins 0.000 description 1
- 102100034613 Annexin A2 Human genes 0.000 description 1
- 108090000668 Annexin A2 Proteins 0.000 description 1
- 102000053640 Argininosuccinate synthases Human genes 0.000 description 1
- 108700024106 Argininosuccinate synthases Proteins 0.000 description 1
- 108010024976 Asparaginase Proteins 0.000 description 1
- 108010077173 BB Form Creatine Kinase Proteins 0.000 description 1
- 102100032412 Basigin Human genes 0.000 description 1
- 108010064528 Basigin Proteins 0.000 description 1
- 206010060999 Benign neoplasm Diseases 0.000 description 1
- 102100026349 Beta-1,4-galactosyltransferase 1 Human genes 0.000 description 1
- 208000026310 Breast neoplasm Diseases 0.000 description 1
- 102100031974 CMP-N-acetylneuraminate-beta-galactosamide-alpha-2,3-sialyltransferase 4 Human genes 0.000 description 1
- 102000005701 Calcium-Binding Proteins Human genes 0.000 description 1
- 108010045403 Calcium-Binding Proteins Proteins 0.000 description 1
- 102100039534 Calcium-activated chloride channel regulator 4 Human genes 0.000 description 1
- 108090000236 Calpain-1 Proteins 0.000 description 1
- 102100025172 Calpain-1 catalytic subunit Human genes 0.000 description 1
- 102100025475 Carcinoembryonic antigen-related cell adhesion molecule 5 Human genes 0.000 description 1
- 101710190849 Carcinoembryonic antigen-related cell adhesion molecule 5 Proteins 0.000 description 1
- 102100025474 Carcinoembryonic antigen-related cell adhesion molecule 7 Human genes 0.000 description 1
- 101710190841 Carcinoembryonic antigen-related cell adhesion molecule 7 Proteins 0.000 description 1
- 208000000668 Chronic Pancreatitis Diseases 0.000 description 1
- 102100032559 Clathrin light chain B Human genes 0.000 description 1
- 102100038423 Claudin-3 Human genes 0.000 description 1
- 108090000599 Claudin-3 Proteins 0.000 description 1
- 102100038447 Claudin-4 Human genes 0.000 description 1
- 108090000601 Claudin-4 Proteins 0.000 description 1
- 102100037288 Coatomer subunit epsilon Human genes 0.000 description 1
- 102000029816 Collagenase Human genes 0.000 description 1
- 108060005980 Collagenase Proteins 0.000 description 1
- 206010052360 Colorectal adenocarcinoma Diseases 0.000 description 1
- 102100022785 Creatine kinase B-type Human genes 0.000 description 1
- 108050006400 Cyclin Proteins 0.000 description 1
- 108010072220 Cyclophilin A Proteins 0.000 description 1
- 102100026846 Cytidine deaminase Human genes 0.000 description 1
- 108010031325 Cytidine deaminase Proteins 0.000 description 1
- 102100025620 Cytochrome b-245 light chain Human genes 0.000 description 1
- 102100039924 Cytochrome b-c1 complex subunit 1, mitochondrial Human genes 0.000 description 1
- 102100039259 Cytochrome c oxidase subunit 8A, mitochondrial Human genes 0.000 description 1
- 102100031635 Cytoplasmic dynein 1 heavy chain 1 Human genes 0.000 description 1
- 102100021420 Defensin-5 Human genes 0.000 description 1
- 102100020743 Dipeptidase 1 Human genes 0.000 description 1
- 102000004860 Dipeptidases Human genes 0.000 description 1
- 108090001081 Dipeptidases Proteins 0.000 description 1
- 241000255581 Drosophila <fruit fly, genus> Species 0.000 description 1
- 101000702533 Drosophila melanogaster NAD-dependent protein deacetylase Sirt2 Proteins 0.000 description 1
- 102000010778 Dual Specificity Phosphatase 1 Human genes 0.000 description 1
- 108010038537 Dual Specificity Phosphatase 1 Proteins 0.000 description 1
- 102100033209 Dysbindin domain-containing protein 2 Human genes 0.000 description 1
- 102100039371 ER lumen protein-retaining receptor 1 Human genes 0.000 description 1
- 102000015782 Electron Transport Complex III Human genes 0.000 description 1
- 108010024882 Electron Transport Complex III Proteins 0.000 description 1
- 102100030801 Elongation factor 1-alpha 1 Human genes 0.000 description 1
- 102100040465 Elongation factor 1-beta Human genes 0.000 description 1
- 102100031334 Elongation factor 2 Human genes 0.000 description 1
- 102100032450 Endothelial differentiation-related factor 1 Human genes 0.000 description 1
- 101710182961 Endothelial differentiation-related factor 1 Proteins 0.000 description 1
- 102100035218 Epidermal growth factor receptor kinase substrate 8-like protein 2 Human genes 0.000 description 1
- 102100033183 Epithelial membrane protein 1 Human genes 0.000 description 1
- 101710139370 Eukaryotic translation elongation factor 2 Proteins 0.000 description 1
- 102100020903 Ezrin Human genes 0.000 description 1
- 101710103768 Fatty acid-binding protein 1, liver Proteins 0.000 description 1
- 102100026745 Fatty acid-binding protein, liver Human genes 0.000 description 1
- 102100020760 Ferritin heavy chain Human genes 0.000 description 1
- 102100026559 Filamin-B Human genes 0.000 description 1
- 241000192125 Firmicutes Species 0.000 description 1
- 102100038644 Four and a half LIM domains protein 2 Human genes 0.000 description 1
- 229910052688 Gadolinium Inorganic materials 0.000 description 1
- 108010001517 Galectin 3 Proteins 0.000 description 1
- 102100028953 Gelsolin Human genes 0.000 description 1
- 102100034294 Glutathione synthetase Human genes 0.000 description 1
- 102100040094 Glycogen phosphorylase, brain form Human genes 0.000 description 1
- 101710096194 Glycogen phosphorylase, brain form Proteins 0.000 description 1
- 108010041834 Growth Differentiation Factor 15 Proteins 0.000 description 1
- 102100040896 Growth/differentiation factor 15 Human genes 0.000 description 1
- 102100036738 Guanine nucleotide-binding protein subunit alpha-11 Human genes 0.000 description 1
- 101710124521 Guanylate cyclase activator 2B Proteins 0.000 description 1
- 102100033968 Guanylyl cyclase-activating protein 2 Human genes 0.000 description 1
- 102100028976 HLA class I histocompatibility antigen, B alpha chain Human genes 0.000 description 1
- 101710142296 HLA class I histocompatibility antigen, B alpha chain Proteins 0.000 description 1
- 102100028971 HLA class I histocompatibility antigen, C alpha chain Human genes 0.000 description 1
- 102100034051 Heat shock protein HSP 90-alpha Human genes 0.000 description 1
- 102100028006 Heme oxygenase 1 Human genes 0.000 description 1
- 102100021519 Hemoglobin subunit beta Human genes 0.000 description 1
- 102100031000 Hepatoma-derived growth factor Human genes 0.000 description 1
- 208000003923 Hereditary Corneal Dystrophies Diseases 0.000 description 1
- 102100026122 High affinity immunoglobulin gamma Fc receptor I Human genes 0.000 description 1
- 102100039236 Histone H3.3 Human genes 0.000 description 1
- 101000691538 Homo sapiens 39S ribosomal protein L12, mitochondrial Proteins 0.000 description 1
- 101001097953 Homo sapiens 40S ribosomal protein S23 Proteins 0.000 description 1
- 101000678929 Homo sapiens 40S ribosomal protein S25 Proteins 0.000 description 1
- 101000694288 Homo sapiens 40S ribosomal protein SA Proteins 0.000 description 1
- 101000712357 Homo sapiens 60S acidic ribosomal protein P1 Proteins 0.000 description 1
- 101001115494 Homo sapiens 60S ribosomal protein L23a Proteins 0.000 description 1
- 101000671735 Homo sapiens 60S ribosomal protein L37 Proteins 0.000 description 1
- 101000674326 Homo sapiens 60S ribosomal protein L41 Proteins 0.000 description 1
- 101000882335 Homo sapiens Alpha-enolase Proteins 0.000 description 1
- 101000889548 Homo sapiens Amiloride-sensitive amine oxidase [copper-containing] Proteins 0.000 description 1
- 101000766145 Homo sapiens Beta-1,4-galactosyltransferase 1 Proteins 0.000 description 1
- 101000983944 Homo sapiens CDK2-associated and cullin domain-containing protein 1 Proteins 0.000 description 1
- 101000703754 Homo sapiens CMP-N-acetylneuraminate-beta-galactosamide-alpha-2,3-sialyltransferase 4 Proteins 0.000 description 1
- 101000888577 Homo sapiens Calcium-activated chloride channel regulator 4 Proteins 0.000 description 1
- 101000942271 Homo sapiens Clathrin light chain B Proteins 0.000 description 1
- 101000952971 Homo sapiens Coatomer subunit epsilon Proteins 0.000 description 1
- 101000856723 Homo sapiens Cytochrome b-245 light chain Proteins 0.000 description 1
- 101000607486 Homo sapiens Cytochrome b-c1 complex subunit 1, mitochondrial Proteins 0.000 description 1
- 101000745956 Homo sapiens Cytochrome c oxidase subunit 8A, mitochondrial Proteins 0.000 description 1
- 101000866326 Homo sapiens Cytoplasmic dynein 1 heavy chain 1 Proteins 0.000 description 1
- 101001041589 Homo sapiens Defensin-5 Proteins 0.000 description 1
- 101000871249 Homo sapiens Dysbindin domain-containing protein 2 Proteins 0.000 description 1
- 101000812437 Homo sapiens ER lumen protein-retaining receptor 1 Proteins 0.000 description 1
- 101000920078 Homo sapiens Elongation factor 1-alpha 1 Proteins 0.000 description 1
- 101000967447 Homo sapiens Elongation factor 1-beta Proteins 0.000 description 1
- 101000876686 Homo sapiens Epidermal growth factor receptor kinase substrate 8-like protein 2 Proteins 0.000 description 1
- 101000854648 Homo sapiens Ezrin Proteins 0.000 description 1
- 101001002987 Homo sapiens Ferritin heavy chain Proteins 0.000 description 1
- 101000913551 Homo sapiens Filamin-B Proteins 0.000 description 1
- 101001031714 Homo sapiens Four and a half LIM domains protein 2 Proteins 0.000 description 1
- 101000608757 Homo sapiens Galectin-3 Proteins 0.000 description 1
- 101001059150 Homo sapiens Gelsolin Proteins 0.000 description 1
- 101001069973 Homo sapiens Glutathione synthetase Proteins 0.000 description 1
- 101001072407 Homo sapiens Guanine nucleotide-binding protein subunit alpha-11 Proteins 0.000 description 1
- 101000899814 Homo sapiens Guanylate cyclase activator 2B Proteins 0.000 description 1
- 101001068475 Homo sapiens Guanylyl cyclase-activating protein 2 Proteins 0.000 description 1
- 101000986084 Homo sapiens HLA class I histocompatibility antigen, C alpha chain Proteins 0.000 description 1
- 101001016865 Homo sapiens Heat shock protein HSP 90-alpha Proteins 0.000 description 1
- 101001079623 Homo sapiens Heme oxygenase 1 Proteins 0.000 description 1
- 101000899111 Homo sapiens Hemoglobin subunit beta Proteins 0.000 description 1
- 101000913074 Homo sapiens High affinity immunoglobulin gamma Fc receptor I Proteins 0.000 description 1
- 101001035966 Homo sapiens Histone H3.3 Proteins 0.000 description 1
- 101001076680 Homo sapiens Insulin-induced gene 1 protein Proteins 0.000 description 1
- 101001082060 Homo sapiens Interferon-induced protein with tetratricopeptide repeats 3 Proteins 0.000 description 1
- 101001034846 Homo sapiens Interferon-induced transmembrane protein 3 Proteins 0.000 description 1
- 101000588045 Homo sapiens Kunitz-type protease inhibitor 1 Proteins 0.000 description 1
- 101000984630 Homo sapiens Low-density lipoprotein receptor-related protein 10 Proteins 0.000 description 1
- 101000972485 Homo sapiens Lupus La protein Proteins 0.000 description 1
- 101000616810 Homo sapiens MAL-like protein Proteins 0.000 description 1
- 101000578853 Homo sapiens Membrane-spanning 4-domains subfamily A member 12 Proteins 0.000 description 1
- 101000991619 Homo sapiens Meprin A subunit alpha Proteins 0.000 description 1
- 101000946889 Homo sapiens Monocyte differentiation antigen CD14 Proteins 0.000 description 1
- 101000972276 Homo sapiens Mucin-5B Proteins 0.000 description 1
- 101001024723 Homo sapiens Nucleoporin NDC1 Proteins 0.000 description 1
- 101001123306 Homo sapiens PR domain zinc finger protein 10 Proteins 0.000 description 1
- 101001096054 Homo sapiens Perilipin-3 Proteins 0.000 description 1
- 101001126471 Homo sapiens Plectin Proteins 0.000 description 1
- 101001003584 Homo sapiens Prelamin-A/C Proteins 0.000 description 1
- 101000864678 Homo sapiens Probable ATP-dependent RNA helicase DHX37 Proteins 0.000 description 1
- 101001133936 Homo sapiens Prolyl 3-hydroxylase 2 Proteins 0.000 description 1
- 101000882217 Homo sapiens Protein FAM50A Proteins 0.000 description 1
- 101000931462 Homo sapiens Protein FosB Proteins 0.000 description 1
- 101000579580 Homo sapiens Protein LSM14 homolog A Proteins 0.000 description 1
- 101001061518 Homo sapiens RNA-binding protein FUS Proteins 0.000 description 1
- 101000738771 Homo sapiens Receptor-type tyrosine-protein phosphatase C Proteins 0.000 description 1
- 101001106309 Homo sapiens Rho GTPase-activating protein 8 Proteins 0.000 description 1
- 101000581118 Homo sapiens Rho-related GTP-binding protein RhoC Proteins 0.000 description 1
- 101000667595 Homo sapiens Ribonuclease pancreatic Proteins 0.000 description 1
- 101000648001 Homo sapiens START domain-containing protein 10 Proteins 0.000 description 1
- 101000936917 Homo sapiens Sarcoplasmic/endoplasmic reticulum calcium ATPase 3 Proteins 0.000 description 1
- 101000836983 Homo sapiens Secretoglobin family 1D member 1 Proteins 0.000 description 1
- 101000760716 Homo sapiens Short-chain specific acyl-CoA dehydrogenase, mitochondrial Proteins 0.000 description 1
- 101000974834 Homo sapiens Sodium/potassium-transporting ATPase subunit beta-3 Proteins 0.000 description 1
- 101000685678 Homo sapiens Solute carrier family 22 member 18 Proteins 0.000 description 1
- 101000642262 Homo sapiens Spondin-1 Proteins 0.000 description 1
- 101000661807 Homo sapiens Suppressor of tumorigenicity 14 protein Proteins 0.000 description 1
- 101000666416 Homo sapiens Terminal nucleotidyltransferase 5A Proteins 0.000 description 1
- 101000785517 Homo sapiens Tight junction protein ZO-3 Proteins 0.000 description 1
- 101000635804 Homo sapiens Tissue factor Proteins 0.000 description 1
- 101000635938 Homo sapiens Transforming growth factor beta-1 proprotein Proteins 0.000 description 1
- 101000894525 Homo sapiens Transforming growth factor-beta-induced protein ig-h3 Proteins 0.000 description 1
- 101000838463 Homo sapiens Tubulin alpha-1A chain Proteins 0.000 description 1
- 101000838456 Homo sapiens Tubulin alpha-1B chain Proteins 0.000 description 1
- 101000641956 Homo sapiens Villin-like protein Proteins 0.000 description 1
- 102100026103 IgGFc-binding protein Human genes 0.000 description 1
- 101710147387 IgGFc-binding protein Proteins 0.000 description 1
- 208000022559 Inflammatory bowel disease Diseases 0.000 description 1
- 102100025887 Insulin-induced gene 1 protein Human genes 0.000 description 1
- 102100025464 Integral membrane protein 2C Human genes 0.000 description 1
- 101710180750 Integral membrane protein 2C Proteins 0.000 description 1
- 102100027302 Interferon-induced protein with tetratricopeptide repeats 3 Human genes 0.000 description 1
- 102100040035 Interferon-induced transmembrane protein 3 Human genes 0.000 description 1
- 102000014150 Interferons Human genes 0.000 description 1
- 108010050904 Interferons Proteins 0.000 description 1
- 102100025505 Intersectin-2 Human genes 0.000 description 1
- 101710088362 Intersectin-2 Proteins 0.000 description 1
- 102100033420 Keratin, type I cytoskeletal 19 Human genes 0.000 description 1
- 102100023972 Keratin, type II cytoskeletal 8 Human genes 0.000 description 1
- 108010066302 Keratin-19 Proteins 0.000 description 1
- 108010070511 Keratin-8 Proteins 0.000 description 1
- 102100031607 Kunitz-type protease inhibitor 1 Human genes 0.000 description 1
- ONIBWKKTOPOVIA-BYPYZUCNSA-N L-Proline Chemical compound OC(=O)[C@@H]1CCCN1 ONIBWKKTOPOVIA-BYPYZUCNSA-N 0.000 description 1
- 102100027116 Low-density lipoprotein receptor-related protein 10 Human genes 0.000 description 1
- 102100022742 Lupus La protein Human genes 0.000 description 1
- 208000028018 Lymphocytic leukaemia Diseases 0.000 description 1
- 102100037611 Lysophospholipase Human genes 0.000 description 1
- 108050000633 Lysozyme C Proteins 0.000 description 1
- 102100021832 MAL-like protein Human genes 0.000 description 1
- 102100038884 Major vault protein Human genes 0.000 description 1
- 101710094960 Major vault protein Proteins 0.000 description 1
- 108010091175 Matriptase Proteins 0.000 description 1
- 102100028425 Membrane-spanning 4-domains subfamily A member 12 Human genes 0.000 description 1
- 102100030882 Meprin A subunit alpha Human genes 0.000 description 1
- 102100031347 Metallothionein-2 Human genes 0.000 description 1
- 101710196499 Metallothionein-2A Proteins 0.000 description 1
- 206010027476 Metastases Diseases 0.000 description 1
- 108700027649 Mitogen-Activated Protein Kinase 3 Proteins 0.000 description 1
- 102100024192 Mitogen-activated protein kinase 3 Human genes 0.000 description 1
- 102100035877 Monocyte differentiation antigen CD14 Human genes 0.000 description 1
- 102100023143 Mucin-12 Human genes 0.000 description 1
- 101710155096 Mucin-12 Proteins 0.000 description 1
- 102100022494 Mucin-5B Human genes 0.000 description 1
- 101001065664 Mus musculus Lipolysis-stimulated lipoprotein receptor Proteins 0.000 description 1
- 101000661808 Mus musculus Suppressor of tumorigenicity 14 protein homolog Proteins 0.000 description 1
- 108060008487 Myosin Proteins 0.000 description 1
- 102000003505 Myosin Human genes 0.000 description 1
- 108010064696 N,O-diacetylmuramidase Proteins 0.000 description 1
- 125000003047 N-acetyl group Chemical group 0.000 description 1
- 102100023315 N-acetyllactosaminide beta-1,6-N-acetylglucosaminyl-transferase Human genes 0.000 description 1
- 108010056664 N-acetyllactosaminide beta-1,6-N-acetylglucosaminyltransferase Proteins 0.000 description 1
- 102100026779 Nascent polypeptide-associated complex subunit alpha, muscle-specific form Human genes 0.000 description 1
- 238000000636 Northern blotting Methods 0.000 description 1
- 102000007999 Nuclear Proteins Human genes 0.000 description 1
- 108010089610 Nuclear Proteins Proteins 0.000 description 1
- 108020004711 Nucleic Acid Probes Proteins 0.000 description 1
- 108091028043 Nucleic acid sequence Proteins 0.000 description 1
- 102100037826 Nucleoporin NDC1 Human genes 0.000 description 1
- 239000004677 Nylon Substances 0.000 description 1
- 206010033128 Ovarian cancer Diseases 0.000 description 1
- 238000012879 PET imaging Methods 0.000 description 1
- 102100028955 PR domain zinc finger protein 10 Human genes 0.000 description 1
- 206010033649 Pancreatitis chronic Diseases 0.000 description 1
- 102000008080 Pancreatitis-Associated Proteins Human genes 0.000 description 1
- 108010074467 Pancreatitis-Associated Proteins Proteins 0.000 description 1
- 102100027370 Parathymosin Human genes 0.000 description 1
- 101710178700 Parathymosin Proteins 0.000 description 1
- 108010077524 Peptide Elongation Factor 1 Proteins 0.000 description 1
- 102000010292 Peptide Elongation Factor 1 Human genes 0.000 description 1
- 102000002508 Peptide Elongation Factors Human genes 0.000 description 1
- 108010068204 Peptide Elongation Factors Proteins 0.000 description 1
- 108010044843 Peptide Initiation Factors Proteins 0.000 description 1
- 102000005877 Peptide Initiation Factors Human genes 0.000 description 1
- 101710111198 Peptidyl-prolyl cis-trans isomerase A Proteins 0.000 description 1
- 102100037895 Perilipin-3 Human genes 0.000 description 1
- 108010011964 Phosphatidylcholine-sterol O-acyltransferase Proteins 0.000 description 1
- 108010058864 Phospholipases A2 Proteins 0.000 description 1
- 108090000216 Phospholipid Transfer Proteins Proteins 0.000 description 1
- 102000003867 Phospholipid Transfer Proteins Human genes 0.000 description 1
- 108010089430 Phosphoproteins Proteins 0.000 description 1
- 102000007982 Phosphoproteins Human genes 0.000 description 1
- 102100035181 Plastin-1 Human genes 0.000 description 1
- 108050001581 Plastin-1 Proteins 0.000 description 1
- 102100030477 Plectin Human genes 0.000 description 1
- 102000019200 Poly(A)-Binding Protein I Human genes 0.000 description 1
- 108010012887 Poly(A)-Binding Protein I Proteins 0.000 description 1
- 102100021983 Pregnancy-specific beta-1-glycoprotein 9 Human genes 0.000 description 1
- 101710135787 Pregnancy-specific beta-1-glycoprotein 9 Proteins 0.000 description 1
- 102100026531 Prelamin-A/C Human genes 0.000 description 1
- 102100030093 Probable ATP-dependent RNA helicase DHX37 Human genes 0.000 description 1
- 108010050808 Procollagen Proteins 0.000 description 1
- 102100036691 Proliferating cell nuclear antigen Human genes 0.000 description 1
- ONIBWKKTOPOVIA-UHFFFAOYSA-N Proline Natural products OC(=O)C1CCCN1 ONIBWKKTOPOVIA-UHFFFAOYSA-N 0.000 description 1
- 102100034015 Prolyl 3-hydroxylase 2 Human genes 0.000 description 1
- 102100029500 Prostasin Human genes 0.000 description 1
- 241000208465 Proteaceae Species 0.000 description 1
- 102100038926 Protein FAM50A Human genes 0.000 description 1
- 102100020847 Protein FosB Human genes 0.000 description 1
- 102100028259 Protein LSM14 homolog A Human genes 0.000 description 1
- 102000005569 Protein Phosphatase 1 Human genes 0.000 description 1
- 108010059000 Protein Phosphatase 1 Proteins 0.000 description 1
- 102000017143 RNA Polymerase I Human genes 0.000 description 1
- 108010013845 RNA Polymerase I Proteins 0.000 description 1
- 108020004518 RNA Probes Proteins 0.000 description 1
- 239000003391 RNA probe Substances 0.000 description 1
- 102100028469 RNA-binding protein FUS Human genes 0.000 description 1
- 101000908582 Rattus norvegicus ATP-dependent RNA helicase DDX39A Proteins 0.000 description 1
- 102100037422 Receptor-type tyrosine-protein phosphatase C Human genes 0.000 description 1
- 241000084978 Rena Species 0.000 description 1
- 101710116873 Rho GTPase-activating protein 8 Proteins 0.000 description 1
- 102100027610 Rho-related GTP-binding protein RhoC Human genes 0.000 description 1
- 102100039832 Ribonuclease pancreatic Human genes 0.000 description 1
- 102000004285 Ribosomal Protein L3 Human genes 0.000 description 1
- 108090000894 Ribosomal Protein L3 Proteins 0.000 description 1
- 108090000986 Ribosomal protein L10 Proteins 0.000 description 1
- 102000004387 Ribosomal protein L14 Human genes 0.000 description 1
- 108090000985 Ribosomal protein L14 Proteins 0.000 description 1
- 108050001924 Ribosomal protein L23 Proteins 0.000 description 1
- 102000004093 Ribosomal protein S15 Human genes 0.000 description 1
- 108090000530 Ribosomal protein S15 Proteins 0.000 description 1
- 102000004339 Ribosomal protein S2 Human genes 0.000 description 1
- 108090000904 Ribosomal protein S2 Proteins 0.000 description 1
- 102100025253 START domain-containing protein 10 Human genes 0.000 description 1
- 240000004808 Saccharomyces cerevisiae Species 0.000 description 1
- 241000208829 Sambucus Species 0.000 description 1
- 235000018735 Sambucus canadensis Nutrition 0.000 description 1
- 102100027733 Sarcoplasmic/endoplasmic reticulum calcium ATPase 3 Human genes 0.000 description 1
- 102100028659 Secretoglobin family 1D member 1 Human genes 0.000 description 1
- MTCFGRXMJLQNBG-UHFFFAOYSA-N Serine Natural products OCC(N)C(O)=O MTCFGRXMJLQNBG-UHFFFAOYSA-N 0.000 description 1
- 108010022999 Serine Proteases Proteins 0.000 description 1
- 102000012479 Serine Proteases Human genes 0.000 description 1
- 102100024639 Short-chain specific acyl-CoA dehydrogenase, mitochondrial Human genes 0.000 description 1
- 102100022792 Sodium/potassium-transporting ATPase subunit beta-3 Human genes 0.000 description 1
- 102100023102 Solute carrier family 22 member 18 Human genes 0.000 description 1
- 102100036428 Spondin-1 Human genes 0.000 description 1
- 102100034371 Sulfhydryl oxidase 1 Human genes 0.000 description 1
- 101710159725 Sulfhydryl oxidase 1 Proteins 0.000 description 1
- 101710097011 Suppressor of tumorigenicity 14 protein Proteins 0.000 description 1
- 102000043168 TGF-beta family Human genes 0.000 description 1
- 108091085018 TGF-beta family Proteins 0.000 description 1
- 102100038311 Terminal nucleotidyltransferase 5A Human genes 0.000 description 1
- 101001110004 Tetrahymena thermophila 60S acidic ribosomal protein P1 Proteins 0.000 description 1
- AUYYCJSJGJYCDS-LBPRGKRZSA-N Thyrolar Chemical class IC1=CC(C[C@H](N)C(O)=O)=CC(I)=C1OC1=CC=C(O)C(I)=C1 AUYYCJSJGJYCDS-LBPRGKRZSA-N 0.000 description 1
- 108050001377 Tight junction protein ZO-3 Proteins 0.000 description 1
- 102100030859 Tissue factor Human genes 0.000 description 1
- 102000004357 Transferases Human genes 0.000 description 1
- 108090000992 Transferases Proteins 0.000 description 1
- 102000009618 Transforming Growth Factors Human genes 0.000 description 1
- 108010009583 Transforming Growth Factors Proteins 0.000 description 1
- 102100025946 Transforming growth factor beta activator LRRC32 Human genes 0.000 description 1
- 101710169732 Transforming growth factor beta activator LRRC32 Proteins 0.000 description 1
- 102100030742 Transforming growth factor beta-1 proprotein Human genes 0.000 description 1
- 102100021398 Transforming growth factor-beta-induced protein ig-h3 Human genes 0.000 description 1
- 102000008817 Trefoil Factor-1 Human genes 0.000 description 1
- 108010088412 Trefoil Factor-1 Proteins 0.000 description 1
- 101710119640 Trypsin-4 Proteins 0.000 description 1
- 102000004271 Tryptophan 5-monooxygenases Human genes 0.000 description 1
- 108090000885 Tryptophan 5-monooxygenases Proteins 0.000 description 1
- 102100028968 Tubulin alpha-1A chain Human genes 0.000 description 1
- 102100028969 Tubulin alpha-1B chain Human genes 0.000 description 1
- 102000014384 Type C Phospholipases Human genes 0.000 description 1
- 108010079194 Type C Phospholipases Proteins 0.000 description 1
- 108091000117 Tyrosine 3-Monooxygenase Proteins 0.000 description 1
- 102000048218 Tyrosine 3-monooxygenases Human genes 0.000 description 1
- 101710098624 Tyrosine-protein kinase ABL1 Proteins 0.000 description 1
- 108010019092 Uridine phosphorylase Proteins 0.000 description 1
- 102100020892 Uridine phosphorylase 1 Human genes 0.000 description 1
- 102100033418 Villin-like protein Human genes 0.000 description 1
- 101710087237 Whey acidic protein Proteins 0.000 description 1
- 101710185494 Zinc finger protein Proteins 0.000 description 1
- 102100023597 Zinc finger protein 816 Human genes 0.000 description 1
- 230000001594 aberrant effect Effects 0.000 description 1
- 230000002378 acidificating effect Effects 0.000 description 1
- 238000009098 adjuvant therapy Methods 0.000 description 1
- AWUCVROLDVIAJX-UHFFFAOYSA-N alpha-glycerophosphate Natural products OCC(O)COP(O)(O)=O AWUCVROLDVIAJX-UHFFFAOYSA-N 0.000 description 1
- 206010002022 amyloidosis Diseases 0.000 description 1
- 210000003484 anatomy Anatomy 0.000 description 1
- 239000003098 androgen Substances 0.000 description 1
- 239000002787 antisense oligonuctleotide Substances 0.000 description 1
- 230000001420 bacteriolytic effect Effects 0.000 description 1
- 235000007123 blue elder Nutrition 0.000 description 1
- 210000000988 bone and bone Anatomy 0.000 description 1
- 210000004899 c-terminal region Anatomy 0.000 description 1
- AIYUHDOJVYHVIT-UHFFFAOYSA-M caesium chloride Chemical compound [Cl-].[Cs+] AIYUHDOJVYHVIT-UHFFFAOYSA-M 0.000 description 1
- 239000011575 calcium Substances 0.000 description 1
- 238000004364 calculation method Methods 0.000 description 1
- 231100000504 carcinogenesis Toxicity 0.000 description 1
- 230000003197 catalytic effect Effects 0.000 description 1
- 210000002421 cell wall Anatomy 0.000 description 1
- 239000001913 cellulose Substances 0.000 description 1
- 229920002678 cellulose Polymers 0.000 description 1
- 238000006243 chemical reaction Methods 0.000 description 1
- 239000007795 chemical reaction product Substances 0.000 description 1
- 208000037976 chronic inflammation Diseases 0.000 description 1
- 230000006020 chronic inflammation Effects 0.000 description 1
- DHSUYTOATWAVLW-WFVMDLQDSA-N cilastatin Chemical compound CC1(C)C[C@@H]1C(=O)N\C(=C/CCCCSC[C@H](N)C(O)=O)C(O)=O DHSUYTOATWAVLW-WFVMDLQDSA-N 0.000 description 1
- 229960004912 cilastatin Drugs 0.000 description 1
- 229960002424 collagenase Drugs 0.000 description 1
- 210000004953 colonic tissue Anatomy 0.000 description 1
- 201000010989 colorectal carcinoma Diseases 0.000 description 1
- 210000004087 cornea Anatomy 0.000 description 1
- 230000034994 death Effects 0.000 description 1
- 230000001419 dependent effect Effects 0.000 description 1
- 238000009795 derivation Methods 0.000 description 1
- 230000004069 differentiation Effects 0.000 description 1
- 235000007124 elderberry Nutrition 0.000 description 1
- 210000002889 endothelial cell Anatomy 0.000 description 1
- 239000003623 enhancer Substances 0.000 description 1
- 230000002708 enhancing effect Effects 0.000 description 1
- 210000000918 epididymis Anatomy 0.000 description 1
- 201000010063 epididymitis Diseases 0.000 description 1
- 108010008594 epithelial membrane protein-1 Proteins 0.000 description 1
- UIWYJDYFSGRHKR-UHFFFAOYSA-N gadolinium atom Chemical compound [Gd] UIWYJDYFSGRHKR-UHFFFAOYSA-N 0.000 description 1
- BTCSSZJGUNDROE-UHFFFAOYSA-N gamma-aminobutyric acid Chemical compound NCCCC(O)=O BTCSSZJGUNDROE-UHFFFAOYSA-N 0.000 description 1
- 210000001035 gastrointestinal tract Anatomy 0.000 description 1
- 238000011223 gene expression profiling Methods 0.000 description 1
- 210000004602 germ cell Anatomy 0.000 description 1
- 125000002566 glucosaminyl group Chemical group 0.000 description 1
- 210000003958 hematopoietic stem cell Anatomy 0.000 description 1
- 238000007489 histopathology method Methods 0.000 description 1
- 210000003016 hypothalamus Anatomy 0.000 description 1
- 238000010324 immunological assay Methods 0.000 description 1
- 238000001727 in vivo Methods 0.000 description 1
- 230000000937 inactivator Effects 0.000 description 1
- 230000006698 induction Effects 0.000 description 1
- 229940079322 interferon Drugs 0.000 description 1
- 238000001361 intraarterial administration Methods 0.000 description 1
- 238000007918 intramuscular administration Methods 0.000 description 1
- 238000001990 intravenous administration Methods 0.000 description 1
- 238000002955 isolation Methods 0.000 description 1
- 210000002510 keratinocyte Anatomy 0.000 description 1
- 210000002429 large intestine Anatomy 0.000 description 1
- 210000000265 leukocyte Anatomy 0.000 description 1
- 239000003446 ligand Substances 0.000 description 1
- 208000003747 lymphoid leukemia Diseases 0.000 description 1
- 239000012139 lysis buffer Substances 0.000 description 1
- 102100031622 mRNA decay activator protein ZFP36 Human genes 0.000 description 1
- 101710098598 mRNA decay activator protein ZFP36 Proteins 0.000 description 1
- 238000002595 magnetic resonance imaging Methods 0.000 description 1
- 239000000463 material Substances 0.000 description 1
- 230000003278 mimic effect Effects 0.000 description 1
- 239000000203 mixture Substances 0.000 description 1
- 238000012986 modification Methods 0.000 description 1
- 230000004048 modification Effects 0.000 description 1
- 210000001616 monocyte Anatomy 0.000 description 1
- 230000000921 morphogenic effect Effects 0.000 description 1
- 230000035772 mutation Effects 0.000 description 1
- 108010037351 nascent-polypeptide-associated complex Proteins 0.000 description 1
- 239000002853 nucleic acid probe Substances 0.000 description 1
- 229920001778 nylon Polymers 0.000 description 1
- 238000002966 oligonucleotide array Methods 0.000 description 1
- 210000003134 paneth cell Anatomy 0.000 description 1
- 230000036961 partial effect Effects 0.000 description 1
- 230000037361 pathway Effects 0.000 description 1
- ACVYVLVWPXVTIT-UHFFFAOYSA-N phosphinic acid Chemical compound O[PH2]=O ACVYVLVWPXVTIT-UHFFFAOYSA-N 0.000 description 1
- 210000002826 placenta Anatomy 0.000 description 1
- 210000002381 plasma Anatomy 0.000 description 1
- 208000015768 polyposis Diseases 0.000 description 1
- 230000003389 potentiating effect Effects 0.000 description 1
- 239000002244 precipitate Substances 0.000 description 1
- 230000002265 prevention Effects 0.000 description 1
- 108010031970 prostasin Proteins 0.000 description 1
- 238000000746 purification Methods 0.000 description 1
- 238000010791 quenching Methods 0.000 description 1
- 230000000171 quenching effect Effects 0.000 description 1
- 150000003254 radicals Chemical class 0.000 description 1
- 108090000327 ribosomal protein L21 Proteins 0.000 description 1
- 108010025387 ribosomal protein L39 Proteins 0.000 description 1
- 108010037046 ribosomal protein L7-L12 Proteins 0.000 description 1
- 108010093046 ribosomal protein S19 Proteins 0.000 description 1
- 108010092942 ribosomal protein S20 Proteins 0.000 description 1
- 108010033786 ribosomal protein S4 Proteins 0.000 description 1
- 102000004337 ribosomal protein S5 Human genes 0.000 description 1
- 108090000902 ribosomal protein S5 Proteins 0.000 description 1
- 108010033800 ribosomal protein S8 Proteins 0.000 description 1
- 201000000306 sarcoidosis Diseases 0.000 description 1
- 238000002416 scanning tunnelling spectroscopy Methods 0.000 description 1
- 238000012216 screening Methods 0.000 description 1
- 210000004739 secretory vesicle Anatomy 0.000 description 1
- 238000012163 sequencing technique Methods 0.000 description 1
- 238000002579 sigmoidoscopy Methods 0.000 description 1
- 238000002603 single-photon emission computed tomography Methods 0.000 description 1
- 230000003381 solubilizing effect Effects 0.000 description 1
- 238000007619 statistical method Methods 0.000 description 1
- 239000004575 stone Substances 0.000 description 1
- 210000002536 stromal cell Anatomy 0.000 description 1
- 238000006467 substitution reaction Methods 0.000 description 1
- 238000001356 surgical procedure Methods 0.000 description 1
- 238000003786 synthesis reaction Methods 0.000 description 1
- 239000012622 synthetic inhibitor Substances 0.000 description 1
- 230000008685 targeting Effects 0.000 description 1
- 208000011317 telomere syndrome Diseases 0.000 description 1
- ZRKFYGHZFMAOKI-QMGMOQQFSA-N tgfbeta Chemical compound C([C@H](NC(=O)[C@H](C(C)C)NC(=O)CNC(=O)[C@H](CCC(O)=O)NC(=O)[C@H](CCCNC(N)=N)NC(=O)[C@H](CC(N)=O)NC(=O)[C@H](CC(C)C)NC(=O)[C@H]([C@@H](C)O)NC(=O)[C@H](CCC(O)=O)NC(=O)[C@H]([C@@H](C)O)NC(=O)[C@H](CC(C)C)NC(=O)CNC(=O)[C@H](C)NC(=O)[C@H](CO)NC(=O)[C@H](CCC(N)=O)NC(=O)[C@@H](NC(=O)[C@H](C)NC(=O)[C@H](C)NC(=O)[C@@H](NC(=O)[C@H](CC(C)C)NC(=O)[C@@H](N)CCSC)C(C)C)[C@@H](C)CC)C(=O)N[C@@H]([C@@H](C)O)C(=O)N[C@@H](C(C)C)C(=O)N[C@@H](CC=1C=CC=CC=1)C(=O)N[C@@H](C)C(=O)N1[C@@H](CCC1)C(=O)N[C@@H]([C@@H](C)O)C(=O)N[C@@H](CC(N)=O)C(=O)N[C@@H](CCC(O)=O)C(=O)N[C@@H](C)C(=O)N[C@@H](CC=1C=CC=CC=1)C(=O)N[C@@H](CCCNC(N)=N)C(=O)N[C@@H](C)C(=O)N[C@@H](CC(C)C)C(=O)N1[C@@H](CCC1)C(=O)N1[C@@H](CCC1)C(=O)N[C@@H](CCCNC(N)=N)C(=O)N[C@@H](CCC(O)=O)C(=O)N[C@@H](CCCNC(N)=N)C(=O)N[C@@H](CO)C(=O)N[C@@H](CCCNC(N)=N)C(=O)N[C@@H](CC(C)C)C(=O)N[C@@H](CC(C)C)C(O)=O)C1=CC=C(O)C=C1 ZRKFYGHZFMAOKI-QMGMOQQFSA-N 0.000 description 1
- 210000001685 thyroid gland Anatomy 0.000 description 1
- 239000005495 thyroid hormone Substances 0.000 description 1
- 229940036555 thyroid hormone Drugs 0.000 description 1
- 230000007704 transition Effects 0.000 description 1
- 230000014621 translational initiation Effects 0.000 description 1
- 238000011282 treatment Methods 0.000 description 1
- 210000004881 tumor cell Anatomy 0.000 description 1
- 238000005199 ultracentrifugation Methods 0.000 description 1
- 238000012285 ultrasound imaging Methods 0.000 description 1
- 238000010200 validation analysis Methods 0.000 description 1
- 238000012795 verification Methods 0.000 description 1
Images




Classifications
-
- C—CHEMISTRY; METALLURGY
- C07—ORGANIC CHEMISTRY
- C07K—PEPTIDES
- C07K14/00—Peptides having more than 20 amino acids; Gastrins; Somatostatins; Melanotropins; Derivatives thereof
- C07K14/435—Peptides having more than 20 amino acids; Gastrins; Somatostatins; Melanotropins; Derivatives thereof from animals; from humans
- C07K14/475—Growth factors; Growth regulators
- C07K14/495—Transforming growth factor [TGF]
-
- C—CHEMISTRY; METALLURGY
- C07—ORGANIC CHEMISTRY
- C07K—PEPTIDES
- C07K14/00—Peptides having more than 20 amino acids; Gastrins; Somatostatins; Melanotropins; Derivatives thereof
- C07K14/435—Peptides having more than 20 amino acids; Gastrins; Somatostatins; Melanotropins; Derivatives thereof from animals; from humans
- C07K14/46—Peptides having more than 20 amino acids; Gastrins; Somatostatins; Melanotropins; Derivatives thereof from animals; from humans from vertebrates
- C07K14/47—Peptides having more than 20 amino acids; Gastrins; Somatostatins; Melanotropins; Derivatives thereof from animals; from humans from vertebrates from mammals
-
- C—CHEMISTRY; METALLURGY
- C07—ORGANIC CHEMISTRY
- C07K—PEPTIDES
- C07K14/00—Peptides having more than 20 amino acids; Gastrins; Somatostatins; Melanotropins; Derivatives thereof
- C07K14/435—Peptides having more than 20 amino acids; Gastrins; Somatostatins; Melanotropins; Derivatives thereof from animals; from humans
- C07K14/705—Receptors; Cell surface antigens; Cell surface determinants
Definitions
- the invention relates to the early detection of colorectal adenoma and carcinoma. In particular it relates to the detection of secreted or cell surface markers in easily collectible bodily samples.
- Colorectal cancer is the second leading cause of cancer death in the United States, with ⁇ 130,000 patients diagnosed each year and ⁇ 50,000 ultimately succumbing to the disease (1).
- Most colorectal cancers develop slowly, beginning as small benign colorectal adenomas which progress over several decades to larger and more dysplastic lesions which eventually become malignant. This gradual progression provides multiple opportunities for prevention and intervention. Indeed, benign adenomas can be detected and removed by simple colonoscopy and polypectomy, precluding the need for radical surgical and adjuvant treatments. It is therefore believed that early detection and removal of these benign neoplasms provides the best hope for minimizing morbidity and mortality from colorectal cancer.
- Various screening methods for detecting early colorectal tumors are available, such as fecal occult blood testing, sigmoidoscopy, and colonoscopy (reviewed in 2). However, none of these methods are optimal, and new approaches are needed.
- a method for detection of benign colorectal adenomas in presymptomatic patients comprising the steps of:
- a method for detection of benign colorectal adenomas in presymptomatic patients comprising the steps of:
- a third embodiment of the invention provides a method for detection of benign colorectal adenoma in a subject that has been administered an antibody which specifically binds to renal dipeptidase and wherein the antibody is labelled with a moiety which is detectable from outside of the subject, comprising:
- the invention provides a method for detection of benign colorectal adenomas in a subject that has been administered an inhibitor of renal dipeptidase wherein the inhibitor is labeled with a moiety which is detectable from outside the subjection, comprising detecting the moiety in the subject from outside of the subject, wherein an area of localization of the moiety within the subject but outside the proximal tubules of the kidney identifies benign colorectal adenoma.
- Another embodiment of the invention provides a method for detection of benign colorectal adenomas in presymptomatic patients, comprising the steps of:
- Still another embodiment of the invention is a method for detection of benign colorectal adenomas in presymptomatic patients, comprising the steps of:
- Fig. 1.A Distribution of the fold changes of differentially expressed transcript tags. Transcripts in which the significance criterion was met (p ⁇ 0.05, a total of 957 tags) in the comparisons between normal and adenoma or normal and cancer are plotted in the figure. The ratios of adenoma to normal and cancer to normal were plotted on a log scale. The shaded box in ( Fig. 1 . A ) and enlarged in ( Fig. 1 . B ) encloses the transcript tags detailed in Table 3. The two unlabeled dots correspond to tags whose differential expression could not be confirmed by quantitative PCR suggesting that the tags were derived from different transcripts than the ones indicated in Table 3.
- Fig. 2 Quantitative PCR analysis of genes elevated in both adenomas and cancers. Quantitation of expression of genes in tumors and matched normal tissues from five patients (Pt) are shown as fold elevation over that in matched normal colonic mucosa. Each bar represents the average of three independent measurements. TGFBI, LYS, RDP, MIC-1, REGA, and DEHL are as described in Table 3.
- Fig. 3 Quantitative PCR analysis of genes decreased in both adenomas and cancers. Quantitation of expression of genes in tumors and matched normal tissue from five patients (Pt) are shown as a fraction of matched normal. Each bar represents the average of three independent measurements.
- CA2 and DRA are described in Table 4. Dual Specificity Phosphatase (DUSP1), and Acid Sphingomylenase-like phosphodiesterase (ASML3a) represented transcripts that were repressed but did not meet the stringent criteria required for inclusion in Table 4. SAGE data indicated that DUSP1 was 5- and 76-fold repressed in adenomas and cancers, respectively. ASML3a was 15-fold repressed in both adenoma and cancer.
- DUSP1 Dual Specificity Phosphatase
- ASML3a Acid Sphingomylenase-like phosphodiesterase
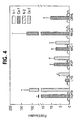
- Fig. 4 Quantitative PCR analysis of mRNA from purified epithelial cells of genes elevated in both adenomas and cancers. Quantitation of expression of genes in the purified normal (N) or cancer (Ca) epithelial cells taken from two patients are shown as fold elevation over matched normal. Genes examined were the same as in Fig. 2 .
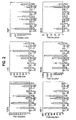
- Fig. 5A - Fig. 5E In-situ hybridization analyses of elevated genes. Genes examined were REGA ( Fig. 5A ), TGFBI ( Fig. 5B ), LYS ( Fig. 5C ), RDP ( Fig. 5D ), and MIC-1 ( Fig. 5E ). Positive cells appear red, arrows point to clusters of malignant epithelial cells, and arrow heads point to macrophages.
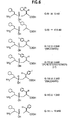
- Inhibitors of renal dipeptidase demonstrate inhibition constants ranging from 0.6 nM to 19.5 nM.
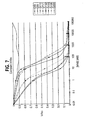
- Fig. 7 A comparison of the inhibitors shown in Fig. 6 . compares the inhibition rate as a function of concentration of inhibitor.
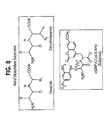
- Fig. 8 Substrates of renal dipeptidase are shown.
- Fig. 9 shows the difference in activity of renal dipeptidase found in adenomas, cancer, and metastases compared to normal colonic tissue.
- Renal Dipeptidase is a marker meeting all of these criteria and may therefore be especially useful as diagnostic tools for the early detection of benign colorectal adenoma in presymptomatic patients.
- the marker can be found and detected in whole blood, serum, plasma, or fractions thereof. These are collectively referred to as "blood” herein.
- the marker can also be found in stool.
- Samples for testing can be feces or processed or fractionated feces. All such samples are referred to herein as "feces.”
- Inhibitors of Renal Dipeptidase can be used as affinity reagents for labeling.
- the inhibitors are those which bind irreversibly.
- they are ones which bind and release, but release at a slow rate.
- Inhibitors with suitably slow release rates are those which have a binding half-life of greater than 30 minutes, or 1, 2, 3, 5, 8, or 10 hours.
- Many inhibitors of Renal Dipeptidase are known, including the commercially available Cilastatin, and phosphinic acid inhibitors. See Parsons et al., "A new class of potent, slowly reversibly dehydropeptidase inhibitors, "Biochemistry International, vol. 23, pp. 1107-1115, 1991 .
- Inhibitors which covalently bind to and/or modify Renal Dipeptidase are also known and can be used. See Wu and Mobashery, "Targeting renal dipeptidase (dehydropeptidase I) for inactivation by mechanism-based inactivators, "J. Med. Chem., vol. 34, pp. 1914-1916,1991 . Some inhibitors mimic transition states between substrates and product. Some useful inhibitors are shown in Fig. 6 . These include inhibitors having halogen substitutions. Such inhibitors can be readily made using radioactive halogens for ready labeling of renal dipeptidase and easy detection. Inhibitors can be labeled using any detectable moiety known in the art, including but not limited to fluors and radioactive atoms.
- RNA for the marker can be detected using any of the known techniques in the art. Preferably an amplification step will be used, because the amount of RNA for the marker is expected to be very small from the sources contemplated. Suitable techniques include RT-PCR, hybridization of copy mRNA (cRNA) to an array of nucleic acid probes, and Northern blotting.
- cRNA copy mRNA
- Protein forms of the marker can be detected using any techniques known in the art. These include activity assays, immunological assays, binding to specific ligands, etc. Particularly suitable assays for Renal Dipeptidase include using L-L amino acid dipeptide substrates and L-D amino acid dipeptide substrates. Substrates which can be used for assaying renal dipeptidase are shown in Fig. 8 , and include the generic structures for dipeptides and dehydrodipeptides. ⁇ (DNP) -L-Lysine-D-Amp can also be used as a substrate, yielding a colored product. Such substrates can be labeled with detectable moieties, including but not limited to fluors and radioactive atoms.
- One particularly useful labeling scheme employs a substrate which is labeled with two moieties on opposite sides of the substrate cleavage site.
- One of the moieties is fluorescent and one of the moieties is a quencher.
- the fluorescence of the fluorescent moiety is quenched.
- the quenching is released and an increase in fluorescence is observed.
- inhibitors can also be labeled and used for detecting the suitable marker.
- antibodies can be used to label protein forms of the marker.
- the antibodies can be labeled as is known in the art.
- Suitable radioactive atoms for use in labeling inhibitors, substrates, and antibodies include In-111, I-123, Tc-99m, Re-186, Re-188, Ga-67, Ga-68, T1-201, Fe-52, Pb-203, Co-58, Cu-64, I-124, I-125, I-131, At-210, Br-76, Br-77, and F-18 and others known in the art for such purposes.
- Contrast enhancement agents can also be attached to the substrates, inhibitors, or antibodies. Such agents include gadolinium.
- imaging techniques can be used to detect such labels within the body.
- An example of an imaging technique which can be used is spiral computer tomography.
- the detecting agent, such as inhibitor or antibody can be linked to a contrast enhancing agent.
- detection means that can be used include gamma cameras, magnetic resonance imaging, planar scintigraphic imaging, SPECT imaging, PET imaging, and ultrasound imaging.
- the marker can be detected both in situ in the body or in vitro in an isolated body sample.
- Epithelial cells can be isolated from blood or other tissue samples to enrich for the marker or the mRNAs.
- Epithelial cells can be isolated, inter alia, by immunoaffinity techniques. Such a technique is described in more detail below.
- Substrates of the marker can be administered to subjects and the reaction products measured in body samples.
- Inhibitors can be administered to subjects and the subject can be imaged to detect the inhibitor bound to the marker.
- Typical modes of administration of such agents can be any which is suitable, including but not limited to per os, intravenous, intramuscular, intraarterial, subdermal, transdermal, and rectal.
- a high background of the marker may obscure detection of increased expression.
- Tumor-specific glycoforms of Renal Dipeptidase bind to LPHA, an L lectin from Phaseolus vulgaris hemagglutinin, and thus can be distinguished on that basis.
- Other lectins such as with similar specificity for tumor-specific glycoforms, such as Sambucus Nigra Lectin isolated from Sambucus nigra (elderberry) bark can be used as well.
- Normal subjects are used as a comparison to the test subjects to determine whether the amounts of the marker observed in the feces or blood are elevated.
- the normal subjects Preferably have been confirmed as tumor-free by colonoscopy. More preferably several samples are pooled or their individual values are averaged to arrive at a normal value.
- Regenerating Islet Derived Pancreatic Stone Protein is a secreted polypeptide first found in pancreatic precipitates and stones from patients suffering from chronic pancreatitis (7).
- the cDNA encoding this protein was isolated from a random screen of genes highly expressed in a regenerating-islet derived cDNA library (8) and subsequently shown to be elevated in colorectal cancers (9).
- REGA was isolated in a hybridization-based screen for genes elevated in colorectal cancers and shown to be elevated in many colorectal adenocarcinomas (10).
- TGFB-induced gene encodes a small polypeptide of unknown function initially isolated through a differential display screen for genes induced in response to treatment with TGF ⁇ (11).
- the protein is expressed in the keratinocytes of the cornea (12) and, interestingly, germline mutations of this gene cause familial corneal dystrophies (13).
- TGFBI was previously shown to be among the most significantly elevated genes in colorectal cancers (4), and our new data show that it is expressed at high levels in adenomas as well. Quantitative PCR results demonstrated strong elevation both in unpurified tumors and purified tumor epithelial cells. Accordingly, in situ hybridization experiments revealed TGFBI to be expressed in many cell types, in both the stromal and epithelial compartments ( Fig. 5B ).
- Lysozyme (LYS, 1,4- ⁇ -N-acetylmuramidase, EC 3.2.1.17) is an enzyme with bacteriolytic activity (14) capable of cleaving ⁇ -1,4 glycosidic bonds found in the cell walls of gram-positive bacteria. The enzyme is expressed in the secretory granules of monocytes, macrophages and leukocytes, as well as in the Paneth cells of the gastrointestinal tract. Fecal lysozyme levels are dramatically elevated in patients with inflammatory bowel disease (15, 16), and serum lysozyme activity is significantly elevated in patients with sarcoidosis (17), both of which are diseases characterized by aberrant chronic inflammation.
- LYS The expression of LYS in the macrophage compartment of colorectal tumors was also supported by its high representation in a SAGE library constructed from hematopoietic cells (CD45+, CD64+, CD14+) purified from colorectal tumors (602 LYS tags/56,643 total tags) (6).
- RDP renal dipeptidase
- the gene identified in the current study is renal dipeptidase (RDP ).
- RDP is a GPI-anchored enzyme whose major site of expression is the epithelial cells of the proximal tubules of the kidney (reviewed in (19)).
- the enzyme has been extensively analyzed with respect to its catalytic mechanism and inhibition kinetics by a variety of synthetic inhibitors.
- RDP is unique among the dipeptidases in that it can cleave amide bonds in which the C-terminal partner is a D amino acid, providing excellent opportunity for the development of specific probes for its detection in vivo.
- Quantitative PCR revealed RDP to be markedly elevated in both unpurified and purified tumor epithelial cells, and in situ hybridization experiments showed that RDP was exclusively localized to epithelial cells of colorectal tumors ( Fig. 5D ).
- Macrophage Inhibitory Cytokine is a small polypeptide of 16 kDa first isolated from a differential screen for genes that were induced upon macrophage activation (20). Concurrently, it was identified in the IMAGE database by a search for molecules homologous to the Bone Morphogenic Protein/TGF ⁇ family of growth and differentiation factors (21). In addition to being highly expressed in activated macrophages, MIC-1 has been noted to be highly expressed in placenta and the epithelial cells of normal prostate. In the current study, we found MIC-1 expression to be elevated between 7 and 133 fold in the unpurified tumors.
- SAGE is a gene expression profiling method that associates individual mRNA transcripts with 15-base tags derived from specific positions near their 3' termini (3). The abundance of each tag provides a quantitative measure of the transcript level present within the mRNA population studied. SAGE is not dependent on pre-existing databases of expressed genes, and therefore provides an unbiased view of gene expression profiles.
- Table 2 Differentially expressed transcripts in benign and malignant tumor colorectal tissue Fold change in expression Elevated in adenomas a Elevated in cancers a Elevated in both adenomas and cancer a Repressed in adenomas b Repressed in cancers b Repressed in both adenomas and cancers b Total transcripts differentially expressed 2 346 170 50 313 380 192 957 4 263 119 23 225 270 117 735 10 160 79 10 134 157 58 462 20 49 40 9 72 52 23 181 a Elevated transcripts showed a significantly different (P ⁇ 0.05) tag count between normal and tumor tissue, were expressed in both tumor tissues analyzed, and had an expression level that was higher in the tumors than in the normals by the fold indicated in column one.
- 0.5 was substituted for the denominator when no tags were detected in the normal samples.
- b Repressed transcripts showed a significantly different (P ⁇ 0.05) tag count between normal and tumor tissue, were expressed in both normal tissues analyzed and had an expression level that was lower in the tumors than in the normals by the fold indicated in column one.
- the quantitative PCR experiments verified that five of the six selected genes (TGFBI, LYS, RDP, MIC-1, REGA) were expressed at significantly higher levels in every neoplastic sample analyzed compared to patient-matched normal mucosa ( Fig. 2 ).
- Several tumors exhibited ⁇ 20-fold higher levels of the studied transcripts compared to their patient-matched normal colonic mucosa, as predicted by SAGE.
- Another control was provided by the quantitative PCR analysis of four genes whose expression was observed to be reduced in the SAGE libraries prepared from adenomas and cancers compared to those from normal colonic mucosa.
- the quantitative PCR confirmed the lower levels of expression of each of these genes, emphasizing that the dramatic elevations in expression observed in Fig. 2 represented gene-specific phenomena.
- Quantitative PCR Tumors were collected, snap frozen, and stored at -80°C. They were verified to be predominantly composed of neoplastic cells by histopathological analysis. mRNA was isolated from tumors, and patient-matched normal colonic mucosa using QuickPrep reagents (Amersham Pharmacia Biotech UK, Buckinghamshire, England), and single-stranded cDNA was synthesized using Superscript II (Life Technologies, Gaithersburg, MD). Quantitative PCR was performed using an iCycler (Bio-Rad, Hercules, CA), and threshold cycle numbers determined using iCycler software, version 2.1. Reactions were performed in triplicate and threshold cycle numbers averaged.
- Tumor epithelial cells were purified using a modification of the procedure previously developed for the isolation of tumor endothelial cells (6).
- fresh surgical specimens of tumor and matched normal tissue were obtained and digested with collagenase and the resulting material filtered through a nylon mesh to obtain single cell suspensions.
- the cells were then bound to a mixture of anti-CD14 and anti-CD45 immunomagnetic beads (Dynal, Oslo, Norway) to deplete the population of hematopoetic cells (negative selection).
- the remaining cell suspension was then incubated with anti-Ber-EP4 immunomagnetic beads to isolate epithelial cells (positive selection).
- Purified cells were lysed directly on the beads and mRNA purified using QuickPrep reagents (Amersham Pharmacia Biotech UK, Buckinghamshire, England).
Landscapes
- Health & Medical Sciences (AREA)
- Chemical & Material Sciences (AREA)
- Life Sciences & Earth Sciences (AREA)
- Organic Chemistry (AREA)
- Medicinal Chemistry (AREA)
- Toxicology (AREA)
- Biochemistry (AREA)
- Biophysics (AREA)
- General Health & Medical Sciences (AREA)
- Genetics & Genomics (AREA)
- Zoology (AREA)
- Molecular Biology (AREA)
- Proteomics, Peptides & Aminoacids (AREA)
- Gastroenterology & Hepatology (AREA)
- Cell Biology (AREA)
- Immunology (AREA)
- Measuring Or Testing Involving Enzymes Or Micro-Organisms (AREA)
- Investigating Or Analysing Materials By The Use Of Chemical Reactions (AREA)
- Medicines Containing Antibodies Or Antigens For Use As Internal Diagnostic Agents (AREA)
- Micro-Organisms Or Cultivation Processes Thereof (AREA)
- Walking Sticks, Umbrellas, And Fans (AREA)
Abstract
Description
- The invention relates to the early detection of colorectal adenoma and carcinoma. In particular it relates to the detection of secreted or cell surface markers in easily collectible bodily samples.
- Colorectal cancer is the second leading cause of cancer death in the United States, with ∼130,000 patients diagnosed each year and ∼50,000 ultimately succumbing to the disease (1). Most colorectal cancers develop slowly, beginning as small benign colorectal adenomas which progress over several decades to larger and more dysplastic lesions which eventually become malignant. This gradual progression provides multiple opportunities for prevention and intervention. Indeed, benign adenomas can be detected and removed by simple colonoscopy and polypectomy, precluding the need for radical surgical and adjuvant treatments. It is therefore believed that early detection and removal of these benign neoplasms provides the best hope for minimizing morbidity and mortality from colorectal cancer. Various screening methods for detecting early colorectal tumors are available, such as fecal occult blood testing, sigmoidoscopy, and colonoscopy (reviewed in 2). However, none of these methods are optimal, and new approaches are needed.
- In a first embodiment a method is provided for detection of benign colorectal adenomas in presymptomatic patients, comprising the steps of:
- isolating an mRNA sample from feces of a subject;
- detecting renal dipeptidase mRNA in said mRNA sample;
- comparing the amount of renal dipeptidase mRNA in said mRNA sample to amounts of renal dipeptidase mRNA in normal subjects, wherein an elevated amount of renal dipeptidase mRNA in said mRNA sample is an indicator of benign colorectal adenoma in the subject.
- According to another embodiment of the invention a method is provided for detection of benign colorectal adenomas in presymptomatic patients, comprising the steps of:
- isolating epithelial cells from blood of a subject;
- isolating an mRNA sample from the epithelial cells;
- detecting renal dipeptidase mRNA in said mRNA sample;
- comparing the amount of renal dipeptidase RNA in said mRNA sample to amounts of renal dipeptidase mRNA in normal subjects, wherein an elevated amount of renal dipeptidase mRNA in said mRNA sample is an indicator of benign colorectal adenoma in the subject.
- A third embodiment of the invention provides a method for detection of benign colorectal adenoma in a subject that has been administered an antibody which specifically binds to renal dipeptidase and wherein the antibody is labelled with a moiety which is detectable from outside of the subject, comprising:
- detecting the moiety in the subject from outside of the subject, where an area of localization of the moiety within the subject but outside the proximal tubules of the kidney identifies benign colorectal adenoma.
- According to another embodiment the invention provides a method for detection of benign colorectal adenomas in a subject that has been administered an inhibitor of renal dipeptidase wherein the inhibitor is labeled with a moiety which is detectable from outside the subjection, comprising detecting the moiety in the subject from outside of the subject, wherein an area of localization of the moiety within the subject but outside the proximal tubules of the kidney identifies benign colorectal adenoma.
- Another embodiment of the invention provides a method for detection of benign colorectal adenomas in presymptomatic patients, comprising the steps of:
- detecting renal dipeptidase in blood of a subject; and
- comparing amount of renal dipeptidase in blood of the subject to the amount of renal dipeptidase in normal subjects, wherein an elevated amount of renal dipeptidase in the blood of the subject is an indicator of benign colorectal adenoma in the subject.
- Still another embodiment of the invention is a method for detection of benign colorectal adenomas in presymptomatic patients, comprising the steps of:
- detecting renal dipeptidase in feces of a subject; and
- comparing amount of renal dipeptidase in feces of the subject to the amount of renal dipeptidase in normal subjects, wherein an elevated amount of renal dipeptidase in the feces of the subject is an indicator of benign colorectal adenoma in the subject.
-
Fig. 1.A , Distribution of the fold changes of differentially expressed transcript tags. Transcripts in which the significance criterion was met (p<0.05, a total of 957 tags) in the comparisons between normal and adenoma or normal and cancer are plotted in the figure. The ratios of adenoma to normal and cancer to normal were plotted on a log scale. The shaded box in (Fig. 1 .A) and enlarged in (Fig. 1 .B) encloses the transcript tags detailed in Table 3. The two unlabeled dots correspond to tags whose differential expression could not be confirmed by quantitative PCR suggesting that the tags were derived from different transcripts than the ones indicated in Table 3. -
Fig. 2 . Quantitative PCR analysis of genes elevated in both adenomas and cancers. Quantitation of expression of genes in tumors and matched normal tissues from five patients (Pt) are shown as fold elevation over that in matched normal colonic mucosa. Each bar represents the average of three independent measurements. TGFBI, LYS, RDP, MIC-1, REGA, and DEHL are as described in Table 3. -
Fig. 3 . Quantitative PCR analysis of genes decreased in both adenomas and cancers. Quantitation of expression of genes in tumors and matched normal tissue from five patients (Pt) are shown as a fraction of matched normal. Each bar represents the average of three independent measurements. CA2 and DRA are described in Table 4. Dual Specificity Phosphatase (DUSP1), and Acid Sphingomylenase-like phosphodiesterase (ASML3a) represented transcripts that were repressed but did not meet the stringent criteria required for inclusion in Table 4. SAGE data indicated that DUSP1 was 5- and 76-fold repressed in adenomas and cancers, respectively. ASML3a was 15-fold repressed in both adenoma and cancer. -
Fig. 4 . Quantitative PCR analysis of mRNA from purified epithelial cells of genes elevated in both adenomas and cancers. Quantitation of expression of genes in the purified normal (N) or cancer (Ca) epithelial cells taken from two patients are shown as fold elevation over matched normal. Genes examined were the same as inFig. 2 . -
Fig. 5A - Fig. 5E . In-situ hybridization analyses of elevated genes. Genes examined were REGA (Fig. 5A ), TGFBI (Fig. 5B ), LYS (Fig. 5C ), RDP (Fig. 5D ), and MIC-1 (Fig. 5E ). Positive cells appear red, arrows point to clusters of malignant epithelial cells, and arrow heads point to macrophages. -
Fig. 6 . Inhibitors of renal dipeptidase demonstrate inhibition constants ranging from 0.6 nM to 19.5 nM. -
Fig. 7 . A comparison of the inhibitors shown inFig. 6 . compares the inhibition rate as a function of concentration of inhibitor. -
Fig. 8 . Substrates of renal dipeptidase are shown. -
Fig. 9 shows the difference in activity of renal dipeptidase found in adenomas, cancer, and metastases compared to normal colonic tissue. - It is a finding of the present invention that particular genes are aberrantly and consistently expressed in both adenomas and carcinomas of the colon. Products of such genes provide cellular and serum markers for colorectal neoplasia. The ideal tumor marker would be expected to have several characteristics. First, it should be expressed at high levels in tumors and at greatly reduced levels in normal tissues. Second the elevated expression should occur early and remain elevated during the neoplastic process. Third, such a marker should be elevated in the majority of clinical samples. Fourth, the marker should be cell surface or secreted to facilitate its detection. We have identified Renal Dipeptidase as being a marker meeting all of these criteria and may therefore be especially useful as diagnostic tools for the early detection of benign colorectal adenoma in presymptomatic patients.
- The marker can be found and detected in whole blood, serum, plasma, or fractions thereof. These are collectively referred to as "blood" herein. The marker can also be found in stool. Samples for testing can be feces or processed or fractionated feces. All such samples are referred to herein as "feces."
- Inhibitors of Renal Dipeptidase can be used as affinity reagents for labeling. Preferably the inhibitors are those which bind irreversibly. Alternatively they are ones which bind and release, but release at a slow rate. Inhibitors with suitably slow release rates are those which have a binding half-life of greater than 30 minutes, or 1, 2, 3, 5, 8, or 10 hours. Many inhibitors of Renal Dipeptidase are known, including the commercially available Cilastatin, and phosphinic acid inhibitors. See Parsons et al., "A new class of potent, slowly reversibly dehydropeptidase inhibitors, "Biochemistry International, vol. 23, pp. 1107-1115, 1991. Inhibitors which covalently bind to and/or modify Renal Dipeptidase are also known and can be used. See Wu and Mobashery, "Targeting renal dipeptidase (dehydropeptidase I) for inactivation by mechanism-based inactivators, "J. Med. Chem., vol. 34, pp. 1914-1916,1991. Some inhibitors mimic transition states between substrates and product. Some useful inhibitors are shown in
Fig. 6 . These include inhibitors having halogen substitutions. Such inhibitors can be readily made using radioactive halogens for ready labeling of renal dipeptidase and easy detection. Inhibitors can be labeled using any detectable moiety known in the art, including but not limited to fluors and radioactive atoms. - RNA for the marker can be detected using any of the known techniques in the art. Preferably an amplification step will be used, because the amount of RNA for the marker is expected to be very small from the sources contemplated. Suitable techniques include RT-PCR, hybridization of copy mRNA (cRNA) to an array of nucleic acid probes, and Northern blotting.
- Protein forms of the marker can be detected using any techniques known in the art. These include activity assays, immunological assays, binding to specific ligands, etc. Particularly suitable assays for Renal Dipeptidase include using L-L amino acid dipeptide substrates and L-D amino acid dipeptide substrates. Substrates which can be used for assaying renal dipeptidase are shown in
Fig. 8 , and include the generic structures for dipeptides and dehydrodipeptides. ε (DNP) -L-Lysine-D-Amp can also be used as a substrate, yielding a colored product. Such substrates can be labeled with detectable moieties, including but not limited to fluors and radioactive atoms. One particularly useful labeling scheme employs a substrate which is labeled with two moieties on opposite sides of the substrate cleavage site. One of the moieties is fluorescent and one of the moieties is a quencher. When the two moieties are close, as in an intact substrate, the fluorescence of the fluorescent moiety is quenched. Upon cleavage the quenching is released and an increase in fluorescence is observed. - As mentioned above, inhibitors can also be labeled and used for detecting the suitable marker. In addition, antibodies can be used to label protein forms of the marker. The antibodies can be labeled as is known in the art. Suitable radioactive atoms for use in labeling inhibitors, substrates, and antibodies include In-111, I-123, Tc-99m, Re-186, Re-188, Ga-67, Ga-68, T1-201, Fe-52, Pb-203, Co-58, Cu-64, I-124, I-125, I-131, At-210, Br-76, Br-77, and F-18 and others known in the art for such purposes. Contrast enhancement agents can also be attached to the substrates, inhibitors, or antibodies. Such agents include gadolinium. Moreover, imaging techniques can be used to detect such labels within the body. An example of an imaging technique which can be used is spiral computer tomography. For this technique, the detecting agent, such as inhibitor or antibody can be linked to a contrast enhancing agent.
- Other detection means that can be used include gamma cameras, magnetic resonance imaging, planar scintigraphic imaging, SPECT imaging, PET imaging, and ultrasound imaging. Thus the marker can be detected both in situ in the body or in vitro in an isolated body sample.
- Epithelial cells can be isolated from blood or other tissue samples to enrich for the marker or the mRNAs. Epithelial cells can be isolated, inter alia, by immunoaffinity techniques. Such a technique is described in more detail below.
- Substrates of the marker can be administered to subjects and the reaction products measured in body samples. Inhibitors can be administered to subjects and the subject can be imaged to detect the inhibitor bound to the marker. Typical modes of administration of such agents can be any which is suitable, including but not limited to per os, intravenous, intramuscular, intraarterial, subdermal, transdermal, and rectal.
- A high background of the marker may obscure detection of increased expression. In such a situation, one can use tumor-specific glycoforms as a means of distinguishing between the background marker and the marker that is due to the tumor. Tumor-specific glycoforms of Renal Dipeptidase bind to LPHA, an L lectin from Phaseolus vulgaris hemagglutinin, and thus can be distinguished on that basis. Other lectins such as with similar specificity for tumor-specific glycoforms, such as Sambucus Nigra Lectin isolated from Sambucus nigra (elderberry) bark can be used as well.
- Normal subjects are used as a comparison to the test subjects to determine whether the amounts of the marker observed in the feces or blood are elevated. Preferably the normal subjects have been confirmed as tumor-free by colonoscopy. More preferably several samples are pooled or their individual values are averaged to arrive at a normal value.
- Some of the most highly overexpressed genes found in colorectal adenomas and colorectal cancers are discussed below. Regenerating Islet Derived Pancreatic Stone Protein, encoded by the REGA gene, is a secreted polypeptide first found in pancreatic precipitates and stones from patients suffering from chronic pancreatitis (7). The cDNA encoding this protein was isolated from a random screen of genes highly expressed in a regenerating-islet derived cDNA library (8) and subsequently shown to be elevated in colorectal cancers (9). More recently, REGA was isolated in a hybridization-based screen for genes elevated in colorectal cancers and shown to be elevated in many colorectal adenocarcinomas (10). Consistent with these published observations, we observed a strong elevation in expression of REGA in unpurified tumors, and a similar elevation in one purified tumor. In situ hybridization experiments demonstrated REGA to be strongly expressed in the epithelial cells of the tumors, with no expression evident in the stroma (
Fig. 5A ). - TGFB-induced gene (TGFBI) encodes a small polypeptide of unknown function initially isolated through a differential display screen for genes induced in response to treatment with TGF β (11). The protein is expressed in the keratinocytes of the cornea (12) and, interestingly, germline mutations of this gene cause familial corneal dystrophies (13). TGFBI was previously shown to be among the most significantly elevated genes in colorectal cancers (4), and our new data show that it is expressed at high levels in adenomas as well. Quantitative PCR results demonstrated strong elevation both in unpurified tumors and purified tumor epithelial cells. Accordingly, in situ hybridization experiments revealed TGFBI to be expressed in many cell types, in both the stromal and epithelial compartments (
Fig. 5B ). - Lysozyme (LYS, 1,4-β-N-acetylmuramidase, EC 3.2.1.17) is an enzyme with bacteriolytic activity (14) capable of cleaving β-1,4 glycosidic bonds found in the cell walls of gram-positive bacteria. The enzyme is expressed in the secretory granules of monocytes, macrophages and leukocytes, as well as in the Paneth cells of the gastrointestinal tract. Fecal lysozyme levels are dramatically elevated in patients with inflammatory bowel disease (15, 16), and serum lysozyme activity is significantly elevated in patients with sarcoidosis (17), both of which are diseases characterized by aberrant chronic inflammation. Furthermore, lysozyme immunoreactivity has been observed in the epithelial cells of both adenomas and carcinomas of the large intestine (18). In our study, the degree of elevation of expression of LYS varied from 4-fold to 55-fold in the unpurified samples. In contrast, the degree of elevation of expression of LYS observed in purified epithelial cells was only 2-5 fold. This suggested that a substantial portion of the expression for this gene in the tumors could have been derived from non-epithelial cells. Consistent with this hypothesis, in situ hybridization experiments revealed that the majority of LYS mRNA was present in a stromal component that appeared to be macrophages (
Fig. 5C ). The expression of LYS in the macrophage compartment of colorectal tumors was also supported by its high representation in a SAGE library constructed from hematopoietic cells (CD45+, CD64+, CD14+) purified from colorectal tumors (602 LYS tags/56,643 total tags) (6). - The gene identified in the current study is renal dipeptidase (RDP). RDP is a GPI-anchored enzyme whose major site of expression is the epithelial cells of the proximal tubules of the kidney (reviewed in (19)). The enzyme has been extensively analyzed with respect to its catalytic mechanism and inhibition kinetics by a variety of synthetic inhibitors. RDP is unique among the dipeptidases in that it can cleave amide bonds in which the C-terminal partner is a D amino acid, providing excellent opportunity for the development of specific probes for its detection in vivo. Quantitative PCR revealed RDP to be markedly elevated in both unpurified and purified tumor epithelial cells, and in situ hybridization experiments showed that RDP was exclusively localized to epithelial cells of colorectal tumors (
Fig. 5D ). - Macrophage Inhibitory Cytokine (MIC-1) is a small polypeptide of 16 kDa first isolated from a differential screen for genes that were induced upon macrophage activation (20). Concurrently, it was identified in the IMAGE database by a search for molecules homologous to the Bone Morphogenic Protein/TGF β family of growth and differentiation factors (21). In addition to being highly expressed in activated macrophages, MIC-1 has been noted to be highly expressed in placenta and the epithelial cells of normal prostate. In the current study, we found MIC-1 expression to be elevated between 7 and 133 fold in the unpurified tumors. As observed for LYS, the purified tumor cells demonstrated significant but less elevation of expression of MIC-1 (5 to 7-fold) indirectly implicating stromal expression to be partly responsible for the dramatic elevation seen in some tumors. Consistent with this hypothesis, in situ hybridization experiments revealed expression in both the epithelium of the tumor, and in a cell type resembling infiltrating macrophages (
Fig. 5E ). - In an effort to identify potential molecular markers of early colorectal tumors, we have here analyzed gene expression in benign and malignant colorectal tumors in an unbiased and comprehensive fashion. We used SAGE to analyze global gene expression in normal, benign and malignant colorectal tissue. SAGE is a gene expression profiling method that associates individual mRNA transcripts with 15-base tags derived from specific positions near their 3' termini (3). The abundance of each tag provides a quantitative measure of the transcript level present within the mRNA population studied. SAGE is not dependent on pre-existing databases of expressed genes, and therefore provides an unbiased view of gene expression profiles. For the current study, SAGE libraries derived from two samples of normal colonic epithelium, two colorectal adenomas, and two colorectal cancers were analyzed. These libraries contained a combined total of 290,394 transcript tags representing 21,343 different transcripts (Table 1).
Tables 1-Summary of SAGE data SAGE Library Total number of tags observed Number of different transcripts observed * Normal Colorectal Epithelium NC-1 49,610 9,359 NC-2 48,479 9,610 Adenomas Ad-A 52,573 11,167 Ad-B 42,661 9,483 Cancers Tu-98 41,371 9,780 Tu-102 55,700 11,039 Total 290,394 21,343 * To minimize the effect of potential sequencing errors, only tags observed more than once in a given SAGE library were counted to give a conservative estimate of the minimum number of different transcripts analyzed. - Two comparisons were performed, one between the adenoma and normal samples, and one between the cancer and normal samples. These comparisons revealed 957 transcript tags that were differentially expressed more than 2-fold between normal and tumor tissue (Table 2). A comparison of the fold change in adenomas versus cancers revealed that many transcripts were similarly elevated or repressed in both adenomas and cancers although the magnitude often varied (
Fig. 1A ). Indeed the majority (79%) of comparisons were in quadrants of the plot indicative of concordant elevation.Table 2 - Differentially expressed transcripts in benign and malignant tumor colorectal tissue Fold change in expression Elevated in adenomasa Elevated in cancersa Elevated in both adenomas and cancera Repressed in adenomasb Repressed in cancersb Repressed in both adenomas and cancersb Total transcripts differentially expressed 2 346 170 50 313 380 192 957 4 263 119 23 225 270 117 735 10 160 79 10 134 157 58 462 20 49 40 9 72 52 23 181 aElevated transcripts showed a significantly different (P<0.05) tag count between normal and tumor tissue, were expressed in both tumor tissues analyzed, and had an expression level that was higher in the tumors than in the normals by the fold indicated in column one. For the purposes of calculation, 0.5 was substituted for the denominator when no tags were detected in the normal samples.
bRepressed transcripts showed a significantly different (P<0.05) tag count between normal and tumor tissue, were expressed in both normal tissues analyzed and had an expression level that was lower in the tumors than in the normals by the fold indicated in column one. - From both practical and biological perspectives, those changes showing the greatest magnitude were deemed the most interesting. In this regard, 49 tags were identified to be elevated by ≥20-fold in the adenomas and 40 were elevated by ≥20-fold in the cancers (Table 2). Conversely, there were 72 transcripts that were decreased by ≥20-fold in adenomas and 52 decreased by ≥20-fold in the cancers (Table 2).
- There were nine transcripts that were elevated by ≥20-fold in both adenomas and cancers (
Fig. 1B and Table 3) and 23 that were repressed by ≥20-fold (Table 4). We were especially interested in genes whose products were predicted to be secreted or displayed on the cell surface, as these would be particularly suitable for the development of serologic or imaging tests for presymptomatic neoplasia, respectively. We were able to identify six such genes (TGFBI, LYS, RDP, MIC-1, REGA and DEHL) from among those whose transcript tags were elevated in both adenoma and carcinoma SAGE libraries.Table 3. Transcripts most elevated in adenomas and cancersa Normal Adenomas Cancers Tag Sequence NC-1 NC-2 AD-A1 AD-B2 Tu-98 Tu-102 Transcript name ATGTAAAAAA 0 0 26 32 2 12 Lysozyme (LYS) TAATTTTTGC 0 1 99 12 20 37 Differentially Expressed in Hematopoietic Lineages (DEHL) GTGTGTTTGT 0 0 17 29 17 15 Transforming Growth Factor, Beta-Induced (TGFBI) GTGCTCATTC 0 0 13 7 2 10 Macrophage Inhibitory Cytokine, 1 (MIC-1) TTCCAGCTGC 0 0 7 6 2 9 Adaptor-related Protein Complex 2,alpha 2 subunitbACCATTGGAT 0 0 3 10 3 9 Interferon Induced Transmembrane Protein 1 (9-27)b TTTCCACTAA 0 0 8 4 4 6 Regenerating Islet-Derived 1 alpha (REGA) CAAGGACCAG 0 0 5 6 10 12 Renal Dipeptidase, (RDP) AGGACCATCG 0 0 8 2 1 18 Defensin, Alpha 5, Paneth cell-specificca These tags displayed at least twenty fold elevation in both neoplastic states. The numbers given are the raw tag counts for each tag observed in each library. Transcript name provides a description of matching UniGene cluster (Build 3/13/01). Rows shown in bold are genes confirmed by quantitative PCR to be differentially expressed.
bDifferential expression could not be confirmed by quantitative PCR suggesting that the tag was derived from a different transcript than the one indicated.
c Not tested.Table 4. Transcripts most repressed in adenomas and cancersa Normal Adenoma Cancer Tag Sequence NC-1 NC2 AD-A1 AD-B Tu-981 Tu-102 UNI ID Transcript name GTCATCACCA 35 22 0 0 0 0 32966 Guanylate Cyclase Activator 2B CCTTCAAATC 29 17 0 0 1 0 23118 Carbonic Anhydrase I TCTGAATTAT 24 16 0 0 1 0 50964 Carcinoembryonic Antigen-Related Cell Adhesion Molecule 1 TTATGGTGTG 11 17 0 0 0 0 271499 ESTs CTGGCAAAGG 14 22 1 0 0 0 72789 hypothetical protein FLJ20217 AGGTGACTGG 10 14 0 0 0 0 No Match CTTATGGTCC 36 11 0 1 1 0 179608 Retinol Dehydrogenase Homolog ATGATGGCAC 12 32 1 0 1 0 84072 Transmembrane 4 Superfamily Member 3 GTCCGAGTGC 17 3 0 0 0 0 3337 Transmembrane 4 Superfamily Member 1 ATTTCAAGAT 35 21 0 2 1 0 155097 Carbonic Anhydrase II (CA2) CAAGAGTTTC 14 2 0 0 0 0 183617 ESTs GCCATCCTCC 9 13 0 1 0 0 No Match ACCCAACTGC 12 3 0 0 0 0 232604 Homo sapiens cDNA: FLJ22675 fis, clone HSI10553 GCCCACGTCA 7 8 0 0 0 0 No Match TTTGGTTTCA 2 13 0 0 0 0 No Match CTCAGAACTT 18 3 1 0 0 0 194710 N-acetylglucosaminyl transferase 3, mucin type CCAACACCAG 9 19 1 0 0 1 181165 Eukaryotic Translation Elongation Factor I Alpha I GCCACATACT 3 9 0 0 0 0 4984 KIAA0828 protein GTATTGGGGC 5 7 0 0 0 0 No Match CCGGCTTGAG 7 4 0 0 0 0 2722 Inositol 1,4,5-trisphosphate 3-Kinase A GATATGTAAA 1 10 0 0 0 0 227059 Chloride Channel, Calcium Activated, Family Member 4 CATAGGTTTA 66 39 4 1 5 0 1650 Solute Carrier Family 26, member 3 (DRA) GTCCTGAACA 7 3 0 0 0 0 78546 ATPase, Ca++ Transporting, Plasma Membrane 1 a These tags displayed at least twenty fold decrease in both neoplastic states. The numbers given are the raw tag counts for each tag observed in each library. Transcript name provides a description of matching UniGene cluster (Build 3/13/01). Rows shown in bold are genes that were tested and confirmed by quantitative PCR to be differentially expressed. - SAGE. For the initial SAGE3 of benign tumors, fresh adenomas were obtained from surgical specimens derived from FAP patients. Adenomas from FAP patients were employed because of the ready availability of small lesions and the certainty of inactivation of the APC pathway which initiates the formation of the majority of sporadic tumors. After histopathological verification of the neoplastic nature of the lesion (>70% neoplastic cells), total RNA was isolated by solubilizing the tissue in RNAgents Lysis Buffer (Promega, Madison, WI) followed by ultracentrifugation over a cesium chloride gradient. mRNA selection was performed from the purified total RNA using oligo(dT) cellulose (Life Technologies, Gaithersburg, MD). Two adenoma SAGE libraries were prepared as described (3, 4) and sequenced to a total depth of over 90,000 transcript tags. For SAGE of normal and malignant tissues, four previously described normal (NC-1 and NC-2) and primary cancer (Tu-98 and Tu-102) SAGE libraries were employed (4). In collaboration with the Cancer Genome Anatomy Project (CGAP) (5), the analyses of these libraries was extended from a total of 123,046 transcripts in the previously published work to 195,160 transcripts in the current work. Tags were extracted from the raw sequence data and, after excluding repeated ditags, linker sequences, and tags from the polymorphic Major Histocompatibility loci, the resulting tag libraries were compared and statistical analysis performed using SAGE software, version 4.0. Data from the libraries are publicly available at the Uniform Resource Locator (URL) address for the http file type found on the www host server that has a domain name of ncbi.nlm.nih.gov, and a path to the directory SAGE, and detailed SAGE protocols are available at the Uniform Resource Locator (URL) address for the http file type found on the www host server that has a domain name of sagenet.org, and file name of sage_protocol.htm.
- To verify the increased expression of these six genes, we used quantitative RT-PCR techniques to analyze the expression in seven colorectal neoplasms (three sporadic adenomas and four sporadic cancers) and matched normal colonic mucosa. For these assays, specific primers were developed that resulted in amplification from cDNA but not genomic DNA. Controls were provided by similar quantitative PCR assays of a gene whose expression was found to be very similar in the SAGE libraries of normal and neoplastic colon (β-amyloid precursor protein). The quantitative PCR experiments verified that five of the six selected genes (TGFBI, LYS, RDP, MIC-1, REGA) were expressed at significantly higher levels in every neoplastic sample analyzed compared to patient-matched normal mucosa (
Fig. 2 ). Several tumors exhibited ≥20-fold higher levels of the studied transcripts compared to their patient-matched normal colonic mucosa, as predicted by SAGE. Another control was provided by the quantitative PCR analysis of four genes whose expression was observed to be reduced in the SAGE libraries prepared from adenomas and cancers compared to those from normal colonic mucosa. As shown inFig. 3 , the quantitative PCR confirmed the lower levels of expression of each of these genes, emphasizing that the dramatic elevations in expression observed inFig. 2 represented gene-specific phenomena. - Quantitative PCR. Tumors were collected, snap frozen, and stored at -80°C. They were verified to be predominantly composed of neoplastic cells by histopathological analysis. mRNA was isolated from tumors, and patient-matched normal colonic mucosa using QuickPrep reagents (Amersham Pharmacia Biotech UK, Buckinghamshire, England), and single-stranded cDNA was synthesized using Superscript II (Life Technologies, Gaithersburg, MD). Quantitative PCR was performed using an iCycler (Bio-Rad, Hercules, CA), and threshold cycle numbers determined using iCycler software, version 2.1. Reactions were performed in triplicate and threshold cycle numbers averaged. All genes examined were normalized to a control gene (β-amyloid precursor protein, shown by SAGE to be expressed at equivalent levels in all colorectal samples), and fold induction calculated according to the formula 2(Rt-Et)/2(Rn-En) where Rt is the threshold cycle number for the Reference gene observed in the tumor, Et is the threshold cycle number for the Experimental gene observed in the tumor, Rn is the threshold cycle number for the Reference gene observed in the normal, and En is the threshold cycle number for the Experimental gene observed in the normal. The primers used for quantitative PCR were obtained from GeneLink (Hawthorne, NY), and their sequences are available upon request.
- The quantitative PCR data obtained from mRNA isolated from whole tumors provided independent evidence that SAGE provided an accurate indication of gene expression changes in colorectal neoplasia. However, neither analysis identified the cell types responsible for the increased expression. Non-neoplastic stromal cells within tumors may be considerably different than those in normal colonic mucosa (6), and the epithelial derivation of gene expression differences cannot reliably be concluded without direct supporting evidence. We therefore sought to determine if the epithelial cells of cancers express elevated levels of the six genes depicted in
Fig. 2 . First, we affinity-purified cancerous and patient-matched normal epithelial cells from fresh surgical specimens using immunomagnetic beads directed to the pan epithelial marker Ber-EP4, prepared cDNA and performed quantitative PCR analysis to determine the expression levels of the elevated genes as above. Elevated expression was observed in the purified tumor epithelial cells for each of the six genes examined (Fig. 4 ), demonstrating that at least some of the increased expression was derived from epithelial cells. However, relative expression of LYS was not as prominent or reproducible in the purified epithelial cells as in the mRNA from the unfractionated tumors, suggesting that other cell types might have contributed transcripts from this gene. - Epithelial cell immunoaffinity purification. Tumor epithelial cells were purified using a modification of the procedure previously developed for the isolation of tumor endothelial cells (6). In brief, fresh surgical specimens of tumor and matched normal tissue were obtained and digested with collagenase and the resulting material filtered through a nylon mesh to obtain single cell suspensions. The cells were then bound to a mixture of anti-CD14 and anti-CD45 immunomagnetic beads (Dynal, Oslo, Norway) to deplete the population of hematopoetic cells (negative selection). The remaining cell suspension was then incubated with anti-Ber-EP4 immunomagnetic beads to isolate epithelial cells (positive selection). Purified cells were lysed directly on the beads and mRNA purified using QuickPrep reagents (Amersham Pharmacia Biotech UK, Buckinghamshire, England).
- We performed in situ hybridization to RNA in frozen sections of tumors for five of the genes showing the most consistent elevation. DEHL was found to be elevated in only five of the nine tumors examined and was not investigated further. To increase the sensitivity of detection, we generated several RNA probes for each tested gene using in vitro transcription techniques. The results obtained are discussed below in conjunction with brief overviews of each of the five genes of interest.
- In situ Hybridization. Non-radioactive in situ hybridization was performed as described (6). For each gene analyzed, a cocktail of anti-sense probes made through in vitro transcription were employed to increase sensitivity. The primers used to generate templates for the synthesis of the in situ riboprobes were obtained from GeneLink (Hawthorne, NY), and their sequences are available upon request.
- The results summarized above show that although a large number of tags are observed in the colorectal tissues analyzed, only a small fraction (957/21,343, <5%) were expressed differentially in benign or malignant neoplastic tissues. A similarly small fraction of genes (66/4000, 1.7%) were found to be aberrantly expressed in colorectal neoplasms using oligonucleotide arrays (22). Analysis of these differentially expressed genes not only has the potential to provide insights into the biology of human neoplasia but also may have clinically useful applications. One of the most exciting potential applications concerns the identification of genes whose products provide cellular and serum markers for colorectal neoplasia. In the current study, we identified several genes that appeared to meet all of these criteria and may therefore be especially useful as diagnostic tools for the early detection of presymptomatic colorectal neoplasia. Indeed, the product of one of these genes (MIC-1), has recently been found to be elevated in the serum of patients with colorectal and other cancers, providing further validation of this approach (24).
TABLE 5 Tag_Sequence NC1 NC2 AD1 AD2 CA1 CA2 UNI ID Description AAAAGAAACT 1 3 33 52 7 16 172182 poly(A)-binding protein, cytoplasmic 1 AACGAGGAAT 8 0 24 26 17 23 AAGAAGATAC 6 6 28 25 21 34 184776 ribosomal protein L23a AATAGGTCCA 12 9 32 36 22 22 113029 ribosomal protein S25 ACAACTCAAT 1 1 7 7 8 6 244125 EST ACAACTCAAT 1 1 7 7 8 6 75922 brain protein 13 ACATCATCGA 10 18 50 66 34 46 182979 ribosomal protein L12 ACCATTGGAT 0 0 3 10 3 9 146360 interferon induced transmembrane protein 1 (9-27) ACCTGTATCC 5 3 20 6 26 35 182241 interferon induced transmembrane protein 3 (1-8U) ACTCCAAAAA 9 12 21 65 21 37 133230 ribosomal protein S15 AGCACCTCCA 37 37 108 81 57 108 75309 eukaryotic translation elongation factor 2 AGGACCATCG 0 0 8 2 1 18 AGGGCTTCCA 26 41 74 108 50 85 29797 ribosomal protein L10 ATGGCTGGTA 18 46 79 75 81 136 182426 ribosomal protein S2 ATGTAAAAAA 0 0 26 32 2 12 178112 DNA segment, single copy probe LNS-CAI/LNS-CAII (deleted in polyposis ATGTAAAAAA 0 0 26 32 2 12 234734 lysozyme (rena) amyloidosis) ATGTAAAAAA 0 0 26 32 2 122 3715 Sjogren syndrome antigen B (autoantigen La) ATTCTCCAGT 8 20 20 48 43 28 234518 ribosomal protein L23 CAAGGACCAG 0 0 5 6 10 12 109 dipeptidase 1 (renal) CAATAAATGT 8 6 40 76 33 67 179779 ribosomal protein L37 CAGCTCACTG 4 17 9 35 21 24 158675 ribosomal protein L14 CATTTGTAAT 48 27 102 57 36 125 CCTAGCTGGA 16 27 58 45 48 66 182937 peptidylprolyl isomerase A (cyclophilin A) CCTTCGAGAT 6 12 13 29 7 41 76194 ribosomal protein S5 CTCCTCACCT 7 13 38 36 24 75 242908 lecithin-cholesterol acyltransferase CTGACTTGTG 0 0 1 20 9 2 77961 major histocompatibility complex, class I, B CTGGGTTAAT 14 24 34 83 42 112 126701 ribosomal protein S19 CTGTTGATTG 13 3 60 38 32 27 249495 heterogeneous nuclear ribonucleoprotein A1 CTGTTGGTGA 9 19 37 59 31 62 3463 ribosomal protein S23 GAAAAATGGT 7 12 49 47 25 27 181357 laminin receptor 1 (67kD, ribosomal protein SA) GAGTCAGGAG 2 C 8 6 9 7 181271 CG1-120 protein GCATAATAGG 11 16 22 54 50 21 184108 ribosomal protein L21 (gene or pseudogene) GCATTTAAAT 1 2 10 18 12 7 261802. eukaryotic translation elongation factor 1 beta 1 GCATTTAAAT 1 2 10 18 12 7 275959 eukaryotic translation elongation factor 1 beta 2 GCATTTGACA 2 5 27 17 9 20 172129 Homo sapiens cDNA: FLJ21409 fis, clone COL03924 GCTTTTAAGG 2 8 14 32 16 17 8102 ribosomal protein S20 GGACCACTGA 18 39 76 57 48 83 119598 ribosomal protein L3 GGGGGTAACT 1 2 8 11 14 13 99969 fusion, derived from t(12;16) malignant liposarcoma GTGCGCTGAG 0 0 75 0 20 18 277477 major histocompatibility complex, class I, C GTGCTCATTC 0 0 13 7 2 10 116577 prostate differentiation factor GTGCTCATTC 0 0 13 7 2 10 25945 ESTs GTGTGTTTGT 0 0 17 29 17 15 118787 transforming growth factor, beta-induced, 68kD GTTCGTGCCA 1 13 18 43 24 18 179606 nuclear RNA helicase, DECD variant of DEAD box family GTTCGTGCCA 1 13 18 43 24 18 179666 uncharacterized hypothalamus protein HSMNP1 TAATAAAGGT 4 11 37 62 24 27 151604 ribosomal protein S8 TAATTTTTGC 0 1 99 12 20 37 273321 differentially expressed in hematopoietic lineages TCACAAGCAA 10 7 17 21 13 38 146763 nascent-polypeptide-associated complex alpha polypeptide TCAGATCTTT 14 32 37 108 31 87 75344 ribosomal protein S4, X-linked TCCTGCCCCA 1 5 10 14 7 16 171814 parathymosin TGAAATAAAA 0 2 2 14 13 11 173205 nucleophosmin (nucleolar phosphoprotein 823, numatrin) Human DNA sequence from clone RP5-1179L24 on chromosome 6q24.3-25.3. Contains the 3' end of the gene for a novel protein similar to mouse TGAAATAAAA 0 2 2 14 13 11 192822 phospholipase C neighboring protein PNG, ESTs, STSs and GSSs TGATGTCTGG 0 0 2 6 8 2 83883 transmembrane, prostate androgen induced MRNA TGTAATCAAT 2 3 13 11 8 11 249495 heterogeneous nuclear ribonucleoprotein A1 TTACCATATC 10 5 22 30 26 22 300141 ribosomal protein L39, TTATGGGATC 6 4 24 37 36 47 5662 guanine nucleotide binding protein (G protein), beta polypeptide 2-like 1 TTCAATAAAA 8 14 79 111 36 50 177592 ribosomal protein, large, P1 TTCCAGCTGC 0 0 7 6 2 9 12442 ESTs, Weakly similar to TTCCAGCTGC 0 0 7 6 2 9 19121 adaptor-related protein complex 2, alpha 2 subunit: TTCCAGCTGC G 0 7 6 2 9 227277 sine oculis homeobox (Drosophila) homolog 3 regenerating islet-derived 1 alpha (pancreatic Stone protein, pancreatic TTTCCACTAA 0 0 8 4 4 6 1032 thread protein) TTCCACTAA 0 0 8 4 4 6 289088 heat shock 90kD protein 1, alpha TTTTTAATGT 0 2 12 18 8 7 161307 H3 histone, family 3A TABLE 6 Tag_Sequence NC1 NC2 AD1 AD2 CA1 CA2 UNI ID Description AAATCTGGCA 16 15 2 4 2 0 430 plastin 1 (1 isoform) AACGTGCAGG 29 31 13 6 7 8 160786 argininosuccinate synthetase AAGAAAGCTC 20 6 0 2 1 5 25264 DKFZP434N126 protein AAGAAAGCTC 20 6 0 2 1 5 1011 anterior gradient 2 (Xenepus laevis) homolog AAGAAGCAGG 8 16 3 4 1 3 11441 chromosome 1 open reading frame 8 AAGGTAGCAG 15 16 2 4 2 4 104125 adenylyl cyclase-associated protein AATAAAGGCT 25 11 3 7 3 4 179735 ras homolog gene family, member C AATAGTTTCC 7 16 2 3 6 1 272620 pregnancy specific beta-1-glycoprotein 9 AATCACAAAT 18 45 1 4 14 3 74466 carcinoembryonic antigen-related cell adhesion molecule 7 AATGAGAAGG 11 3 0 0 1 0 198248 UDP-Gal:betaGlcNAc beta 1,4- galactosyltransferase, polypeptide 1 ACAATTGGTC 0 10 0 0 0 0 155097 carbonic anhydrase II ACACCCATCA 2 27 1 0 5 3 110445 CG1-97 protein ACAGGGTGAC 25 13 1 8 7 6 174050 endothelial differentiation-related factor 1 ACATTGGGTG 377 334 67 34 96 33 275086 PR domain containing 10 ACATTGGGTG 377 334 67 34 96 33 5241 fatty acid binding protein 1, liver ACCCAACTGC 12 3 0 0 0 0 232604 Homo sapiens cDNA: FLJ22675 fis, clone HSI10553 ACCCACGTCA 22 10 3 5 3 1 198951 jun B proto-oncogene ACCCCCCCGC 44 38 7 13 16 6 229413 ESTs ACCCCCCCGC 44 38 7 13 16 6 2780 jun D proto-oncogene ACCTGCATCC 0 12 0 0 0 0 ACCTGGGGAG 35 11 1 3 4 3 131748 ESTs, Moderately similar to 1-acylglycerol-3-phosphate O-acyltransferase 2 (lysophosphatidic acid ACCTGGGGAG 35 11 1 3 4 3 209119 acyltransferase, beta) ACGGTCCAGG 5 12 0 0 0 1 72924 cytidine deaminase ACTCTTGTTG 7 2 0 0 0 0 5378 spondin 1, (f-spondin) extracellular matrix protein ACTGTGGCGG 17 34 9 12 9 4 112242 ESTs AGAATAGCTT 44 67 3 9 11 30 24133 ESTs AGCAGGAGCA 50 14 6 3 7 6 178292 KIAAC180 protein AGCAGGAGCA 50 14 6 3 7 6 738 early growth response 1 AGCCCGACCA 16 S 2 4 1 3 104114 H.sapiens HCG I mRNA AGGATGGTCC 34 19 5 3 6 8 71779 Homo sapiens DNAfrom chromosome 19, cosmid F21856 AGGCCAAGGG 21 6 3 1 3 4 76057 galactose-4-epimerase, UDP- AGGTGACTGG 10 14 0 0 0 0 AGTGGGCTCA 3 8 0 1 0 0 ATACTCCACT 82 59 0 0 10 3 778 guanylate cyclase activator 1B (retina) ATATAATCTG 18 14 1 4 5 5 621 lectin, galactoside-binding, soluble, 3 (galectin 3) ATCGTGGCGG 193 92 19 25 20 10 5372 claudin 4 ATGACGCTCA 22 18 6 5 3 4 8254 hypothetical protein PR00899 ATGATGGCAC 12 32 1 0 1 0 84072 transmembrane 4 superfamily member 3 ATGCGGAGTC 14 13 5 3 2 4 25527 tight junction protein 3 (zona occludens 3) ATGCGGGAGA 38 39 15 22 5 6 109748 Homo sapiens CAC-1 mRNA, partial cds ATGGCACGGA 6 21 1 1 3 0 81097 cytochrome c oxidase subunit VIII ATGGTCTACG 10 5 0 0 1 0 96593 hypothetical protein ATGGTGGGGG 25 30 11 9 1 2 1665 zinc finger protein homologous to Zfp-36 in mouse ATGTGCGTGG 38 8 11 3 7 7 56937 suppression of tumorigenicity 14 (colon carcinoma, matriptase, epithin) ATGTGGGCTC 7 2 0 0 0 0 151641 glycoprotein A repetitions predominant ATGTGGGCTC 7 2 0 0 0 0 27018 Ris ATTGGAGTGC 136 85 15 36 37 19 220529 carcinoembryonic antigen-related cell adhesion molecule 5 ATTTCAAGAT 35 21 0 2 1 0 155097 carbonic anhydrase II ATTTCAAGAT 35 21 0 2 1 0 24453 ESTs CAAATAAAAG 9 12 2 0 1 1 185055 BENE protein CAAGAGTTTC 14 2 0 0 0 0 183617 ESTs CACCCCTGAT 73 16 9 58 58 13 36 173724 creatine kinase, brain CAGTGCGTTC 12 3 0 0 3 0 8302 four and a half LIM domains 2 CATAGGTTTA 66 39 4 1 5 0 1650 solute carrier family 26, member 3 CCAAAGCTAT 42 16 14 12 6 11 84072 transmembrane 4 superfamily member 3 CCAACACCAG 9 19 1 0 0 1 181165 eukaryotic translation elongation factor 1 alpha 1 CCACTGCACC 21 19 5 5 6 14 CCAGGGGAGA 45 66 24 22 10 20 278613 interferon, alpha-inducible protein 27 CCATTCCACT 13 1 2 0 0 0 CCCAACGCGC 106 1 3 5 0 2 272572 hemoglobin, alpha 2 CCCCCCAAGC 25 27 3 15 4 8 31265 ESTs, Weakly similar to CCCCCGCGGA 33 25 6 11 4 12 95697 liver-specific bHLH-Zip transcription factor CCCCCTGCAT 5 4 0 0 0 0 CCCGCCTCTT C 40 3 3 16 1 mito Tag matches mitochondrial sequence CCCTCCCGAA 89 54 9 14 18 7 5940 hypothetical protein FLJ20063 CCGCTGCACT 127 102 55 46 37 30 CCGGCTTGAG 7 4 0 0 0 0 2722 inositol 1,4,5-trisphosphate 3-kinase A CCTCCAGCTA 715 458 142 125 131 147 242463 keratin 8 CCTCCAGTAC 20 8 2 3 2 4 CCTGCCCCCC 20 30 6 3 11 4 861 mitogen-activated protein kinase 3 CCTGCTGCAG 7 34 0 1 6 9 102482 mucin 5, subtype B, tracheobronchial CCTGCTTGTC 20 23 0 3 0 5 268171 ESTs, Weakly similar to epididymis-specific, whey-acidic protein type, four-disulfide core; putative CCTGCTTGTC 20 23 0 3 0 5 2719 ovarian carcinoma marker procollagen-praline, 2-oxoglutarate 4-dioxygenase (proline 4-hydroxylase), beta polypeptide (protein disulfide isomerase; thyroid hormone binding CCTGGAAGAG 30 26 11 4 12 16 75655 protein p55) CCTGTCTGCC 14 22 0 1 1 1 107139 hypothetical protein anti-oxidant protein 2 (non-selenium glutathione peroxidase, acidic calcium- CCTGTGACAG 22 27 0 4 3 1 120 independent phospholipase A2) CCTTCAAATC 29 17 0 0 1 0 23118 carbonic anhydrase I CGAGGGGCCA 110 47 18 18 12 32 182485 actinin, alpha 4 CGCTGTGGGG 58 53 19 8 8 6 7486 protein expressed in thyroid CGGACTCACT 20 45 5 14 14 10 284134 serologically defined colon cancer antigen 28 CGGACTCACT 20 45 5 14 14 10 84700 similar to phosphatidylcholine transfer protein 2 CGGGAGTCGG 28 30 13 2 9 1 236720 ESTs, Weakly similar to CGGTGGGACC 7 14 1 1 3 3 99175 Homo sapiens cDNA: FLJ21606 fis, clone COL07302 CGTGGGTGGG 1 10 1 0 0 1 202833 heme oxygenase (decycling) 1 CTACCCTCAC 172 90 30 53 36 58 14376 actin, gamma 1 CTCAGAACTT 18 3 1 0 0 0 194710 glucosaminyl (N-acetyl) transferase 3, mucin type CTGAACCTCC 5 15 2 0 0 0 4205 hypothetical protein FL120124 CTGACCTGTG 88 130 48 18 16 46 77961 major histocompatibility complex, class 1, B CTGGATCTGG 21 21 3 9 5 10 75658 phosphorylase, glycogen; brain CTGGCAAAGG 14 22 1 0 0 0 CTGGCCCTCG 186 52 1 3 15 14 1406 trefoil factor 1 (breast cancer, estrogen-inducible sequence expressed in) CTGGCCCTCG 186 52 1 3 15 14 166184 Intersectin 2 CTGCCCCTCG 136 52 1 3 15 14 7720 dynein, cytoplasmic, heavy polypeptide 1 CTGGCTATCC 7 3 0 0 0 1 10784 hypotherical protein FLJ20037 CTGGGCCTCT 22 22 2 2 3 3 50868 solute carrier family 22 (organic cation transporter), member 1-like CTGTACTTGT 9 5 1 1 0 0 75678 FBJ murine osteosarcoma viral oncogene homolog B CTGTGTGGCT 0 12 1 0 0 0 127610 acyl-Coenzyme A dehydrogenase, C-2 to C-3 short chain CTGTGTGGCT 0 12 1 0 0 0 54277 DNA segment on chromosome X (unique) 9928 expressed sequence CTTACAAGCA 21 13 2 3 4 3 mito Tag matches mitochondrial sequence CTTAGAGGGG 16 22 0 1 1 1 155191 villin 2 (ezrin) CTTATGGTCC 36 11 0 1 1 0 179608 retinol dehydrogenase homolog CTTCCAGCTA 64 31 22 20 14 19 217493 annexin A2 CTTCTTGCCC 29 2 2 2 0 1 251577 hemoglobin, alpha 1 CTTGACATAC 18 20 4 4 0 0 171695 dual specificity phosphatase 1 CTTGATTCCC 26 9 5 0 2 5 77266 quiescin Q6 GACATCAAGT 198 87 23 14 47 17 182265 keratin 19 GACCAGCCCA 23 21 3 2 12 5 75799 protease, serine, 8 (prostasin) GACCAGTGGC 21 44 4 0 2 0 143131 glycoprotein A33 (transmembrane) GACGCGGCGC 30 47 10 17 12 17 301684 RNA POLYMERASE I AND TRANSCRIPT RELEASE FACTOR GAGAGCTCCC 5 11 3 0 2 1 mito Tag matches mitochondrial sequence GAGCACCGTG 7 4 1 0 0 1 GATATGTAAA 1 10 0 0 0 0 GATCCCAACT 9 29 5 7 1 1 118786 metallothionein 2A GATGAATCCG 12 14 2 2 1 2 283552 ESTs, Weakly similar to GATGACCCCC 42 49 4 3 3 3 mito Tag matches mitochondrial sequence GCAAGAAAGT 48 0 0 4 0 1 155376 hemoglobin, beta GCACAGGTCA 5 9 1 0 1 1 GCACCCTTTC 13 5 0 0 1 0 GCACCTGTCG 2 9 0 0 1 0 109059 mitochondrial ribosomal protein L12 alanyl (membrane) aminopeptidase (aminopeptidase N, aminopeptidase M, GCACCTGTCG 2 9 0 0 1 0 1239 microsomal aminopeptidase, CD13, p150) ems1 sequence (mammary tumor and squamous cell carcinoms-associated GCAGCTCCTG 13 47 3 2 7 3 119257 (p80/85 src substrate) GCAGGAGGTG 2 13 0 0 0 1 11441 chromosome 1 open reading frame 8 GCAGGAGGTG 2 13 0 0 0 1 76040 KDEL (Lys-Asp-Glu-Leu) endoplasmic reticulum Protein retention receptor 1 GCAGGGCCTC 128 165 41 69 39 51 92323 FXYD domain-containing ion transport regulator 3 GCCACATACT 3 9 0 0 0 0 4984 KIAA0828 protein GCCACGTGGA 19 16 5 2 7 1 103665 villin-like GCCAGACACC 19 9 3 4 1 2 3804 DKFZP564C1940 protein GCCAGGTTGC 14 5 1 1 1 1 42824 hypothetical protein FLJ10718 GCCAGGTTGC 14 5 1 1 1 1 55682 eukaryotic translation initiation factor 3, subunit 7 (zeta, 66/67kD) GCCAGGTTGC 14 5 1 1 1 1 78996 proliferating cell nuclear antigen GCCATCCTCC 9 13 0 1 0 0 GCCCACACAG 1 5 0 1 1 0 0 1690 heparin-binding growth factor binding protein GCCCACGTCA 7 8 0 0 0 0 GCCCAGGGCC 4 44 2 1 2 1 10326 coatomer protein complex, subunit epsilon GCCCAGGGCC 4 44 2 1 2 1 229417 EST, Moderately similar to GCCCAGGGCC 4 44 2 1 2 1 229546 EST GCCCAGGTCA 519 447 136 128 58 22 154903 ESTs, Weakly similar to GCCCAGTGGC 51 0 8 15 2 5 143131 glycoprotein A33 (transmembrane) GCCGACCAGG 46 47 15 8 19 9 75741 amiloride binding protein 1 (amine oxidase (copper-containing)) GCCGGGTGGG 207 149 18 24 68 67 74631 basigin GCCGTGGAGA 32 23 4 11 7 7 80680 major vault protein GCCTGGCCAT 26 34 4 6 10 14 5662 guanine nucleotide binding protein (G protein), beta polypeptide 2-like 1 GCCTGGCCAT 26 34 4 6 10 14 63042 DKFZpS64J157 protein GCGAAACCCT 167 566 123 43 64 98 GCGAAACTCG 5 9 1 0 0 0 GCGCAGAGGT 2 16 1 0 0 1 108124 ribosomal protein L41 GCTCTTCCCC 9 2 1 1 2 0 33455 peptidyl arginine deiminase, type II GCTGCCCTTG 44 6 13 6 6 18 272897 Tubulin, alpha, brain-specific GCTGCCCTTG 44 6 13 6 6 18 27824 tubulin, alpha, ubiquitous GCTGGCACAT 15 14 1 0 6 C 179704 meprin A, alpha (PABA peptide hydrolase) GCTGGCCCCG 5 11 0 0 0 1 8185 CGI-44 protein; sulfide dehydrogenase like (yeast) GCTGTGCCTG 36 42 2 4 11 8 58247 proteass, serine, 4 (trypsin 4, brain) GCTTGGGGAT 11 8 2 0 0 0 5394 myosin, heavy polypeptide-like (110kD) GGAACAGGGG 1 13 1 0 0 2 102336 Rho GTPase activating protein 8 GGAACAGGGG 1 13 1 0 0 2 272972 hyperthetical protein FLJ20185 GGAACAGGGG 1 13 1 0 0 2 77961 major histocompatibility complex, class 1, B GGAACTGTGA 90 84 10 18 10 2 38972 tetraspan 1 GGAAGAGCAC 21 11 1 1 2 5 75268 sialyltransferase 4C (beta-galactosidase alpha-2,3-sialytransferase) GGAGGCCGAG 13 9 5 0 2 5 301342 ESTs, Weakly similar to GGAGGCGCTC 5 11 1 1 0 1 33455 peptidyl arginine deiminase, type II GGATGGCTTA 25 5 2 1 1 1 64179 hypothetical protein GGCACCGTGC 22 44 8 10 8 4 120912 ESTs GGCCCTGCAG 14 7 1 0 5 1 105463 sir2-related protein type 6 GGCTCGGGAT 15 11 2 4 3 5 2575 calpain 1, (mu/l) large subunit GGCTGCCGC 13 11 4 3 5 2 180958 ESTs GGCTGCCTGC 13 11 4 3 5 2 197314 ESTs GGCTGGGCCT 46 25 14 5 10 8 144102 EST GGCTGGGCCT 46 25 14 5 10 8 14846 Homo sapiens mRNA; cDNA DKFZp564D016 (from clone DKFZp564D016) GGCTGGGCCT 46 25 14 5 10 8 73919 clathrin, light polypeptide (Lcb) GGGAAGCAGA 32 17 18 4 8 9 GGGACGAGTG 20 6 1 3 6 1 3337 transmembrane 4 superfamily member 1 GGGCGCTGTG 11 27 3 6 4 5 8372 ubiquinol-cytochrome c reductase (6.4kD) subunit GGGGCAGGGC 48 64 27 10 15 31 119140 eukaryotic translation initiation factor SA GGTGAAGAGG 16 32 5 3 10 9 233950 serine protease inhibitor, Kunitz type 1 GTAGCAGGTG 24 27 11 7 7 7 140452 cargo selection protein (mannose 6 phosphate receptor binding protein) GTATTGGGGC 5 7 0 0 0 0 GTCATCACCA 35 22 0 0 0 0 107382 KIAA1517 protein GTCATCACCA 35 22 0 0 0 0 257045 Homo sapiens cDNA: FLJ23415 fis, clone HEP20738 GTCATCACCA 35 22 0 0 0 0 32966 guanylate cyclase activator 2B (uroguanylin) GTCATCACCA 35 22 0 0 0 0 68877 cytochrome b-245, alpha polypeptide GTCCGAGTGC 17 3 0 0 0 0 3337 transmembrane 4 superfamily member 1 GTCCTGAACA 7 3 0 0 0 0 78546 ATPase, Ca++ transporting, plasma membrane 1 GTCCTGAACA 7 3 0 0 0 0 8256 DKFZP434D1335 protein GTGCACTGAG 118 45 14 7 12 13 181244 major histocompatibility complex, class 1, A GTGCACTGAG 118 45 14 7 12 13 277477 major histocompatibility complex, class 1, C GTGCCTGAGA 18 15 2 6 7 3 77886 lamin A/C GTGGCGGGAA 3 15 1 0 4 0 GTGGGGGCGC 5 22 2 0 1 0 254105 enolase 1, (alpha) GTGGTGGCAG 29 11 1 1 10 3 194691 rotinoic acid induced 3 GTGGTTCACG 4 5 0 0 0 0 272088 ESTs, Moderately similar to GTGGTTCACG 4 5 0 0 0 0 62192 coagulation factor III (thromboplastin, tissue factor) GTGTTGGGGG 21 19 8 6 1 3 55016 hypothetical protein FLJ21935 GTTTAGAGGG 5 16 0 0 2 1 181874 interferon-induced protein with tetratricopeptide repeats 4 TAAATTGCAA 103 59 8 17 5 3 56205 Insulin induced gene 1 TAAGGCCTTT 6 9 1 0 0 1 20149 deleted in lymphocytic leukemia, 1 TAAGGCCTTT 6 9 1 0 0 1 42945 acid sphingomyelinase-like phosphodiesterase TAATCCCAGC 37 33 8 7 16 13 TAATTTGCAT 25 2 1 1 2 0 79368 epithelial membrane protein 1 TACGGTGTGG 7 13 2 2 1 0 105460 DKFZP56400823 protein tyrosine 3-monooxygenase/tryptophan 5-monooxygenase activation protein, TACTCGGCCA 10 5 0 0 1 0 79474 epsilon polypeptide TACTGTGGAT 4 11 0 2 2 1 21537 protein phosphatase 1, catalytic subunit, beta isoform TAGACTAGCA 31 27 6 6 22 4 100090 tetraspan 3 TAGGATGGGG 24 30 4 7 6 1 76941 ATPase, Na+/K+ transporting, beta 3 polypeptide TATGATGAGC 13 21 2 2 1 5 205126 Homo sapiens cDNA: FLJ22667 fis, clone HS108385 TCACACTGCC 26 7 3 1 3 4 81008 filamin B, beta (actin-binding protein-278) TCACCGGTCA 118 75 10 10 5 6 290070 galsolin (amyloidosis, Finnish type) TCAGAGCGCT 5 21 0 7 0 1 92323 FXYD domain-containing ion transport regulator 3 TCAGCTGCAA 56 16 0 0 9 3 284199 mucin 12 TCAGCTGCAA 56 16 0 0 9 3 301888 Homo sapiens cDNA FLJ11205 fis, clone PLACE1007843 TCGGAGCTGT 21 20 9 6 3 0 4055 G protein-coupled receptor kinase-interactor 1 carcinoembryonic antigen-related cell adhesion molecule 1 (biliary TCTGAATTAT 24 16 0 0 1 0 50964 glycoprotein) TGACTAATTG 7 9 2 0 0 3 293380 ESTs TGAGTGACAG 9 68 0 6 3 7 205126 Homo sapiens cDNA: FLJ22667 fis, clone HSI08385 TGAGTGACAG 9 68 0 6 3 7 271688 ESTs TGATCTCTGT 6 7 1 0 1 1 30738 hypothetical protein FLJ10407 TGCAGCACGA 6 185 5 30 24 16 110309 major histocompatibility complex, class 1, F TGCAGCGCCT 16 9 1 1 1 1 77 573 uridine phosphorylase TGCCGCCCGC 14 5 2 2 1 0 202097 procollagen C-encopeptidase enhancer TCCTCCTACC 140 113 3 70 22 17 22 111732 Fc fragment of IgG binding protein TGCTCCTACC 140 113 70 22 17 22 301256 Homo sapiens chromosome 19, cosmid R30669 TGGCCATCTG 30 24 8 7 3 4 184052 PP1201 protein TGGCGCGTGT 25 8 0 0 9 5 25640 claudin 3 TGGCTACTTA 6 9 1 0 1 2 117950 multifunctional polypeptide similar to SAICAR synthetase and AIR carboxylase TGGGGAGAGG 43 18 20 7 3 7 288998 S100-type calcium binding protein A14 TTAACCCCTC 34 14 5 9 1 5 78224 ribonuclease, RNase A family, 1 (pancreatic) TTATGGTGTG 11 17 0 0 0 0 271499 ESTs TTCCACTAAC 29 9 7 4 5 5 79706 plectin 1, intermediate filament binding protein, 500kD TTCCGCGTTC 5 16 0 0 2 2 137274 ESTs, Weakly similar to TTCTGGTGCG 8 2 0 0 1 0 119251 ubiquinol-cytochrome c reductase core protein I TTCTGTAGCC 13 23 4 2 4 2 5541 ATPase, Ca++ transporting, ubiquitous TTGGACCTGG 33 31 7 18 12 16 89761 ATP synthase, H+ transporting, mitochondrial F1 complex, delta subunit TTGGGGTTTC 111 184 50 81 67 50 62954 ferritin, heavy polypeptide 1 TTTAACGGCC 93 67 36 35 11 30 mito Tag matches mitochondrial sequence TTTCCTCTCA 21 8 6 2 4 3 184510 stratifin TTTCCTCTCA 21 8 6 2 4 3 303400 ESTs TTTCTCGTCG 10 16 2 3 0 2 1686 guanine nucleotide binding protein (G protein), alpha 11 (Gq class) TTTGGTTTCA 2 13 0 0 0 0 carcinoembryonic antigen-related cell adhesion molecule 1 (biliary TTTTCTGCAT 8 7 1 0 1 2 50964 glycoprotein) TTTTCTGCAT 8 7 1 0 1 2 77318 platelet-activating factor acetylhydrolase, isoform lb, alpha subunit (45kD) TTTTTACTGA 32 19 10 10 8 1 111577 integral membrane protein 2C -
- 1. Cancer Facts & Figures 1998: American Cancer Society, 1998.
- 2. Inger, D. B. Colorectal cancer screening, Prim Care. 26: 179-187, 1999.
- 3. Velculescu, V. E., Zhang, L., Vogelstein, B., and Kinzler, K. W. Serial Analysis Of Gene Expression, Science. 270: 484-487, 1995.
- 4. Zhang, L., Zhou, W., Velculescu, V. E., Kern, S. E., Hruban, R. H., Hamilton, S. R., Vogelstein, B., and Kinzler, K. W. Gene Expression Profiles in Normal and Cancer Cells, Science. 276: 1268-1272, 1997.
- 5. Lal, A., Lash, A. E., Altschul, S. F., Velculescu, V., Zhang, L., McLendon, R. E., Marra, M. A., Prange, C., Morin, P. J., Polyak, K., Papadopoulos, N., Vogelstein, B., Kinzler, K. W., Strausberg, R. L., and Riggins, G. J. A public database for gene expression in human cancers, Cancer Res. 59: 5403-5407, 1999.
- 6. St Croix, B., Rago, C., Velculescu, V., Traverso, G., Romans, K. E., Montgomery, E., Lal, A., Riggins, G. J., Lengauer, C., Vogelstein, B., and Kinzler, K. W. Genes expressed in human tumor endothelium, Science. 289: 1197-1202, 2000.
- 7. Guy-Crotte, O., Amouric, M., and Figarella, C. Characterization and N-terminal sequence of a degradation product of 14,000 molecular weight isolated from human pancreatic juice, Biochem Biophys Res Commun. 125: 516-523, 1984.
- 8. Terazono, K., Yamamoto, H., Takasawa, S., Shiga, K., Yonemura, Y., Tochino, Y., and Okamoto, H. A novel gene activated in regenerating islets, J Biol Chem. 263: 2111-2114, 1988.
- 9. Watanabe, T., Yonekura, H., Terazono, K., Yamamoto, H., and Okamoto, H. Complete nucleotide sequence of human reg gene and its expression in normal and tumoral tissues. The reg protein, pancreatic stone protein, and pancreatic thread protein are one and the same product of the gene, J Biol Chem. 265: 7432-7439, 1990.
- 10. Rechreche, H., Montalto, G., Mallo, G. V., Vasseur, S., Marasa, L., Soubeyran, P., Dagorn, J. C., and Iovanna, J. L. pap, reg Ialpha and reg Ibeta mRNAs are concomitantly up-regulated during human colorectal carcinogenesis, Int J Cancer. 81: 688-694, 1999.
- 11. Skonier, J., Neubauer, M., Madisen, L., Bennett, K., Plowman, G. D., and Purchio, A. F. cDNA cloning and sequence analysis of beta ig-h3, a novel gene induced in a human adenocarcinoma cell line after treatment with transforming growth factor-beta, DNA Cell Biol. 11: 511-522, 1992.
- 12. Escribano, J., Hernando, N., Ghosh, S., Crabb, J., and Coca-Prados, M. cDNA from human ocular ciliary epithelium homologous to beta ig-h3 is preferentially expressed as an extracellular protein in the corneal epithelium, J Cell Physiol. 160: 511-521, 1994.
- 13. Munier, F. L., Korvatska, E., Djemai, A., Le Paslier, D., Zografos, L., Pescia, G., and Schorderet, D. F. Kerato-epithelin mutations in four Sq31-linked corneal dystrophies, Nat Genet. 15: 247-251, 1997.
- 14. Fleming, A. On a remarkable bacteriolytic element found in tissues and secretions, Proceedings of the Royal Society. 93: 306-317, 1922.
- 15. Sugi, K., Saitoh, O., Hirata, I., and Katsu, K. Fecal lactoferrin as a marker for disease activity in inflammatory bowel disease: comparison with other neutrophil-derived proteins, Am J Gastroenterol. 91: 927-934, 1996.
- 16. van der Sluys Veer, A., Brouwer, J., Biemond, I., Bohbouth, G. E., Verspaget, H. W., and Lamers, C. B. Fecal lysozyme in assessment of disease activity in inflammatory bowel disease, Dig Dis Sci. 93: 590-595, 1998.
- 17. Tomita, H., Sato, S., Matsuda, R., Sugiura, Y., Kawaguchi, H., Niimi, T., Yoshida, S., and Morishita, M. Serum lysozyme levels and clinical features of sarcoidosis, Lung. 177: 161-167, 1999.
- 18. Ho, S. B., Itzkowitz, S. H., Friera, A. M., Jiang, S. H., and Kim, Y. S. Cell lineage markers in premalignant and malignant colonic mucosa, Gastroenterology. 97: 392-404, 1989.
- 19. Yamada, R. and Kera, Y. D-amino acid hydrolysing enzymes, Exs. 85: 145-155, 1998.
- 20. Bootcov, M. R., Bauskin, A. R., Valenzuela, S. M., Moore, A. G., Bansal, M., He, X. Y., Zhang, H. P., Donnellan, M., Mahler, S., Pryor, K., Walsh, B. J., Nicholson, R. C., Fairlie, W. D., Por, S. B., Robbins, J. M., and Breit, S. N. MIC-1, a novel macrophage inhibitory cytokine, is a divergent member of the TGF-beta superfamily, Proc Natl Acad Sci U S A. 94: 11514-11519, 1997.
- 21. Paralkar, V. M., Vail, A. L., Grasser, W. A., Brown, T. A., Xu, H., Vukicevic, S., Ke, H. Z., Qi, H., Owen, T. A., and Thompson, D. D. Cloning and characterization of a novel member of the transforming growth factor-beta/bone morphogenetic protein family, J Biol Chem. 273: 13760-13767, 1998.
- 22. Notterman, D.A., Alon, U., Sierk, A.J., Levine, A.J., Transcriptional Gene Expression Profiles of Colorectal Adenoma, Adenocarcinoma, and Normal Tissue Examined by Oligonucleotide Arrays, Cancer Res. 61: 3124-3130, 2001.
- 23. Zhou, W., Sokoll, L. J., Brusek, D. J., Zhang, L., Velculsescu, V., Goldin, S. B., Hruban, R. H., Kern, S. E., Hamilton, S. R., Chan, D. W., Vogelstein, B., and Kinzler, K. W. Identifying markers for pancreatic cancer by gene expression analysis, Can Epid Bio & Prev. 7: 109-112, 1998.
- 24. Brown, D. A., Liu, T., Ward, R. L., Hawkins, N. J., Fairlie, W. D., Bauskin, A. R., Russell, P. J., Quinn, D. I., Grygiel, J. J., Moore, A. G., Sutherland, R. L., Turner, J., Kingsley, E. A., and Breit, S. N. Macrophage Inhibitory Cytokine-1 (MIC-1) in epithelial neoplasia, Submitted., 2001.
Claims (20)
- A method for detection of benign colorectal adenomas in presymptomatic patients, comprising the steps of:isolating an mRNA sample from feces of a subject;detecting renal dipeptidase mRNA in said mRNA sample;comparing the amount of renal dipeptidase mRNA in said mRNA sample to amounts of renal dipeptidase mRNA in normal subjects, wherein an elevated amount of renal dipeptidase mRNA in said mRNA sample is an indicator of benign colorectal adenoma in the subject.
- A method for detection of benign colorectal adenomas in presymptomatic patients, comprising the steps of:isolating epithelial cells from blood of a subject;isolating an mRNA sample from the epithelial cells;detecting renal dipeptidase mRNA in said mRNA sample;comparing the amount of renal dipeptidase mRNA in said mRNA sample to amounts of renal dipeptidase mRNA in normal subjects, wherein an elevated amount of renal dipeptidase mRNA in said mRNA sample is an indicator of benign colorectal adenoma in the subject.
- The method of claim 1 or claim 2, further comprising the step of:identifying the patient as having a benign colorectal adenoma if an elevated amount of renal dipeptidase mRNA in said mRNA sample is observed.
- The method of claim 1 or claim 2, wherein renal dipeptidase mRNA is detected by RT-PCR.
- The method of claim 1 or claim 2, wherein renal dipeptidase mRNA is detected by hybridization of copy mRNA to a nucleic acid array.
- A method for detection of benign colorectal adenoma in a subject that has been administered an antibody which specifically bind to renal dipeptidase and wherein the antibody is labelled with a moiety which is detectable from outside of the subject, comprising:detecting the moiety in the subject from outside of the subject, wherein an area of localization of the moiety within the subject but outside the proximal tubules of the kidney identifies benign colorectal adenoma.
- A method for detection of benign colorectal adenomas in a subject that has been administered an inhibitor of renal dipeptidase wherein the inhibitor is labelled with a moiety which is detectable from outside the subject, comprising detecting the moiety in the subject from outside of the subject, wherein an area of localization of the moiety within the subject but outside the proximal tubules of the kidney identifies benign colorectal adenoma.
- The method of claim 6 or claim 7, wherein the moiety is fluor.
- The method of claim 6 or claim 7, wherein the moiety is a radioactive atom.
- The method of claim 6 or claim 7, wherein the moiety is a contrast agent for spiral computer tomography.
- The method of claim 7, wherein the inhibitor binds irreversibly to renal dipeptidase.
- The method of claim 7, wherein the inhibitor binds and slowly releases from renal dipeptidase with a half-life of greater than 4 hours.
- A method for detection of benign colorectal adenomas in presymptomatic patients, comprising the steps of:detecting renal dipeptidase in blood of a subject; andcomparing amount of renal dipeptidase in blood of the subject to the amount of renal dipeptidase in normal subjects, wherein an elevated amount of renal dipeptidase in the blood of the subject is an indicator of benign colorectal adenoma in the subject.
- A method for detection of benign colorectal adenomas in presymptomatic patients, comprising the steps of:detecting renal dipeptidase in feces of a subject; andcomparing amount of renal dipeptidase in feces of the subject to the amount of renal dipeptidase in normal subjects, wherein an elevated amount of renal dipeptidase in the feces of the subject is an indicator of benign colorectal adenoma in the subject.
- The method of claim 13 further comprising:determining if renal dipeptidase detected in the blood comprises a tumor-specific glycoform of renal dipeptidase.
- The method of claim 14 further comprising:determining if renal dipeptidase detected in the feces comprises a tumor-specific glycoform of renal dipeptidase.
- The method of claim 13 further comprising:determining if renal dipeptidase detected in the blood binds to L lectin from Phaseolus vulgaris hemagglutinin.
- The method of claim 14 further comprising:determining if renal dipeptidase detected in the feces binds to L lectin from Phaseolus vulgaris hemagglutinin.
- The method of claim 13 further comprising:determining if renal dipeptidase detected in the blood binds to L lectin from Sambucus nigra hemagglutinin.
- The method of claim 14 further comprising:determining if renal dipeptidase detected in the feces binds to L lectin from Sambucus nigra hemagglutinin.
Applications Claiming Priority (5)
| Application Number | Priority Date | Filing Date | Title |
|---|---|---|---|
| US31749401P | 2001-09-07 | 2001-09-07 | |
| US317494P | 2001-09-07 | ||
| US38380502P | 2002-05-30 | 2002-05-30 | |
| US383805P | 2002-05-30 | ||
| PCT/US2002/028518 WO2003022863A1 (en) | 2001-09-07 | 2002-09-09 | Secreted and cell surface genes expressed in benign and malignant colorectal tumors |
Publications (3)
| Publication Number | Publication Date |
|---|---|
| EP1430071A1 EP1430071A1 (en) | 2004-06-23 |
| EP1430071A4 EP1430071A4 (en) | 2005-11-02 |
| EP1430071B1 true EP1430071B1 (en) | 2011-04-06 |
Family
ID=26980985
Family Applications (1)
| Application Number | Title | Priority Date | Filing Date |
|---|---|---|---|
| EP02773302A Expired - Lifetime EP1430071B1 (en) | 2001-09-07 | 2002-09-09 | Secreted and cell surface genes expressed in benign and malignant colorectal tumors |
Country Status (6)
| Country | Link |
|---|---|
| US (1) | US8029764B2 (en) |
| EP (1) | EP1430071B1 (en) |
| JP (1) | JP2005518781A (en) |
| AT (1) | ATE504594T1 (en) |
| DE (1) | DE60239690D1 (en) |
| WO (1) | WO2003022863A1 (en) |
Families Citing this family (12)
| Publication number | Priority date | Publication date | Assignee | Title |
|---|---|---|---|---|
| AU2003254185A1 (en) * | 2002-07-27 | 2004-02-16 | The Johns Hopkins School Of Medicine | Design and synthesis of renal dipeptidase inhibitors |
| WO2006066916A1 (en) * | 2004-12-23 | 2006-06-29 | Roche Diagnostics Gmbh | Use of microsomal dipeptidase as a marker for colorectal cancer |
| AU2006299539A1 (en) | 2005-09-30 | 2007-04-12 | Anticancer, Inc. | Methods for identifying markers for early-stage human cancer, cancer progression and recurrence |
| EP2544006A1 (en) * | 2007-06-04 | 2013-01-09 | Diagnoplex | Biomarker combinations for colorectal cancer |
| WO2011050344A2 (en) | 2009-10-23 | 2011-04-28 | Mannkind Corporation | Cancer immunotherapy and method of treatment |
| US20160235778A1 (en) * | 2014-03-13 | 2016-08-18 | Massachusetts Institute Of Technology | Compositions containing pufa, uridine and choline and methods of use thereof |
| US20160209415A1 (en) * | 2015-01-20 | 2016-07-21 | Poochon Scientific LLC | Method to predict or diagnose a colorectal cancer |
| JP2018517892A (en) | 2015-04-10 | 2018-07-05 | アプライド プロテオミクス,インク. | Protein biomarker panel to detect colorectal cancer and advanced adenoma |
| CN105603093A (en) * | 2016-02-05 | 2016-05-25 | 广州复能基因有限公司 | Method for preparing RNA probe with MIC-1 cDNA as template |
| CN109402119A (en) * | 2018-12-11 | 2019-03-01 | 宁夏医科大学总医院 | A kind of circular rna hsa_circTGFBI_001 and its specificity amplification primer and application |
| CN109402125A (en) * | 2018-12-11 | 2019-03-01 | 宁夏医科大学总医院 | A kind of circular rna hsa_circTGFBI_007 and its specificity amplification primer and application |
| CN114428172A (en) * | 2022-01-20 | 2022-05-03 | 中山大学附属第六医院 | Marker for predicting postoperative distant metastasis risk of colorectal cancer patient and application thereof |
Family Cites Families (1)
| Publication number | Priority date | Publication date | Assignee | Title |
|---|---|---|---|---|
| WO1998053319A2 (en) * | 1997-05-21 | 1998-11-26 | The Johns Hopkins University | Gene expression profiles in normal and cancer cells |
-
2002
- 2002-09-09 EP EP02773302A patent/EP1430071B1/en not_active Expired - Lifetime
- 2002-09-09 DE DE60239690T patent/DE60239690D1/en not_active Expired - Lifetime
- 2002-09-09 WO PCT/US2002/028518 patent/WO2003022863A1/en not_active Ceased
- 2002-09-09 JP JP2003526936A patent/JP2005518781A/en active Pending
- 2002-09-09 US US10/487,934 patent/US8029764B2/en active Active
- 2002-09-09 AT AT02773302T patent/ATE504594T1/en not_active IP Right Cessation
Also Published As
| Publication number | Publication date |
|---|---|
| EP1430071A4 (en) | 2005-11-02 |
| JP2005518781A (en) | 2005-06-30 |
| WO2003022863A1 (en) | 2003-03-20 |
| EP1430071A1 (en) | 2004-06-23 |
| US8029764B2 (en) | 2011-10-04 |
| DE60239690D1 (en) | 2011-05-19 |
| US20040265824A1 (en) | 2004-12-30 |
| ATE504594T1 (en) | 2011-04-15 |
Similar Documents
| Publication | Publication Date | Title |
|---|---|---|
| Buckhaults et al. | Secreted and cell surface genes expressed in benign and malignant colorectal tumors | |
| US8029764B2 (en) | Methods for detection of colorectal cancer | |
| Nishidate et al. | Genome-wide gene-expression profiles of breast-cancer cells purified with laser microbeam microdissection: identification of genes associated with progression and metastasis | |
| US7807373B2 (en) | Prostate specific gene, PCGEM1, and methods of using PCEGM1 to detect, treat, and prevent prostate cancer | |
| Sun et al. | Transcript map of the 8p23 putative tumor suppressor region | |
| ES2321954T3 (en) | COMPOSITIONS AND PROCEDURES FOR TUMORS DIAGNOSIS. | |
| KR100959199B1 (en) | New P53 Target Gene SPI-1 and Uses thereof | |
| CA2319117A1 (en) | Compounds for therapy and diagnosis of lung cancer and methods for their use | |
| WO2003083074A2 (en) | Novel gene targets and ligands that bind thereto for treatment and diagnosis of colon carcinomas | |
| US20030065157A1 (en) | Genes expressed in lung cancer | |
| WO2004046342A2 (en) | Novel gene targets and ligands that bind thereto for treatment and diagnosis of carcinomas | |
| WO2003101283A2 (en) | Diagnostics markers for lung cancer | |
| JP2003518920A (en) | New human genes and gene expression products | |
| JP2004502406A (en) | Human genes and human gene expression products | |
| JP2004512029A (en) | Human genes and gene expression products | |
| WO1999064594A9 (en) | Genes and gene expression products that are differentially regulated in prostate cancer | |
| EP1155126A2 (en) | Genes associated with diseases of the colon | |
| KR100566839B1 (en) | Oncology compositions and methods | |
| WO2008151200A2 (en) | Cancer related isoforms of components of transcription factor complexes as biomarkers and drug targets | |
| US5688641A (en) | Cancer diagnosis using nucleic acid hybridization | |
| EP1575993A2 (en) | Methods for treating patients and identifying therapeutics | |
| US20030119009A1 (en) | Genes regulated by MYCN activation | |
| Stolk et al. | P704P, P712P, and P775P: A genomic cluster of prostate‐specific genes | |
| JP2003528630A (en) | Human genes and expression products | |
| Harada et al. | Mouse homologue of the human SART3 gene encoding tumor‐rejection antigen |
Legal Events
| Date | Code | Title | Description |
|---|---|---|---|
| PUAI | Public reference made under article 153(3) epc to a published international application that has entered the european phase |
Free format text: ORIGINAL CODE: 0009012 |
|
| 17P | Request for examination filed |
Effective date: 20040319 |
|
| AK | Designated contracting states |
Kind code of ref document: A1 Designated state(s): AT BE BG CH CY CZ DE DK EE ES FI FR GB GR IE IT LI LU MC NL PT SE SK TR |
|
| AX | Request for extension of the european patent |
Extension state: AL LT LV MK RO SI |
|
| RIC1 | Information provided on ipc code assigned before grant |
Ipc: 7C 07H 21/04 A Ipc: 7C 12N 9/48 B Ipc: 7C 07K 14/495 B |
|
| A4 | Supplementary search report drawn up and despatched |
Effective date: 20050914 |
|
| GRAP | Despatch of communication of intention to grant a patent |
Free format text: ORIGINAL CODE: EPIDOSNIGR1 |
|
| GRAS | Grant fee paid |
Free format text: ORIGINAL CODE: EPIDOSNIGR3 |
|
| GRAA | (expected) grant |
Free format text: ORIGINAL CODE: 0009210 |
|
| AK | Designated contracting states |
Kind code of ref document: B1 Designated state(s): AT BE BG CH CY CZ DE DK EE ES FI FR GB GR IE IT LI LU MC NL PT SE SK TR |
|
| REG | Reference to a national code |
Ref country code: GB Ref legal event code: FG4D |
|
| REG | Reference to a national code |
Ref country code: CH Ref legal event code: EP |
|
| REG | Reference to a national code |
Ref country code: IE Ref legal event code: FG4D |
|
| REF | Corresponds to: |
Ref document number: 60239690 Country of ref document: DE Date of ref document: 20110519 Kind code of ref document: P |
|
| REG | Reference to a national code |
Ref country code: DE Ref legal event code: R096 Ref document number: 60239690 Country of ref document: DE Effective date: 20110519 |
|
| REG | Reference to a national code |
Ref country code: NL Ref legal event code: T3 |
|
| PG25 | Lapsed in a contracting state [announced via postgrant information from national office to epo] |
Ref country code: SE Free format text: LAPSE BECAUSE OF FAILURE TO SUBMIT A TRANSLATION OF THE DESCRIPTION OR TO PAY THE FEE WITHIN THE PRESCRIBED TIME-LIMIT Effective date: 20110406 Ref country code: PT Free format text: LAPSE BECAUSE OF FAILURE TO SUBMIT A TRANSLATION OF THE DESCRIPTION OR TO PAY THE FEE WITHIN THE PRESCRIBED TIME-LIMIT Effective date: 20110808 |
|
| PG25 | Lapsed in a contracting state [announced via postgrant information from national office to epo] |
Ref country code: GR Free format text: LAPSE BECAUSE OF FAILURE TO SUBMIT A TRANSLATION OF THE DESCRIPTION OR TO PAY THE FEE WITHIN THE PRESCRIBED TIME-LIMIT Effective date: 20110707 Ref country code: ES Free format text: LAPSE BECAUSE OF FAILURE TO SUBMIT A TRANSLATION OF THE DESCRIPTION OR TO PAY THE FEE WITHIN THE PRESCRIBED TIME-LIMIT Effective date: 20110717 Ref country code: AT Free format text: LAPSE BECAUSE OF FAILURE TO SUBMIT A TRANSLATION OF THE DESCRIPTION OR TO PAY THE FEE WITHIN THE PRESCRIBED TIME-LIMIT Effective date: 20110406 Ref country code: BE Free format text: LAPSE BECAUSE OF FAILURE TO SUBMIT A TRANSLATION OF THE DESCRIPTION OR TO PAY THE FEE WITHIN THE PRESCRIBED TIME-LIMIT Effective date: 20110406 Ref country code: CY Free format text: LAPSE BECAUSE OF FAILURE TO SUBMIT A TRANSLATION OF THE DESCRIPTION OR TO PAY THE FEE WITHIN THE PRESCRIBED TIME-LIMIT Effective date: 20110406 Ref country code: FI Free format text: LAPSE BECAUSE OF FAILURE TO SUBMIT A TRANSLATION OF THE DESCRIPTION OR TO PAY THE FEE WITHIN THE PRESCRIBED TIME-LIMIT Effective date: 20110406 |
|
| PG25 | Lapsed in a contracting state [announced via postgrant information from national office to epo] |
Ref country code: CZ Free format text: LAPSE BECAUSE OF FAILURE TO SUBMIT A TRANSLATION OF THE DESCRIPTION OR TO PAY THE FEE WITHIN THE PRESCRIBED TIME-LIMIT Effective date: 20110406 Ref country code: EE Free format text: LAPSE BECAUSE OF FAILURE TO SUBMIT A TRANSLATION OF THE DESCRIPTION OR TO PAY THE FEE WITHIN THE PRESCRIBED TIME-LIMIT Effective date: 20110406 |
|
| PLBE | No opposition filed within time limit |
Free format text: ORIGINAL CODE: 0009261 |
|
| STAA | Information on the status of an ep patent application or granted ep patent |
Free format text: STATUS: NO OPPOSITION FILED WITHIN TIME LIMIT |
|
| PG25 | Lapsed in a contracting state [announced via postgrant information from national office to epo] |
Ref country code: SK Free format text: LAPSE BECAUSE OF FAILURE TO SUBMIT A TRANSLATION OF THE DESCRIPTION OR TO PAY THE FEE WITHIN THE PRESCRIBED TIME-LIMIT Effective date: 20110406 Ref country code: DK Free format text: LAPSE BECAUSE OF FAILURE TO SUBMIT A TRANSLATION OF THE DESCRIPTION OR TO PAY THE FEE WITHIN THE PRESCRIBED TIME-LIMIT Effective date: 20110406 |
|
| 26N | No opposition filed |
Effective date: 20120110 |
|
| PG25 | Lapsed in a contracting state [announced via postgrant information from national office to epo] |
Ref country code: MC Free format text: LAPSE BECAUSE OF NON-PAYMENT OF DUE FEES Effective date: 20110930 |
|
| REG | Reference to a national code |
Ref country code: CH Ref legal event code: PL |
|
| REG | Reference to a national code |
Ref country code: DE Ref legal event code: R097 Ref document number: 60239690 Country of ref document: DE Effective date: 20120110 |
|
| GBPC | Gb: european patent ceased through non-payment of renewal fee |
Effective date: 20110909 |
|
| REG | Reference to a national code |
Ref country code: IE Ref legal event code: MM4A |
|
| REG | Reference to a national code |
Ref country code: FR Ref legal event code: ST Effective date: 20120531 |
|
| PG25 | Lapsed in a contracting state [announced via postgrant information from national office to epo] |
Ref country code: IE Free format text: LAPSE BECAUSE OF NON-PAYMENT OF DUE FEES Effective date: 20110909 Ref country code: CH Free format text: LAPSE BECAUSE OF NON-PAYMENT OF DUE FEES Effective date: 20110930 Ref country code: LI Free format text: LAPSE BECAUSE OF NON-PAYMENT OF DUE FEES Effective date: 20110930 |
|
| PG25 | Lapsed in a contracting state [announced via postgrant information from national office to epo] |
Ref country code: FR Free format text: LAPSE BECAUSE OF NON-PAYMENT OF DUE FEES Effective date: 20110930 Ref country code: GB Free format text: LAPSE BECAUSE OF NON-PAYMENT OF DUE FEES Effective date: 20110909 |
|
| PG25 | Lapsed in a contracting state [announced via postgrant information from national office to epo] |
Ref country code: LU Free format text: LAPSE BECAUSE OF NON-PAYMENT OF DUE FEES Effective date: 20110909 |
|
| PG25 | Lapsed in a contracting state [announced via postgrant information from national office to epo] |
Ref country code: BG Free format text: LAPSE BECAUSE OF FAILURE TO SUBMIT A TRANSLATION OF THE DESCRIPTION OR TO PAY THE FEE WITHIN THE PRESCRIBED TIME-LIMIT Effective date: 20110706 |
|
| PG25 | Lapsed in a contracting state [announced via postgrant information from national office to epo] |
Ref country code: TR Free format text: LAPSE BECAUSE OF FAILURE TO SUBMIT A TRANSLATION OF THE DESCRIPTION OR TO PAY THE FEE WITHIN THE PRESCRIBED TIME-LIMIT Effective date: 20110406 |
|
| PG25 | Lapsed in a contracting state [announced via postgrant information from national office to epo] |
Ref country code: IT Free format text: LAPSE BECAUSE OF FAILURE TO SUBMIT A TRANSLATION OF THE DESCRIPTION OR TO PAY THE FEE WITHIN THE PRESCRIBED TIME-LIMIT Effective date: 20110406 |
|
| PGFP | Annual fee paid to national office [announced via postgrant information from national office to epo] |
Ref country code: NL Payment date: 20210926 Year of fee payment: 20 |
|
| PGFP | Annual fee paid to national office [announced via postgrant information from national office to epo] |
Ref country code: DE Payment date: 20210929 Year of fee payment: 20 |
|
| REG | Reference to a national code |
Ref country code: DE Ref legal event code: R071 Ref document number: 60239690 Country of ref document: DE |
|
| REG | Reference to a national code |
Ref country code: NL Ref legal event code: MK Effective date: 20220908 |