EP1422514A1 - Method of evaluating uniformity of spots in arrays - Google Patents
Method of evaluating uniformity of spots in arrays Download PDFInfo
- Publication number
- EP1422514A1 EP1422514A1 EP02746153A EP02746153A EP1422514A1 EP 1422514 A1 EP1422514 A1 EP 1422514A1 EP 02746153 A EP02746153 A EP 02746153A EP 02746153 A EP02746153 A EP 02746153A EP 1422514 A1 EP1422514 A1 EP 1422514A1
- Authority
- EP
- European Patent Office
- Prior art keywords
- sequence
- spots
- plate
- background data
- color dot
- Prior art date
- Legal status (The legal status is an assumption and is not a legal conclusion. Google has not performed a legal analysis and makes no representation as to the accuracy of the status listed.)
- Granted
Links
Images






Classifications
-
- G—PHYSICS
- G01—MEASURING; TESTING
- G01N—INVESTIGATING OR ANALYSING MATERIALS BY DETERMINING THEIR CHEMICAL OR PHYSICAL PROPERTIES
- G01N33/00—Investigating or analysing materials by specific methods not covered by groups G01N1/00 - G01N31/00
- G01N33/48—Biological material, e.g. blood, urine; Haemocytometers
- G01N33/50—Chemical analysis of biological material, e.g. blood, urine; Testing involving biospecific ligand binding methods; Immunological testing
- G01N33/53—Immunoassay; Biospecific binding assay; Materials therefor
- G01N33/543—Immunoassay; Biospecific binding assay; Materials therefor with an insoluble carrier for immobilising immunochemicals
-
- G—PHYSICS
- G16—INFORMATION AND COMMUNICATION TECHNOLOGY [ICT] SPECIALLY ADAPTED FOR SPECIFIC APPLICATION FIELDS
- G16B—BIOINFORMATICS, i.e. INFORMATION AND COMMUNICATION TECHNOLOGY [ICT] SPECIALLY ADAPTED FOR GENETIC OR PROTEIN-RELATED DATA PROCESSING IN COMPUTATIONAL MOLECULAR BIOLOGY
- G16B25/00—ICT specially adapted for hybridisation; ICT specially adapted for gene or protein expression
-
- G—PHYSICS
- G01—MEASURING; TESTING
- G01N—INVESTIGATING OR ANALYSING MATERIALS BY DETERMINING THEIR CHEMICAL OR PHYSICAL PROPERTIES
- G01N21/00—Investigating or analysing materials by the use of optical means, i.e. using sub-millimetre waves, infrared, visible or ultraviolet light
- G01N21/01—Arrangements or apparatus for facilitating the optical investigation
- G01N2021/0181—Memory or computer-assisted visual determination
-
- G—PHYSICS
- G01—MEASURING; TESTING
- G01N—INVESTIGATING OR ANALYSING MATERIALS BY DETERMINING THEIR CHEMICAL OR PHYSICAL PROPERTIES
- G01N21/00—Investigating or analysing materials by the use of optical means, i.e. using sub-millimetre waves, infrared, visible or ultraviolet light
- G01N21/62—Systems in which the material investigated is excited whereby it emits light or causes a change in wavelength of the incident light
- G01N21/63—Systems in which the material investigated is excited whereby it emits light or causes a change in wavelength of the incident light optically excited
- G01N21/64—Fluorescence; Phosphorescence
- G01N21/645—Specially adapted constructive features of fluorimeters
- G01N21/6456—Spatial resolved fluorescence measurements; Imaging
-
- G—PHYSICS
- G01—MEASURING; TESTING
- G01N—INVESTIGATING OR ANALYSING MATERIALS BY DETERMINING THEIR CHEMICAL OR PHYSICAL PROPERTIES
- G01N2201/00—Features of devices classified in G01N21/00
- G01N2201/12—Circuits of general importance; Signal processing
- G01N2201/127—Calibration; base line adjustment; drift compensation
Definitions
- the present invention relates to a method for evaluating the uniformity of spots printed on an array, and is a technique supporting the analysis of an array having spots located two-dimensionally on a substrate, such as a DNA microarray, a DNA chip, a protein array, etc.
- a new method for measuring gene expression levels in cells is a DNA microarray, wherein several hundred to several tens of thousands of samples of DNA are aligned and fixed in spots in a matrix shape to a glass slide. mRNA (the target) that has been extracted and purified from target cells is hybridized on the DNA microarray.
- the common method for performing measurements using DNA microarrays is two-color fluorescence labeling.
- mRNA originating from two types of cells for example, normal cells and cancer cells
- the cells are labeled with fluorescent materials (CY3 and CY5) that have mutually differing excitation wave lengths.
- competitive hybridization is performed on the same spots on the DNA microarray, and the fluorescent intensity of each spot on the array is measured by using two channels (CH1 and CH2) to view the mutually differing excitation wave lengths CY3 and CY5.
- CH1 and CH2 two channels
- the data from CY3 and CY5 is normally calculated based on the following relational expression, with essentially the value of log (R/G) being utilized as the gene expression data.
- CH1 (channel 1) and CH2 (channel 2) are the measured fluorescent intensity values of the spots (channel 1 and 2 existing so as to measure red and green separately), measured using a laser scanner.
- CH1B (background data of channel 1) and CH2B (background data of channel 2) are background data of the spots measured using a laser scanner.
- the present invention presents an extremely simple method for evaluating the uniformity of the spots on an array such as a DNA microarray, etc.
- Inventors who were concerned that there was some regularity in the gene expression quantities, obtained the total gene expression data of the yeast cell (TUP1) that was made public in the DNA microarray data base of Stanford University, rearranged the expression data in the chromosome order and gene order, and analyzed the gene expression data thus obtained.
- TUP1 total gene expression data of the yeast cell
- the present inventors have discovered a relationship between the presence of periodicity in the background data (this background data being used as fluorescence intensity compensatory data) and the non-uniformity of spots, and have discovered that the presence of periodicity in the background data furthermore exerts an important influence on the analysis of gene expression data.
- This information can be applied not only to DNA microarrays, but also to all arrays having spots located two-dimensionally on a substrate, such as DNA chips, protein arrays, etc.
- the present invention is a method for evaluating a uniformity of spots on an array having a plurality of spots, these spots undergoing specific emissions as a result of the hybridization of target matter and tagged probe matter, wherein the uniformity of the spots is evaluated by examining whether patterns having periodicity are manifested in a sequence BG comprising background data obtained in a manner described below.
- the uniformity of spots on an array such as a DNA microarray or the like can be evaluated in an extremely simple manner.
- the signal data obtained from an array such as a DNA microarray, or the like, can be analyzed with great accuracy by evaluating the uniformity of the spots on the array in advance.
- a flow chart displaying the commonly used steps for analyzing signal data using a DNA microarray is as shown in FIG. 1.
- the color status of each spot on the slide is recorded as picture image data.
- the picture image data is processed using analysis software, and color data of the spots is acquired.
- the image obtained by scanning is overlaid with a grid image having a plurality of squares, one square being allocated for each spot, and then the signal data and background data within each square are acquired (FIG. 2).
- the signal data is measured as the color intensity within an oval-shaped spot wherein a major axis and minor axis have been designated.
- the background data is measured as the intensity within the square surrounding the spot and in the area outside the boundaries of the spot.
- the background data should be measured when all the spots are visible and emit at a brightness whereby the emission intensity is not saturated. There can be a slight variation in the background data depending on the detecting conditions of the emission signal of the scanning device or the method used by the analysis software for sampling the spots. However, the method of the present invention is not affected by the scanning device or the type of analysis software.
- Preferred scanning devices are GenePix 4000A, GeneTACLSIV, GTMASS, GMS418Array Scanner, AvalancheMicroscanner, ChipReader, GeneTAC2000, CRBIO, ScanArray3000, 4000, 5000, etc.
- Preferred analysis software is ScanAlyze, ArrayAnalyzer, ImaGene, AutoGene, QuantArray, QuantarrayAutomation, MicroArraySuite, ArrayVision, ArrayGauge, GenePixPro, etc.
- a sequence BG serving as an indicator for revealing the characteristics of the background data is prepared as follows.
- Preferred display methods are the methods below.
- a more preferred method is display method 3 below.
- a method whereby, when p is any given natural number less than m, and r is any given natural number, when the display method of display method 3 is implemented while substituting k p, p + r, p + 2r, p + 3r, ..., a color dot matrix group is output wherein a color dot matrix of the p column, a color dot matrix of the p + r column, and color dot matrices of the p + 2r, p + 3r ... columns, as below, are all arranged in an aligned manner, latent characteristics within the sequence being revealed.
- Display method 4 is particularly effective in the case where repeated units are totally unclear, or in the case where a portion of a sequence simply does not exist in repeated regions.
- the sequence BG has been displayed by means of a suitable display method, it is verified whether patterns having periodicity are present. In the case where patterns having periodicity are present, it can be determined that the spots on the DNA microarray have low uniformity.
- Various types of patterns having periodicity can be present in the sequence BG, such as a constantly repeated pattern or a plurality of types of patterns repeated across the entire sequence BG, patterns being repeated in portions of the sequence BG, etc.
- yeast cell DNA microarray data from the DNA microarray data published by Stanford University was obtained (Genomic Expression Programs in the Response of Yeast Cells to Environmental Changes, Array Data File: y11n121 (variable heat 21C)).
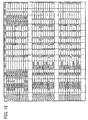
- FIG. 12 An outline of the data that was obtained is shown in FIG. 12.
- 'CH1B' is background data of channel 1
- 'CH2B' is background data of channel 2.
- 'CH1D' and 'CH2D' are signal data of compensated spots obtained according to the following formula.
- CH1 I - CH1B CH1D
- CH2 I - CH2B CH2D
- 'PLAT' is a symbol or number identifying plates
- 'PROW' is a symbol showing the rows of each plate
- 'PCOL' is a number showing the columns of each plate.
- FIG. 12 data concerning specific target DNA is displayed in row units: A plate number ('PLAT') and position on the plate ('PROW', 'PCOL') is assigned for the background data 'CH1B' and 'CH2B' for each item of target DNA displayed in the 'NAME' column. Each item of data is listed first in the plate number unit, then in the plate row unit, and finally in the plate column unit. Consequently, the order from top to bottom in FIG. 12 forms an order based on method 4 of the sequence BG of the present invention.
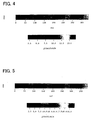
- FIG. 4 shows the result wherein each number in the sequence BG of the background data (CH2B) is displayed in a matrix shape according to display method 3.
- FIG. 6 shows the signal data 'CH1D' of channel 1 in a DNA microarray image wherein color is converted in accordance with the size of number values.
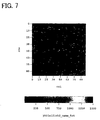
- FIG. 7 shows a DNA microarray image of the signal data 'CH2D' of channel 2 processed in the same way.
- These DNA microarray images are not necessarily identical to actual scanned images, but schematically show the emission intensity of the spots in scanned images. The non-uniformity of the spots cannot be recognized at all from FIGS. 6 and 7, but since the distinct repeatability in the background data can be recognized from FIGS. 4 and 5, the non-uniformity of the spots can be determined.
- the background data are utilized as compensatory number values of the fluorescent intensity, if there is periodicity in the background data itself, periodicity originating from the background data will necessarily be present in the gene expression data of the DNA microarray. Since this type of periodicity in the background data affects the reliability of the DNA microarray data, care is required during data analysis.
- the melanoma DNA microarray data from the DNA microarray data published by Stanford University was obtained (NC160 Cancer Microarray Project).
- background data (CH1B) is prepared, and is displayed according to display method 4. Consequently, the presence of 96 repeat structures in a sequence BG is shown (although it has also been suggested that 24 repeat structures are intrinsic to the sequence BG).
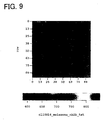
- FIG. 9 shows this result, wherein each number in the sequence BG of the background data (CH2B) is displayed in a matrix shape according to display method 3.
- the signal data 'CH1D' of channel 1 and the signal data 'CH2D' of channel 2 are shown in DNA microarray images in FIGS. 10 and 11.
- the non-uniformity of spots therein cannot be recognized at all from FIGS. 10 and 11, but since the distinct repeatability in the background data can be recognized from FIGS. 8 and 9, the non-uniformity of the spots can be determined.
- the uniformity of the spots on an array such as a DNA microarray or the like can be evaluated in an extremely simple manner.
- the signal data obtained from an array such as a DNA microarray or the like can be analyzed with great accuracy.
Landscapes
- Health & Medical Sciences (AREA)
- Life Sciences & Earth Sciences (AREA)
- Immunology (AREA)
- Engineering & Computer Science (AREA)
- Molecular Biology (AREA)
- Physics & Mathematics (AREA)
- Chemical & Material Sciences (AREA)
- Urology & Nephrology (AREA)
- Hematology (AREA)
- Biomedical Technology (AREA)
- Biotechnology (AREA)
- General Health & Medical Sciences (AREA)
- Analytical Chemistry (AREA)
- Food Science & Technology (AREA)
- Pathology (AREA)
- General Physics & Mathematics (AREA)
- Biochemistry (AREA)
- Cell Biology (AREA)
- Medicinal Chemistry (AREA)
- Microbiology (AREA)
- Bioinformatics & Computational Biology (AREA)
- Genetics & Genomics (AREA)
- Bioinformatics & Cheminformatics (AREA)
- Spectroscopy & Molecular Physics (AREA)
- Biophysics (AREA)
- Evolutionary Biology (AREA)
- Medical Informatics (AREA)
- Theoretical Computer Science (AREA)
- Measuring Or Testing Involving Enzymes Or Micro-Organisms (AREA)
- Image Analysis (AREA)
- Investigating, Analyzing Materials By Fluorescence Or Luminescence (AREA)
- Image Processing (AREA)
- Apparatus Associated With Microorganisms And Enzymes (AREA)
Abstract
Description
CH1 - CH1B (
CH2 - CH2B (
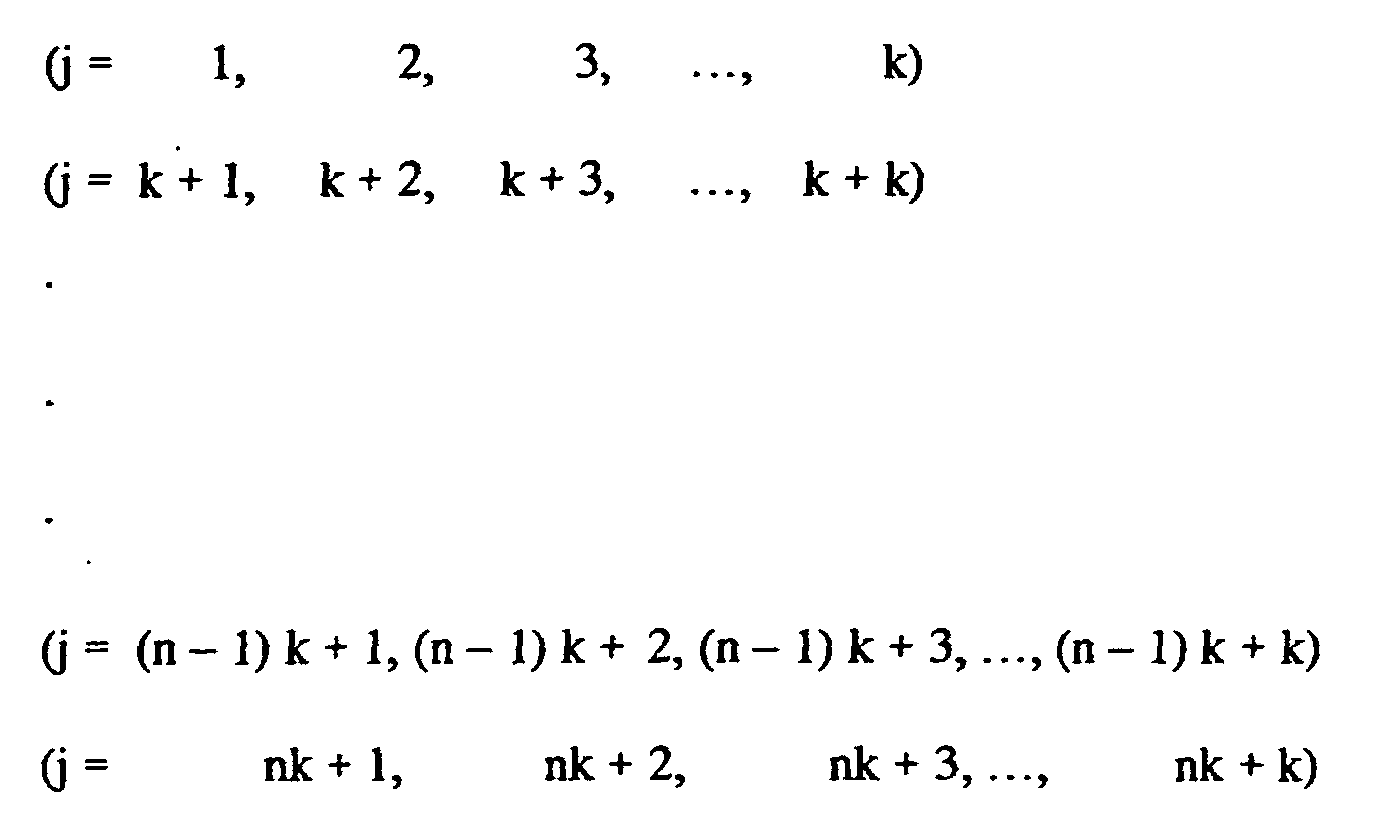
Claims (5)
- A method for evaluating a uniformity of spots on an array having a plurality of spots, these spots undergoing specific emissions as a result of the hybridization of target matter and tagged probe matter, wherein the uniformity of the spots is evaluated by examining whether patterns having periodicity are manifested in a sequence BG comprising background data obtained in a manner described below.
<Method for preparing the sequence BG>(1) By applying an analysis software to images obtained by scanning the monochromatic emission of the array, background data for each spot are obtained.(2) Concerning each spot, the corresponding plate No.(α) of the target matter and position (β, γ) are determined, wherein α is a symbol or a numerical symbol identifying the plate while β and γ respectively stand for the row and column of a matrix formed by plate holes.(3) The No.(α) and the position (β, γ) on the plate are assigned to respective background data.(4) The sequence BG consisting of the background data aligned in the orders of the plate NO.(α) (the first priority) and the position (β, γ) on the plate(the second priority) is obtained. - A method for evaluating a uniformity of spots on a DNA microarray having a plurality of spots, these spots undergoing specific emissions as a result of the hybridization of target DNA and tagged probe DNA, wherein the uniformity of the spots is evaluated by examining whether patterns having periodicity are manifested in a sequence BG comprising background data obtained in a manner described below.
<Method for preparing the sequence BG>(1) By applying an analysis software to images obtained by scanning the monochromatic emission of the DNA microarray, background data for each spot are obtained.(2) Concerning each spot, the corresponding plate No.(α) of the target DNA and position (β, γ) are determined, wherein α is a symbol or a numerical symbol identifying the plate while β and γ respectively stand for the row and column of a matrix formed by plate holes.(3) The No.(α) and the position (β, γ) on the plate are assigned to respective background data.(4) The sequence BG consisting of the background data aligned in the orders of the plate NO.(α) (the first priority) and the position (β, γ) on the plate(the second priority) is obtained. - A method as set forth in Claim 1 or Claim 2, the method being characterized in that the patterns in the sequence BG are displayed according to display method I or display method 2 described below, whereby it is determined whether the patterns having periodicity are manifested in the sequence BG.
<Display methods>(Method 1) A method whereby a sub-sequence formed from 1 or more elements is extracted from a sequence, each number contained in the sub-sequence forming a color dot, wherein hue, luminosity, saturation, or a combination thereof, is defined by each type of number, the color dot further being sequentially output in a color dot matrix arranged in a matrix shape, a color pattern obtained from the output of the color dot matrix causing the intrinsic regularity to be revealed.(Method 2) A method whereby a sequence is divided into a plurality of sub-sequences, each number contained in the divided sub-sequences forming a sub-color dot column wherein hue, luminosity, saturation, or a combination thereof, is defined by each type of number, the sub-color dot columns being arranged in an aligned manner to output a color dot matrix wherein the color dots are arranged in a matrix shape, a color pattern obtained from the output of the color dot matrix causing latent characteristics within the sequence to be revealed. - A method as set forth in Claim 3, the method being characterized in that, in display method 1 or display method 2, each number forming a sequence Ij (j = 1, ...,m) is arranged according to the following positioning pattern:(here, k is an integer of 2 or more, n is a natural number such that nk + 1 ≦ m ≦ nk + k), a color dot matrix is output, latent characteristics within the sequence being revealed.

- A method as set forth in Claim 4, the method being characterized in that when p is any given natural number less than m, and r is any given natural number, when the display method set forth above is implemented while substituting k = p, p + r, p + 2r, p + 3r, ..., a color dot matrix group is output wherein color dot matrices of p, p + r, p + 2r, p + 3r ... are all arranged in an aligned manner.
Applications Claiming Priority (3)
| Application Number | Priority Date | Filing Date | Title |
|---|---|---|---|
| JP2001232364 | 2001-07-31 | ||
| JP2001232364A JP4356270B2 (en) | 2001-07-31 | 2001-07-31 | Evaluation method of spot uniformity in array |
| PCT/JP2002/007796 WO2003012411A1 (en) | 2001-07-31 | 2002-07-31 | Method of evaluating uniformity of spots in arrays |
Publications (4)
| Publication Number | Publication Date |
|---|---|
| EP1422514A1 true EP1422514A1 (en) | 2004-05-26 |
| EP1422514A4 EP1422514A4 (en) | 2007-02-21 |
| EP1422514B1 EP1422514B1 (en) | 2008-09-10 |
| EP1422514B9 EP1422514B9 (en) | 2009-03-04 |
Family
ID=19064297
Family Applications (1)
| Application Number | Title | Priority Date | Filing Date |
|---|---|---|---|
| EP02746153A Expired - Lifetime EP1422514B9 (en) | 2001-07-31 | 2002-07-31 | Method of evaluating uniformity of spots in arrays |
Country Status (5)
| Country | Link |
|---|---|
| US (1) | US7186510B2 (en) |
| EP (1) | EP1422514B9 (en) |
| JP (1) | JP4356270B2 (en) |
| DE (1) | DE60228852D1 (en) |
| WO (1) | WO2003012411A1 (en) |
Families Citing this family (3)
| Publication number | Priority date | Publication date | Assignee | Title |
|---|---|---|---|---|
| JP4736516B2 (en) * | 2005-04-22 | 2011-07-27 | ソニー株式会社 | Biological information processing apparatus and method, program, and recording medium |
| JP2011226953A (en) * | 2010-04-21 | 2011-11-10 | Furukawa Electric Co Ltd:The | Zone discrimination device, zone discrimination method and program |
| JP5895613B2 (en) | 2012-03-08 | 2016-03-30 | 東レ株式会社 | Determination method, determination apparatus, determination system, and program |
Family Cites Families (2)
| Publication number | Priority date | Publication date | Assignee | Title |
|---|---|---|---|---|
| JP3149824B2 (en) * | 1997-08-20 | 2001-03-26 | 東亞合成株式会社 | Character string feature manifestation method |
| JP3537752B2 (en) * | 2000-09-01 | 2004-06-14 | 日立ソフトウエアエンジニアリング株式会社 | Method for displaying experimental results of hybridization reaction using biochip and method for evaluating experimental errors |
-
2001
- 2001-07-31 JP JP2001232364A patent/JP4356270B2/en not_active Expired - Fee Related
-
2002
- 2002-07-31 WO PCT/JP2002/007796 patent/WO2003012411A1/en not_active Ceased
- 2002-07-31 EP EP02746153A patent/EP1422514B9/en not_active Expired - Lifetime
- 2002-07-31 US US10/485,030 patent/US7186510B2/en not_active Expired - Fee Related
- 2002-07-31 DE DE60228852T patent/DE60228852D1/en not_active Expired - Lifetime
Also Published As
| Publication number | Publication date |
|---|---|
| JP2004340574A (en) | 2004-12-02 |
| EP1422514A4 (en) | 2007-02-21 |
| EP1422514B9 (en) | 2009-03-04 |
| US20040201840A1 (en) | 2004-10-14 |
| US7186510B2 (en) | 2007-03-06 |
| JP4356270B2 (en) | 2009-11-04 |
| WO2003012411A1 (en) | 2003-02-13 |
| DE60228852D1 (en) | 2008-10-23 |
| EP1422514B1 (en) | 2008-09-10 |
Similar Documents
| Publication | Publication Date | Title |
|---|---|---|
| Jain et al. | Fully automatic quantification of microarray image data | |
| US7209836B1 (en) | Method and system for automatically creating crosstalk-corrected data of a microarray | |
| AU2020276115A1 (en) | Systems and devices for characterization and performance analysis of pixel-based sequencing | |
| Reimers et al. | Quality assessment of microarrays: visualization of spatial artifacts and quantitation of regional biases | |
| JP2000032998A (en) | Integrity assessment technique for synthesis using cycle- adaptable probe | |
| US7208277B2 (en) | Method for correcting inter-pin spotting amount error for a microarray | |
| JP2004020563A (en) | Microarray identification means | |
| US20060121491A1 (en) | Partially degenerate oligonucleotide standards and methods for generating the same | |
| US7332274B2 (en) | Process of quality examining for microarray of biological material | |
| US20030182066A1 (en) | Method and processing gene expression data, and processing programs | |
| US7186510B2 (en) | Method for evaluating uniformity of spots on an array | |
| JP3537752B2 (en) | Method for displaying experimental results of hybridization reaction using biochip and method for evaluating experimental errors | |
| JP5895613B2 (en) | Determination method, determination apparatus, determination system, and program | |
| US8173367B2 (en) | In situ dilution of external controls for use in microarrays | |
| JP4266575B2 (en) | Gene expression data processing method and processing program | |
| GB2563577A (en) | Methods and apparatus for selection and characterisation of genetically transformed cells | |
| EP1261737A1 (en) | Method and system for the simultaneous and multiple detection and quantification of the hybridization of molecular compounds such as nucleic acids, dna, rna, pna and proteins | |
| WO2001027809A2 (en) | Visualizing relations in data sets | |
| JP3944576B2 (en) | Aptamer acquisition method using microarray | |
| JP3646715B2 (en) | Analysis support method and analysis support apparatus for hybridized array | |
| CN114690081B (en) | A DNA probe and chip connection test device and method | |
| JP4076698B2 (en) | Method and apparatus for detecting biological material | |
| US20070233399A1 (en) | Method for acquiring reaction data from probe-fixed carrier | |
| Cysewska-Sobusiak et al. | Simulation of microimages emitted by virtual array of testing oligonucleotides | |
| JP2006078387A (en) | Probe arrangement method of probe carrier |
Legal Events
| Date | Code | Title | Description |
|---|---|---|---|
| PUAI | Public reference made under article 153(3) epc to a published international application that has entered the european phase |
Free format text: ORIGINAL CODE: 0009012 |
|
| 17P | Request for examination filed |
Effective date: 20040129 |
|
| AK | Designated contracting states |
Kind code of ref document: A1 Designated state(s): AT BE BG CH CY CZ DE DK EE ES FI FR GB GR IE IT LI LU MC NL PT SE SK TR |
|
| AX | Request for extension of the european patent |
Extension state: AL LT LV MK RO SI |
|
| A4 | Supplementary search report drawn up and despatched |
Effective date: 20070123 |
|
| RIC1 | Information provided on ipc code assigned before grant |
Ipc: G01N 33/53 20060101ALI20070117BHEP Ipc: G01N 37/00 20060101ALI20070117BHEP Ipc: G06T 1/00 20060101ALI20070117BHEP Ipc: G01N 21/64 20060101AFI20030214BHEP Ipc: C12N 15/09 20060101ALI20070117BHEP |
|
| 17Q | First examination report despatched |
Effective date: 20070326 |
|
| GRAP | Despatch of communication of intention to grant a patent |
Free format text: ORIGINAL CODE: EPIDOSNIGR1 |
|
| RBV | Designated contracting states (corrected) |
Designated state(s): DE FR GB |
|
| GRAS | Grant fee paid |
Free format text: ORIGINAL CODE: EPIDOSNIGR3 |
|
| GRAA | (expected) grant |
Free format text: ORIGINAL CODE: 0009210 |
|
| AK | Designated contracting states |
Kind code of ref document: B1 Designated state(s): DE FR GB |
|
| REG | Reference to a national code |
Ref country code: GB Ref legal event code: FG4D |
|
| REF | Corresponds to: |
Ref document number: 60228852 Country of ref document: DE Date of ref document: 20081023 Kind code of ref document: P |
|
| PLBE | No opposition filed within time limit |
Free format text: ORIGINAL CODE: 0009261 |
|
| STAA | Information on the status of an ep patent application or granted ep patent |
Free format text: STATUS: NO OPPOSITION FILED WITHIN TIME LIMIT |
|
| 26N | No opposition filed |
Effective date: 20090611 |
|
| REG | Reference to a national code |
Ref country code: FR Ref legal event code: PLFP Year of fee payment: 15 |
|
| REG | Reference to a national code |
Ref country code: FR Ref legal event code: PLFP Year of fee payment: 16 |
|
| PGFP | Annual fee paid to national office [announced via postgrant information from national office to epo] |
Ref country code: FR Payment date: 20170613 Year of fee payment: 16 |
|
| PGFP | Annual fee paid to national office [announced via postgrant information from national office to epo] |
Ref country code: GB Payment date: 20170726 Year of fee payment: 16 Ref country code: DE Payment date: 20170725 Year of fee payment: 16 |
|
| REG | Reference to a national code |
Ref country code: DE Ref legal event code: R119 Ref document number: 60228852 Country of ref document: DE |
|
| GBPC | Gb: european patent ceased through non-payment of renewal fee |
Effective date: 20180731 |
|
| PG25 | Lapsed in a contracting state [announced via postgrant information from national office to epo] |
Ref country code: FR Free format text: LAPSE BECAUSE OF NON-PAYMENT OF DUE FEES Effective date: 20180731 Ref country code: GB Free format text: LAPSE BECAUSE OF NON-PAYMENT OF DUE FEES Effective date: 20180731 Ref country code: DE Free format text: LAPSE BECAUSE OF NON-PAYMENT OF DUE FEES Effective date: 20190201 |