-
The present invention relates to the use of the
murine genes identified by retroviral insertional tagging as
well as their human homologues for the identification and
development of anti-cancer drugs, like small molecule
inhibitors, antibodies, antisense molecules, RNA interference
(RNAi) molecules and gene therapies against these genes
and/or their expression products, and especially anti-cancer
drugs effective against solid tumors of e.g. lung, colon,
breast, prostate, ovarian, pancreas and leukemia. The
invention further relates to the use of said genesfor the
diagnosis of cancer, the use of antibodies or fragments
derived therefrom for the diagnosis of cancer, pharmaceutical
preparations comprising one or more of said inhibitors and
methods for the treatment of cancer using said pharmaceutical
preparations.
-
After a quarter century of rapid advances, cancer
research has generated a rich and complex body of knowledge
revealing cancer to be a disease involving dynamic changes in
the genome. Cancer is thought to result from at least six
essential alterations in cell physiology that collectively
dictate malignant growth: self-sufficiency in growth signals,
insensitivity to growth-inhibitory (anti-growth) signals,
evasion of programmed cell death (apoptosis), limitless
replicative potential, sustained angiogenesis, and tissue
invasion and metastasis.
-
In general, these essential alterations are the
result of mutations in genes involved in controlling these
cellular processes. These mutations include deletions, point
mutations, inversions and amplifications. The mutations
result in either an aberrant level, timing, and/or location
of expression of the encoded protein or a change in function
of the encoded protein. These alterations can affect cell
physiology either directly, or indirectly, for example via
signalling cascades.
-
Identifying genes which promote the transition from a
normal cell into a malignant cell provides a powerful tool
for the development of novel therapies for the treatment of
cancer.
-
One of the most common therapies for the treatment of
cancer is chemotherapy. The patient is treated with one or
more drugs which function as inhibitors of cellular growth
and which are thus intrinsically toxic. Since cancer cells
are among the fastest growing cells in the body, these cells
are severely affected by the drugs used. However, also normal
cells are affected resulting in, besides toxicity, very
severe side-effects like loss of fertility.
-
Another commonly used therapy to treat cancer is
radiation therapy. Radiotherapy uses high energy rays to
damage cancer cells and this damage subsequently induces cell
cycle arrest. Cell cycle arrest will ultimately result in
programmed cell death (apoptosis). However, also normal cells
are irradiated and damaged. In addition, it is difficult to
completely obliterate, using this therapy, all tumor cells.
Importantly, very small tumors and developing metastases
cannot be treated using this therapy. Moreover, irradiation
can cause mutations in the cells surrounding the tumor which
increases the risk of developing new tumors. Combinations of
both therapies are frequently used and a subsequent
accumulation of side-effects is observed.
-
The major disadvantage of both therapies is that they
do not discriminate between normal and tumor cells.
Furthermore, tumor cells have the tendency to become
resistant to these therapies, especially to chemotherapy.
-
Therapies directed at tumor specific targets would
increase the efficiency of the therapy due to i) a decrease
in the chance of developing drug resistance, ii) the drugs
used in these tumor specific therapies are used at much lower
concentrations and are thus less toxic and iii) because only
tumor cells are affected, the observed side-effects are
reduced.
-
The use of tumor specific therapies is limited by the
number of targets known. Since tumors mostly arise from
different changes in the genome, their genotypes are variable
although they may be classified as the same disease type.
This is one of the main reasons why not a single therapy
exists that is effective in all patients with a certain type
of cancer. Diagnosis of the affected genes in a certain tumor
type allows for the design of therapies comprising the use of
specific anti-cancer drugs directed against the proteins
encoded by these genes.
-
Presently, only a limited number of genes involved in
tumor development are known and there is a clear need for the
identification of novel genes involved in tumor development
to be used to design tumor specific therapies and to define
the genotype of a certain tumor.
-
In the research that led to the present invention, a
number of genes were identified by proviral tagging to be
involved in tumor development. Proviral tagging is a method
that uses a retrovirus to infect normal vertebrate cells.
After infection, the virus integrates into the genome thereby
disrupting the local organization of the genome. This
integration is random and, depending on the integration site,
affects the expression or function of nearby genes. If a gene
involved in tumor development is affected, the cell has a
selective advantage to develop into a tumor as compared to
the cells in which no genes involved in tumor development are
affected. As a result, all cells within the tumor originating
from this single cell will carry the same proviral
integration. Through analysis of the region nearby the
retroviral integration site, the affected gene can be
identified. Due to the size of the genome and the total
number of integration sites investigated in the present
invention, a gene that is affected in two or more independent
tumors must provide a selective advantage and therefore
contribute to tumor development. Such sites of integration
are designated as common insertion sites (CIS).
-
The genes claimed in the present invention are all
identified by common insertion sites and are so far not
reported to be involved in tumor development. The novel
cancer genes that were identified in this manner are the
following:
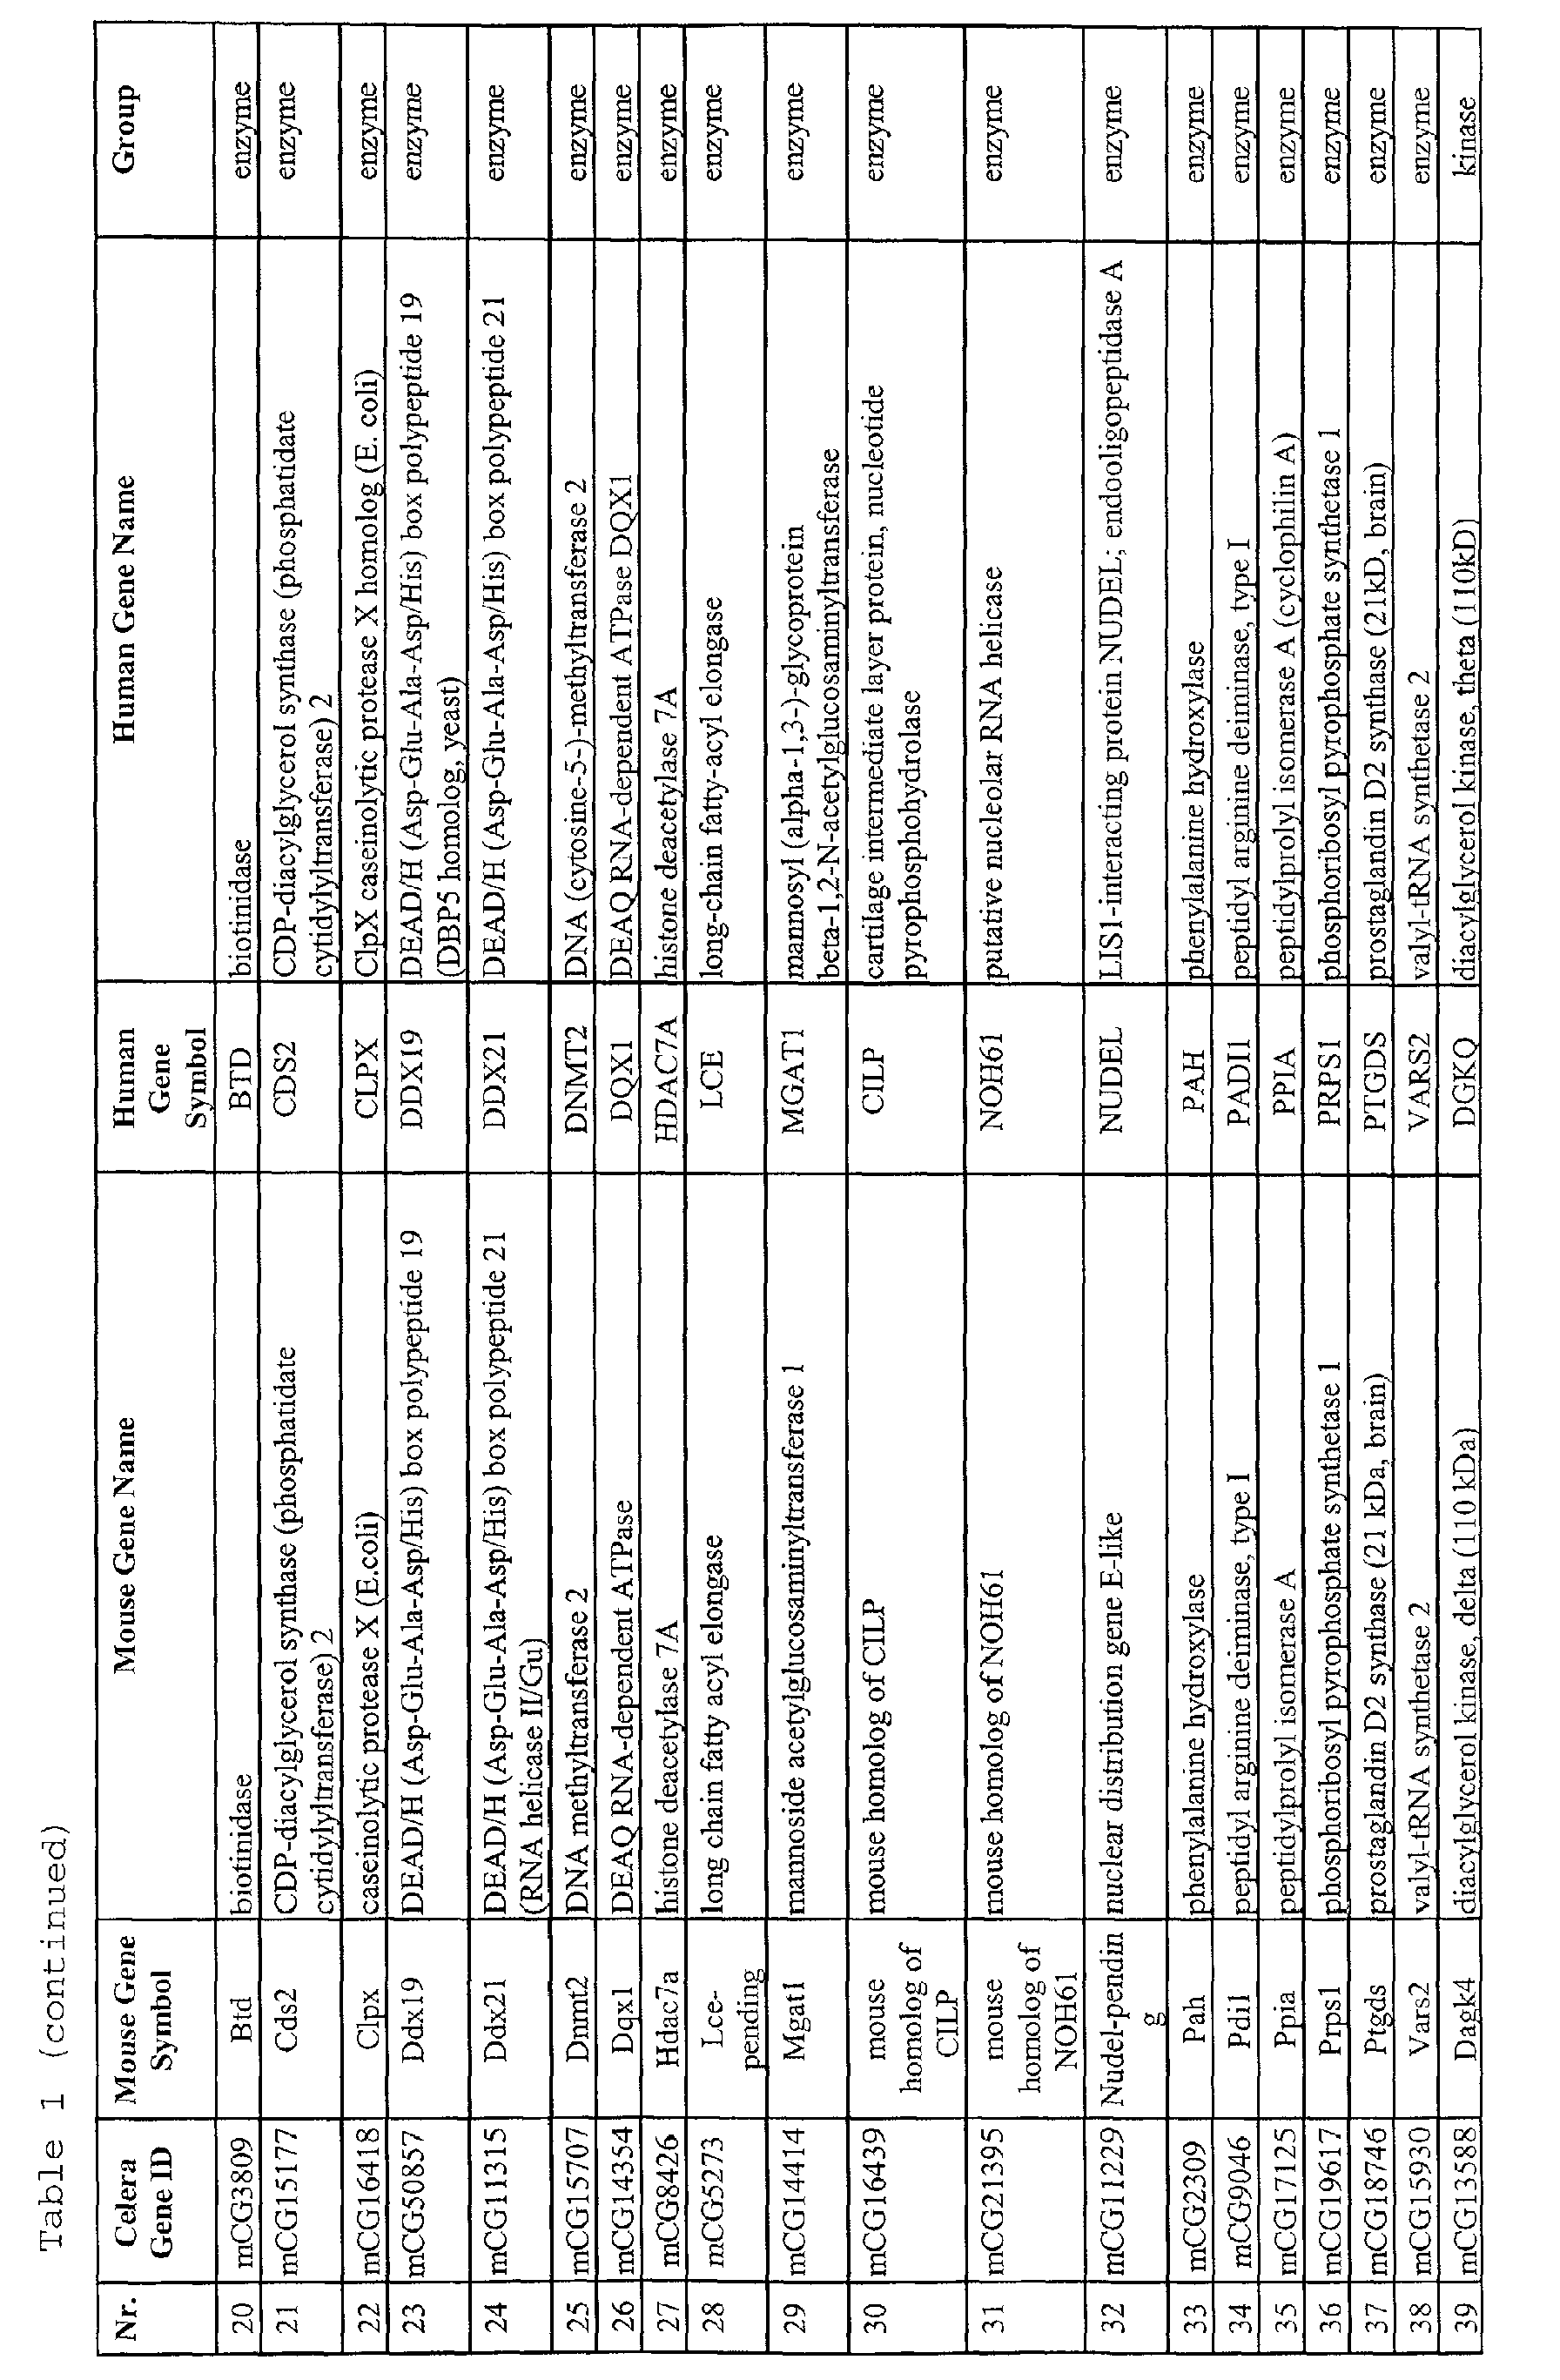
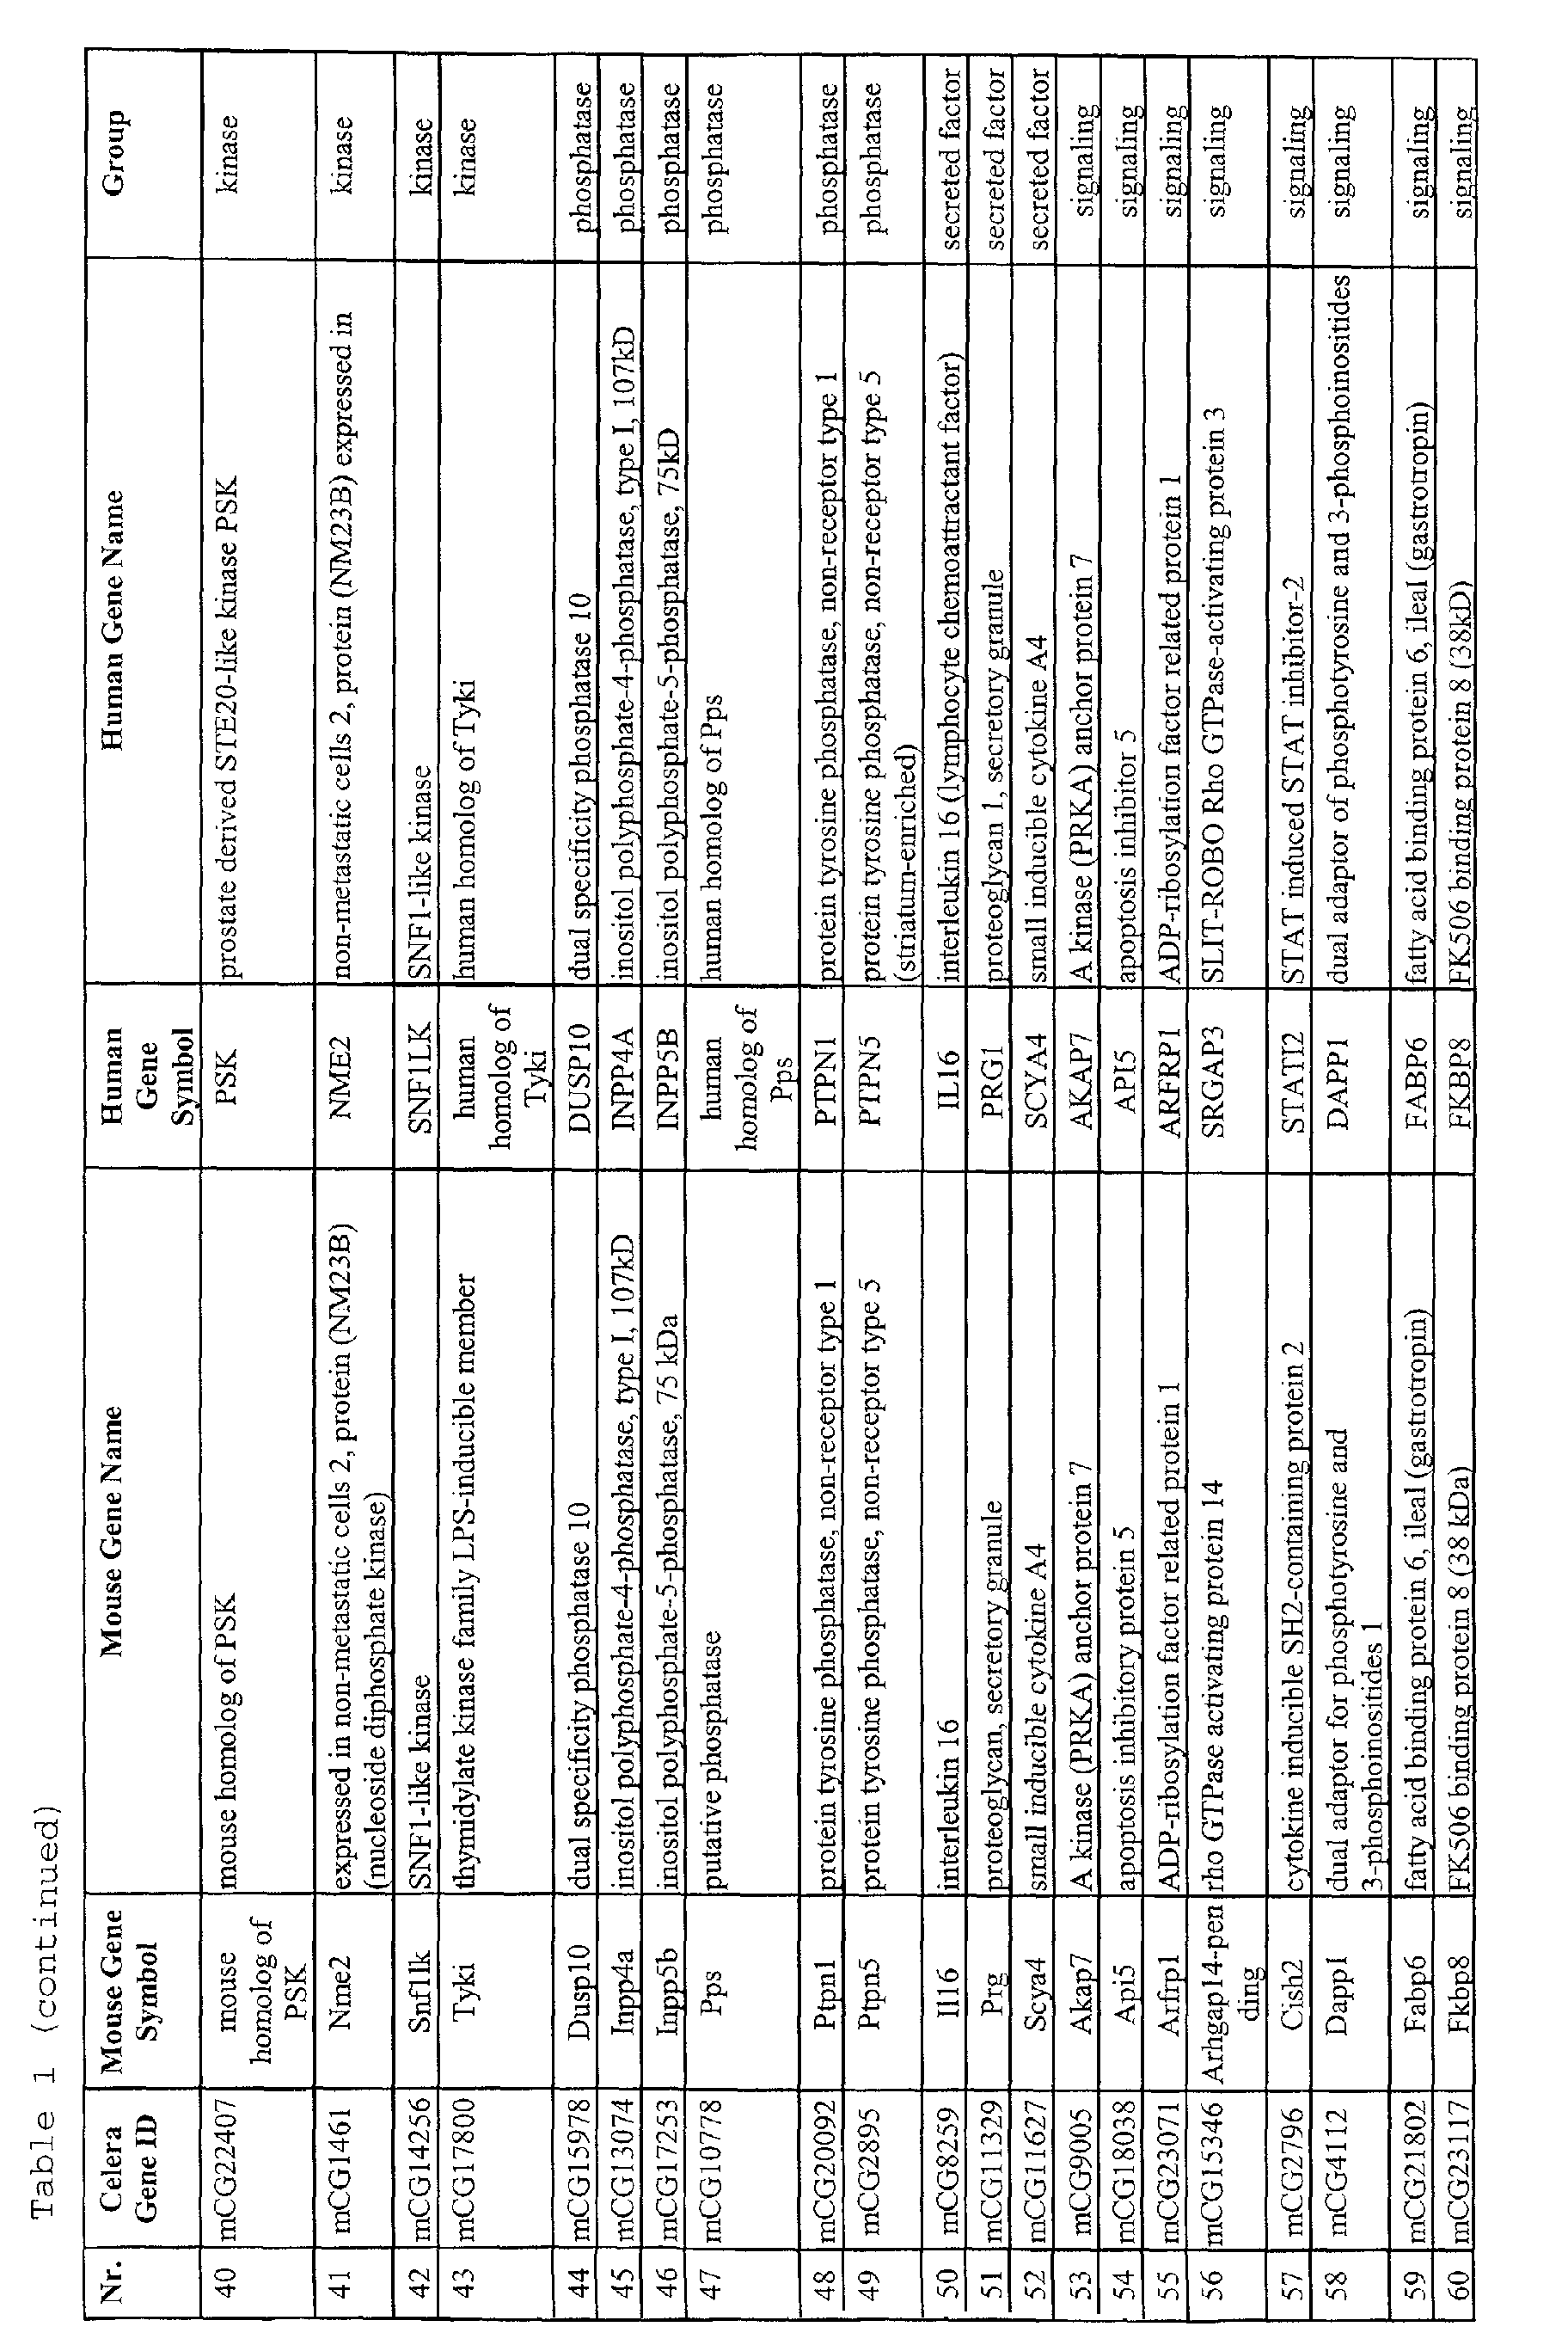
Adam11, AI462175, Cd24a, Edg3, Itgp, Kcnj16,
Kcnk5, Kcnn4, Ltb, Ly108, Ly6i, mouse homologue of
EMILIN,
Mrc1,
Ninj2, Nphs1, Sema4b, Tm9sf2, and
Tnfrsf17, encoding
cell surface proteins;
Apobec2, Btd,
Cds2, Clpx, Ddx19,
Ddx21, Dnmt2, Dqx1, Hdac7a, Lce-pending, Mgat1, mouse
homologue of
CILP, mouse homologue of
NOH61, Nudel-pending,
Pah, Pdi1,
Ppia, Prps1,
Ptgds, and
Vars2, encoding enzymes;
Dagk4, mouse homologue of
PSK, Nme2, Snf1lk and
Tyki,
encoding kinases;
Dusp10,
Inpp4a, Inpp5b, Pps, Ptpn1, and
Ptpn5, encoding phosphatases;
I116, Prg, and
Scya4, encoding
secreted factors;
Akap7, Api5, Arfrp1, Arhgapl4-pending,
Cish2, Dapp1, Fabp6, Fkbp8, Fliz1-pending, Hint, Ier5,
Jundp2-pending, Lmo6, Mid1, mouse homologue of
AKAP13, mouse
homologue of
BIN2, mouse homologue of
CEZANNE, mouse
homologue of
CHD2, mouse homologue of
MBLL, mouse homologue
of
SLC16A10, mouse homologue of
SLC16A6, mouse homologue of
SLC17A5, mouse homologue of
TAF5L, mouse homologue of
U1SNRNPBP, mouse homologue of
ZNF8, Mtap7, Myolc, Nkx2-3,
Nsf, Pcdh9, Pkig, Prdx2, Pscd1, Psmb1, Psme1, Psme2, Rg11,
Ril-pending, Sax1 Slc14a2, Slc7a1, Slc7a11,
Swap70, Txnip,
and
Ub13, encoding signaling proteins;
Clic3, Gtl1-13, mouse
homologue of
NOL5A, and
Vdac2, encoding structural proteins;
ABT1-pending, Ctbpl, Dermol,
Ebf, Elf4, Ldb1, mouse homologue
of
NR1D1, mouse homologue of
ZER6, Rest, Tbp, Yy1, Zfp238,
Zfp287, and
Zfp319, encoding proteins involved in
transcriptional regulation;
Lrrc2,
Satb1 Slfn4, genes with
the following Celera identification codes mCG10290, mCG10613,
mCG11234, mCG11325, mCG11355, mCG11803, mCG11817, mCG12566,
mCG12630, mCG12824, mCG13346, mCG14143, mCG14155, mCG14342,
mCG15141, mCG15321, mCG16761, mCG16858, mCG17127, mCG17140,
mCG17142, mCG17547, mCG17569, mCG17751, mCG17799, mCG17802,
mCG17918, mCG18034, mCG1850, mCG18663, mCG18737, mCG20276,
mCG20905, mCG20994, mCG21403, mCG21505, mCG21529, mCG21530,
mCG21803, mCG22014, mCG22045, mCG22386, mCG2258, mCG22772,
mCG23032, mCG23035, mCG23069, mCG23075, mCG23120, mCG2543,
mCG2824, mCG2947, mCG3038, mCG3729, mCG3760, mCG50409,
mCG50651, mCG5068, mCG5070, mCG51393, mCG52252, mCG52498,
mCG53009, mCG53724, mCG55023, mCG55075, mCG55198, mCG55265,
mCG55512, mCG56069, mCG56089, mCG56746, mCG57132, mCG57265,
mCG57617, mCG57827, mCG58254, mCG58345, mCG5900, mCG5905,
mCG59368, mCG59375, mCG59533, mCG59662, mCG59810, mCG59997,
mCG60526, mCG60833, mCG61221, mCG61661, mCG61897, mCG61907,
mCG61943, mCG62177, mCG62971, mCG63537, mCG63601, mCG64346,
mCG64382, mCG64398, mCG65022, mCG65585, mCG65785, mCG66128,
mCG66379, mCG66776, mCG66965, mCG7831, mCG7856, mCG8424,
mCG9002, mCG9537, mCG9538, mCG9791, mCG9792, mCG9843,
mCG9875, mCG9877, and mCG9880. These genes are also listed in
Table 1.



-
The first object of the present invention to provide
novel genes involved in tumor development for use in the
design of tumor specific therapies is thus achieved by using
the human homologues of the murine genes of Table 1 to
develop inhibitors directed against these genes and/or their
expression products and to use these inhibitors for the
preparation of pharmaceutical compositions for the treatment
of cancer.
-
The term "human homologue" as used herein should be
interpreted as a human gene having the same function as the
gene identified in mouse.
-
In one embodiment of the present invention, the
inhibitors are antibodies and/or antibody derivatives
directed against the expression products of the genes listed
in Table 1. Such antibodies and/or antibody derivatives such
as scFv, Fab, chimeric, bifunctional and other antibody-derived
molecules can be obtained using standard techniques
generally known to the person skilled in the art. Therapeutic
antibodies are useful against gene expression products
located on the cellular membrane. Antibodies may influence
the function of their target proteins by for example steric
hindrance or blocking at least one of the functional domains
of those proteins. In addition, antibodies may be used for
deliverance of at least one toxic compound linked thereto to
a tumor cell.
-
In a second embodiment of the present invention, the
inhibitor is a small molecule capable of interfering with the
function of the protein encoded by the gene involved in tumor
development. In addition, small molecules can be used for
deliverance of at least one linked toxic compound to a tumor
cell.
-
Small molecule inhibitors are usually chemical
entities that can be obtained by screening of already
existing libraries of compounds or by designing compounds
based on the structure of the protein encoded by a gene
involved in tumor development. Briefly, the structure of at
least a fragment of the protein is determined by either
Nuclear Magnetic Resonance or X-ray crystallography. Based on
this structure, a virtual screening of compounds is
performed. The selected compounds are synthesized using
medicinal and/or combinatorial chemistry and thereafter
analyzed for their inhibitory effect on the protein in vitro
and in vivo. This step can be repeated until a compound is
selected with the desired inhibitory effect. After
optimization of the compound, its toxicity profile and
efficacy as cancer therapeutic is tested in vivo using
appropriate animal model systems.
-
The expression level of a gene can either be
decreased or increased during tumor development. Naturally,
inhibitors are used when the expression levels are elevated.
-
On a different level of inhibition nucleic acids can
be used to block the production of proteins by destroying the
mRNA transcribed from the gene. This can be achieved by
antisense drugs or by RNA interference (RNAi). By acting at
this early stage in the disease process, these drugs prevent
the production of a disease-causing protein. The present
invention relates to antisense drugs, such as antisense RNA
and antisense oligodeoxynucleotides, directed against the
genes listed in Table 1. Each antisense drug binds to a
specific sequence of nucleotides in its mRNA target to
inhibit production of the protein encoded by the target mRNA.
The invention furthermore relates to RNAi molecules. RNAi
refers to the introduction of homologous double stranded RNA
to specifically target the transcription product of a gene,
resulting in a null or hypomorphic phenotype. RNA
interference requires an initiation step and an effector
step. In the first step, input double-stranded (ds) RNA is
processed into 21-23-nucleotide 'guide sequences'. These may
be single- or double-stranded. The guide RNAs are
incorporated into a nuclease complex, called the RNA-induced
silencing complex (RISC), which acts in the second effector
step to destroy mRNAs that are recognized by the guide RNAs
through base-pairing interactions. RNAi molecules are thus
double stranded RNAs (dsRNAs) that are very potent in
silencing the expression of the target gene. The invention
provides dsRNAs complementary to the genes listed in Table 1.
-
The invention relates further to gene therapy, in
which the genes listed in Table 1 are used for the design of
dominant-negative forms of these genes which inhibit the
function of their wild-type counterparts following their
directed expression in a cancer cell.
-
A further aspect of the present invention relates to
the use of the murine genes as well as their human homologues
listed in Table 1 or their products for the development of
reagents for diagnosis of cancers.
-
The invention also provides diagnostic compositions
for diagnosing cancer, comprising histological examination of
tissues specimens using specific antibodies directed against
the products of the genes listed in Table 1 and/or in-situ
hybridisation analysis of gene expression using specific RNA
probes directed these genes.
-
Another object of the present invention is to provide
a pharmaceutical composition comprising the inhibitors
according to the present invention as active ingredient for
the treatment of cancer. The composition can further comprise
at least one pharmaceutical acceptable additive like for
example a carrier, an emulsifier, or a conservative.
-
In addition, it is the object of the present
invention to provide a method for treatment of cancer
patients which method comprises the administration of the
pharmaceutical composition according to the invention to
cancer patients.
-
The invention will be further illustrated in the
examples that follow and which are not given to limit the
invention. Example 1 describes how the genes of Table 1 were
identified. Example 2 describes the analysis of the YY1 gene
with respect to its involvement in tumor development. Example
3 describes the development of inhibitors of the genes and
their encoded products.
Examples
EXAMPLE 1
Identification of common viral insertion sites (CIS)
INTRODUCTION
-
To identify common viral integration sites in mouse
tumors and cell lines, the MuLV virus was used. Mice and cell
lines were either infected with murine leukemia virus 1.4
(Graffi-1.4 MuLV) or with Cas-Br-M MuLV.
-
The Graffi-MuLV is an ecotropic retroviral complex
causing leukemias in mice. This viral complex does not
contain oncogenic sequences itself but rather deregulates
genes due to proviral integrations. Graffi-1.4 MuLV is a
subclone of this complex and predominantly induces myeloid
leukemias.
-
NIH/Swiss mice infected with Cas-Br-M MuLV develop
myeloid or lymphoid malignancies also as a result of
retroviral insertion that affect target genes.
MATERIALS AND METHODS
1. Induction of leukemias
-
Newborn FVB/N mice or NIH/Swiss were injected
subcutaneously with 100 µl of a cell culture supernatant of
Graffi-1.4 MuLV or Cas-Br-M MuLV producing NIH3T3 cells,
respectively. Mice were checked daily for symptoms of
illness, i.e., apathy, white ears and tail, impaired
interaction with cage-mates, weight-loss, and dull fur.
Typically, leukemic mice suffered from enlarged spleens,
livers, thymuses, and lymph nodes. From these primary tumors,
chromosomal DNA was isolated for PCR-based screening. Blood
samples were taken from the heart. For morphological
analysis, blood smears and cytospins were fixed in methanol,
May-Grunwald-Giemsa (MGG) stained and analyzed.
-
Single-cell suspensions of different organs were
analyzed by flow cytometry using a flow cytometer. The cells
were labeled with the following rat monoclonal antibodies:
ER-MP54 (ER-MP54), ER-MP58 (ER-MP58), M1/70 (Mac-1), F4/80
(F4/80), RB68C5 (GR-1), ER-MP21 (transferrin receptor),
TER119 (Glycophorin A), 59-AD2.2 (Thy-1), KT3 (CD3), RA3 6B2
(B220) and E13 161-7(Seal). Immunodetection was performed
utilizing a Goat-anti-Rat antibody coupled to fluorescein
isothiocyanate.
2. Inverse PCR on Graffi-1.4 MuLV induced leukemias
-
Genomic DNA from the primary tumors was digested with
HhaI. After ligation, a first PCR was performed using Graffi-1.4
MuLV (LTR) specific primers L1
(5' TGCAAGATGGCGTTACTGTAGCTAG 3') and L2
(5' CCAGGTTGCCCCAAAGACCTG 3') (cycling conditions were 1 min
at 94°C, 1 min at 65°C, 3 min at 72°C [30 cycles]). For the
second nested PCR the primers L1N
(5' AGCCTTATGGTGGGGTCTTTC 3') and L2N
(5' AAAGACCTGAAACGACCTTGC 3') (15 cycles) were used. The PCR
reaction mixture contained 10 mM Tris-HCl (pH 8.3), 50 mM
KCL, 1.5 mM MgCl2, 200 µM dNTP's, 10 pmol of each primer and
2.5 units of Taq-polymerase. The PCR fragments were analyzed
on a 1% agarose gel and cloned in a TA cloning vector
according to standard procedures.
-
PCR products were sequenced with the M13 forward
primer 5' GACCGGCAGCAAAATG 3' and M13 reverse primer
5' CAGGAAACAGCTATGAC 3'. Virus flanking genomic sequences
were identified using the National Center for Biotechnology
Information (NCBI) and Celera databases.
3. Inverse PCR and RT-PCR on Cas-Br-M MuLV leukemias
-
Five µg of genomic DNA was digested with Sau3A or
with SstI. The products were treated with T4-ligase, which
resulted in the formation of circularized products.
Subsequently, an inverse PCR (ICPR) strategy was used with
primers specific for the Cas-Br-M MuLV LTR. For the Sau3A
digested/ligated fragments, the first PCR reaction was
carried out with primers pLTR4 (5'-CCG AAA CTG CTT ACC ACA-3')
and pLTR3
(5'-GGT CTC CTC AGA GTG ATT-3'), followed by a nested PCR
using pLTR5 (5'-ACC ACA GAT ATC CTG TTT-3') and pLTR6
(5'-GTG ATT GAC TAC CCG CTT-3'). Cycle conditions for both
PCRs were 15" at 94°C, 30" at 57°C, and 2' at 72°C for 10
cycles, and an additional 20 cycles following the conditions
15" at 94°C, 30" at 57°C, and 2'30" at 72°C. Reactions were
performed using Expand High Fidelity PCR System. In case of
SstI digested genomic DNA, the circularized DNA was amplified
using primers pLTR9 (5'-GAC TCA GTC TAT CGG AGG AC-3') and
pLTR1 (5'-CTT GCT GTT GCA TCC GAC TGG-3'), and pLTR10
(5'-GTG AGG GGT TGT GTG CTC-3') and 2
(5'-GTC TCG CTG TTC CTT GGG AGG-3'), respectively. The first
PCR was performed for 30 cycles 30" at 94°C, 1' at 60°C, and
3' at 72°C. The reaction was carried out with Expand High
Fidelity PCR system. Nested PCR conditions were 30 cycles of
30" at 94°C, 1' at 58°C, and 1' at 72°C. This reaction was
performed with Taq polymerase.
-
For RT-PCR, total RNA was isolated through a CsCl
gradient. First strand cDNA was obtained by reverse
transcriptase (RT) reactions with an oligo(dT)-adapter primer
(5'-GTC GCG AAT TCG TCG ACG CG(dT)15-3') at 37°C with 5 µg
RNA, using the Superscript™ Preamplification System.
Subsequently, PCRs (1' at 94°C, 1' at 58°C, 3' at 72°C (30
cycles)) were performed on the RT reactions of the leukemias
by using the LTR specific primer pLTR6 and the adapter primer
(5'-GTC GCG AAT TCG TCG ACG CG-3'). PCR products were
directly cloned into pCR2.1 and subjected to nucleotide
sequencing with the M13 forward primer 5'GACCGGCAGCAAAATG 3'
and m13 reverse primer 5'CAGGAAACAGCTATGAC 3'. Nucleotide
sequences were compared to the NCBI and Celera databases for
analysis.
Results
1. Graffi-1.4 MuLV induced leukemias
-
Leukemias developed 4 to 6 months after subcutaneous
injection of newborn FVB/N mice with Graffi-1.4 MuLV. Forty-eight
of the 59 leukemias (81%) analyzed exhibited
morphological characteristics of myeloid cells. Blast cell
percentages in the bone marrow ranged from 24 to 90% with an
average of 48%. Leukemia cells expressed immunophenotypic
marker profiles consistent with their myeloid appearance,
e.g., ER-MP54+, ER-MP58+, CD3-, GR-1+. Six leukemias with
blast-like morphology showed no immunophenotypic
differentiation markers, suggesting that these tumors
represented very immature leukemias. Only 3 leukemias were of
T-lymphoid origin (CD3+/MP58-/Thy1+) and 2 showed mixed
myeloid and erythroid features (Terll9+/ER-MP58+/F4/80+).
These results demonstrate that Graffi-1.4 MuLV infection
predominantly induce myeloid leukemia in FVB/N mice.
-
The provirus flanks were cloned, subjected to
nucleotide sequencing, and blasted against the Celera and
NCBI databases resulting in the identification of common
insertion sites. Of the genes identified, the ones that were
so far not described to be involved in tumor development are
listed in Table 1 combined with the novel cancer genes
identified from Cas-Br-M MuLV induced leukemias.
2. Cas-Br-M MuLV induced leukemias
-
Cas-Br-M MuLV injected newborn NIH/Swiss mice
developed leukemias by approximately 140 to 400 days
postinoculation. Most of these were myeloid leukemias (59%),
although T-cell (21%), and mixed T-cell/myeloid (21%)
leukemias were found.
-
To clone viral integration sites, a virus-LTR (long
terminal repeat) specific inverse PCR as well as RT-PCR were
applied as complementary approaches using DNA or RNA from 35
myeloid leukemias. The inverse PCR method was carried out on
19 primary leukemias and 9 cell lines, whereas the RT-PCR
based technique was performed on 12 cell lines and 2 primary
leukemias.
-
The provirus flanks were subjected to nucleotide
sequencing, blasted against the Celera and NCBI databases
resulting in the identification of common insertion sites. Of
the genes identified, the ones that were so far not described
to be involved in tumor development are listed in Table 1
combined with the novel cancer genes identified from Graffi-1.4
MuLV induced leukemias.
DISCUSSION
-
Although proviral integrations occur randomly, they
may affect the expression or function of nearby genes. If a
gene is affected in two or more independent tumors, this
indicates that these integrations provide a selective
advantage and therefore contribute to tumor development.
Multiple of these common insertion sites were identified of
which a large number are demonstrated for the first time to
play a role in cancer. Importantly, several of the other
genes identified are well-known cancer genes validating the
approach. This example shows that the pursued strategy can be
successfully used to identify novel genes that are involved
in tumor development.
EXAMPLE 2
Analysis of proviral integration sites in the YY1 gene and
their effect on tumorigenisis
INTRODUCTION
-
YY1 is a transcription factor of the CLI-Krüppel zinc
finger protein family that has been reported to activate or
repress transcription of a large variety of cellular and
viral genes. Additionally, YY1 regulates gene expression in a
cell-cycle dependent fashion. This may at least in part be
due to a control mechanism involving the retinoblastoma
protein (Rb), which releases YY1 in the S-phase of the cell
cycle. The transcriptional activity of YY1 is positively
regulated through acetylation of the protein by p300 and PCAF
and negatively regulated by deacetylation by histone
deacetylases HDAC1, HDAC2 and HDAC3.
-
This example describes that the YY1 gene is commonly
targeted in Graffi-1.4 MuLV-induced leukemias and that
deregulation of YY1 expression leads to defects in myeloid
cell development and contributes to leukemogenesis.
MATERIALS AND METHODS
1. Graffi-1.4 MuLV -induced leukemias
-
Newborn FVB/N mice were injected subcutaneously with
100 µl of a cell culture supernatant of Graffi-1.4 MuLV -
producing NIH3T3 cells. Mice were checked daily for symptoms
of illness, i.e., apathy, white ears and tail, impaired
interaction with cage-mates, weight-loss, and dull fur.
Typically, leukemic mice suffered from enlarged spleens,
livers, thymuses, and lymph nodes. From these primary tumors,
chromosomal DNA was isolated for PCR-based screening. Blood
samples were taken from the heart. For morphological
analysis, blood smears and cytospins were fixed in methanol,
May-Grunwald-Giemsa (MGG) stained and analyzed.
2. Immunophenotyping of the leukemic cells
-
Single-cell suspensions of different organs were
analyzed by flow cytometry using a flow cytometer. The cells
were labeled with the following rat monoclonal antibodies:
ER-MP54 (ER-MP54), ER-MP58 (ER-MP58), M1/70 (Mac-1), F4/80
(F4/80), RB68C5 (GR-1), ER-MP21 (transferrin receptor),
TER119 (Glycophorin A), 59-AD2.2 (Thy-1), KT3 (CD3), RA3 6B2
(B220) and E13 161-7(Sca1). Immunodetection was performed
utilizing a Goat-anti-Rat antibody coupled to fluorescein
isothiocyanate.
3. Production of retroviral vectors
-
The plasmid pCMV-HA-YY1, containing hemagglutinin
(HA)-tagged full length human YY1 cDNA, was digested with
XbaI and ApaI, and the HA-YY1 fragment was blunted and
ligated into the HpaI site of pLNCX and pBabe retroviral
vectors. PhoenixA packaging cells were transfected with
pLNCX-HA-YY1 or pBABE-HA-YY1. Supernatants containing high-titer,
helper-free recombinant virus were harvested from 80%
confluent producer cells cultured for 16-20 hours in
Dulbecco's modified Eagle's medium supplemented with 5% fetal
calf serum (FCS), penicillin (100 IU/ml) and streptomycin 100
ng/ml). To determine titers of BABE-HA-YY1 and BABE control
virus, the virus particles were pelleted by
ultracentrifugation at 41,000 rpm and RNA was extracted with
phenol (pH=4.0) and spot-blotted on nitrocellulose filters.
This blot was hybridized with a BABE specific probe (SV40
fragment, BamHI-HindIII digest).
4. Cell culture and retroviral gene transfer
-
The interleukin-3 (IL-3) dependent murine myeloid cell
line 32D containing the human wild type G-CSF- receptor (32D-WT1)
was infected with pLNCX-HA-YY1 virus and selected with
G418. Several independent clones were expanded for further
analysis.
-
Hematopoietic cells were harvested from the femurs and
tibiae of 8 to 12 week old FVB mice. After depletion of
adherent cells, the remaining cells were fractionated on a
Percoll™ gradient. Fraction I (density 1.058/1.0645) containing
the earliest hematopoietic progenitor cells was collected.
Cells were washed twice in HBSS/5% FCS/0.5% BSA and then
prestimulated for 2 days at a final concentration of 5x10⁵
cells/ml in Cell Gro® supplemented with a cytokine cocktail
composed of mIL-3 (10 ng/ml), hFlt3-ligand, hTPO, mSCF (100
ng/ml) and GM-CSF (2 u/ml). Retroviral infection was performed
in culture dishes coated with the recombinant fibronectin
fragment CH-296 at a concentration of 12 mg/ml. Before adding
the bone marrow cells, the dishes were preincubated with virus
supernatant (BABE-HA-YY1 or empty BABE) for 30 min at 37°C.
Subsequently, bone marrow cells were resuspended and mixed with
fresh virus supernatant in a 1:1 ratio and a fresh cytokine
cocktail was added. The cells (5x10⁵) were cultured overnight
at 37°C and 5% CO2. Virus supernatant and cytokine cocktail
were refreshed again the next day and cells were cultured for
another 24 hrs.
-
For colony assays, bone marrow cells were plated at
densities of 1 to 5x10⁴ cells per ml per dish in triplicate in
methylcellulose medium supplemented with 30% FBS, 1% BSA, 0.1mM
2-mercaptoethanol, 2mM L-glutamine, GM-CSF (20 u/ml) and with
or without 2.5 mg/ml puromycin to evaluate the infection
efficiency of the different retroviruses. Colonies consisting
of more than 50 cells were counted on day 7 of culture.
5. Promoter activity assay
-
The YY1 promoter containing subclone pdSS4.5 of 124
was digested with restriction enzymes MluI and BglII. This
YY1 promoter fragment was cloned in the luciferase reporter
plasmid pGL3. The Graffi-1.4 MuLV LTR sequence was cloned in
both orientations in the HpaI site. The Sp1 site was mutated
with the QuikChange Site-Directed Mutagenesis Kit by using
primer SPIMUTF: 5' GGACGGTTCGGGGCGAGAGC 3' and primer
SPIMUTR: 5' GCTCTCGCCCCGAACCGTCC 3'. As a positive control
pRSV-Luc was used. The pRSV-β-galactosidase was used for
reference. Empty pGL3 vector served as a negative control.
Luciferase assays were performed in HEK 293 cells according
to standard procedures. Cells were transfected by CaPO4
precititation with a mixture of 5 mg derived pGL3 plasmid
containing different promoter sequences and 2.5 mg pRSV-β-galactosidase,
supplemented with empty vector to a total
amount of 20 mg of total plasmid per ml.
6. Inverse PCR on Graffi-1.4 MuLV induced leukemias
-
Genomic DNA from the primary tumors was digested with
HhaI. After ligation, a first PCR was performed using Graffi-1.4
MuLV (LTR) specific primers L1
(5' TGCAAGATGGCGTTACTGTAGCTAG 3') and L2
(5' CCAGGTTGCCCCAAAGACCTG 3') (cycling conditions were 1 min
at 94°C, 1 min at 65°C, 3 min at 72°C [30 cycles]). For the
second nested PCR the primers L1N
(5' AGCCTTATGGTGGGGTCTTTC 3') and L2N
(5' AAAGACCTGAAACGACCTTGC 3') (15 cycles) were used. The PCR
reaction mixture contained 10 mM Tris-HCl (pH 8.3), 50 mM
KCL, 1.5 mM MgCl2, 200 µM dNTP's, 10 pmol of each primer and
2.5 units of Taq-polymerase. The PCR fragments were analyzed
on a 1% agarose gel and cloned in the TA cloning vector
according to standard procedures.
7. Detection of virus integration in the YY1 gene by specific
nested PCRs
-
To determine the orientation and localization of the
Graffi-1.4 provirus in the YY1 gene in an extended panel of
leukemias, a nested PCR was performed on 1 mg of genomic DNA
from primary tumors. For the first PCR, YY1 promoter region
specific primers Y1 5' AGGAATCAGGAGCAGAAGAAAGTTTTGGGA 3' and
Y2 5' CAATAAAGTCTGCTCTGACGAGAAACGCC 3' in combination with
Graffi-1.4 MuLV LTR specific primers L1 and L2 were used.
Cycling conditions were 1 min 94°C, 1 min 65 °C, 3 min 72°C,
30 cycles. For the second PCR, the nested primers Y1N 5'
AAACTCTCTGACTTACCTCCCTCTCCAAAGA 3' and Y2N 5'
GTTCGTTTTGCCTTTACTCGTTACTCGGG 3' in combination with the
nested primers L1N and L2N (30 cycles) were used. The
obtained PCR products were analyzed by Southern blotting. To
determine the orientation of the Graffi-1.4 provirus, the
blots were hybridized with radiolabeled YIP 5'
AAAACCTGCACAAGGACACCTTGCTAAGTATGTTT 3' and Y2P 5'
AGCACACGGTCGGCTACGCTCCGTCCGCTACCGCA 3' at 45°C in Church
buffer (0.5 M phosphate buffer, pH 7.2, 7% (w/v) SDS, 10 mM
EDTA) overnight. Signals were visualized by autoradiography
according to standard procedures.
8. Nucleotide sequencing
-
PCR products were cloned in the TA cloning vector and
sequenced with the M13 forward primer 5' GACCGGCAGCAAAATG 3'
and M13 reverse primer 5' CAGGAAACAGCTATGAC 3'. Virus
flanking genomic sequences were identified using the National
Center for Biotechnology Information (NCBI) and Celera
databases.
9. Western blotting
-
Lysates of 32D cells were prepared and subjected to
Western blotting. Antibodies used to visualize YY1 were Goat-
anti-YY1 or rabbit anti-hemagglutinin (HA) for HA-tagged
YY11. Goat-anti-Actin was used to control for equal loading
of lysates.
RESULTS
1. Graffi-1.4 MuLV-induced leukemias
-
Leukemias developed 4 to 6 months after subcutaneous
injection of newborn FVB/N mice with Graffi-1.4 MuLV.
Forty-eight of the 59 leukemias (81%) analyzed exhibited
morphological characteristics of myeloid cells. Blast cell
percentages in the bone marrow ranged from 24 to 90% with an
average of 48%. Leukemia cells expressed immunophenotypic
marker profiles consistent with their myeloid appearance,
e.g., ER-MP54+, ER-MP58+, CD3-, GR-1+. Six leukemias with
blast-like morphology showed no immunophenotypic
differentiation markers, suggesting that these tumors
represented very immature leukemias. Only 3 leukemias were of
T-lymphoid origin (CD3+/MP58-/Thy1+) and 2 showed mixed
myeloid and erythroid features (Ter119+/ER-MP58+/F4/80+).
These results demonstrate that Graffi-1.4 MuLV infection
predominantly induce myeloid leukemia in FVB/N mice.
2. Virus integrations in the YY1 gene
-
Inverse PCR was used to identify genomic sequences
flanking Graffi-1.4 MuLV integrations. Integrations were
found in several genes previously demonstrated to be involved
in MuLV-induced leukemias, e.g., Notch-1, Nf1, p53, Fli-1 and
Evi-1, as well as in novel loci. One of these newly
identified integrations occurred in the YY1 locus,
approximately 0.8 Kb upstream of the transcriptional
initiation site. In a subsequent analysis on independent cell
samples using nested PCR with LTR and YY1 primers it was
found that 23 integrations were in the same region, i.e., 0.5
to 1.5 kb upstream of the transcriptional start site, in 14
out of 20 leukemias tested. Integrations occurred in both
orientations in an approximately equal ratio. Searches for
virus integrations in other parts of the gene using
appropriate primer sets were negative.
3. Integration of Graffi-1.4 MuLV LTR deregulates YY1
transcription
-
Because integration of the virus occurred in both
orientations, it is most likely that viral enhancer sequences
in the LTR cause increased YY1 transcription in these
leukemias. However, integration in the promoter region of a
gene does not always result in alterations in expression. To
study how virus integration influences YY1 expression, the
Graffi-1.4 LTR was introduced at position -1417 in the YY1
promoter and transcriptional activity using a transient
reporter assay was quantified. A two-fold higher YY1 promoter
activity was measured following insertion of the Graffi-1.4
MuLV LTR, irrespective of the orientation of the LTR. Because
a Sp1 binding site at position -48 to -39 has previously been
shown to be important for induction of YY1 transcription, the
effects of insertion of the Graffi-1.4 MuLV LTR after
disruption of this site were also studied. While mutation of
the Sp1 binding site resulted in a 50% reduction of normal
promoter activity, the enhanced promoter activity caused by
the integration of the LTR sequence was not affected. This
result demonstrates that virus integration causes enhanced
and Sp1-independent transcription of YY1.
4. Ectopic expression of YY1 blocks G-CSF-induced
neutrophilic differentiation of 32D cells
-
The observation that integration of Graffi MuLV LTR
alters the expression of YY1 in murine acute myeloid leukemia
raised the question whether perturbed YY1 expression might
affect myeloid cell differentiation. 32D cell clones
expressing human G-CSF receptors (32D-WT1 cells) were
developed as a model to study neutrophilic differentiation.
-
Endogenous YY1 levels are high in parental 32D-WT1
cells cultured in IL-3 containing medium, under which
conditions the cells remain immature. However, upon transfer
of the cells to G-CSF-containing medium, in which cells
undergo neutrophilic differentiation, YY1 protein levels
declined from day 2 onward and remained low for the entire
culture period. To determine the consequences of perturbed
YY1 expression for myeloid cell development, we ectopically
expressed HA-tagged YY1 in these cells. As expected, YY1
expression in 32D-HA-YY1 cells remained high after switching
the cells to G-CSF. Growth rate and morphology of 32D-HA-YY1
cells cultured in IL-3 containing medium were similar to
nontransduced control cells. Strikingly, when 32D-HA-YY1
cells were switched to G-CSF-containing medium, neutrophilic
differentiation was markedly reduced. Instead, cells with a
blast-like morphology expanded exponentially for 8 days in
these cultures and rapidly died thereafter as a result of
apoptosis. Thus, sustained YY1 expression prevented
G-CSF-induced myeloid differentiation of 32D cells without
affecting the apoptotic response that normally accompanies
G-CSF-induced differentiation.
5. Ectopic expression of YY1 blocks CFU-GM colony formation
-
The above-mentioned experiments show that
constitutive expression of YY1 interferes with the
G-CSF-induced myeloid differentiation in 32D cells. Next, it
was investigated how perturbed expression of YY1 affects the
outgrowth of primary myelomonocytic progenitor cells
(CFU-GM). To this end, mouse bone marrow cells were
retrovirally transduced with BABE-HA-YY1 or empty BABE virus
and plated in GM-CSF-containing colony assays. Notably,
control bone marrow cells were subjected to equivalent titers
of control virus to exclude that differences in colony
outgrowth were caused by variations in transduction
efficiencies. Strikingly, GM-CSF-induced colony formation by
HA-YY1-transduced bone marrow cells was almost completely
blocked. This result demonstrates that perturbed expression
of YY1, instead of interfering with differentiation, causes a
growth arrest or results in premature apoptosis of CFU-GM or
their direct progeny.
DISCUSSION
-
This example demonstrates that the gene encoding the
transcriptional regulator YY1 is located in a common virus
integration site in Graffi-1.4 MuLV-induced myeloid leukemia.
The integrations occurred exclusively in the 5' promoter
region of the gene, 0.5 to 1.5 kb upstream of the major
transcriptional start site and resulted in a two-fold higher
transcription of the YY1 gene.
-
Perturbed expression of YY1 inhibited G-CSF-induced
myeloid differentiation in 32D cells and prevented the clonal
outgrowth of CFU-GM progenitor cells. Importantly, it was
observed that integration of Graffi-virus LTR sequences not
only enhanced YY1 transcription, but also made it entirely
independent of the recognition site for the transcription
factor Sp1, which has been shown to play a pivotal role in
YY1 expression. Although Sp1 expression has been reported to
be high in hematopoietic cells, it is downregulated during
differentiation in many cell types and may be involved in the
decrease in YY1 protein levels observed during myeloid
differentiation. Therefore, bypass of Sp1 transcriptional
control might be one of the mechanisms by which viral
integration deregulates YY1 protein levels in leukemic cells.
-
By demonstrating that perturbed expression of YY1 due
to proviral integrations contributes to tumor development,
this example validates the strategy of identifying novel
cancer genes by retroviral insertional tagging.
EXAMPLE 3
Preparation of inhibitors of the expression products of genes
involved in cancer from Examples 1 and 2
Confirmation of the involvement of the identified genes in
primary human tumors
-
The expression of the described genes, that were
originally identified by genome-wide functional screens
involving retroviral insertional tagging in mouse models (see
Examples 1 and 2), is determined in a panel of different
human tumor samples using microarray analysis. From an
extensive set of primary human tumors of various organs, RNA
is prepared using standard laboratory techniques to
investigate the expression of the described genes in these
samples relative to their expression in normal, unaffected
tissues from the same origin by using microarrays on which
these genes, or parts thereof, are spotted. Microarray
analysis allows rapid screening of a large set of genes in a
single experiment (DeRisi et al. Use of a cDNA microarray to
analyse gene expression patterns in human cancer. Nat Genet
14:457-60, 1996; Lockhart et al. Expression monitoring by
hybridization to high-density oligonucleotide arrays. Nat
Biotechnol 14:1649, 1996). Genes that are differentially
expressed in tumor and normal tissues as determined by
microarray analysis are further examined by other techniques
such as RT-PCR, Northern blot analysis, and, if gene-specific
antibodies are available, Western blot analysis. Confirmation
of differential expression of these genes demonstrates their
involvement in human tumors. These findings are further
substantiated by similar experiments using a panel of human
tumor cell lines.
Use of the identified genes as diagnostic tools for cancer
-
Genes that are differentially expressed in human
tumors are used as diagnostic tools for cancer (according to
Welsh et al. Analysis of gene expression profiles in normal
and neoplastic ovarian tissue samples identifies candidate
molecular markers of epithelial ovarian cancer. Proc Natl
Acad Sci USA 98:1176-81, 2001). For example, certain genes
are highly expressed in early-stage tumor cells compared with
normal tissue. In a clinical setting, the expression of these
genes is determined and used as a marker for the (pre-)
malignant status of tissue samples according to Hegdeet al.
(Identification of tumor markers in models of human
colorectal cancer using a 19,200-element complementary DNA
microarray. Cancer Res 61:7792-7, 2001).
Functional importance of the identified genes for human
cancer
-
Subsequently, the functional importance of the
differentially expressed genes for tumor cells is determined
by over-expression as well as by inhibition of the expression
of these genes. Selected human tumor cell lines are
transfected either with plasmids encoding cDNA of the genes
or with plasmids encoding RNA interference probes for the
genes. RNA interference is a recently developed technique
that involves introduction of double-stranded
oligonucleotides designed to block expression of a specific
gene (see Elbashir et al. Duplexes of 21-nucleotide RNAs
mediate RNA interference in cultured mammalian cells. Nature
411:494-8, 2001; Brummelkamp et al. A system for stable
expression of short interfering RNAs in mammalian cells.
Science 296:550-3, 2002). Using standard laboratory
techniques and assays, the transfected cell lines are
extensively checked for altered phenotypes that are relevant
for the tumor cells, e.g. cell cycle status, proliferation,
adhesion, apoptosis, invasive abilities, etc. These
experiments demonstrate the functional importance of the
identified genes for human cancer.
Structure-function analysis of selected targets
-
Genes that are shown to be both differentially
expressed and functionally important for human tumors are
selected for structure-function analysis. Deletion and point
mutation mutants of these genes are constructed and tested
for their functional competence compared with wild-type genes
(according to Ibanez et al. Structural and functional domains
of the myb oncogene: requirements for nuclear transport,
myeloid transformation, and colony formation. J Virol
62:1981-8, 1988; Rebay et al. Specific truncations of
Drosophila Notch define dominant activated and dominant
negative forms of the receptor. Cell 74:319-29, 1993). These
studies lead to the identification of functionally critical
domains as well as to dominant-negative variants, i.e. mutant
genes that suppress the function of their endogenous
counterparts (e.g. Kashles et al. A dominant negative
mutation suppresses the function of normal epidermal growth
factor receptors by heterodimerization. Mol Cell Biol
11:1454-63, 1991). These dominant-negatives provide
additional proof for the functional importance of the genes
and give insight into which therapeutic approaches can be
pursued to interfere with their function. Furthermore, the
cellular localization of the proteins encoded by the genes is
determined by immunofluorescence using standard laboratory
techniques. If the proteins are expressed on the cell-surface,
this allows for the development of antibody-based
inhibitors.
Development of antibody-based inhibitors
-
Differentially expressed genes that encode membrane-bound
proteins are selected as targets for conventional
antibody-based therapies. Antibodies are generated against
functionally relevant domains of the proteins and
subsequently screened for their ability to interfere with the
target's function using standard techniques and assays
(Schwartzberg. Clinical experience with edrecolomoab: a
monoclonal antibody therapy for colorectal carcinoma. Crit
Rev Oncol Hematol 40:17-24, 2001; Herbst et al. Monoclonal
antibodies to target epidermal growth factor receptor-positive
tumors: a new paradigm for cancer therapy. Cancer
94:1593-611, 2002). These antibodies are also useful as
diagnostic reagents (Syrigos et al. Use of monoclonal
antibodies for the diagnosis and treatment of bladder cancer.
Hybridoma 18:219-24, 1999).
Development of small molecule inhibitors
-
Differentially expressed genes that do not encode
membrane-bound proteins are selected as targets for the
development of small molecule inhibitors. To identify
putative binding sites or pockets for small molecules on the
surface of the target proteins, the three-dimensional
structures of those targets are determined by standard
crystallization techniques (de Vos et al. Three-dimensional
structure of an oncogene protein: catalytic domain of human
c-H-ras p21. Science 239:888-93, 1988; Williamset al.
Crystal structure of the BRCT repeat region from the breast
cancer-associated protein BRCA1. Nat Struct Biol 8:838-42,
2001). Additional mutational analysis is performed as
mentioned above to confirm the functional importance of the
identified binding sites. Subsequently, Cerius2 (Molecular
Simulations Inc., San Diego, CA, USA) and Ludi/ACD (Accelrys
Inc., San Diego, CA, USA) software is used for virtual
screening of small molecule libraries (Bohm. The computer
program Ludi: A new method for the de novo design of enzyme
inhibitors. J Comp Aided Molec Design 6:61-78, 1992). The
compounds identified as potential binders by these programs
are synthesized by combinatorial chemistry and screened for
binding affinity to the targets as well as for their
inhibitory capacities of the target protein's function by
standard in vitro and in vivo assays. In addition to the
rational development of novel small molecules, existing small
molecule compound libraries are screened using these assays
to generate lead compounds. Lead compounds identified are
subsequently co-crystallized with the target to obtain
information on how the binding of the small molecule can be
improved (Zeslawska et al. Crystals of the urokinase type
plasminogen activator variant beta(c)-uPAin complex with
small molecule inhibitors open the way towards structure-based
drug design. J Mol Biol 301:465-75, 2000). Based on
these findings, novel compounds are designed, synthesized,
tested, and co-crystallized. This optimization process is
repeated for several rounds leading to the development of a
high-affinity compound of the invention that successfully
inhibits the function of its target protein. Finally, the
toxicity of the compound is tested using standard assays
(commercially available service via MDS Pharma Services,
Montreal, Quebec, Canada) after which it is screened in an
animal model system.
Development of antisense molecule inhibitors
-
These inhibitors are either antisense RNA or antisense
oligodeoxynucleotides (antisense ODNs) and are prepared
synthetically or by means of recombinant DNA techniques. Both
methods are well within the reach of the person skilled in
the art. ODNs are smaller than complete antisense RNAs and
have therefore the advantage that they can more easily enter
the target cell. In order to avoid their digestion by DNAse,
ODNs but also antisense RNAs are chemically modified. For
targeting to the desired target cells, the molecules are
linked to ligands of receptors found on the target cells or
to antibodies directed against molecules on the surface of
the target cells.
Development of RNAi molecule inhibitors
-
Double-stranded RNA corresponding to a particular gene
is a powerful suppressant of that gene. The ability of dsRNA
to suppress the expression of a gene corresponding to its own
sequence is also called post-transcriptional gene silencing
or PTGS. The only RNA molecules normally found in the
cytoplasm of a cell are molecules of single-stranded mRNA. If
the cell finds molecules of double-stranded RNA, dsRNA, it
uses an enzyme to cut them into fragments containing 21-25
base pairs (about 2 turns of a double helix). The two strands
of each fragment then separate enough to expose the antisense
strand so that it can bind to the complementary sense
sequence on a molecule of mRNA. This triggers cutting the
mRNA in that region thus destroying its ability to be
translated into a polypeptide. Introducing dsRNA
corresponding to a particular gene will knock out the cell's
endogenous expression of that gene. This can be done in
particular tissues at a chosen time. A possible disadvantage
of simply introducing dsRNA fragments into a cell is that
gene expression is only temporarily reduced. However, a more
permanent solution is provided by introducing into the cells
a DNA vector that can continuously synthesize a dsRNA
corresponding to the gene to be suppressed. RNAi molecules
are prepared by methods well known to the person skilled in
the art.
Efficacy of antibody-based and small molecule inhibitors in
animal model systems
-
The efficacy of both the antibody-based and small
molecule inhibitors are tested in an appropriate animal model
system before entry of these inhibitors into clinical
development (e.g. Brekken et al. Selective inhibition of
vascular endothelial growth factor (VEGF) receptor 2
(KDR/Flk-1) activity by a monoclonal anti-VEGF antibody
blocks tumor growth in mice. Cancer Res 60:5117-24, 2000;
Wilkinson et al. Antibody targeting studies in a transgenic
murine model of spontaneous colorectal tumors. Proc Natl Acad
Sci USA 98:10256-60, 2001; Laird et al. SU6668 inhibits Flk-1/KDR
and PDGFRbeta in vivo, resulting in rapid apoptosis of
tumor vasculature and tumor regression in mice. FASEB J
16:681-90, 2002).