EP1389734A2 - Fat/water separation and fat minimization magnetic resonance imaging - Google Patents
Fat/water separation and fat minimization magnetic resonance imaging Download PDFInfo
- Publication number
- EP1389734A2 EP1389734A2 EP03254887A EP03254887A EP1389734A2 EP 1389734 A2 EP1389734 A2 EP 1389734A2 EP 03254887 A EP03254887 A EP 03254887A EP 03254887 A EP03254887 A EP 03254887A EP 1389734 A2 EP1389734 A2 EP 1389734A2
- Authority
- EP
- European Patent Office
- Prior art keywords
- fat
- water
- image
- phase
- substance
- Prior art date
- Legal status (The legal status is an assumption and is not a legal conclusion. Google has not performed a legal analysis and makes no representation as to the accuracy of the status listed.)
- Ceased
Links
- XLYOFNOQVPJJNP-UHFFFAOYSA-N water Substances O XLYOFNOQVPJJNP-UHFFFAOYSA-N 0.000 title claims abstract description 117
- 238000002595 magnetic resonance imaging Methods 0.000 title claims description 28
- 238000000926 separation method Methods 0.000 title 1
- 238000000034 method Methods 0.000 claims abstract description 63
- 238000004422 calculation algorithm Methods 0.000 claims abstract description 32
- 238000012937 correction Methods 0.000 claims abstract description 14
- 239000013598 vector Substances 0.000 claims abstract description 11
- 230000001629 suppression Effects 0.000 claims abstract description 9
- 239000000126 substance Substances 0.000 claims description 26
- 238000001208 nuclear magnetic resonance pulse sequence Methods 0.000 claims description 7
- 238000009826 distribution Methods 0.000 claims description 4
- 238000005315 distribution function Methods 0.000 claims description 2
- 238000009827 uniform distribution Methods 0.000 claims description 2
- 238000000264 spin echo pulse sequence Methods 0.000 claims 2
- 210000001519 tissue Anatomy 0.000 description 18
- 230000000694 effects Effects 0.000 description 15
- RGCLLPNLLBQHPF-HJWRWDBZSA-N phosphamidon Chemical compound CCN(CC)C(=O)C(\Cl)=C(/C)OP(=O)(OC)OC RGCLLPNLLBQHPF-HJWRWDBZSA-N 0.000 description 14
- 238000013459 approach Methods 0.000 description 6
- 238000003384 imaging method Methods 0.000 description 5
- 238000009792 diffusion process Methods 0.000 description 3
- 239000000463 material Substances 0.000 description 3
- 210000003205 muscle Anatomy 0.000 description 3
- 230000006978 adaptation Effects 0.000 description 2
- 239000000654 additive Substances 0.000 description 2
- 230000000996 additive effect Effects 0.000 description 2
- 238000002592 echocardiography Methods 0.000 description 2
- 239000011888 foil Substances 0.000 description 2
- 210000002441 meningeal artery Anatomy 0.000 description 2
- 230000011218 segmentation Effects 0.000 description 2
- 210000004003 subcutaneous fat Anatomy 0.000 description 2
- 208000004930 Fatty Liver Diseases 0.000 description 1
- 206010019708 Hepatic steatosis Diseases 0.000 description 1
- 101000657326 Homo sapiens Protein TANC2 Proteins 0.000 description 1
- 102100034784 Protein TANC2 Human genes 0.000 description 1
- 238000004458 analytical method Methods 0.000 description 1
- 230000004888 barrier function Effects 0.000 description 1
- 230000015572 biosynthetic process Effects 0.000 description 1
- 238000004364 calculation method Methods 0.000 description 1
- 230000008859 change Effects 0.000 description 1
- 238000011109 contamination Methods 0.000 description 1
- 230000010485 coping Effects 0.000 description 1
- 230000001419 dependent effect Effects 0.000 description 1
- 238000011161 development Methods 0.000 description 1
- 230000018109 developmental process Effects 0.000 description 1
- 230000009977 dual effect Effects 0.000 description 1
- 208000010706 fatty liver disease Diseases 0.000 description 1
- 230000005669 field effect Effects 0.000 description 1
- 238000010191 image analysis Methods 0.000 description 1
- 230000006872 improvement Effects 0.000 description 1
- 238000007689 inspection Methods 0.000 description 1
- 230000005415 magnetization Effects 0.000 description 1
- 230000000873 masking effect Effects 0.000 description 1
- 239000011159 matrix material Substances 0.000 description 1
- 238000005259 measurement Methods 0.000 description 1
- 230000007246 mechanism Effects 0.000 description 1
- 238000012986 modification Methods 0.000 description 1
- 230000004048 modification Effects 0.000 description 1
- 210000001328 optic nerve Anatomy 0.000 description 1
- 230000008569 process Effects 0.000 description 1
- 230000004044 response Effects 0.000 description 1
- 230000009291 secondary effect Effects 0.000 description 1
- 238000004088 simulation Methods 0.000 description 1
- 210000003625 skull Anatomy 0.000 description 1
- 238000001228 spectrum Methods 0.000 description 1
- 231100000240 steatosis hepatitis Toxicity 0.000 description 1
- 230000009466 transformation Effects 0.000 description 1
- 238000012800 visualization Methods 0.000 description 1
- 239000011800 void material Substances 0.000 description 1
Images





Classifications
-
- G—PHYSICS
- G01—MEASURING; TESTING
- G01R—MEASURING ELECTRIC VARIABLES; MEASURING MAGNETIC VARIABLES
- G01R33/00—Arrangements or instruments for measuring magnetic variables
- G01R33/20—Arrangements or instruments for measuring magnetic variables involving magnetic resonance
- G01R33/44—Arrangements or instruments for measuring magnetic variables involving magnetic resonance using nuclear magnetic resonance [NMR]
- G01R33/48—NMR imaging systems
- G01R33/4828—Resolving the MR signals of different chemical species, e.g. water-fat imaging
-
- G—PHYSICS
- G01—MEASURING; TESTING
- G01R—MEASURING ELECTRIC VARIABLES; MEASURING MAGNETIC VARIABLES
- G01R33/00—Arrangements or instruments for measuring magnetic variables
- G01R33/20—Arrangements or instruments for measuring magnetic variables involving magnetic resonance
- G01R33/44—Arrangements or instruments for measuring magnetic variables involving magnetic resonance using nuclear magnetic resonance [NMR]
- G01R33/48—NMR imaging systems
- G01R33/54—Signal processing systems, e.g. using pulse sequences ; Generation or control of pulse sequences; Operator console
- G01R33/56—Image enhancement or correction, e.g. subtraction or averaging techniques, e.g. improvement of signal-to-noise ratio and resolution
- G01R33/5607—Image enhancement or correction, e.g. subtraction or averaging techniques, e.g. improvement of signal-to-noise ratio and resolution by reducing the NMR signal of a particular spin species, e.g. of a chemical species for fat suppression, or of a moving spin species for black-blood imaging
-
- G—PHYSICS
- G01—MEASURING; TESTING
- G01R—MEASURING ELECTRIC VARIABLES; MEASURING MAGNETIC VARIABLES
- G01R33/00—Arrangements or instruments for measuring magnetic variables
- G01R33/20—Arrangements or instruments for measuring magnetic variables involving magnetic resonance
- G01R33/44—Arrangements or instruments for measuring magnetic variables involving magnetic resonance using nuclear magnetic resonance [NMR]
- G01R33/48—NMR imaging systems
- G01R33/54—Signal processing systems, e.g. using pulse sequences ; Generation or control of pulse sequences; Operator console
- G01R33/56—Image enhancement or correction, e.g. subtraction or averaging techniques, e.g. improvement of signal-to-noise ratio and resolution
- G01R33/565—Correction of image distortions, e.g. due to magnetic field inhomogeneities
- G01R33/56563—Correction of image distortions, e.g. due to magnetic field inhomogeneities caused by a distortion of the main magnetic field B0, e.g. temporal variation of the magnitude or spatial inhomogeneity of B0
Definitions
- the present invention relates generally to magnetic resonance imaging ("MRI") systems and methods. More specifically, the present invention relates to systems and methods for removing/reducing the chemical shift artifact associated with MRI using a single echo pulse sequence and for minimizing the partial volume effect of fat along an MRI slice select direction, as well as the chemical shift of fat along an MRI read direction.
- MRI magnetic resonance imaging
- MRI magnetic resonance imaging
- the expectation maximization (“EM”) algorithm described by Wells is well suited for allowing the estimation and correction of this artifact, recovering the true phase of the underlying signal.
- the EM approach utilizes a priori information about the classes of tissues to concurrently segment the image and provide an estimate of the bias field corruption.
- a non-Gaussian model is introduced to compensate for an "other" class of tissue, i.e., CSF, skull, background, etc., improving the performance of the EM algorithm.
- Van Leemput et al. add the additional step of updating the class means and variances of the EM algorithm.
- the techniques of the present invention present an adaptation of these algorithms for the purpose of fat suppression in MR imaging.
- the observed phases are modeled as Gaussian distributions as follows: p ( ⁇ i
- ⁇ water , ⁇ i ) G ( ⁇ i - ⁇ water - ⁇ i , ⁇ water ) p ( ⁇ i
- ⁇ fat , ⁇ i ) G ( ⁇ i - ⁇ fat - ⁇ i , ⁇ fat ), where ⁇ i is the unwrapped, observed phase at pixel i, ⁇ ⁇ [water, fat] is the tissue class, ⁇ water , ⁇ water and ⁇ fat , ⁇ fat are the class means and variances of the water and fat classes, respectively, and G(x, ⁇ ) is a Gaussian distribution function with zero mean and ⁇ variance, evaluated at x.
- a mathematical phantom was constructed.
- the phantom was constructed by forming water and fat images. These images are illustrated in Figure 5.
- the water image has a 3-pixel outer layer and circles of increasing size embedded in a fat background.
- the fat image is shifted 2.8 pixels relative to the water image to simulate a CSA and combined with the water image. Random white noise was added to both components of the complex images at 10% amplitude to form a simulated image.
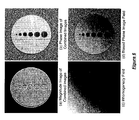
- Figure 6(a) shows the magnitude with the phase shown in Figure 6(b).
Landscapes
- Physics & Mathematics (AREA)
- High Energy & Nuclear Physics (AREA)
- Condensed Matter Physics & Semiconductors (AREA)
- General Physics & Mathematics (AREA)
- Health & Medical Sciences (AREA)
- General Health & Medical Sciences (AREA)
- Nuclear Medicine, Radiotherapy & Molecular Imaging (AREA)
- Radiology & Medical Imaging (AREA)
- Engineering & Computer Science (AREA)
- Signal Processing (AREA)
- Magnetic Resonance Imaging Apparatus (AREA)
Abstract
Description
- The present invention relates generally to magnetic resonance imaging ("MRI") systems and methods. More specifically, the present invention relates to systems and methods for removing/reducing the chemical shift artifact associated with MRI using a single echo pulse sequence and for minimizing the partial volume effect of fat along an MRI slice select direction, as well as the chemical shift of fat along an MRI read direction.
- Magnetic resonance imaging ("MRI") collects data in the Fourier domain, typically referred to as k-space, from the magnetic signals of protons precessing in a magnetic field. The spin frequency, also referred to as the resonance frequency, is a function of a material's gyromagnetic ratio and the strength of the magnetic field. In order to spatially position the collected signal, MRI systems and methods make an underlying assumption about this spin frequency: that the signal is composed primarily of protons in water. Typically, in the human body, this assumption is valid; however, protons in fat resonate at a lower frequency than protons in water. This resonance frequency difference is referred to as the chemical shift. When water and fat signals are imaged together, a resulting shift of the fat signal occurs. This frequency change in k-space results in a spatial shift in image space. During frequency encoding, the off resonance fat signal is interpreted to occur at a different spatial location from where the actual signal originated, producing a superposition of two offset images: an image of water and an image of fat response.
- The chemical shift artifact ("CSA") presents a significant barrier to the quantitative MR image analysis of small features, in which the amount of shift is comparable to the dimension of the object. The CSA appears as a "shadowing" effect in the read direction of MR images. This shadowing effect is illustrated in Figure 1. The resonance frequency of fat is lower than that of water (by approximately 220 Hz given a 1.5 T field). The fat signal is reconstructed with a spatial shift proportional to the B0 field, the field of view ("FOV") of the image, and the bandwidth used to acquire the signal. For example, given a 1.5 T magnet, a 20 cm FOV, a 256-pixel matrix, and a 20 kHz bandwidth, the resulting shift is 2.81 pixels, or 2.2 mm. Thus, an object composed of a water signal that is approximately 2.2 mm in size may be completely obscured. The borders of objects may also be corrupted by this artifact.
- Typically, the resulting CSA corruption is "read through" by radiologists, however, by corrupting the borders between adjacent regions, it foils quantitative measurements of small water signal features surrounded by fat-containing tissue. The magnitude of the shift increases proportionally to the strength of the magnetic field, thus as B0 field strength increases, the artifact's effects may also increase. This shift occurs primarily in the frequency encoding or read-out direction of the image; a secondary effect is present in the slice select direction of the image. Referring to Figure 1, in the zoomed view (Figure 1(b)), the CSA on the right leg appears as a void signal, as indicated by the arrow. In the left leg, the CSA appears as a high-intensity region where the fat and water signals superimpose, resulting in increased signal magnitude.
- Although the CSA may be useful for diagnostic purposes, such as "fatty liver," etc., several methods have been proposed to counteract it. These are broadly categorized into two classes: fat saturation or suppression and the Dixon method.
- Since its inception in 1984, the Dixon method has received much attention. The Dixon method seeks to remove the effects of the CSA by exploiting the phase relationships caused by the different resonance frequencies to produce two images: one with fat and water in phase and one with opposed phase. By choosing an echo time, TE, based on the chemical shift between fat and water, Dixon collected two images, one composed of fat and water signal in phase, and one with fat and water signals 180 degrees out of phase. The two images are added and subtracted to produce an image of the fat signal and of the water signal. In the following equations:
- l0 is the image collected with fat and water in phase and lπ is the image collected with fat and water at opposed phases. The fat and water images may be formed from the two images by the following equations:
- Dixon's original paper employed a simple method of addition and subtraction assuming that the only source of phase difference between the two signals was chemical shift. Intensity inhomogeneities, however, confound the two-point method, resulting in errors in the reconstructed images. This problem was addressed by Skinner and Glover and Coombs et al. Lodes et al. suggest the use of three images acquired at ∈ [-π, 0, π] to calculate the intensity inhomogeneities. This method has been extended to include a correction algorithm that fits a polynomial to the collected phase and performs trend analysis on the phase.
- Inhomogeneity correction is a pivotal component of any proposed single-point Dixon method. As used herein, the terms bias or bias field mean the magnetic field inhomogeneities and magnetic susceptibility of the human body that cause spatially varying shading across MRI images. The bias filed affects both the magnitude and the phase of the collected signal. Although the bias field effects have been studied and simulated, in practice the bias field in MRI images is approached by fitting approximations to the field rather than understanding the underlying mechanisms. A substantial body of literature has been centered around intensity bias correction in MRI. Meyer et al. use an LCJ algorithm for intensity bias correction. Several authors use a polynomial fit or thin-plate splines. Non-parametric correction schemes have also shown promise in coping with bias correction. Rather than retrospectively correct the artifact, Schomberg incorporates correction steps in the MRI reconstruction process. Information theory methods and homomorphic unsharp masking have also been applied to the problem.
- Prima presented a comparison of model-based methods and several authors have coupled segmentation with intensity correction. It is an adaptation of coupled segmentation that forms the core of the fat suppression technique described herein.
- In addition to the issues described above, to characterize tissues, the pixel values in two images are typically compared by division for T2*, T2, and diffusion. Although division may cancel some untoward effects, it is still necessary to remove/reduce the influences of surrounding and/or included fat. Fat may affect a plurality of surface voxels in small or thin tissue regions. The CSA moves fat in the slice select and read directions, producing overlap which may be several pixels wide. High bandwidth limits may alleviate this overlap, but increase noise.
- Ideally, calculations would provide correct tissue properties (T2*, etc.) at partial volume fractions below a relatively large, critical value, and the correct values for fat at relatively large volume fractions. Because fat and water signal phases may affect results, TE choice may be used to minimize partial volume effects.
- Thus what is still needed is a novel algorithm for distinguishing fat and water signals utilizing only one image, provided the correct phase information from the complex image may be accurately estimated. What is also needed is a novel algorithm for the robust estimation of parameters such as T2* that are adjacent to fat.
- As described above, magnetic resonance imaging ("MRI") fat-suppression techniques to overcome the chemical shift artifact ("CSA") have been computationally approached primarily by variations of the Dixon method. Multi-point, and specifically, three-point, methods dominate the literature. These methods estimate the contribution of fat and water signals by solving a set of equations using three echoes acquired with the relative phase of fat and water at ∈ [-π, 0, π]. The systems and methods of the present invention, however, present a novel approach to fat suppression that requires only a single image acquisition. By choosing the relative phase to be approximately = π/2 and employing an expectation maximization algorithm to classify the phase of the complex MR image, an estimate of the true phase of the image is obtained. From the phase estimate, fat and water images are obtained by projecting the complex vectors into fat and water components. The systems and methods of the present invention improve upon existing multi-point Dixon methods by reducing imaging time to a single image and eliminating the need for custom pulse sequence development. Mathematical and physical phantoms and clinically relevant results are reported.
- The techniques of the present invention include a number of discrete steps. These steps include developing an image signal model, choosing the proper scan parameters, unwrapping the phase of an image, forming a bias field estimate, applying a bias correction to the phase image, estimating the partial volume of fat and water at each voxel, and forming a fat-suppressed image.
- In one embodiment of the present invention, a system and a method for identifying the relative contribution of fat and water signals in a magnetic resonance ("MR") image include an algorithm operable for selecting an image signal model, selecting a scan parameter, forming a bias field estimate, applying a bias correction to a phase image, estimating the signal fraction of fat and water at each of a plurality of voxels, and forming a fat-suppressed image, a water-suppressed image, or a combination of a fat-based image and a water-based image.
- In another embodiment of the present invention, a magnetic resonance imaging ("MRI") fat suppression system and method requiring only a single image acquisition include an algorithm operable for selecting a relative phase of approximately = π/2 or another suitable relative phase, employing an expectation maximization algorithm to classify the phase of the complex image, and projecting complex vectors into fat and water components to obtain fat and water images.
- Because fat and water have different precession frequencies giving rise to each, resulting in a chemical shift along the MRI read direction, as well as a phase relationship between the components of fat and water within a given voxel, the well-understood inter-relationship between the phase of the magnetization vectors may be used to make a parameter being estimated less sensitive to the partial volume of fat of an object of interest, such as water or fat. This may be accomplished by choosing appropriate acquisition parameters, such as TE.
- In a further embodiment of the present invention, a method for minimizing a partial volume effect of fat and a chemical shift artifact associated with magnetic resonance ("MR") imaging includes selecting a predetermined range for the phase inter-relationship between fat and water, selecting a phase inter-relationship value between fat and water within the predetermined range, and estimating a tissue parameter using the phase inter-relationship value between fat and water. Preferably, the predetermined range for the phase inter-relationship between fat and water includes values between about 60 degrees and about 120 degrees, and, more preferably, about π/2. The tissue parameter estimated includes, for example, T1, T2, T2*, or diffusion.
- In a still further embodiment of the present invention, a system operable for minimizing a partial volume effect of fat and a chemical shift artifact associated with magnetic resonance ("MR") imaging includes an algorithm operable for selecting a predetermined range for the phase inter-relationship between fat and water, selecting a phase inter-relationship value between fat and water within the predetermined range, and estimating a tissue parameter using the phase inter-relationship value between fat and water. Preferably, the predetermined range for the phase inter-relationship between fat and water includes values between about 60 degrees and about 120 degrees, and, more preferably, about π/2. The tissue parameter estimated includes, for example, T1, T2, T2*, or diffusion.
- The invention will now be described in greater detail, by way of example, with reference to the drawings, in which:-
- Figure 1 is a magnetic resonance ("MR") image (expanded and zoomed view) of the "shadowing" effect in the phase encoding direction associated with a chemical shift artifact ("CSA");
- Figure 2 is a magnitude image and a vector field visualization of one example of a bias field;
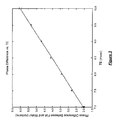
- Figure 3 is a plot of phase difference as a function of echo time, TE, as they relate to the systems and methods of the present invention;
- Figure 4 is an MR image of a head (Figure 4(a)) that includes an obvious phase discontinuity behind the left eye and near the left middle meningeal artery and legs (Figure 4(b)) with a phase wrap in the posterior portion of the legs at the boundary between the leg muscle and the subcutaneous fat layer;
- Figure 5 is an MR image (water and fat) associated with a mathematical phantom, constructed to evaluate the systems and methods of the present invention;
- Figure 6 is another MR image (water and fat) associated with the mathematical phantom, constructed to evaluate the systems and methods of the present invention;
- Figure 7 is an MR image (head and legs) of two normal, healthy volunteers acquired using the systems and methods of the present invention;
- Figure 8 is another MR image (head and legs) of two normal, healthy volunteers acquired using the systems and methods of the present invention;
- Figure 9 is a further MR image (head and legs) of two normal, healthy volunteers acquired using the systems and methods of the present invention; and
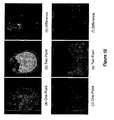
- Figure 10 is an MR image (head and legs) acquired using a two-point Dixon method for comparison purposes with the systems and methods of the present invention.
-
- The systems and methods of the present invention utilize and represent a novel algorithm for identifying the contribution of fat and water signals in magnetic resonance ("MR") images. An MR image is formed from a population of protons precessing in a spectrum of magnetic resonance frequencies. The two most common frequencies correspond to water and fat. In a simplified form, the image is created according to the following equation:
- In accordance with the systems and methods of the present invention, the chemical shift between fat and water was measured by taking a series of scans at different settings of TE. Regions of interest ("ROI") were selected in tissue where water signals predominate, and in fat dominated tissue. The ROls were chosen in adjacent areas to minimize inhomogeneity effects. The average phase of the two tissues was compared to calculate the approximate resonance frequency difference in Hz between the two materials. Figure 3 illustrates the data collected and a regression fit with r2 = 0.9988. From this data, a chemical shift of 206 Hz was calculated between fat and water in a 1.5 T GE Signa scanner (General Electric Medical Systems, Milwaukee, Wl). A gradient recalled echo pulse sequence was used. Because water protons precess 206 Hz faster than fat protons, every 4.85 msec the water protons accumulate one additional revolution as compared to the fat protons. The relative phase between the two materials is a function of TE: ΔTE = TE = TE/4.85 msec. Water and fat are in phase at 4.85 msec, 9.70 msec, 14.55 msec, etc. The relative phase is π/2 at 6.06 msec, 10.91 msec, 15.76 msec, etc., and -π/2 at 8.49 msec, 13.34 msec, etc.
- A phase unwrapping step is used to estimate the correct phase from complex MRI images. The collected image data is wrapped to ∈ [-π, π]. Examples are illustrated in Figure 4. The head image (Figure 4(a)) includes an obvious phase discontinuity behind the left eye and near the left middle meningeal artery. In Figure 4(b), a phase wrap occurs in the posterior portion of the legs at the boundary between the leg muscle and the subcutaneous fat layer. In both images, the phase of the background regions is caused by noise.
- A minimum spanning tree ("MST")-based phase unwrapping algorithm was implemented. Fundamentally, the MST algorithm performs region growing, choosing the next pixel to add to the region based on a weight. Edge weights are formed between two pixels pi and pj as follows:
- The pixel with the highest magnitude is chosen as the seed point. Its unwrapped phase, seed, is set to its wrapped phase, seed. At each step, the minimum edge weight of all of the border pixels is found and the corresponding border pixel (pi) is added to the MST. As the pixel is added to the MST, its unwrapped phase is calculated using the following equation:
- The expectation maximization ("EM") algorithm described by Wells is well suited for allowing the estimation and correction of this artifact, recovering the true phase of the underlying signal. The EM approach utilizes a priori information about the classes of tissues to concurrently segment the image and provide an estimate of the bias field corruption. In a refinement of the EM algorithm, a non-Gaussian model is introduced to compensate for an "other" class of tissue, i.e., CSF, skull, background, etc., improving the performance of the EM algorithm. Van Leemput et al. add the additional step of updating the class means and variances of the EM algorithm. The techniques of the present invention present an adaptation of these algorithms for the purpose of fat suppression in MR imaging.
- The techniques of the present invention involve the Bayesian estimation of the inhomogeneity artifact. Several modifications are made to adapt the Wells EM algorithm to phase images. Rather than model tissue classes corresponding to anatomic features, two classes representing resonance signal phase from water and fat are used. The uniformly distributed "other" class proposed by Guillemaud and Brady is incorporated to account for the phase of background pixels. The bias field modeled by Wells was of a multiplicative nature; in phase images it is additive, thus removing the step of computing a logarithmic transformation of the data. Whereas Wells selects tissue class means and variances from an atlas of previous scans, the mean class parameter for water signal is arbitrarily set to 0; that of fat is calculated from TE. Empirically, the variance of both classes was set to 0.2 and the "other" class probability was set to 0.3.
- The observed phases are modeled as Gaussian distributions as follows:
- Here, the systems and methods of the present invention deviate from Wells, adopting the approach of Guillemaud and Brady introducing the uniformly distributed "other" class as Γother, producing the following set of equations:
- Van Leemput et al. introduce a third step in the EM algorithm. In addition to the estimation of the class weights and the inhomogeneity field, estimates of the class parameters are performed using the following equations (adapted to phase images):
- Two approaches may be used to generate distinct water and fat images. The first approach uses Wij to calculate the intensity contributions of the water and fat signals. Alternatively, the β inhomogeneity field estimate may be used to correct the complex data and re-project the vector field into water and fat images.
- In order to evaluate the approaches described above, a mathematical phantom was constructed. The phantom was constructed by forming water and fat images. These images are illustrated in Figure 5. The water image has a 3-pixel outer layer and circles of increasing size embedded in a fat background. The fat image is shifted 2.8 pixels relative to the water image to simulate a CSA and combined with the water image. Random white noise was added to both components of the complex images at 10% amplitude to form a simulated image. Referring to Figure 6, Figure 6(a) shows the magnitude with the phase shown in Figure 6(b). An inhomogeneity field (Figure 6(c)) was constructed using the following equation and added to the phase image, creating Figure 6(d):
Algorithm Comparison Algorithm RMSwater RMSfield Wells 12.027191 0.367528 Guillemaud 6.196007 0.127467 Wells & Van Leemput 24.930277 0.454563 Guillemaud & Van Leemput 6.767336 1.672937 Dixon 27.010386 --- - The Guillemaud algorithm provided the most accurate performance on the mathematical phantom data; and the addition of the "other" class improved the original Wells results in the phantom study. This improvement is demonstrated quantitatively in the volunteer data described herein below.
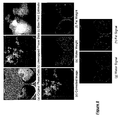
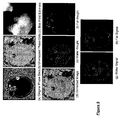
- Images of two normal, healthy volunteers were acquired. One dataset was of the head and another was of the legs, as illustrated in Figure 7. The head dataset was acquired using a GRE sequence on a 1.5 T GE Signa scanner with TE / TR of 6.1 msec / 700 msec and 42 degrees flip angle. Magnitude, real and imaginary images were saved by the scanner. The leg dataset was acquired on the same scanner with 9 msec /117 msec TE / TR times and 20 degrees flip angle. The complex data was preprocessed using the phase unwrapping algorithm described above. The Guillemaud algorithm with ϕwater = ϕfat = 0.2, Γwater = 0, Γfat = mod2π(TE / 4.85 msec), and Γother = 0.3. The results are illustrated in Figures 8 and 9.
- The extended two-point Dixon method was implemented for comparison purposes, with the results illustrated in Figure 10. No attempt was made to register the resulting images. Mis-registration artifacts may be seen in the "difference" images (Figures 10(c) and 10(f)). The single-point method provides qualitatively good performance in both head and leg images. Barring the motion artifact of the right eye, the single-point method performs on par with the two-point method, suppressing the fat signal occluding the optic nerve (Figure 10(a)). In Figure 10(d), several areas of artifact may be observed in the skin surface. While the two-point Dixon method faithfully preserves the outer skin surface, the single-point method fails due to the close proximity of air pixels with random phase that foils the inhomogeneity field estimate.
- Dual gradient echo images with various TEs were also compared by simulation, phantom studies, and volunteer studies. These comparisons included echo pairs with water and fat phase differences of 0, π/2, and π, and mixed cases. Using an optimal choice of acquisition parameters, the partial volume effect of fat was minimized along the MRI slice select direction. Using these optimal fat and water signals, the effect of chemical shift-induced overlap was also minimized in the MRI read direction.
- Fat contamination degrades T2* and similar inter-image comparisons. Errors are minimized when fat and water are π/2 out of phase in both images. For gradient echo images, the choice of TE fixes the phase difference. Single echo imaging requires separate control of Hahn and gradient echoes.
- Controlling fat effects allows a lower bandwidth to be used, producing higher signal-to-noise ratio, S/N, images.
- It is apparent that there has been provided, in accordance with the systems and methods of the present invention, a means for removing/reducing the chemical shift artifact associated with MRI using a single echo pulse sequence and for minimizing the partial volume effect of fat along an MRI slice select direction, as well as the chemical shift of fat along an MRI read direction.
Claims (10)
- A method for identifying the relative contributions of signals of a first substance and a second substance in a magnetic resonance ("MR") image, the method comprising:wherein a magnetic resonance imaging ("MRI") fat suppression method is used to form the suppressed image, and wherein the MRI fat suppression method requires only a single image acquisition.selecting an image signal model;selecting a scan parameter;forming a bias field estimate;applying a bias correction to a phase image;estimating the signal fraction of the first substance and the second substance at each of a plurality of voxels; andforming a suppressed image with respect to the first substance or the second substance,
- The method of claim 1, wherein choosing a scan parameter comprises choosing an echo time, TE.
- The method of claim 1 or 2, further comprising acquiring the image using a pulse sequence comprising a pulse sequence selected from the group consisting of gradient recalled echo pulse sequence, a spin echo pulse sequence, and a fast spin echo pulse sequence.
- The method of claim 1, 2 or 3, further comprising unwrapping the phase of the image.
- The method of any preceding claim, further comprising modeling observed phases as Gaussian distributions according to the following equations:
- The method of claim 5, further comprising using a conditional probability of observed phase given a bias field β:wherein p(Γi) is a stationary prior probability distribution on the tissue class.

- The method of claim 6, further comprising introducing a uniformly distributed "other" class, Γother, producing the following equations:
- The method of claim 7, further comprising estimating class parameters using the following equations:
- The method of any preceding claim, further comprising generating images associated with the first substance and the second substance by correcting complex image data and re-projecting a vector field into the images associated with the first substance and the second substance.
- The method of claim 1, wherein the MRI fat suppression method comprises:selecting a relative phase between > -180 degrees and < 180 degrees, excluding = 0 degrees;employing an expectation maximization algorithm to classify the phase of the complex image; andprojecting complex vectors into fat and water components to obtain fat and water images.
Applications Claiming Priority (2)
| Application Number | Priority Date | Filing Date | Title |
|---|---|---|---|
| US219637 | 2002-08-15 | ||
| US10/219,637 US7099499B2 (en) | 2002-08-15 | 2002-08-15 | Fat/water separation and fat minimization magnetic resonance imaging systems and methods |
Publications (2)
| Publication Number | Publication Date |
|---|---|
| EP1389734A2 true EP1389734A2 (en) | 2004-02-18 |
| EP1389734A3 EP1389734A3 (en) | 2005-04-06 |
Family
ID=30770639
Family Applications (1)
| Application Number | Title | Priority Date | Filing Date |
|---|---|---|---|
| EP03254887A Ceased EP1389734A3 (en) | 2002-08-15 | 2003-08-06 | Fat/water separation and fat minimization magnetic resonance imaging |
Country Status (3)
| Country | Link |
|---|---|
| US (1) | US7099499B2 (en) |
| EP (1) | EP1389734A3 (en) |
| JP (1) | JP4675556B2 (en) |
Cited By (4)
| Publication number | Priority date | Publication date | Assignee | Title |
|---|---|---|---|---|
| CN103293500A (en) * | 2012-03-02 | 2013-09-11 | 西门子公司 | Method to generate magnetic resonance slice exposures |
| RU2683602C2 (en) * | 2015-02-02 | 2019-03-29 | Конинклейке Филипс Н.В. | Fingerprinting of magnetic resonance system |
| RU2693837C2 (en) * | 2014-11-14 | 2019-07-05 | Конинклейке Филипс Н.В. | Magnetic-resonance fingerprint method |
| RU2720476C2 (en) * | 2015-06-12 | 2020-04-30 | Конинклейке Филипс Н.В. | Creation of a magnetic resonance fingerprinting dictionary using an additional magnetic field coil |
Families Citing this family (29)
| Publication number | Priority date | Publication date | Assignee | Title |
|---|---|---|---|---|
| US7099499B2 (en) * | 2002-08-15 | 2006-08-29 | General Electric Company | Fat/water separation and fat minimization magnetic resonance imaging systems and methods |
| US8929620B2 (en) * | 2002-11-01 | 2015-01-06 | General Electric Company | Method and apparatus for simultaneous acquisition of multiple examination data |
| JP2006149583A (en) * | 2004-11-26 | 2006-06-15 | Kanazawa Univ | A data processing apparatus, a data processing method, a magnetic resonance imaging apparatus for obtaining echo image data used in the data processing apparatus or data processing method, and a magnetic resonance imaging method. |
| US7375522B2 (en) * | 2006-08-28 | 2008-05-20 | Wisconsin Alumni Research Foundation | Method for aligning multiple MR images acquired with alternating readout gradient |
| CA3065182C (en) | 2006-10-03 | 2022-05-17 | Duke University | Systems and methods for assessing pulmonary gas transfer using hyperpolarized 129xe mri |
| US20110255761A1 (en) * | 2007-06-26 | 2011-10-20 | University Of Rochester | Method and system for detecting lung tumors and nodules |
| US8761464B2 (en) * | 2007-07-13 | 2014-06-24 | Boad of Regents, The University of Texas System | Methods of efficient and improved phase-sensitive MRI |
| US8295575B2 (en) * | 2007-10-29 | 2012-10-23 | The Trustees of the University of PA. | Computer assisted diagnosis (CAD) of cancer using multi-functional, multi-modal in-vivo magnetic resonance spectroscopy (MRS) and imaging (MRI) |
| EP3112890A1 (en) * | 2008-04-17 | 2017-01-04 | Advanced MR Analytics AB | Improved magnetic resonance images |
| BRPI1006422A2 (en) * | 2009-03-30 | 2020-01-28 | Koninl Philips Electronics Nv | method of differentiation between water and adipose tissue in magnetic resonance imaging data (sib), computer readable medium, and, a system that uses a modified dixon technique to differentiate between water and adipose tissue in magnetic resonance imaging data (sib) ) |
| US8861828B2 (en) | 2009-11-26 | 2014-10-14 | Brainlab Ag | Shift compensation in medical image processing |
| US20110140696A1 (en) * | 2009-12-15 | 2011-06-16 | Huanzhou Yu | System and method for quantitative species signal separation using mr imaging |
| US8542893B2 (en) * | 2010-02-15 | 2013-09-24 | General Electric Company | System and method of pulmonary emboli detection for computed tomography |
| EP2365354A1 (en) * | 2010-02-22 | 2011-09-14 | Koninklijke Philips Electronics N.V. | Magnetic resonance imaging of chemical species with a spectral model |
| DE102010012948B4 (en) * | 2010-03-26 | 2012-04-26 | Siemens Aktiengesellschaft | Method for determining phase correction parameters and magnetic resonance apparatus |
| WO2012073181A2 (en) | 2010-12-02 | 2012-06-07 | Koninklijke Philips Electronics N.V. | Mr imaging using a multi-point dixon technique |
| US9030201B2 (en) | 2011-01-27 | 2015-05-12 | Siemens Medical Solutions Usa, Inc. | System and method for independent manipulation of a fat and a water component in magnetic resonance imaging |
| DE102011004881B4 (en) * | 2011-03-01 | 2012-10-31 | Siemens Aktiengesellschaft | Processing complex image data of an examination object with different spin species in MR imaging |
| US8232801B2 (en) | 2011-06-30 | 2012-07-31 | General Electric Company | Nuclear quadrupole resonance system and method for structural health monitoring |
| CN105392421B (en) * | 2013-08-07 | 2018-04-06 | 株式会社日立制作所 | Magnetic resonance imaging apparatus and water fat separation method |
| CN103549954B (en) * | 2013-10-29 | 2016-04-06 | 华东师范大学 | A kind of nuclear magnetic resonance three dimensional Phase unfolding method and device thereof |
| JP6626507B2 (en) * | 2014-12-04 | 2019-12-25 | コーニンクレッカ フィリップス エヌ ヴェKoninklijke Philips N.V. | Dickson magnetic resonance imaging using prior knowledge |
| WO2016170168A1 (en) * | 2015-04-24 | 2016-10-27 | Institut National De La Sante Et De La Recherche Medicale (Inserm) | Method for fat characterization using mri images acquired using a multiple gradient-echo sequence with bipolar gradients |
| US10251599B2 (en) * | 2015-04-24 | 2019-04-09 | Inserm(Institut National De La Santéet De La Recherche Médicale) | Method for post-processing magnetic resonance imaging images in a clinical context |
| CN109620228B (en) * | 2018-12-20 | 2023-01-03 | 上海联影医疗科技股份有限公司 | Fat zero offset correction method in magnetic resonance imaging and magnetic resonance imaging method |
| CN111856360B (en) | 2019-04-24 | 2026-04-03 | 通用电气精准医疗有限责任公司 | Methods and magnetic resonance imaging systems for acquiring magnetic resonance imaging data |
| WO2024191927A1 (en) * | 2023-03-10 | 2024-09-19 | The Johns Hopkins University | Correcting the quantification bias in magnetization-prepared imaging |
| CN116098605B (en) | 2023-04-04 | 2023-06-27 | 哈尔滨医科大学 | Water mold for multi-nuclear-element synchronous integrated magnetic resonance imaging and using method thereof |
| CN116908760B (en) * | 2023-07-11 | 2024-05-14 | 哈尔滨工业大学 | A method and system for MRI bias field correction based on deep decoupling network |
Citations (2)
| Publication number | Priority date | Publication date | Assignee | Title |
|---|---|---|---|---|
| US6147492A (en) | 1998-10-28 | 2000-11-14 | Toshiba America Mri, Inc. | Quantitative MR imaging of water and fat using a quadruple-echo sequence |
| US6263228B1 (en) * | 1998-08-27 | 2001-07-17 | Toshiba America, Mri, Inc. | Method and apparatus for providing separate water-dominant and fat-dominant images from single scan single point dixon MRI sequences |
Family Cites Families (16)
| Publication number | Priority date | Publication date | Assignee | Title |
|---|---|---|---|---|
| GB2304419A (en) * | 1995-08-18 | 1997-03-19 | Toshiba America Mri Inc | Method and apparatus for providing separate fat and water MRI images in a single acquisition scan |
| US6016057A (en) * | 1998-04-17 | 2000-01-18 | General Electric Company | System and method for improved water and fat separation using a set of low resolution MR images |
| US6272369B1 (en) * | 1999-01-22 | 2001-08-07 | Ge Medical Systems Global Technology Company Llc | Method for optimizing fat suppression using the chemical shift selective MR imaging technique |
| US6459922B1 (en) * | 1999-03-30 | 2002-10-01 | Toshiba America Mri, Inc. | Post data-acquisition method for generating water/fat separated MR images having adjustable relaxation contrast |
| US6906515B2 (en) * | 2000-12-28 | 2005-06-14 | Hitachi Medical Corporation | Magnetic resonance imaging device and method |
| US6586933B1 (en) * | 2002-05-15 | 2003-07-01 | General Electric Company | Method and system for MRI with lipid suppression |
| US6796944B2 (en) * | 2002-05-17 | 2004-09-28 | Ge Medical Systems Global Technology, Llc | Display for subtraction imaging techniques |
| US6750651B2 (en) * | 2002-07-03 | 2004-06-15 | The Board Of Trustees Of The Leland Stanford Junior University | Fat suppression in MRI using oscillating steady-state free precession |
| US7099499B2 (en) * | 2002-08-15 | 2006-08-29 | General Electric Company | Fat/water separation and fat minimization magnetic resonance imaging systems and methods |
| JP3774704B2 (en) * | 2003-03-04 | 2006-05-17 | キヤノン株式会社 | Image signal processing apparatus, image display apparatus and method thereof |
| WO2004086060A2 (en) * | 2003-03-20 | 2004-10-07 | Case Western Reserve University | Chemical species suppression for mri imaging using spiral trajectories with off-resonance correction |
| WO2004109300A2 (en) * | 2003-06-03 | 2004-12-16 | Decharms R Christopher | Methods for magnetic resonance signal perturbations measurement |
| US8010179B2 (en) * | 2003-09-25 | 2011-08-30 | General Electric Company | Method and apparatus of gradient echo imaging with on-the-fly optimization of tissue suppression |
| US7349729B2 (en) * | 2003-10-20 | 2008-03-25 | The Board Of Trustees Of The Leland Stanford Junior University | Magnetic resonance imaging of different chemical species in a system having magnetic field heterogeneities |
| WO2005055136A2 (en) * | 2003-11-26 | 2005-06-16 | Board Of Regents, The University Of Texas System | Method and apparatus for phase-sensitive magnetic resonance imaging |
| US20050165295A1 (en) * | 2004-01-23 | 2005-07-28 | Debiao Li | Local magnetic resonance image quality by optimizing imaging frequency |
-
2002
- 2002-08-15 US US10/219,637 patent/US7099499B2/en not_active Expired - Lifetime
-
2003
- 2003-08-06 EP EP03254887A patent/EP1389734A3/en not_active Ceased
- 2003-08-15 JP JP2003293662A patent/JP4675556B2/en not_active Expired - Lifetime
Patent Citations (2)
| Publication number | Priority date | Publication date | Assignee | Title |
|---|---|---|---|---|
| US6263228B1 (en) * | 1998-08-27 | 2001-07-17 | Toshiba America, Mri, Inc. | Method and apparatus for providing separate water-dominant and fat-dominant images from single scan single point dixon MRI sequences |
| US6147492A (en) | 1998-10-28 | 2000-11-14 | Toshiba America Mri, Inc. | Quantitative MR imaging of water and fat using a quadruple-echo sequence |
Non-Patent Citations (5)
| Title |
|---|
| LEEMPUT K.V. ET AL., MICCAI '98, vol. 1496, pages 1222 - 1229 |
| LODES ET AL., MRM, vol. 34, pages 120 - 124 |
| MA J. ET AL., JMR, vol. 125, no. 1, 1997, pages 92 - 101 |
| SKINNER; GLOVER; COOMBS ET AL., MRM, vol. 37, 1997, pages 628 - 630 |
| ZHANG W. ET AL., JMRI, vol. 6, 1996, pages 909 - 917 |
Cited By (5)
| Publication number | Priority date | Publication date | Assignee | Title |
|---|---|---|---|---|
| CN103293500A (en) * | 2012-03-02 | 2013-09-11 | 西门子公司 | Method to generate magnetic resonance slice exposures |
| CN103293500B (en) * | 2012-03-02 | 2017-05-17 | 西门子公司 | Method to generate magnetic resonance slice exposures |
| RU2693837C2 (en) * | 2014-11-14 | 2019-07-05 | Конинклейке Филипс Н.В. | Magnetic-resonance fingerprint method |
| RU2683602C2 (en) * | 2015-02-02 | 2019-03-29 | Конинклейке Филипс Н.В. | Fingerprinting of magnetic resonance system |
| RU2720476C2 (en) * | 2015-06-12 | 2020-04-30 | Конинклейке Филипс Н.В. | Creation of a magnetic resonance fingerprinting dictionary using an additional magnetic field coil |
Also Published As
| Publication number | Publication date |
|---|---|
| JP2004073866A (en) | 2004-03-11 |
| EP1389734A3 (en) | 2005-04-06 |
| US20040032977A1 (en) | 2004-02-19 |
| US7099499B2 (en) | 2006-08-29 |
| JP4675556B2 (en) | 2011-04-27 |
Similar Documents
| Publication | Publication Date | Title |
|---|---|---|
| US7099499B2 (en) | Fat/water separation and fat minimization magnetic resonance imaging systems and methods | |
| Khabipova et al. | A modulated closed form solution for quantitative susceptibility mapping—a thorough evaluation and comparison to iterative methods based on edge prior knowledge | |
| Nam et al. | Improved estimation of myelin water fraction using complex model fitting | |
| JP4251763B2 (en) | Magnetic resonance imaging system | |
| Wang et al. | A three‐point Dixon method for water and fat separation using 2D and 3D gradient‐echo techniques | |
| US9612300B2 (en) | System and method for object-based initialization of magnetic field inhomogeneity in magnetic resonance imaging | |
| US9709641B2 (en) | Magnetic resonance imaging apparatus, image processing apparatus, and susceptibility map calculation method | |
| Alonso-Ortiz et al. | Impact of magnetic susceptibility anisotropy at 3 T and 7 T on T2*-based myelin water fraction imaging | |
| Sharma et al. | Improving chemical shift encoded water–fat separation using object‐based information of the magnetic field inhomogeneity | |
| Diefenbach et al. | Improving chemical shift encoding‐based water–fat separation based on a detailed consideration of magnetic field contributions | |
| Wang et al. | Analytical three‐point Dixon method: With applications for spiral water–fat imaging | |
| Nolte et al. | Spiral blurring correction with water–fat separation for magnetic resonance fingerprinting in the breast | |
| US10768261B2 (en) | Alternating gradients for metal-induced artifacts correction in magnetic resonance imaging | |
| Liu et al. | Single multi-echo GRE acquisition with short and long echo spacing for simultaneous quantitative mapping of fat fraction, B0 inhomogeneity, and susceptibility | |
| Mickevicius et al. | Simultaneous acquisition of orthogonal plane cine imaging and isotropic 4D-MRI using super-resolution | |
| US20190076049A1 (en) | Magnetic resonance imaging device, magnetic resonance imaging method and susceptibility calculation program | |
| Jacob et al. | Improved model-based magnetic resonance spectroscopic imaging | |
| Kafali et al. | Phase‐correcting non‐local means filtering for diffusion‐weighted imaging of the spinal cord | |
| Chung et al. | An improved PSF mapping method for EPI distortion correction in human brain at ultra high field (7T) | |
| Constantinides et al. | Restoration of low resolution metabolic images with a priori anatomic information: 23Na MRI in myocardial infarction☆ | |
| Chiou et al. | A simple simultaneous geometric and intensity correction method for echo-planar imaging by EPI-based phase modulation | |
| Poojar et al. | Tailored magnetic resonance fingerprinting | |
| US11143729B2 (en) | Optimised generation of MRI images by a multi-antenna MRI system | |
| WO2019232518A1 (en) | Methods for uniform reconstruction of multi-channel surface-coil magnetic resonance data without use of a reference scan | |
| Blezek et al. | Single image phase-based MRI fat suppression expectation maximization algorithm |
Legal Events
| Date | Code | Title | Description |
|---|---|---|---|
| PUAI | Public reference made under article 153(3) epc to a published international application that has entered the european phase |
Free format text: ORIGINAL CODE: 0009012 |
|
| AK | Designated contracting states |
Kind code of ref document: A2 Designated state(s): AT BE BG CH CY CZ DE DK EE ES FI FR GB GR HU IE IT LI LU MC NL PT RO SE SI SK TR |
|
| AX | Request for extension of the european patent |
Extension state: AL LT LV MK |
|
| RIN1 | Information on inventor provided before grant (corrected) |
Inventor name: DHAWALE, PARITOSH Inventor name: DIXON, WILLIAM Inventor name: BLEZEK, DANIEL |
|
| PUAL | Search report despatched |
Free format text: ORIGINAL CODE: 0009013 |
|
| AK | Designated contracting states |
Kind code of ref document: A3 Designated state(s): AT BE BG CH CY CZ DE DK EE ES FI FR GB GR HU IE IT LI LU MC NL PT RO SE SI SK TR |
|
| AX | Request for extension of the european patent |
Extension state: AL LT LV MK |
|
| 17P | Request for examination filed |
Effective date: 20051006 |
|
| AKX | Designation fees paid |
Designated state(s): DE NL |
|
| RIN1 | Information on inventor provided before grant (corrected) |
Inventor name: DHAWALE, PARITOSH Inventor name: DIXON, WILLIAM Inventor name: BLEZEK, DANIEL |
|
| 17Q | First examination report despatched |
Effective date: 20090917 |
|
| RIC1 | Information provided on ipc code assigned before grant |
Ipc: G01R 33/48 20060101AFI20130125BHEP |
|
| APBK | Appeal reference recorded |
Free format text: ORIGINAL CODE: EPIDOSNREFNE |
|
| APBN | Date of receipt of notice of appeal recorded |
Free format text: ORIGINAL CODE: EPIDOSNNOA2E |
|
| APBR | Date of receipt of statement of grounds of appeal recorded |
Free format text: ORIGINAL CODE: EPIDOSNNOA3E |
|
| APAV | Appeal reference deleted |
Free format text: ORIGINAL CODE: EPIDOSDREFNE |
|
| APBT | Appeal procedure closed |
Free format text: ORIGINAL CODE: EPIDOSNNOA9E |
|
| STAA | Information on the status of an ep patent application or granted ep patent |
Free format text: STATUS: THE APPLICATION HAS BEEN REFUSED |
|
| 18R | Application refused |
Effective date: 20190623 |