EP1361435A1 - Specific binding analyzer and method of analyzing specific binding - Google Patents
Specific binding analyzer and method of analyzing specific binding Download PDFInfo
- Publication number
- EP1361435A1 EP1361435A1 EP02800234A EP02800234A EP1361435A1 EP 1361435 A1 EP1361435 A1 EP 1361435A1 EP 02800234 A EP02800234 A EP 02800234A EP 02800234 A EP02800234 A EP 02800234A EP 1361435 A1 EP1361435 A1 EP 1361435A1
- Authority
- EP
- European Patent Office
- Prior art keywords
- specific binding
- sample
- reaction
- analyte
- hcg
- Prior art date
- Legal status (The legal status is an assumption and is not a legal conclusion. Google has not performed a legal analysis and makes no representation as to the accuracy of the status listed.)
- Withdrawn
Links
Images






Classifications
-
- G—PHYSICS
- G01—MEASURING; TESTING
- G01N—INVESTIGATING OR ANALYSING MATERIALS BY DETERMINING THEIR CHEMICAL OR PHYSICAL PROPERTIES
- G01N33/00—Investigating or analysing materials by specific methods not covered by groups G01N1/00 - G01N31/00
- G01N33/48—Biological material, e.g. blood, urine; Haemocytometers
- G01N33/50—Chemical analysis of biological material, e.g. blood, urine; Testing involving biospecific ligand binding methods; Immunological testing
- G01N33/53—Immunoassay; Biospecific binding assay; Materials therefor
- G01N33/543—Immunoassay; Biospecific binding assay; Materials therefor with an insoluble carrier for immobilising immunochemicals
- G01N33/54366—Apparatus specially adapted for solid-phase testing
- G01N33/54386—Analytical elements
- G01N33/54387—Immunochromatographic test strips
- G01N33/54388—Immunochromatographic test strips based on lateral flow
-
- G—PHYSICS
- G01—MEASURING; TESTING
- G01N—INVESTIGATING OR ANALYSING MATERIALS BY DETERMINING THEIR CHEMICAL OR PHYSICAL PROPERTIES
- G01N33/00—Investigating or analysing materials by specific methods not covered by groups G01N1/00 - G01N31/00
- G01N33/48—Biological material, e.g. blood, urine; Haemocytometers
- G01N33/50—Chemical analysis of biological material, e.g. blood, urine; Testing involving biospecific ligand binding methods; Immunological testing
- G01N33/53—Immunoassay; Biospecific binding assay; Materials therefor
- G01N33/543—Immunoassay; Biospecific binding assay; Materials therefor with an insoluble carrier for immobilising immunochemicals
- G01N33/54366—Apparatus specially adapted for solid-phase testing
-
- G—PHYSICS
- G01—MEASURING; TESTING
- G01N—INVESTIGATING OR ANALYSING MATERIALS BY DETERMINING THEIR CHEMICAL OR PHYSICAL PROPERTIES
- G01N33/00—Investigating or analysing materials by specific methods not covered by groups G01N1/00 - G01N31/00
- G01N33/48—Biological material, e.g. blood, urine; Haemocytometers
- G01N33/50—Chemical analysis of biological material, e.g. blood, urine; Testing involving biospecific ligand binding methods; Immunological testing
- G01N33/53—Immunoassay; Biospecific binding assay; Materials therefor
- G01N33/543—Immunoassay; Biospecific binding assay; Materials therefor with an insoluble carrier for immobilising immunochemicals
- G01N33/54366—Apparatus specially adapted for solid-phase testing
- G01N33/54386—Analytical elements
- G01N33/54387—Immunochromatographic test strips
- G01N33/54388—Immunochromatographic test strips based on lateral flow
- G01N33/54389—Immunochromatographic test strips based on lateral flow with bidirectional or multidirectional lateral flow, e.g. wherein the sample flows from a single, common sample application point into multiple strips, lanes or zones
-
- G—PHYSICS
- G01—MEASURING; TESTING
- G01N—INVESTIGATING OR ANALYSING MATERIALS BY DETERMINING THEIR CHEMICAL OR PHYSICAL PROPERTIES
- G01N33/00—Investigating or analysing materials by specific methods not covered by groups G01N1/00 - G01N31/00
- G01N33/48—Biological material, e.g. blood, urine; Haemocytometers
- G01N33/50—Chemical analysis of biological material, e.g. blood, urine; Testing involving biospecific ligand binding methods; Immunological testing
- G01N33/58—Chemical analysis of biological material, e.g. blood, urine; Testing involving biospecific ligand binding methods; Immunological testing involving labelled substances
- G01N33/585—Chemical analysis of biological material, e.g. blood, urine; Testing involving biospecific ligand binding methods; Immunological testing involving labelled substances with a particulate label, e.g. coloured latex
Definitions
- the present invention relates to a specific binding analysis device and a specific binding analysis method for qualitatively or quantitatively analyzing an analyte in a sample in a simple and rapid manner.
- chromatography which comprises an operation of making a sample suspected of containing an analyte infiltrate and develop in a chromatograph region, which comprises a porous carrier or a fine particle-packed carrier and where a specific binding substance is insolubilized, together with, or separated from, a labeled specific binding substance.
- This analysis method is a type of immunoassay.
- Chromatography is advantageous in terms of measurement sensitivity and measurement time since the carrier in the chromatography region has a large surface area where a great amount of the specific binding substance can be insolubilized, and a collision between reacting molecules, which may cause a specific binding reaction, occurs with a higher frequency as compared with a reaction in a liquid phase.
- the conventional specific binding analysis method has a problem called a prozone phenomenon. This is a phenomenon in which an analyte concentration cannot be unambiguously determined with respect to a signal intensity attributed to a specific binding reaction.
- an analyte is qualitatively or quantitatively analyzed by measurement of a signal intensity obtained attributed to a specific binding reaction between the analyte and a specific binding substance.
- the signal intensity obtained attributed to the specific binding reaction does not reflect the amount of the analyte in the sample.
- an analyte specifically bound to a labeled specific binding substance and an analyte not specifically bound to the labeled specific binding substance compete to cause a specific binding reaction with a specific binding substance immobilized on a carrier, which results in reduction in signal intensity attributed to the reaction contributed to by a labeling material.
- the specific binding analysis method there are some possibilities in the specific binding analysis method that the amount of the analyte whose concentration is high in the sample is wrongly determined to be small.
- examination items differ with purposes and, as the case may be, an examination by plural items using just one clinical sample (multi-term measurement) is required. While there are some cases where clinical examinations are conducted on a daily basis with the use of large-sized instruments in medical facilities and the like, the large-sized instruments generally have problems in terms of cost as well as maintenance.
- an object of the present invention is to provide a specific binding analysis method which enables a qualitatively or quantitatively analysis of an analyte in a sample in a simple, rapid and accurate manner with the use of a small, simple measurement device, under little influence attributed to the concentration of the analyte in the sample.
- the present invention provides a specific binding analysis device for qualitatively or quantitatively analyzing an analyte in a sample, using a specific binding reaction between an analyte and a specific binding substance capable of specifically binding to the analyte, the device comprising: an inlet for introducing the sample; a plurality of space forming zones for temporarily retaining the sample introduced from the inlet; a plurality of reaction fields where a specific binding reaction of the sample retained in the space forming zone occurs; and an outlet for discharging the sample from the space forming zone to the reaction field, the specific binding reaction occurring under a different condition in each of the reaction fields.
- the number of the inlets is one.
- the aforesaid condition is one under which a signal intensity detected in a detection zone can be changed. This is specifically described below.
- each of the plurality of space forming zones is different in content.
- the specific binding substance is immobilized in at least either the space forming zone or the reaction field.
- a characteristic of a labeling material e.g. a particle size or a material
- a characteristic of a labeling material is different in each of the reaction fields.
- the kind of the specific binding substance is preferably different in each of the space forming zones or in each of the reaction fields. Further, an affinity of the specific binding substance is preferably different in each of the space forming zones or in each of the reaction fields. Additionally, an amount of the specific binding substance is preferably different in each of the space forming zones or in each of the reaction fields.
- the rate of introducing the sample from the inlet into the space forming zone is faster than the rate of discharging the sample from the outlet to the reaction field.
- the reaction field comprises a first specific binding substance labeled with the labeling material and a second specific binding substance, and a qualitative or quantitative analysis is performed based on a signal attributed to a specific binding reaction that the first specific binding substance and the second specific binding substance are bound to one another via the analyte.
- the second specific binding substance is immobilized on the reaction field.
- the reaction field is a developing layer capable of developing the sample due to capillarity
- the detection zone is disposed on the developing layer
- the second specific binding substance is immobilized in the detection zone.
- the first specific binding substance is retained on the developing layer.
- the sample does not move between each of the plurality of developing layers. This may be realized by providing a space between each of the developing layers or forming a wall between each of the developing layers. A material with chemical resistance may constitute the wall.
- the signal is color, fluorescence or luminescence
- the specific binding analysis device of the present invention has a strip shape.
- the first specific binding substance is contained in the reaction field and the specific binding analysis device comprises a sensor for recognizing the introduction of the sample into the space forming zone.
- the first specific binding substance or the second specific binding substance is an antibody
- the labeling material is a metal sol, a dye sol, a particle containing a fluorescent substance, or a colored latex particle.
- the present invention relates to a specific binding analysis method for qualitatively or quantitatively analyzing an analyte in a sample, using a specific binding analysis device which comprises: an inlet for introducing the sample containing the analyte; a plurality of space forming zones for temporarily retaining the sample introduced from the inlet; a plurality of reaction fields where a specific binding reaction of the analyte in the sample retained in the space forming zone occurs; and an outlet for discharging the sample from the space forming zone to the reaction field, and is characterized in that the specific binding reaction occurs under a different condition in each of the reaction fields, and adjusting at least one selected from the group consisting of a content of the space forming zone, a dilution ratio of the sample retained in the space forming zone and the characteristic of the labeling material to analyze the analyte.
- the analyte in the sample is qualitatively or quantitatively analyzed, utilizing an amount of the sample to be introduced, which has been adjusted by adjustment of the content of the space forming zone.
- the introduction of the sample into the space forming zone is recognized and a standard sample is introduced into the space forming zone.
- the analyte in the sample is qualitatively or quantitatively analyzed by making the space forming zone carry a solution containing the first specific binding substance, and then adjusting an amount of the solution to be carried.
- the analyte in the sample is qualitatively or quantitatively analyzed by analyzing the product of an intensity of a signal attributed to the specific binding reaction and a magnification of the dilution.
- the analyte in the sample is qualitatively or quantitatively analyzed by analyzing on the reaction fields a signal intensity of a reaction field where the specific binding reaction is conducted to show a signal intensity not higher than a prescribed threshold.
- the analyte in the sample is qualitatively or quantitatively analyzed by analyzing a signal intensity of a portion where the specific binding reaction is conducted to show the largest signal intensity among the reaction fields where the specific binding reaction is conducted to show signal intensities not higher than the threshold.
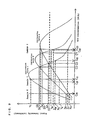
- the threshold is less than the minimum value of a signal intensity at an intersection which is generated when overlapping corresponding curves of an analyte concentration and a signal intensity of each of the portions where the specific binding reaction is conducted, and is also less than the minimum signal intensity among the maximum values of the signal intensities of the respective corresponding curves.
- the analyte in the sample is qualitatively or quantitatively analyzed, referring to the corresponding curves of the analyte concentration and the signal intensity of the portion where the specific binding reaction is conducted to show the largest signal intensity among the reaction fields where the specific binding reaction is conducted to show signal intensities not higher than the threshold, in a case where there exist a plurality of analyte concentrations corresponding to the signal intensity of the portion where the specific binding reaction is conducted to show the largest signal intensity among the reaction fields where the specific binding reaction is conducted to show signal intensities not higher than the threshold, the smallest concentration is considered as the analyte concentration.
- a specific binding analysis device of the present invention is a specific binding analysis device for qualitatively or quantitatively analyzing an analyte in a sample, using a specific binding reaction between an analyte and a specific binding substance capable of specifically binding to the analyte, the device comprising a plurality of units, each of which comprises: an inlet for introducing the sample; a space forming zone for temporarily retaining the sample introduced from the inlet; and an outlet for discharging the sample from the space forming zone to a reaction field where a specific binding reaction of the sample retained in the space forming zone is conducted.
- the inlet may be provided separately to each of the plurality of space forming zones.
- the number of the space forming zones and the number of the inlets are the same. It is further preferable that just one inlet is provided to a plurality of space forming zones. In this case, the sample is supplied to all of the space forming zones from the single inlet.
- the specific binding analysis device in accordance with the present invention has a strip shape, and the aforesaid unit also has a strip shape.
- the specific binding analysis device is sometimes referred to as a test strip.
- at least two or more units are arranged, each constituted by disposing therein a space forming zone, a retention zone where a labeled first specific binding substance is retained, and a detection zone where a second specific binding substance is immobilized.
- the inlets, the space forming zones and the outlets, in the respective units forming the reaction fields where the specific binding reaction is conducted are mutually separate and independent between the units.
- each of the developing layers is physically separate from one another. For example, provision of a gap or a wall between the developing layers is preferred. Thereby it becomes possible to simultaneously conduct a plurality of specific binding reactions. This also allows free adjustment of the number of the reaction measurements.
- the specific binding analysis device of the present invention is characterized in that a content of the space forming zone is different in each of the different units. It is preferable here that the content is set up in line with purposes. This enables adjustment of an introduced amount, a flow rate, and the like, of the sample in line with purposes, and even in the case of introducing the same sample, specific binding reactions under different conditions can be simultaneously observed.
- the adjustment of the content of the space forming zone makes adjustment of a dilution ratio possible.
- a prozone phenomenon which has been a problem with the conventional specific binding analysis methods can be avoided or confirmed. That is, in the present invention, previous adjustment of the content of a plurality of space forming zones enables the sample to be automatically diluted in phases so that a specific binding analysis reaction can be conducted at an analyte concentration not influenced by the prozone phenomenon. Further, it is possible to confirm whether there exists the range of a concentration at which the prozone phenomenon is occurring by observation and comparison of the results of the specific binding reactions of the sample having been diluted in phases.
- the space forming zone temporarily retains the sample, the adjustment of the content of the space forming zone allows adjustment of the amount of the sample to be introduced.
- it is possible to accurately and automatically collect and introduce a certain amount of the sample into the specific binding analysis device without the need for using such quantitative-collecting device as a dispenser or a syringe to collect a sample and introduce it into the specific binding analysis device. It is thus possible to qualitatively or quantitatively analyze the analyte in the sample in a simple and accurate manner, without requiring an advanced device or operation.
- the specific binding analysis device of the present invention is characterized in that a standard sample is introduced into the space forming zone.
- the examples of the standard sample may include a standard substance for determination of a calibration curve to be used by the analysis device and a standard substance for quality assurance of the analysis device. The quality of the analysis device is assured by means of response of the analysis device itself, a reaction characteristic of a regent to be used in the analysis device, or the like.
- a specific binding analysis method aiming at a quantitative analysis widely used has been a method of conducting a specific binding reaction which uses an analyte and a specific binding substance capable of specifically binding to the analyte, and also using a calibration curve for concentration conversion, which is created by previously conducting the specific binding reaction using a standard substance during preparation of the analysis device, to determine the concentration of the analyte.
- the present invention it is possible to confirm as to whether the analysis device is in a state capable of being provided the quality assurance, by automatically creating a dilution system by the use of a standard substance with a known concentration conducting a specific binding reaction, and then comparing prepared reaction curves, for example.
- determination of the calibration curve and the quality assurance become possible by conducting the specific binding reaction using the standard substance as the standard sample, and then measuring the response of the analysis device, the reaction characteristic of the reagent or the like.
- the analyte in the present invention may be any one so long as a specific binding substance capable of specifically binding thereto exists, and the examples may include various proteins, which can function as an antibody or antigen, polypeptides, glycoproteins, polysaccharides, complex glycolipids, nucleic acids, effector molecules, receptor molecules, enzymes and inhibitors.
- tumor markers such as ⁇ -fetoprotein, carcinoembryonic antigen (CEA), CA 125 and CA 19-9; various proteins, glycoproteins or complex glycolipids such as ⁇ 2-microglobulin ( ⁇ 2m) and ferritin; various hormones such as estradiol (E2), estriol (E3), human chorionic gonadotropin (hCG), luteinizing hormone (LH) and human placental lactogen (hPL); various virus-associated antigens or virus-associated antibodies such as HBs antigen, HBs antibody, HBc antigen, HBc antibody, HCV antibody and HIV antibody; various allergens and IgE antibodies thereto; narcotic drugs, medical drugs and metabolites thereof; and virus-associated and tumor-associated nucleic acids having a polynucleotide sequence.
- tumor markers such as ⁇ -fetoprotein, carcinoembryonic antigen (CEA), CA 125 and CA 19-9
- various proteins, glycoproteins or complex glycolipids
- the sample in the present invention may be a liquid suspected of containing an analyte, and the examples may include urine, blood serum, blood plasma, whole blood, saliva, lacrimal fluid, spinal fluid and secretion from papillae; however, the sample may also be one prepared by suspending or dissolving a solid substance, a gel substance or sol substance of mucus, human body tissue, cell or the like, in a liquid such as a buffer solution, an excessct solution or a dissolved solution.
- the specific binding substance in the present invention may be any substance capable of specifically binding to the analytes, and the examples may include antibodies, antigens, glycoproteins, polysaccharides, complex glycolipids, nucleic acids, effector molecules, receptor molecules, enzymes and inhibitors.
- a first specific binding substance labeled with a labeling material and a second specific binding substance are employed and the labeled first specific binding substance and the second specific binding substance are bound to one another, via the analyte.
- the specific binding analysis method using the specific binding analysis device in the present invention is characterized in that the analyte in the sample is qualitatively or quantitatively analyzed by adjusting an amount of a solution containing the first specific binding substance labeled with the labeling material.
- the adjustment of the amount of the solution containing the specific binding substance labeled with the labeling material enables dilution of the sample in the step of causing the reaction between the analyte and the specific binding substance capable of specifically binding to the analyte, and utilization of a dilution ratio thus obtained enables avoidance and confirmation of the prozone phenomenon which has been a problem with the conventional specific binding analysis methods.
- the characteristic of the labeling material for example is a particle size or a material of the labeling material.
- the characteristic of the labeling material changed, the kind as well as an intensity of a signal that can be read out from the labeling material also change. It is thus possible to chose a reaction field capable of sending an appropriate signal for analysis of the analyte concentration in the sample, whereby the prozone phenomenon which has been a problem with the conventional specific binding analysis methods can be avoided or confirmed, without diluting the sample.
- the analyte in the sample may be qualitatively or quantitatively analyzed by adjusting the first specific binding substance labeled with the labeling material and/or the second specific binding substance in each of the reaction fields where the specific binding reaction is conducted. Disposition of specific binding substances capable of specifically binding to different analytes in the respective reaction fields where the specific binding reaction is conducted makes it possible to adjust an analyte to be detected in each of the reaction fields where the specific binding reaction is conducted.
- the solution containing the first specific binding substance labeled with the labeling material may be sealed into the space forming zone.
- the specific binding reaction between the analyte in the sample and the first specific binding substance labeled with the labeling material can be conducted while the sample is retained in the space forming zone.
- adjustment of an amount of the solution containing the first specific binding substance labeled with the labeling material to be sealed into the space forming zone enables automatic dilution of the sample in phases so that the prozone phenomenon which has been a problem with the conventional specific binding analysis method can be avoided or confirmed.
- the first specific binding substance labeled with the labeling material when the contents of the respective space forming zones are equal, the first specific binding substance labeled with the labeling material may not be sealed in the space forming zone.
- the amount of the first specific binding substance labeled with the labeling material is adjusted in each of the reaction fields where the specific binding reaction is conducted, it becomes possible to adjust the component ratio between the analyte and the specific binding substance which are capable of participating in the specific binding reaction in each of the reaction fields where the specific binding reaction is conducted so that the specific binding reaction can be observed under conditions where no prozone phenomenon occurs, without diluting the sample, and the prozone phenomenon which has been a problem with the conventional specific binding analysis methods can be avoided or confirmed.
- first specific binding substances labeled with the labeling material having different affinities in the respective reaction fields where the specific binding reaction is conducted, makes the specific binding reaction between the analyte and the specific binding substance controllable, by utilizing the affinity difference, in each of the reaction fields where the specific binding reaction is conducted so that the specific binding reaction can be observed under conditions where no prozone phenomenon occurs, without diluting the sample, and the prozone phenomenon which has been a problem with the conventional specific binding analysis methods can be avoided or confirmed.
- the unit comprises a detection zone for detecting a signal obtained attributed to the specific binding reaction and the second specific binding substance is substantially immobilized in the detection zone.
- the second specific binding substance is immobilized in the detection zone so as not to move freely even when the developing layer constituting the reaction field is in a wet state. In such a manner, an unreacted substance is washed off along with the sample flow, thereby enabling detection of the signal attributed to the specific binding reaction in the detection zone without conducting an operation of separating the unreacted substance.
- the device of the present invention may comprise a plurality of detection zones.
- the developing layer in the present invention is the reaction field where the analyte in the sample and the first specific binding substance labeled with the labeling material develop.
- the examples thereof may include a porous carrier and a gel carrier.
- nitrocellulose is most preferable.
- This material is superior to other developing layer materials such as paper because it is inherently capable of binding to protein without previous sensitization.
- a specific binding substance such as an antibody can be reliably immobilized, without requiring any chemical treatment that may suppress the specific binding capability of the specific binding substance.
- paper for example, the immobilization of the antibody necessitates a chemical binding using CNBr, carbonyldiimidazole, tressil chloride or the like.
- nitrocellulose is available in various pore sizes so that the developing layer material can be readily selected according to conditions such as a flow rate of the sample. It is desirable that strength of a nitrocellulose sheet, when handled, is improved by attaching a plastic sheet or the like onto the back of the sheet. This can be readily made by forming a thin film of nitrocellulose on a reinforcing material sheet.
- a portion, other than the portion in which the antibody is immobilized, is preferably blocked to reduce non-specific absorption to the developing layer.
- the blocking may be achieved by application of protein (e.g., bovine serum albumin and milk protein), polyvinylalcohol or ethanolamine, or a combination thereof.
- the space forming zone in the present invention may be one capable of forming a space for temporality retaining the sample, and further, it serves to accurately and automatically collect and introduce a certain amount of the sample, depending on the volume thereof, into the specific binding analysis device and also serves as an anti-pollution protective material when the device is handled after the introduction of the sample.
- it can be constituted using a synthetic resin material such as ABS, polystyrene or poly vinyl chloride, or a solution-impermeable material such as metal or glass.
- the inlet is one for introducing the sample and the outlet is one for discharging the sample retained in the space forming zone to the reaction field where the specific binding reaction is conducted.
- the rate of introducing the sample from the inlet into the space forming zone is sufficiently faster than the rate of discharging the sample from the outlet to the reaction field where the specific binding reaction is conducted.
- the signal in the present invention may be one which is generated by a reaction contributed to by the labeling material and can be detected, and the examples may include fluorescence measurable with a fluorescent photometer, luminescence measurable with a luminescent photometer and exhibited color measurable by visual determination and a color-difference meter. In this case, an intensity of reflected light, an intensity of fluorescence or luminescence generated in the detection zone, or the like, is detected in the detection zone.
- a sample is introduced into a test strip connected to a signal intensity measurement device, or a test strip with a sample introduced therein is connected to the signal intensity measurement device, and then the degree of modulation of a signal in a detection zone is measured by naked-eye visual observation or with a suitable external measurement device according to the property of the signal. Between the aforesaid measurements more preferred is one where the test strip is connected to the signal intensity measurement device and the sample is then introduced into the test strip to detect the signal.
- signals attributed to a plurality of specific binding reactions sent from the respective reaction fields where the specific binding reaction is conducted, are distinguished due to the respective reaction fields where the specific binding reaction is conducted and successively read out so that the analyte in the sample is qualitatively or quantitatively analyzed.
- This operation makes it possible to reduce the time required for the step of reading out the signal even when a plurality of specific binding reactions are conducted, and to correspond to clinical examination devices as well as sensors for the domestic use which require rapid determination of results.
- the reaction field where the specific binding reaction is conducted and/or a device for reading out a signal move in a certain direction so that signals sent from the respective reaction fields where the specific binding reaction is conducted are successively read out.
- a strip where a plurality of detection zones, capable of reading out a signal, are arranged in parallel
- scanning of the signal intensity measurement device in the direction along the detection zones allows successive measurement of signals obtained from a plurality of specific binding reactions.
- the signal intensity measurement device is immobilized while the strip is scanned, a similar effect can be expected to be obtained. This operation can simplify the device required for the signal intensity measurement and can also make the device smaller and less expensive.
- a step of recognizing the introduction of the sample from the inlet is preferably performed.
- a start-of-measurement detector or the like, for detecting the introduction of the sample and the start of the measurement by using a difference between a conductivity of the developing layer in a dry state before the sample introduction and a conductivity of the developing layer in a wet state changed from the dry state due to the sample introduction. It is preferable to start measuring the measurement time on the basis of the time at which the introduction of the sample from the inlet is recognized. This operation enables accurate control of the detection time of signal, i.e., the time elapsed between the sample introduction and the signal intensity measurement, and also enables reduction in error caused by measurement manipulation.
- the labeled first specific binding substance is contained in the developing layer.
- the sample introduced into the test strip reacts with the labeled first specific binding substance when developing along the developing layer so that a step of causing a reaction between the sample and the labeled first specific binding substance can be simplified.
- the labeled first specific binding substance is in a dry state.
- the labeled first specific binding substance is retained in the retention zone on the developing layer; when the developing layer gets wet caused by the sample introduction or the like, the labeled first specific binding substance can freely move within the developing layer.
- the developing layer material is made band-shaped or sheet-shaped, and the reagent is applied onto spatially separate regions on the developing layer and is made to infiltrate from the side or the end of the sheet or the band to the other side at the time of the sample introduction.
- the sample may be introduced into the strip after being previously reacted with the labeled first specific binding substance in the outside of the strip.
- the labeled first specific binding substance may not be contained in the developing layer or the space forming zone.
- the first specific binding substance and the second specific binding substance in the present invention may be substances which are capable of specifically binding to analytes, and the examples thereof may include antibodies, antigens, glycoproteins, polysaccharides, complex glycolipids, nucleic acids, effector molecules, receptor molecules, enzymes and inhibitors.
- the first specific binding substance or the second specific binding substance is preferably an antibody, and more preferably a monoclonal antibody, from the viewpoint of high specificity. It is further preferable that the first specific binding substance and the second specific binding substance have specificities against different epitopes of the analyte. When the analyte has a plurality of same epitopes, the same specific binding substances may be used.
- the labeling material in the present invention may be an arbitrary substance whose presence can be readily detected.
- the preferable one is a direct label, namely a material visible with the naked eye in a natural state, or readily visible with the use of an optical filter and/or by the use of a method of promoting fluorescence by adding a stimulation such as an ultraviolet ray or the like. Since the direct label is capable of generating a signal which is detectable, without addition of another reagent, analysis results can be obtained in a moment of time, and further, the direct label can be readily used in an analysis device stored in a dry state because of the strong and stable properties thereof.
- the direct label particularly preferred are fine colored particles such as dye sols, metal sols, particles containing a fluorescent substance and colored latex particles. Employment of such particles enables concentration of the label in a small area or volume, which forms a region thickly colored to generate a signal which is readily detectable. Among them most preferred are colloidal gold particles. This evaluation of a signal can be conducted by visual estimation or, if required, by using apparatus.
- indirect labels such as enzymes like alkaline phsphotase, horseradish peroxidase, etc. can be employed.
- the indirect label is inferior to the direct label in terms of simplicity since detection of a visible signal usually requires addition of one or more development reagents such as a substrate.
- the reagent may be contained in a porous development layer material so as to dissolve or disperse in the sample.
- Another method available may be to mix the sample with the development reagent beforehand, and then introduce the resulting mixture into the test strip after occurrence of the specific binding reaction.
- labeling material and the specific binding substance can be bound to one another by covalent bonding or hydrophobic bonding, as circumstances demand.
- the test strip used in a preferable embodiment of the specific binding analysis device of the present invention when the analyte is present in the sample, a sandwich reaction occurs that the labeled first specific binding substance and the second specific binding substance immobilized in the detection zone are bound to one another via the analyte, and in the detection zone, the labeled first specific binding substance is bound.
- An intensity of a signal from the labeled first specific binding substance as thus bound in the detection zone is measured, and then the analyte in the sample is qualitatively or quantitatively analyzed based on the measured signal intensity.
- the labeled first specific binding substance may move as the sample flows toward the detection zone, and it is preferable that the sample keeps flowing even after passing through the detection zone.
- a sufficient amount of the sample is introduced into the test strip so that an excess of the labeled first specific binding substance, which is not capable of participating in the specific binding reaction in the detection zone, is washed off from the detection zone by the sample flow through the detection zone.
- An absorption zone may be provided at the end of the developing layer material.
- the material for the absorption zone may be any material having enough an absorptive property to wash off an unbound composition out of the detection zone, which may be exemplified by the glass fiber filter paper GA-200 (manufactured by TOYO KABUSHIKI KAISHA).
- the product of a signal intensity and a dilution magnification is used to qualitatively or quantitatively analyze the analyte in the sample.
- the corresponding relationship between the analyte concentration and the signal intensity with regard to a standard substance with a known concentration is previously assayed to create a calibration curve and, for example, from a signal intensity, measured in terms of a sample to be detected which has been automatically diluted to have an analyte concentration not influenced by the prozone phenomenon, the analyte concentration contained in the sample to be detected can be determined by the use of the calibration curve.
- the product of the dilution ratio and the analyte concentration obtained using the calibration curve is the analyte concentration in the sample.
- the specific binding analysis method using the specific binding analysis device of the present invention is characterized in that the analyte in the sample is qualitatively or quantitatively analyzed by analyzing a signal intensity of a reaction field where the specific binding reaction is conducted to show a signal intensity not higher than a certain threshold. It is preferable here that the threshold is less than the signal intensity shown by the analyte with such a concentration as causing no prozone phenomenon.
- the threshold is less than the signal intensity shown by the analyte with such a concentration as causing no prozone phenomenon.
- the analyte in the sample is qualitatively or quantitatively analyzed by analyzing a signal intensity of a reaction field where the specific binding reaction is conducted to show the largest signal intensity among the reaction fields where the specific binding reaction is conducted to show signal intensities not higher than a certain threshold.
- the corresponding relationship between the analyte concentration and the signal intensity in the detection zone is previously assayed to create a calibration curve.
- a quantitative property is improved by using a calibration curve having a large inclination, namely a large value given by dividing the signal intensity by the concentration, in the straight line region where the prozone phenomenon is not occurring.
- the analyte is qualitatively or quantitatively analyzed by comparing signal intensities of a plurality of reaction fields where the specific binding reaction is conducted; when comparing the straight line regions of the calibration curves among the reaction fields where the specific binding reaction is conducted to show signal intensities not higher than a certain threshold, a larger signal intensity is observed on a more-steeply-inclined calibration curve.
- the present invention is characterized in that, when the analyte in the sample is qualitatively or quantitatively analyzed, referring to the corresponding curves of the analyte concentration and the signal intensity of the reaction field where the specific binding reaction is conducted to show the largest signal intensity among the reaction fields where the specific binding reaction is conducted to show signal intensities not higher than the threshold, in a case where there exist a plurality of analyte concentrations corresponding to the signal intensity of the reaction field where the specific binding reaction is conducted to show the largest signal intensity among the reaction fields where the specific binding reaction is conducted to show signal intensities not higher than the threshold, the smallest concentration is considered as the analyte concentration.
- the threshold is less than the minimum value of a signal intensity at an intersection which is generated when overlapping the corresponding curves of the analyte concentration and the signal intensity of the respective reaction fields where the specific binding reaction is conducted, and is also less than the minimum signal intensity among the maximum values of the signal intensities of the respective corresponding curves.
- the corresponding relationship between the analyte concentration and the signal intensity in the detection zone is previously assayed to create a calibration curve.
- the analyte is qualitatively or quantitatively analyzed by comparing signal intensities of a plurality of reaction fields where the specific binding reaction is conducted; when overlapping calibration curves of the respective reaction fields where the specific binding reaction is conducted, the possibility may arise where an intersection is generated between the calibration curves, if creation of a calibration curve accompanied by the assay where prozone phenomenon is present.
- a value less than the minimum values of signal intensities of these intersections and also less than the minimum signal intensity among the maximum values of the signal intensities of the respective calibration curves is set up as a threshold, reaction fields where the specific binding reaction is conducted to show signal intensities not higher than the threshold are selected, a reaction field to show the maximum signal intensity is selected by comparing the signal intensities among those reaction fields, and then the signal intensity of the selected reaction field is analyzed, to qualitatively or quantitatively analyze the analyte in the sample.
- the analyte in the sample is qualitatively or quantitatively analyzed by the use of corresponding curves of a plurality of reaction fields where the specific binding reaction is conducted, the range of the qualitative or quantitative analysis is extended as compared to that in the conventional specific binding analysis method using a single corresponding curve.
- the analyte concentration in the sample is less than the minimum value of an analyte concentration at an intersection generated when overlapping the calibration curves of the respective reaction fields where the specific binding reaction is conducted, as comparing signal intensities of reaction fields, where the sample is introduced and the specific binding reaction is conducted, the analyte in the sample shows a larger signal intensity in a reaction field whose calibration curve is more steeply inclined in the straight line region, where the prozone phenomenon is not occurring.
- the specific binding analysis device in the present invention judges the analyte concentration in the sample as being out of the scope of the qualitatively or quantitatively analysis. In such a case, a sample further diluted is employed or a specific binding analysis device capable of corresponding to an analyte with a high concentration is used, to qualitatively or quantitatively analyze the analyte in the sample.
- the range of qualitatively or quantitatively analyzing the analyte is extended by preparing a device with a large minimum value of the analyte concentration at this intersection.
- an analyte where it matters whether or not the analyte is not less than a normal value in a certain range, such as some kind of clinical marker, it is clinically useful to set up a value adjacent to the normal value as a threshold since it can be a criterion of decision as to whether or not an abnormal value is shown.
- the analyte is qualitatively or quantitatively analyzed by analyzing a signal intensity of a reaction field whose calibration curve in the straight line region is most steeply inclined among reaction fields where the specific binding reaction is conducted to show signal intensities not higher than a certain threshold.
- the threshold in this case is less than the maximum value of the signal intensity whose calibration curve in the straight line region, where the prozone phenomenon is not occurring, is most steeply inclined among calibration curves of reaction fields where the specific binding reaction is conducted.
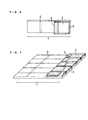
- FIG. 1 is a schematic oblique view of a single unit constituting a test strip as a specific binding analysis device in accordance with the present embodiment
- FIG. 2 is a schematic oblique view of a test strip in accordance with the present invention in which a plurality of units, shown in FIG. 1, are linked to one another.
- FIG. 3 is a schematic sectional view showing a structure of an analysis device and a test strip of the present invention.
- hCG is used as an analyte.
- a monoclonal antibody to hCG which is capable of participating in a sandwich reaction with hCG, is used as a first specific binding substance and a second specific binding substance.
- colloidal gold is used as a labeling material (direct label).
- the strip is constituted by a developing layer 1 on which a space forming zone 2 with an equivalent content is disposed. Further, on the developing layer 1, the anti-hCG monoclonal antibody as the first specific binding substance is retained in a retention zone 5 in the state of being labeled with colloidal gold, and the anti-hCG monoclonal antibody as the second specific binding substance is immobilized in a detection zone 6; on the upper face of the developing layer 1, a first electrode 11 and a second electrode 12 are disposed. Further, an analysis device is constituted by a light source 7, a light detector 8, an analyzer 9 and a start-of-measurement detector 10 as a means to recognize introduction of a sample into the strip.
- the detection zone 6 is irradiated with light having a prescribed wavelength (e.g. 520 nm) from the light source 7, and the reflected light is detected with the light detector 8 and then analyzed with the analyzer 9, to measure an absorption in the detection zone 6.
- a prescribed wavelength e.g. 520 nm
- the measurement wavelength selected may be one suitable for the sample or exhibition of color of the labeling material in the detection zone 6.
- a sample containing hCG is introduced into the test strip.
- the developing layer 1 in a dry state changes to be in a wet state, and a conductivity of the developing layer 1 thus changes.
- the conductivity of the developing layer 1 in a dry state is previously measured prior to the sample introduction and then the conductivity is monitored during the sample introduction so that the start-of-measurement detector 10 can detect the sample introduction from the change in conductivity of the developing layer 1.
- the analyzer 9 has the function of controlling the light source 7 and the light detector 8 so as to automatically measure the absorption in the detection zone 6 at a previously predetermined time.
- the sample temporarily retained in the space forming zone 2 is discharged out of an outlet 4, develops along the developing layer 1 and arrives at the retention zone 5, where hCG in the sample and the anti-hCG monoclonal antibody bound to colloidal gold form a labeled antigen-antibody complexes. Subsequently, upon arrival of the sample at the detection zone 6, the labeled antigen-antibody complexes are bound to the immobilized anti-hCG monoclonal antibody so that the labeled anti-hCG monoclonal antibody is trapped in the detection zone 6 to exhibit color.
- the absorption of the labeling material in the detection zone 6 reflects an amount of hCG in the sample.
- a sampling inspection is previously conducted at the time of preparation of the analysis devices where the absorptions in the detection zones 6 are measured using a standard substance, and further, with the use of the analysis device from the same lot, the absorptions in the detection zone 6 measured with respect to the respective hCG concentrations are plotted to give a calibration curve.
- a plurality of calibration curves for concentration conversion are prepared during preparation of the analysis devices, and then, when using the analysis devices, measurements are conducted using the standard sample, and from the absorption in the detection zone 6 shown by the standard sample, a calibration curve for concentration conversion to be applied to each of the analysis devices is determined. With this calibration curve utilized, the hCG concentration in the sample introduced to the developing layer 1 can be calculated from the absorption in the detection zone 6.
- FIG. 19 shows a schematic oblique view of a strip (a specific binding analysis device) in accordance with the present invention, comprising a single inlet.
- the strip may be constituted by a plurality of units and just a single inlet.
- the sample needs to be introduced separately into each inlet of a plurality of units; however, in the strip shown in FIG. 19, the sample can be introduced into each of the units only by one-time introduction of the sample into one inlet(3a) due to capillary phenomenon.
- the constituents shown by the reference numbers in FIG. 19 are the same as those shown by the reference numbers in FIG. 1.
- Embodiment 2 of the present invention also has the structures shown in FIGS. 1 to 3.
- each of the first specific binding substance and the second specific binding substance is the monoclonal antibody to hCG, which is capable of participating in a sandwich reaction with hCG, and colloidal gold is used as the labeling material for direct labeling.
- the anti-hCG monoclonal antibody as the first specific binding substance is retained in a retention zone 5 in the state of being labeled with colloidal gold, and the anti-hCG monoclonal antibody as the second specific binding substance is immobilized in a detection zone 6; on the upper face of the developing layer 1, a first electrode 11 and a second electrode 12 are disposed.
- the strip is constituted by the developing layers 1, on which the space forming zones 2 are equal in volume while the retention zones 5 are different in retained amount of the anti-hCG monoclonal antibody, as the first specific binding substance, labeled with colloidal gold.
- the analysis device is constituted by a light source 7, a light detector 8, an analyzer 9 and a start-of-measurement detector 10 for recognizing introduction of a sample into the test strip.
- the detection zone 6 is irradiated with light having a prescribed wavelength (e.g. 520 nm) from the light source 7, and the reflected light is detected with the light detector 8 and then analyzed with the analyzer 9, to measure an absorption in the detection zone 6.
- a prescribed wavelength e.g. 520 nm
- the measurement wavelength selected may be one suitable for the sample or exhibition of color of the labeling material in the detection zone 6.
- a sample containing hCG is introduced into the test strip.
- the developing layer 1 in a dry state changes to be in a wet state, and a conductivity of the developing layer 1 thus changes.
- the conductivity of the developing layer 1 in a dry state is previously measured prior to the sample introduction and then the conductivity is monitored during the sample introduction so that the start-of-measurement detector 10 can detect the sample introduction from the change in conductivity of the developing layer 1.
- the analyzer 9 has the function of controlling the light source 7 and the light detector 8 so as to automatically measure the absorption in the detection zone 6 at a previously predetermined time.
- the sample temporarily retained in the space forming zone 2 is discharged out of the outlet 4, develops along the developing layer 1 and arrives at the retention zone 5, where hCG in the sample and the anti-hCG monoclonal antibody bound to colloidal gold form a labeled antigen-antibody complexes. Subsequently, upon arrival of the sample at the detection zone 6, the labeled antigen-antibody complexes are bound to the immobilized anti-hCG monoclonal antibody so that the labeled anti-hCG monoclonal antibody is trapped in the detection zone 6 to exhibit color.
- the absorption of the labeling material in the detection zone 6 reflects an amount of hCG in the sample.
- an amount of the sample introduced to each of the developing layers 1 is equal since the space forming zone 2 on each of the developing layers 1 is equal in volume; however, the absorption in each of the detection zones 6 is different since an amount of the anti-hCG monoclonal antibody, as the first specific binding substance, labeled with colloidal gold, retained in each of the retention zones 5 is different. Accordingly, the introduction of the sample into the test strip allows automatic, simultaneous observation of reactions between the antigen and the antibody in different composition ratios.
- the present invention it is possible to automatically adjust the composition ratio of the analyte and the specific binding substance which are capable of participating in the specific binding reaction on each of the developing layers 1, by previously adjusting the amount of the anti-hCG monoclonal antibody, as the first specific binding substance, labeled with colloidal gold, retained in the detection zone 5 on each of the developing layers 1, and it is also possible to calculate the hCG concentration in the sample introduced into the test strip by observing and comparing the results of the specific binding reactions between the analyte and the specific binding substance in different composition ratios, and by utilizing the calibration curve, from the absorption of the labeling material in the detection zone 6 on the developing layer 1 with the composition ratio not influenced by the prozone phenomenon.
- FIG. 6 is a schematic oblique view of a single unit constituting a test strip as a specific binding analysis device in accordance with the present embodiment
- FIG. 7 is a schematic oblique view of a test strip in accordance with the present invention in which a plurality of units, shown in FIG. 6, are linked to one another. It is to be noted that the structure of the specific binding analysis device in accordance with the present embodiment is the same as that shown in FIG. 3.
- each of the first specific binding substance and the second specific binding substance is the monoclonal antibody to hCG, which is capable of participating in a sandwich reaction with hCG, and colloidal gold is used as the labeling material for direct labeling.
- a solution of an anti-hCG monoclonal antibody, as the first specific binding substance, labeled with colloidal gold is sealed into the space forming zone 2 disposed on the developing layer 1, and the concentration, as well as an amount, of the anti-hCG monoclonal antibody solution to be sealed can be adjusted without restraint.
- the anti-hCG monoclonal antibody as the second specific binding substance is immobilized in the detection zone 6 on the developing layer 1, and the first electrode 11 and the second electrode 12 are disposed on the upper face of the developing layer 1.
- the analysis device is constituted by a light source 7, a light detector 8, an analyzer 9 and a start-of-measurement detector 10 as a means to recognize introduction of a sample into the test strip.
- the detection zone 6 is irradiated with light having a prescribed wavelength (e.g. 520 nm) from the light source 7, and the reflected light is detected with the light detector 8 and then analyzed with the analyzer 9, to measure an absorption in the detection zone 6.
- the measurement wavelength selected may be one suitable for the sample or exhibition of color of the labeling material in the detection zone 6.
- the sample containing hCG is introduced into the test strip for a test reagent.
- the sample flows into the space forming zone 2 due to capillarity phenomenon.
- the developing layer 1 in a dry state changes to be in a wet state, and a conductivity of the developing layer 1 thus changes.
- a conductivity of the developing layer 1 in a dry state is previously measured prior to the sample introduction and the conductivity is monitored during the sample introduction so that the start-of-measurement detector 10 can detect the sample introduction from the change in conductivity of the developing layer 1.
- the information on this detection is sent from the start-of-measurement detector 10 to the analyzer 9, which starts calculation of the measurement time on the assumption that the time at which the sample introduction is detected is zero.
- the analyzer 9 has the function of controlling the light source 7 and the light detector 8 so as to automatically measure the absorption in the detection zone 6 at a previously predetermined time.
- the sample having flown into the space forming zone 2 comes into contact and then gets mixed with the solution of the anti-hCG monoclonal antibody, as the first specific binding substance, labeled with colloidal gold having been sealed in the space forming zone 2 so that the anti-hCG monoclonal antibody bound to colloidal gold and hCG in the sample form a labeled antigen-antibody complexes.
- the sample temporarily retained in the space forming zone 2 is discharged out of the outlet 4, develops along the developing layer 1 and arrives at the detection zone 6, where the labeled antigen-antibody complexes are bound to the immobilized anti-hCG monoclonal antibody, and thereby the labeled anti-hCG monoclonal antibody is trapped in the detection zone 6 to exhibit color.
- the absorption of the labeling material in the detection zone 6 reflects the amount of hCG in the sample.
- a sampling inspection is previously conducted at the time of preparation of the analysis devices where the absorptions in the detection zones 6 are measured using a standard substance, and further, with the use of the analysis device from the same lot, the absorptions in the detection zone 6 measured with respect to the respective hCG concentrations are plotted to give a calibration curve.
- a plurality of calibration curves for concentration conversion are prepared during preparation of the analysis devices, and then, when using the analysis devices, measurements are conducted using the standard sample, and from the absorption in the detection zone 6 shown by the standard sample, a calibration curve for concentration conversion to be applied to each of the analysis devices is determined. With this calibration curve utilized, the hCG concentration in the sample introduced to the developing layer 1 can be calculated from the absorption in the detection zone 6.
- a sample containing hCG intended to be quantitatively analyzed is introduced into a strip from the same lot for a test reagent which comprises a plurality of space forming zones 2.
- the total amount of the anti-hCG monoclonal antibodies sealed in the respective space forming zones 2 in the strip is constant, whereas the concentration as well as the amount of the anti-hCG monoclonal antibody solution sealed in each of the space forming zones 2 are different.
- the sample When brought into contact with the inlet 3, the sample flows into the space forming zone 2 due to capillary phenomenon; however, the amounts of the sample flowing in are different among the respective space forming zones 2 because of the difference in amount of the solution of the anti-hCG monoclonal antibody, as the first specific binding substance, labeled with colloidal gold, which is sealed in each of the space forming zones 2. Since the total amount of the anti-hCG monoclonal antibodies sealed in the respective space forming zones 2 is constant, the introduction of the sample into the test strip comprising a plurality of space forming zones 2 allows simultaneous observation of the specific binding reactions of the automatically diluted sample.
- the sample automatically diluted in phases by previously adjusting the amount of the solution sealed in the space forming zone 2, and it is also possible to confirm as to whether there exists the concentration range where the prozone phenomenon is occurring, by observing and comparing the absorptions of the sample, diluted in phases, in the detection zone 6.
- the hCG concentration in the sample introduced to the developing layer 1 can be calculated from the absorption of the sample, diluted to have a concentration not influenced by the prozone phenomenon, in the detection zone 6, with the use of the calibration curve.
- the product of the dilution ratio and the analyte concentration obtained using the calibration curve is the analyte concentration in the sample.
- a strip for a test reagent in the present embodiment is the same as in above Embodiment 2, except that the strip is constituted by the developing layers 1 with different affinities of the anti-hCG monoclonal antibodies as the second specific binding substances immobilized in the respective detection zones 6.
- the absorption of the labeling material in the detection zone 6 reflects the amount of hCG in the sample.
- anti-hCG monoclonal antibodies each having a different affinity are prepared and immobilized in the detection zones 6 as the second specific binding substance, whereby the absorption in the detection zone 6 is different on each of the developing layers 1. Accordingly, the introduction of the sample into the test strip allows automatic and simultaneous observation of the antigen-antibody reactions having different signal intensities.
- the present embodiment it is possible to adjust, on each of the developing layers 1, the strength of the interaction between the analyte and the specific binding substance which are capable of participating in the specific binding reaction by previously adjusting the affinity of the anti-hCG monoclonal antibody as the second specific binding substance immobilized in the detection zone 6 on each of the developing layers 1, and it is also possible to calculate the hCG concentration in the sample introduced into the test strip by observing and comparing the results of the specific binding reactions with different strengths of the interactions between the analyte and the specific binding substance, and by utilizing the calibration curve, from the absorption of the labeling material in the detection zone 6 on the developing layer 1, where the antibody having the affinity not influenced by the prozone phenomenon is immobilized.
- the same strip for a test reagent as in above Embodiment 3 is used, except that solutions of the anti-hCG monoclonal antibody, labeled with colloidal gold with different particle sizes, are adjusted to have a fixed absorption with a prescribed wavelength (e.g. 520 nm), which is then sealed in the same amount into each of the space forming zones 2 to constitute the strip.
- a prescribed wavelength e.g. 520 nm
- a sample containing hCG intended to be quantitatively analyzed is introduced into a strip from the same lot for a test reagent which comprises a plurality of space forming zones 2.
- colloidal gold as the labeling material have different particle sizes, the number of the labeling materials and the number of the antibodies, to be sealed, are different among the respective space forming zones 2.
- reactions between the antigen and the antibody in different composition ratios are observed on the respective developing layers 1 due to steric hindrance which is caused by the particle size of colloidal gold and the difference in number of the labeling materials or the difference in number of the antibodies. Accordingly, the introduction of the sample into the strip comprising a plurality of space forming zones 2 allows simultaneous observation of the specific binding reactions with different signal intensities in the detection zones 6.
- the composition ratio of the analyte and the specific binding substance which are capable of participating in the specific binding reaction by utilizing the characteristic of the labeling material, and it is also possible to calculate the hCG concentration in the sample introduced into the test strip by observing and comparing the results of the specific binding reactions between the analyte and the specific binding substance in different composition ratios, and by utilizing the calibration curve, from the absorption of the labeling material in the detection zone 6 on the developing layer 1 with the composition ratio not influenced by the prozone phenomenon.
- the corresponding relationship between the analyte concentration and the signal intensity in the detection zone 6 is previously assayed by the use of a standard substance with a known concentration, and the characteristic of the labeling material is utilized to adjust the concentration of the analyte, at which the prozone phenomenon occurs, to be different on each of the developing layers 1.
- the specific binding substance solution to be sealed into each of the space forming zones 2 is not necessarily in a fixed amount.
- the method to be used for adjusting the amount of the specific binding substance solution is not limited to the method using the absorptions.
- the characteristic of the labeling material is not limited to the particle size thereof, but various characteristics of the labeling material can be applied as necessary, according to each of labeling material agents.
- the sample containing hCG is introduced into the strip to make the detection zone 6 exhibit color in the same manner as in Embodiment 3.
- the light source 7 and the light detector 8 are then scanned in the direction along the detection zone 6 so as to successively measure the signal intensities in the detection zones 6. It should be noted that the same effect can also be obtained by immobilizing the light source 7 and the light detector 8 and scanning the strip in a certain direction. Since the developing layers 1 are disposed in parallel while providing a gap between each of the layers, the signal intensities can be distinguishd among the respective developing layers 1 when the signal intensities are successively measured in a plurality of detection zones 6.
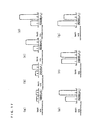
- FIG. 12 is a schematic diagram of a curve drawn after analyzing the distribution status of the signal intensity in the detection zone 6 in the direction of the width of a developing layer 1. This curve was drawn after irradiating the upper face of the developing layer 1 with light from the light source 7 while scanning the developing layer 1 or the light source 7 and the light detector 8, and then analyzing, with the analyzer 9, reflected light detected with the light detector 8.
- the ordinate and the abscissa express the signal intensity and position in the detection zone region, respectively. It is to be noted that, in the present embodiment, the strip, or the light source 7 and the light detector 8, are scanned in the direction along the detection zone 6 to successively measure the reflected light in the detection zone 6 so that the signal intensity is obtained.
- the measurement is conducted, considering the height "h” of the curve as the signal intensity based on the specific binding reaction.
- the area “S” of the curve can be considered as the signal intensity based on the specific binding reaction.
- the absorption of the labeling material in the detection zone 6 reflects the amount of hCG in the sample.
- a sampling inspection is previously conducted at the time of preparation of the analysis devices where the absorptions in the detection zones 6 are measured using a standard substance, and further, with the use of the analysis device from the same lot, the absorptions in the detection zone 6 measured with respect to the respective hCG concentrations are plotted to give a calibration curve.
- a plurality of calibration curves for concentration conversion are prepared during preparation of the analysis devices, and then, when using the analysis devices, measurements are conducted using the standard sample, and from the absorption in the detection zone 6 shown by the standard sample, a calibration curve for concentration conversion to be applied to each of the analysis devices is determined. With this calibration curve utilized, the hCG concentration in the sample introduced to the developing layer 1 can be calculated from the absorption in the detection zone 6.
- the sample containing hCG is introduced into the strip to make the detection zone 6 exhibit color in the same manner as in Embodiment 4.
- the light source 7 and the light detector 8 are then scanned in the direction along the detection zone 6 so as to successively measure the signal intensity in the detection zone 6. It should be noted that the same effect can also be obtained by immobilizing the light source 7 and the light detector 8 and scanning the strip in a certain direction. Since the developing layers 1 are disposed in parallel while providing a gap between each of the layers, the signal intensities can be distinguishd among the respective developing layers 1 when the signal intensities are successively measured in a plurality of detection zones 6.
- the absorption in the detection zone 6 reflects the amount of the hCG in the sample.
- anti-hCG monoclonal antibodies each having a different affinity are prepared and immobilized in the detection zones 6 as the second specific binding substance, whereby the absorption in the detection zone 6 is different on each of the developing layers 1. Accordingly, the introduction of the sample into the test strip allows automatic and simultaneous observation of the antigen-antibody reactions having different signal intensities.
- the present embodiment it is possible to adjust, on each of the developing layers 1, the strength of the interaction between the analyte and the specific binding substance which are capable of participating in the specific binding reaction by previously adjusting the affinity of the anti-hCG monoclonal antibody as the second specific binding substance immobilized in the detection zone 6 on each of the developing layers 1, and it is also possible to calculate the hCG concentration in the sample introduced into the test strip by observing and comparing the results of the specific binding reactions with different strengths of the interactions between the analyte and the specific binding substance, and by utilizing the calibration curve, from the absorption of the labeling material in the detection zone 6 on the developing layer 1, where the antibody having the affinity not influenced by the prozone phenomenon is immobilized.
- the corresponding relationship between the analyte concentration and the signal intensity in the detection zone 6 is previously assayed by the use of a standard substance with a known concentration, and the characteristic of the labeling material is utilized to adjust the concentration of the analyte, at which the prozone phenomenon occurs, to be different on each of the developing layers 1.
- the characteristic of the labeling material is utilized to adjust the concentration of the analyte, at which the prozone phenomenon occurs, to be different on each of the developing layers 1.
- a sample containing hCG intended to be quantitatively analyzed is introduced into a strip for a test reagent which comprises a plurality of space forming zones 2, in the same manner as in Embodiment 6.
- solutions of the anti-hCG monoclonal antibody, labeled with colloidal gold with different particle sizes are adjusted to have a fixed absorption with a prescribed wavelength (e.g. 520 nm), which is then sealed in the same amount into each of the space forming zones 2 to constitute the strip.
- a prescribed wavelength e.g. 520 nm
- the introduction of the sample into the test strip comprising a plurality of space forming zones 2 allows simultaneous observation of the specific binding reactions with different signal intensities in the detection zones 6.
- the composition ratio of the analyte and the specific binding substance which are capable of participating in the specific binding reaction by utilizing the characteristic of the labeling material, and it is also possible to calculate the hCG concentration in the sample introduced into the test strip by observing and comparing the results of the specific binding reactions between the analyte and the specific binding substance in different composition ratios, and by utilizing the calibration curve, from the absorption of the labeling material in the detection zone 6 on the developing layer 1 with the composition ratio not influenced by the prozone phenomenon.
- the corresponding relationship between the analyte concentration and the signal intensity in the detection zone 6 is previously assayed by the use of a standard substance with a known concentration, and the characteristic of the labeling material is utilized to adjust the concentration of the analyte, at which the prozone phenomenon occurs, to be different on each of the developing layers 1.
- the specific binding substance solution to be sealed into each of the space forming zones 2 is not necessarily in a fixed amount.
- the method to be used for adjusting the amount of the specific binding substance solution is not limited to the method using the absorptions.
- the characteristic of the labeling material is not limited to the particle size thereof, but various characteristics of the labeling material can be applied as necessary, according to each of labeling material agents.
- the present example was performed in line with aforesaid Embodiment 1 using the specific binding analysis device in accordance with FIGS. 1 to 3.
- a strip comprising five units shown in FIG. 2 was used.
- a monoclonal antibody to hCG capable of participating in a sandwich reaction with hCG was used as a first specific binding substance and a second specific binding substance, and colloidal gold was used as a labeling material to directly label the first specific binding substance.
- Urine added with a known amount of hCG was used as a sample, and when the detection zone 6 was irradiated with light having a wavelength of 520 nm, a signal intensity obtained in the light detector 8 was measured, to quantitatively measure the hCG concentration in the sample.
- the sample used was urine with an hCG concentration of 50 IU/L, 100 IU/L, 250 IU/L, 500 IU/L or 1,000 IU/L. These samples were introduced from each inlet 3 of the five units.
- the introduction of the sample was detected with the start-of-measurement detector 10 from the change in conductivity of the developing layer 1, and the measurement time was determined on the assumption that the start-of-detection time was zero.
- the space forming zone 2 with a volume of 50 ⁇ l was used. After being brought into contact with the inlet 3, the sample filled the space forming zone 2 within five seconds, and finished developing through the test strip in three minutes. Hence the rate of introducing the sample was sufficiently faster than the rate of discharging the sample.
- the volume of the space forming zone 2 is not particularly limited and is set up accordingly to the sample, analysis device or the like.
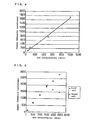
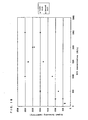
- FIG. 4 is a graph of the signal intensities measured in the detection zone 6 at 520 nm, five minutes after the introduction of the sample into the test strip.
- the signal intensity increases dependently on the concentration, indicating that they are in the linear relationship.
- the signal intensity in the detection zone 6 at 520 nm was zero. In such a manner, the use of FIG. 4 as the calibration curve allows measurement of the hCG concentration in the sample with a favorable quantitative property.
- the present example was performed in line with aforesaid Embodiment 2 using the specific binding analysis device in accordance with FIGS. 1 to 3.
- a test strip comprising two units was used here.
- the monoclonal antibody to hCG capable of participating in a sandwich reaction with hCG was used as the first specific binding substance and the second specific binding substance, and colloidal gold was used as the labeling material to directly label the first specific binding substance.
- Urine added with a known amount of hCG was used as the sample, and a signal intensity in the detection zone 6 at 520 nm was measured.
- the sample used was urine with an hCG concentration of 100 IU/L, 500 IU/L, 1,000 IU/L, 1,500 IU/L, 2,000 IU/L or 2,500 IU/L.
- the introduction of the sample was detected with the start-of-measurement detector 10 from the change in conductivity of the developing layer 1, and the measurement time was determined on the assumption that the start-of-detection time was zero.
- the amount of the first specific binding substance, directly labeled by the use of colloidal gold, retained in the retention zone 5 in the first unit was adjusted so as to be one tenth the amount retained in the second unit. That is, five single units are in a linked state in FIG. 2, whereas the strip with the configuration of comprising two units (the first unit and the second unit) linked to one another was used in the present example. Namely, samples with the aforesaid six kinds of hCG concentrations were introduced into both the first unit and the second unit.
- FIG. 5 is a graph showing the relationships between the hCG concentrations and the signal intensities in the detection zones 6 at 520 nm, measured five minutes after detection of the sample introduction, in the first unit and the second unit.
- the presence of excess hCG in the sample causes competition between hCG not specifically bound to the first specific binding substance labeled with colloidal gold and hCG specifically bound to the first specific binding substance labeled with colloidal gold, in the specific binding reaction with the second specific binding substance in the detection zone 6, resulting in a decrease in amount of the first specific binding substance labeled with colloidal gold, which is bound in the detection zone 6, and a decrease in signal intensity, to which colloidal gold contributes, and hence the signal intensity detected in the detection zone 6 does not reflect the amount of hCG in the sample.
- the signal intensity in the detection zone 6 at 520 nm was zero. This means that in the second unit, by increasing the amount of the anti-hCG monoclonal antibody, as the first specific binding substance labeled with colloidal gold, retained in the retention zone 5, the amount of hCG not specifically bound to the first specific binding substance, labeled with colloidal gold, which had caused the prozone phenomenon observed in the first unit, decreased, to avoid the influence of the prozone phenomenon.
- hCG concentration in the sample introduced into the test strip by previously adjusting the amount of the anti-hCG monoclonal antibody, as the first specific binding substance, labeled with colloidal gold, retained in the retention zone 5 in each of the units to automatically adjust, in each of the units, the composition ratio of the analyte and the specific binding substance which are capable of participating in the specific binding reaction, and by utilizing the calibration curve, from the absorption of the labeling material in the detection zone 6 on the developing layer 1 with the composition ratio not influenced by the prozone phenomenon.
- Table 1 showed the signal intensity ratios in the detection zones 6 of the first unit and the second unit, determined from FIG. 5.
- hCG concentration (IU/L) Signal intensity ratio (first unit/second unit) 100 0.962 500 0.964 1000 0.969 1500 0.959 2000 0.724 2500 0.529
- the present example was performed in line with aforesaid Embodiment 3 using the specific binding analysis device in accordance with FIGS. 3, 6 and 7.
- the number of the units in FIG. 7 was five whereas the number of the units here was six.
- the monoclonal antibody to hCG capable of participating in a sandwich reaction with hCG was used as the first specific binding substance and the second specific binding substance, and colloidal gold was used as the labeling material to directly label the first specific binding substance.
- an equal amount of a solution of an anti-hCG monoclonal antibody, as the first specific binding substance was sealed into each of the space forming zones 2.
- Urine added with a known amount of hCG was used as the sample, and a signal intensity in the detection zone 6 at 520 nm was measured.
- sample used here was urine with an hCG concentration of 100 IU/L, 500 IU/L, 1,000 IU/L, 1,500 IU/L, 2,000 IU/L or 2,500 IU/L.
- hCG concentration 100 IU/L, 500 IU/L, 1,000 IU/L, 1,500 IU/L, 2,000 IU/L or 2,500 IU/L.
- Such samples were introduced from each inlet 3 of the six units. Further, the introduction of the sample was detected with the start-of-measurement detector 10 from the change in conductivity of the developing layer 1, and the measurement time was determined on the assumption that the start-of-detection time was zero.
- FIG. 8 is a graph showing the relationships between the hCG concentrations and the signal intensities in the detection zones 6 at 520 nm, measured five minutes after the detection of the sample introduction, in the strip comprising the six units.
- the presence of excess hCG in the sample causes competition between hCG not specifically bound to the first specific binding substance labeled with colloidal gold and hCG specifically bound to the first specific binding substance labeled with colloidal gold, in the specific binding reaction with the second specific binding substance in the detection zone 6, resulting in a decrease in amount of the first specific binding substance labeled with colloidal gold, which is bound in the detection zone 6, and a decrease in signal intensity, to which colloidal gold contributes, and hence the signal intensity detected in the detection zone 6 does not reflect the amount of hCG in the sample.
- urine with an hCG concentration of 2,500 IU/L was introduced into each of the units of the test strip comprising five space forming zones 2.
- the test strip was used where the total amount of the anti-hCG monoclonal antibodies sealed in the respective space forming zones 2 was constant, but the concentration as well as the amount of the anti-hCG monoclonal antibody solution sealed in each of the space forming zones 2 were made different; to be more specific, the anti-hCG monoclonal antibody solutions were adjusted such that the final hCG concentrations of the samples to be developed along the developing layers 1 were, respectively, 100 IU/L, 500 IU/L, 1,000 IU/L, 1,500 IU/L and 2,000 IU/L, which were then sealed into the space forming zones 2.
- the sample when the sample was brought into contact with the inlet 3, a certain amount of the sample flowed in due to capillary phenomenon; however, the amount of the sample flowing in was different in each of the space forming zones 2 because of the difference in amount of the solution of the anti-hCG monoclonal antibody, as the first specific binding substance, labeled with colloidal gold, which was sealed in each of the space forming zones 2. Since the total amount of the anti-hCG monoclonal antibodies sealed in the respective space forming zones 2 was constant, the introduction of the sample into the test strip comprising a plurality of space forming zones 2 allowed simultaneous observation of the specific binding reactions of the automatically diluted sample.
- FIG. 9 showed a graph of overlapped calibration curves each obtained by measuring the signal intensity in the detection zone 6 by the use of a sample containing hCG with a known concentration as the sample in each of Unit A, Unit B and Unit C.
- the calibration curve A, the calibration curve B and the calibration curve C were corresponded to Unit A, Unit B and Unit C, respectively.
- Unit A, Unit B and Unit C were used under the same conditions except for the amount of the solution of the anti-hCG monoclonal antibody labeled with colloidal gold, which was sealed in each of the space forming zones 2. Although the total amount of the anti-hCG monoclonal antibodies sealed in the respective space forming zones 2 in Unit A. Unit B and Unit C was constant, the amount of the antibody solution sealed in each of the space forming zones 2 was made smaller in the order of Unit A, Unit B and Unit C, i.e., the amount of Unit A > the amount of Unit B > the amount of Unit C.
- the inclination of the calibration curve in the straight line region where the prozone phenomenon was not occurring was steeper in the order of Unit C, Unit B and Unit A since, upon introduction of the sample containing hCG into the space forming zone 2, the larger the amount of the sealed antibody solution, the more sample was diluted.
- the calibration curves A, B and C when the hCG concentration was low, the signal intensity increased with an increase in concentration; when the hCG concentration was high, the prozone phenomenon was observed.
- the intersection of the calibration curves A and B was (C1, S1)
- the intersection of the calibration curves B and C was (C2, S2)
- the intersection of the calibration curves A and C was (C3, S3)
- a threshold S5 was set, which was less than the minimum signal intensity S3 among the values of signal intensities of the respective calibration curves and also less than the minimum signal intensity S4 among the maximum values of the signal intensities of the respective calibration curves.
- the signal intensities in the detection zones 6 when Sample X, Sample Y and Sample Z, each containing hCG, were developed in the strips were (X A , X B , X C ), (Y A , Y B , Y C ), (Z A , Z B , Z C ) in the order of Unit A, Unit B and Unit C.
- the magnitudes of the signal intensities were represented by X A ⁇ X B ⁇ X C and X C ⁇ S5.
- the hCG concentration in the sample could be measured by using the signal intensity X C shown in Unit C which showed the largest signal intensity among the reaction fields to show signal intensities not more than the threshold S5 (Units A, B, C).
- the smaller concentration C x1 between C x1 and C x2 corresponding to the signal intensity X C obtained from the calibration curve C was the hCG concentration in the sample.
- the product of the dilution ratio and the analyte concentration C x1 obtained using the calibration curve C was the analyte concentration in the sample.
- the magnitudes of the signal intensities were expressed by Y A ⁇ Y B ⁇ Y C and Y B ⁇ S5 ⁇ Y C .
- the hCG concentration in the sample could be measured by using the signal intensity Y B shown in Unit B which showed the largest signal intensity among the reaction fields to show signal intensities not more than the threshold S5 (Units A, B).
- the magnitude relationship of the signal intensities shown by the analyte in the sample on the reaction fields, where the sample was introduced and the specific binding reaction was conducted corresponded to the magnitude relationship of the inclinations of the calibration curves in the straight line regions where the prozone phenomenon was not occurring
- the smaller concentration C Y1 between C Y1 and C Y2 corresponding to the signal intensity Y B obtained from the calibration curve B was the hCG concentration in the sample.
- the product of the dilution ratio and the analyte concentration C Y1 obtained from the calibration curve C was the analyte concentration in the sample.
- the magnitudes of the signal intensities were expressed by Z C ⁇ Z B ⁇ Z A and Z B ⁇ S5 ⁇ Z A .
- the specific binding analysis device in the present invention could consider the hCG concentration in the sample as being out of the scope of the qualitatively or quantitatively analysis.
- the sample Z was further diluted or a specific binding analysis device adaptable to a high hCG concentration was used so as to qualitatively or quantitatively analyze hCG in the sample.
- the present example was performed in line with aforesaid Embodiment 4 using the specific binding analysis device in accordance with FIGS. 1 to 3. Hence the same operation was conducted as in Example 2, except that a strip comprising a first unit and a second unit was prepared and anti-hCG monoclonal antibodies having different affinities (10 11 M -1 and 10 10 M -1 ) were immobilized, respectively, in the detection zones 6 of the first unit and the second unit.
- FIG. 10 is a graph showing the relationships between the hCG concentrations and the signal intensities in the respective detection zones 6 at 520 nm, measured five minutes after the detection of the sample introduction, in the first unit and the second unit.
- the signal intensity increases dependently on the concentration, indicating that they are in the linear relationship.
- the signal intensity in the detection zone 6 at 520 nm was zero.
- the hCG concentration in the sample introduced into the test strip can be calculated by previously adjusting the affinity of the anti-hCG monoclonal antibody to be immobilized in the detection zone 6 in each of the units to adjust the strength of the interaction with the analyte and by utilizing the calibration curve, from the absorption of the labeling material in the detection zone 6 in the unit, where the antibody with an affinity not influenced by the prozone phenomenon is immobilized.
- Example 5 a specific binding analysis device with a configuration of linking three single units in the same manner as in Example 4 was used and the same operation as in Example 5 was conducted.
- a graph was created by overlapping calibration curves each obtained by measuring the signal intensity in the detection zone 6, using a sample containing hCG with a know concentration as the sample in each of Unit A, Unit B and Unit C, which was the same graph as the one shown in FIG. 9.
- Example 5 The same operation as in Example 5 was conducted in line with aforesaid Embodiment 5 where the particle size of colloidal gold as the labeling material is changed.
- urine with an hCG concentration of 100 IU/L, 250 IU/L, 500 IU/L, 1,000 IU/L, 1,500 IU/L, 2,000 IU/L or 2,500 IU/L was used as the sample.
- a strip comprising a first unit and a second unit was prepared and colloidal gold with particle sizes of 20 nm and 70 nm were used as the labeling materials for the anti-hCG monoclonal antibodies as the first specific binding substances in the respective units.
- FIG. 11 is a graph showing the relationships between the hCG concentrations and the signal intensities in the detection zones 6 at 520 nm, measured five minutes after the detection of the sample introduction, in the first unit and the second unit.
- the presence of excess hCG in the sample causes competition between hCG not specifically bound to the first specific binding substance labeled with colloidal gold and hCG specifically bound to the first specific binding substance labeled with colloidal gold, in the specific binding reaction with the second specific binding substance in the detection zone 6.
- the amount of the first specific binding substance labeled with colloidal gold, which is bound in the detection zone 6 decreases and the signal intensity, to which colloidal gold contributes, decreases, and hence the signal intensity detected in the detection zone 6 does not reflect the amount of hCG in the sample.
- the signal intensity in the detection zone 6 at 520 nm was zero.
- the number of the anti-hCG monoclonal antibodies as the first specific binding substances which were sealed in the space forming zone increased while the amount of hCG not specifically bound to the first specific binding substance labeled with colloidal gold, which had caused the prozone phenomenon observed in the second unit, decreased, to avoid the influence of the prozone phenomenon.
- the hCG concentration in the sample introduced into the strip can be calculated by previously adjusting the characteristic of the labeling material to adjust the number of the anti-hCG monoclonal antibodies as the first specific binding substances labeled with colloidal gold in the respective units and automatically adjust the composition ratio of the analyte and the specific binding substance which are capable of participating in the specific binding reaction, and by utilizing the calibration curve, from the absorption of the labeling material in the detection zone 6 in the unit with the composition ratio not influenced by the prozone phenomenon.
- the monoclonal antibody to hCG capable of participating in a sandwich reaction with hCG was used as the first specific binding substance and the second specific binding substance, and colloidal gold was used as the labeling material to directly label the first specific binding substance.
- Urine added with a known amount of hCG was used as the sample, and a signal intensity in the detection zone at 520 nm was measured.
- the sample used was urine with an hCG concentration of 100 IU/L, 250 IU/L, 500 IU/L or 1,000 IU/L.
- the introduction of the sample was detected with the start-of-measurement detector 10 from the change in conductivity of the developing layer 1, and the measurement time was determined on the assumption that the start-of-detection time was zero.
- FIG. 13 represented the distribution status of the signal intensity in the detection zone 6 at 520 nm, measured five minutes after the detection of the sample introduction in a strip constituted by disposing four units on parallel.
- the signal intensities in the respective units can be distinguishd when the signal intensities in a plurality of detection zones 6 are successively measured.
- FIG. 14 is a graph showing the relationship between the hCG concentration and the signal intensity in the detection zone 6 at 520 nm, measured five minutes after the detection of the sample introduction, when it is assumed that the height of the curve in FIG. 13 was the signal intensity in the detection zone of each of the units.
- the signal intensity increases dependently on the concentration, indicating that the linear relationship has been formed therebetween.
- the signal intensity in the detection zone 6 at 520 nm was zero.
- the monoclonal antibody to hCG capable of participating in a sandwich reaction with hCG was used as the first specific binding substance and the second specific binding substance, and colloidal gold was used as the labeling material to directly label the first specific binding substance.
- Urine added with a known amount of hCG was used as the sample, and a signal intensity in the detection zone at 520 nm was measured.
- the sample used was urine with an hCG concentration of 100 IU/L, 500 IU/L, 1,000 IU/L, 1,500 IU/L, 2,000 IU/L or 2,500 IU/L.
- a strip comprising a first unit and a second unit was prepared and anti-hCG monoclonal antibodies having different affinities (10 11 M -1 and 10 10 M -1 ) were immobilized, respectively, in the detection zones 6 of the first unit and the second unit.
- FIG. 16 is a graph showing the relationships between the hCG concentrations and the signal intensities in the detection zones 6 at 520 nm, measured five minutes after the detection of the sample introduction, when it is assumed that the height of the curve in FIG. 15 was the signal intensity in the detection zone of each of the units.
- the presence of excess hCG in the sample causes competition between hCG not specifically bound to the first specific binding substance labeled with colloidal gold and hCG specifically bound to the first specific binding substance labeled with colloidal gold, in the specific binding reaction with the second specific binding substance in the detection zone 6, resulting in a decrease in amount of the first specific binding substance labeled with colloidal gold, which is bound in the detection zone 6, and a decrease in signal intensity, to which colloidal gold contributes, and hence the signal intensity detected in the detection zone 6 does not reflect the amount of hCG in the sample.
- the signal intensity in the detection zone 6 at 520 nm was zero.
- the use of the antibody with lower affinity in the second unit as compared to the antibody immobilized in the first unit weakened the strength of the interaction with the analyte, thereby changing the balance between the analyte trapped due to the specific binding reaction in the detection zone 6 and the analyte washed off out of the detection zone along with the flow of the sample.
- the analyte concentration observed as the prozone phenomenon then shifts to the higher concentration side than the developing layer 1, meaning that, as a result, the influence of the prozone phenomenon is avoided in the second unit.
- the hCG concentration in the sample introduced into the test strip can be calculated by previously adjusting the affinity of the anti-hCG monoclonal antibody to be mobilized in the detection zone 6 in each of the units to adjust the strength of the interaction with the analyte, and by utilizing the calibration curve, from the absorption of the labeling material in the detection zone in the unit, where the antibody with the affinity not influenced by the prozone phenomenon is immobilized.
- the monoclonal antibody to hCG capable of participating in a sandwich reaction with hCG was used as the first specific binding substance and the second specific binding substance, and colloidal gold was used as the labeling material to directly label the first specific binding substance.
- Urine added with a known amount of hCG was used as the sample, and a signal intensity in the detection zone at 520 nm was measured.
- the sample used was urine with an hCG concentration of 100 IU/L, 250 IU/L, 500 IU/L, 1,000 IU/L, 1,500 IU/L, 2,000 IU/L or 2,500 IU/L.
- a strip comprising a first unit and a second unit was prepared and colloidal gold with particle sizes of 20 nm and 70 nm were used as the labeling materials for the anti-hCG monoclonal antibodies as the first specific binding substances of the respective units. Further, the equal amount of the solution of the anti-hCG monoclonal antibody labeled with each of the colloidal gold, with the absorption at 520 nm made constant, was sealed into each of the space forming zones.
- FIG. 18 is a graph showing the relationships between the hCG concentrations and the signal intensities in the detection zones 6 at 520 nm, measured five minutes after the detection of the sample introduction, when it is assumed that the height of the curve in FIG. 17 was the signal intensity in the detection zone of each of the units.
- the presence of excess hCG in the sample causes competition between hCG not specifically bound to the first specific binding substance labeled with colloidal gold and hCG specifically bound to the first specific binding substance labeled with colloidal gold, in the specific binding reaction with the second specific binding substance in the detection zone 6, resulting in a decrease in amount of the first specific binding substance labeled with colloidal gold, which is bound in the detection zone 6, and a decrease in signal intensity, to which colloidal gold contributes, and hence the signal intensity detected in the detection zone 6 does not reflect the amount of hCG in the sample.
- the signal intensity in the detection zone 6 at 520 nm was zero.
- the number of the anti-hCG monoclonal antibodies as the first specific binding substances which were sealed in the space forming zone increased while the amount of hCG not specifically bound to the first specific binding substance labeled with colloidal gold, which had caused the prozone phenomenon observed in the second unit, decreased, to avoid the influence of the prozone phenomenon.
- the hCG concentration in the sample introduced into the test strip can be calculated by previously adjusting the characteristic of the labeling material to adjust the number of the anti-hCG monoclonal antibodies as the first specific binding substances labeled with colloidal gold in the respective units and automatically adjust the composition ratio of the analyte and the specific binding substance which are capable of participating in the specific binding reaction, and by utilizing the calibration curve, from the absorption of the labeling material in the detection zone 6 in the unit with the composition ratio not influenced by the prozone phenomenon.
- a specific binding analysis device and a specific binding analysis method can be provided, which are capable of making a sample automatically diluted without the need for an advanced device or operation, and further capable of qualitatively or quantitatively analyzing an analyte in a sample by means of a small-sized, simple measurement device in a simple, rapid and accurate manner, under little influence attributed to the concentration of the analyte in the sample.
Landscapes
- Health & Medical Sciences (AREA)
- Immunology (AREA)
- Life Sciences & Earth Sciences (AREA)
- Engineering & Computer Science (AREA)
- Molecular Biology (AREA)
- Biomedical Technology (AREA)
- Chemical & Material Sciences (AREA)
- Hematology (AREA)
- Urology & Nephrology (AREA)
- Biotechnology (AREA)
- Biochemistry (AREA)
- Cell Biology (AREA)
- Food Science & Technology (AREA)
- Medicinal Chemistry (AREA)
- Physics & Mathematics (AREA)
- Analytical Chemistry (AREA)
- Microbiology (AREA)
- General Health & Medical Sciences (AREA)
- General Physics & Mathematics (AREA)
- Pathology (AREA)
- Investigating Or Analysing Biological Materials (AREA)
- Automatic Analysis And Handling Materials Therefor (AREA)
- Investigating Or Analysing Materials By The Use Of Chemical Reactions (AREA)
Abstract
In order to perform a qualitative or quantitative
analysis of an analyte in a sample in a simple, rapid and
accurate manner where the sample can be automatically diluted
without the need for an advanced device or operation, under
little influence attributed to the analyte concentration in
the sample, a strip is used which comprises at least two or
more units arranged therein, each unit comprising: a space
forming zone 2; a retention zone 5 in which a labeled first
specific binding substance is retained; and a detection zone 6
in which a second specific binding substance is immobilized,
so that the analyte in the sample is qualitatively or
quantitatively analyzed based on a signal intensity obtained
attributed to a specific binding reaction in the detection
zone 6.
Description
The present invention relates to a specific binding
analysis device and a specific binding analysis method for
qualitatively or quantitatively analyzing an analyte in a
sample in a simple and rapid manner.
With the recent expansion of medical care in
households and communities as well as increase of clinical
examinations with high urgency, there is an increasing demand
for development of a specific binding analysis method which
can be performed even by persons other than experts of the
clinical examination, in a rapid, simple and reliable manner.
Many methods are known as the specific binding
analysis methods, which include immunoassay applying an
antigen-antibody reaction, receptor assay employing a receptor
and nucleic acid probe assay employing hybridization of
complementary nucleic acid sequences, and these methods have
been widely used in the clinical examinations and many other
fields because of the high specificity thereof.
As a more specific example mentioned can be
chromatography which comprises an operation of making a
sample suspected of containing an analyte infiltrate and
develop in a chromatograph region, which comprises a porous
carrier or a fine particle-packed carrier and where a specific
binding substance is insolubilized, together with, or
separated from, a labeled specific binding substance. This
analysis method is a type of immunoassay.
Chromatography is advantageous in terms of
measurement sensitivity and measurement time since the carrier
in the chromatography region has a large surface area where a
great amount of the specific binding substance can be
insolubilized, and a collision between reacting molecules,
which may cause a specific binding reaction, occurs with a
higher frequency as compared with a reaction in a liquid phase.
However, the conventional specific binding analysis
method has a problem called a prozone phenomenon. This is a
phenomenon in which an analyte concentration cannot be
unambiguously determined with respect to a signal intensity
attributed to a specific binding reaction.
In a specific binding analysis method, an analyte
is qualitatively or quantitatively analyzed by measurement
of a signal intensity obtained attributed to a specific
binding reaction between the analyte and a specific binding
substance. However, in a case where an excessive amount of
the analyte is present with respect to the specific binding
substance, that is, an analyte not specifically bound to the
specific binding substance is present in the reaction system,
the signal intensity obtained attributed to the specific
binding reaction does not reflect the amount of the analyte in
the sample.
In chromatography, for example, an analyte
specifically bound to a labeled specific binding substance and
an analyte not specifically bound to the labeled specific
binding substance compete to cause a specific binding reaction
with a specific binding substance immobilized on a carrier,
which results in reduction in signal intensity attributed to
the reaction contributed to by a labeling material. As thus
described, there are some possibilities in the specific
binding analysis method that the amount of the analyte whose
concentration is high in the sample is wrongly determined to
be small.
Hence a method of diluting a sample to a
concentration range which is not influenced by the prozone
phenomenon has been widely used, but this method has
rendered a signal intensity reduced and measurement steps
complicated. Also proposed has been a method of adding a
specific binding substance, capable of specifically binding to
an analyte, plural times to cause reactions so as to confirm
whether or not the prozone phenomenon has occurred; however,
this method renders measurement steps complicated.
In clinical examinations conducted employing the
specific binding analysis method, examination items differ
with purposes and, as the case may be, an examination by
plural items using just one clinical sample (multi-term
measurement) is required. While there are some cases where
clinical examinations are conducted on a daily basis with the
use of large-sized instruments in medical facilities and the
like, the large-sized instruments generally have problems in
terms of cost as well as maintenance.
Moreover, what is required in the scene of medical
diagnoses including the clinical examinations and in
households is a measurement device which can be operated
rapidly, simply and accurately and is available at a low price.
When an analyte in a sample is qualitatively or quantitatively
analyzed using the specific binding analysis method, therefore,
it is of necessity to read out a signal attributed to a
specific binding reaction in a simple and rapid manner.
Further, there has been desired a signal measurement principle
comprising a small number of operation steps since low-priced
measurement devices can be developed with simplification and
miniaturization of measurement devices.
Accordingly, in view of the aforesaid conventional
problems, an object of the present invention is to provide a
specific binding analysis method which enables a qualitatively
or quantitatively analysis of an analyte in a sample in a
simple, rapid and accurate manner with the use of a small,
simple measurement device, under little influence attributed
to the concentration of the analyte in the sample.
In order to solve the aforesaid problems, the
present invention provides a specific binding analysis
device for qualitatively or quantitatively analyzing an
analyte in a sample, using a specific binding reaction
between an analyte and a specific binding substance capable
of specifically binding to the analyte, the device
comprising: an inlet for introducing the sample; a
plurality of space forming zones for temporarily retaining
the sample introduced from the inlet; a plurality of reaction
fields where a specific binding reaction of the sample
retained in the space forming zone occurs; and an outlet for
discharging the sample from the space forming zone to the
reaction field, the specific binding reaction occurring under
a different condition in each of the reaction fields.
It is preferable that the number of the inlets is
one.
Herein, the aforesaid condition is one under which a
signal intensity detected in a detection zone can be changed.
This is specifically described below.
In the specific binding analysis device, it is
preferable that each of the plurality of space forming zones
is different in content.
It is preferable that the specific binding substance
is immobilized in at least either the space forming zone or
the reaction field.
It is also preferable that a characteristic of a
labeling material (e.g. a particle size or a material) is
different in each of the reaction fields.
Moreover, the kind of the specific binding substance
is preferably different in each of the space forming zones or
in each of the reaction fields. Further, an affinity of the
specific binding substance is preferably different in each of
the space forming zones or in each of the reaction fields.
Additionally, an amount of the specific binding substance is
preferably different in each of the space forming zones or in
each of the reaction fields.
It is also preferable that the rate of introducing
the sample from the inlet into the space forming zone is
faster than the rate of discharging the sample from the outlet
to the reaction field.
It is preferable that the reaction field comprises a
first specific binding substance labeled with the labeling
material and a second specific binding substance, and a
qualitative or quantitative analysis is performed based on
a signal attributed to a specific binding reaction that the
first specific binding substance and the second specific
binding substance are bound to one another via the analyte.
It is particularly preferable that the second
specific binding substance is immobilized on the reaction
field.
It is preferable that the reaction field is a
developing layer capable of developing the sample due to
capillarity, the detection zone is disposed on the
developing layer, and the second specific binding substance
is immobilized in the detection zone.
It is also preferable that the first specific
binding substance is retained on the developing layer.
It is further preferable that the sample does not
move between each of the plurality of developing layers.
This may be realized by providing a space between each of
the developing layers or forming a wall between each of the
developing layers. A material with chemical resistance may
constitute the wall.
It is also preferable that the signal is color,
fluorescence or luminescence, and the specific binding
analysis device of the present invention has a strip shape.
It is further preferable that the first specific
binding substance is contained in the reaction field and
the specific binding analysis device comprises a sensor for
recognizing the introduction of the sample into the space
forming zone.
It is preferable that at least either the first
specific binding substance or the second specific binding
substance is an antibody, and the labeling material is a
metal sol, a dye sol, a particle containing a fluorescent
substance, or a colored latex particle.
Further, the present invention relates to a
specific binding analysis method for qualitatively or
quantitatively analyzing an analyte in a sample, using a
specific binding analysis device which comprises: an inlet
for introducing the sample containing the analyte; a
plurality of space forming zones for temporarily retaining
the sample introduced from the inlet; a plurality of reaction
fields where a specific binding reaction of the analyte in the
sample retained in the space forming zone occurs; and an
outlet for discharging the sample from the space forming zone
to the reaction field, and is characterized in that the
specific binding reaction occurs under a different condition
in each of the reaction fields, and adjusting at least one
selected from the group consisting of a content of the space
forming zone, a dilution ratio of the sample retained in the
space forming zone and the characteristic of the labeling
material to analyze the analyte.
In the specific binding analysis method, it is
preferable that the analyte in the sample is qualitatively or
quantitatively analyzed, utilizing an amount of the sample to
be introduced, which has been adjusted by adjustment of the
content of the space forming zone.
It is also preferable that the introduction of the
sample into the space forming zone is recognized and a
standard sample is introduced into the space forming zone.
It is also preferable that the analyte in the sample
is qualitatively or quantitatively analyzed by making the
space forming zone carry a solution containing the first
specific binding substance, and then adjusting an amount of
the solution to be carried.
It is further preferable that the analyte in the
sample is qualitatively or quantitatively analyzed by
analyzing the product of an intensity of a signal attributed
to the specific binding reaction and a magnification of the
dilution.
It is preferable that the analyte in the sample is
qualitatively or quantitatively analyzed by analyzing on the
reaction fields a signal intensity of a reaction field where
the specific binding reaction is conducted to show a signal
intensity not higher than a prescribed threshold.
It is also preferable that the analyte in the sample
is qualitatively or quantitatively analyzed by analyzing a
signal intensity of a portion where the specific binding
reaction is conducted to show the largest signal intensity
among the reaction fields where the specific binding reaction
is conducted to show signal intensities not higher than the
threshold.
It is further preferable that the threshold is less
than the minimum value of a signal intensity at an
intersection which is generated when overlapping corresponding
curves of an analyte concentration and a signal intensity of
each of the portions where the specific binding reaction is
conducted, and is also less than the minimum signal intensity
among the maximum values of the signal intensities of the
respective corresponding curves.
It is further preferable that when the analyte in
the sample is qualitatively or quantitatively analyzed,
referring to the corresponding curves of the analyte
concentration and the signal intensity of the portion where
the specific binding reaction is conducted to show the largest
signal intensity among the reaction fields where the specific
binding reaction is conducted to show signal intensities not
higher than the threshold, in a case where there exist a
plurality of analyte concentrations corresponding to the
signal intensity of the portion where the specific binding
reaction is conducted to show the largest signal intensity
among the reaction fields where the specific binding reaction
is conducted to show signal intensities not higher than the
threshold, the smallest concentration is considered as the
analyte concentration.
A specific binding analysis device of the present
invention is a specific binding analysis device for
qualitatively or quantitatively analyzing an analyte in a
sample, using a specific binding reaction between an
analyte and a specific binding substance capable of
specifically binding to the analyte, the device comprising
a plurality of units, each of which comprises: an inlet for
introducing the sample; a space forming zone for temporarily
retaining the sample introduced from the inlet; and an outlet
for discharging the sample from the space forming zone to a
reaction field where a specific binding reaction of the sample
retained in the space forming zone is conducted.
Herein, the inlet may be provided separately to each
of the plurality of space forming zones. In this case, the
number of the space forming zones and the number of the inlets
are the same. It is further preferable that just one inlet is
provided to a plurality of space forming zones. In this case,
the sample is supplied to all of the space forming zones from
the single inlet.
It is further preferable that the specific binding
analysis device in accordance with the present invention has a
strip shape, and the aforesaid unit also has a strip shape.
In the present description, therefore, the specific binding
analysis device is sometimes referred to as a test strip. It
can further be said that in the test strip of the present
invention, at least two or more units are arranged, each
constituted by disposing therein a space forming zone, a
retention zone where a labeled first specific binding
substance is retained, and a detection zone where a second
specific binding substance is immobilized.
It is preferable here that the inlets, the space
forming zones and the outlets, in the respective units forming
the reaction fields where the specific binding reaction is
conducted, are mutually separate and independent between the
units. Especially when the reaction field is constituted by a
developing layer, it is preferable that each of the developing
layers is physically separate from one another. For example,
provision of a gap or a wall between the developing layers is
preferred. Thereby it becomes possible to simultaneously
conduct a plurality of specific binding reactions. This also
allows free adjustment of the number of the reaction
measurements.
Moreover, the specific binding analysis device of
the present invention is characterized in that a content of
the space forming zone is different in each of the different
units. It is preferable here that the content is set up in
line with purposes. This enables adjustment of an introduced
amount, a flow rate, and the like, of the sample in line with
purposes, and even in the case of introducing the same sample,
specific binding reactions under different conditions can be
simultaneously observed.
For example, the adjustment of the content of the
space forming zone makes adjustment of a dilution ratio
possible. With this dilution ratio utilized, a prozone
phenomenon which has been a problem with the conventional
specific binding analysis methods can be avoided or
confirmed. That is, in the present invention, previous
adjustment of the content of a plurality of space forming
zones enables the sample to be automatically diluted in
phases so that a specific binding analysis reaction can be
conducted at an analyte concentration not influenced by the
prozone phenomenon. Further, it is possible to confirm
whether there exists the range of a concentration at which
the prozone phenomenon is occurring by observation and
comparison of the results of the specific binding reactions
of the sample having been diluted in phases.
Since the space forming zone temporarily retains
the sample, the adjustment of the content of the space
forming zone allows adjustment of the amount of the sample
to be introduced. In the present invention, therefore, it
is possible to accurately and automatically collect and
introduce a certain amount of the sample into the specific
binding analysis device without the need for using such
quantitative-collecting device as a dispenser or a syringe
to collect a sample and introduce it into the specific
binding analysis device. It is thus possible to
qualitatively or quantitatively analyze the analyte in the
sample in a simple and accurate manner, without requiring
an advanced device or operation.
Further, the specific binding analysis device of
the present invention is characterized in that a standard
sample is introduced into the space forming zone. The
examples of the standard sample may include a standard
substance for determination of a calibration curve to be
used by the analysis device and a standard substance for
quality assurance of the analysis device. The quality of the
analysis device is assured by means of response of the
analysis device itself, a reaction characteristic of a regent
to be used in the analysis device, or the like.
As for a specific binding analysis method aiming at
a quantitative analysis widely used has been a method of
conducting a specific binding reaction which uses an analyte
and a specific binding substance capable of specifically
binding to the analyte, and also using a calibration curve for
concentration conversion, which is created by previously
conducting the specific binding reaction using a standard
substance during preparation of the analysis device, to
determine the concentration of the analyte.
In effect, however, a plurality of calibration
curves are prepared during preparation of the analysis device
for the reasons of differences between each of the lots of the
analysis devices, changes in performance thereof during
storage, and the like. This necessitates preparation of an
analysis device for determination of a calibration curve, as
well as a standard substance for determination of a
calibration curve, to be used in each of the lots so that a
calibration curve for concentration conversion to be applied
to each of the analysis devices can be determined.
In the present invention, it is possible to confirm
as to whether the analysis device is in a state capable of
being provided the quality assurance, by automatically
creating a dilution system by the use of a standard substance
with a known concentration conducting a specific binding
reaction, and then comparing prepared reaction curves, for
example. In the present invention, determination of the
calibration curve and the quality assurance become possible by
conducting the specific binding reaction using the standard
substance as the standard sample, and then measuring the
response of the analysis device, the reaction characteristic
of the reagent or the like.
The analyte in the present invention may be any one
so long as a specific binding substance capable of
specifically binding thereto exists, and the examples may
include various proteins, which can function as an antibody or
antigen, polypeptides, glycoproteins, polysaccharides, complex
glycolipids, nucleic acids, effector molecules, receptor
molecules, enzymes and inhibitors. More specific examples may
include: tumor markers such as α-fetoprotein, carcinoembryonic
antigen (CEA), CA 125 and CA 19-9; various proteins,
glycoproteins or complex glycolipids such as β2-microglobulin
(β2m) and ferritin; various hormones such as estradiol (E2),
estriol (E3), human chorionic gonadotropin (hCG), luteinizing
hormone (LH) and human placental lactogen (hPL); various
virus-associated antigens or virus-associated antibodies such
as HBs antigen, HBs antibody, HBc antigen, HBc antibody, HCV
antibody and HIV antibody; various allergens and IgE
antibodies thereto; narcotic drugs, medical drugs and
metabolites thereof; and virus-associated and tumor-associated
nucleic acids having a polynucleotide sequence.
The sample in the present invention may be a liquid
suspected of containing an analyte, and the examples may
include urine, blood serum, blood plasma, whole blood, saliva,
lacrimal fluid, spinal fluid and secretion from papillae;
however, the sample may also be one prepared by suspending or
dissolving a solid substance, a gel substance or sol substance
of mucus, human body tissue, cell or the like, in a liquid
such as a buffer solution, an excessct solution or a dissolved
solution.
The specific binding substance in the present
invention may be any substance capable of specifically binding
to the analytes, and the examples may include antibodies,
antigens, glycoproteins, polysaccharides, complex glycolipids,
nucleic acids, effector molecules, receptor molecules, enzymes
and inhibitors.
Further, in the specific binding analysis method
using the specific binding analysis device in accordance
with the present invention, in a step of causing a reaction
between an analyte and a specific binding substance capable
of specifically binding to the analyte, it is preferable
that a first specific binding substance labeled with a
labeling material and a second specific binding substance are
employed and the labeled first specific binding substance and
the second specific binding substance are bound to one another,
via the analyte.
The specific binding analysis method using the
specific binding analysis device in the present invention
is characterized in that the analyte in the sample is
qualitatively or quantitatively analyzed by adjusting an
amount of a solution containing the first specific binding
substance labeled with the labeling material. The
adjustment of the amount of the solution containing the
specific binding substance labeled with the labeling
material enables dilution of the sample in the step of
causing the reaction between the analyte and the specific
binding substance capable of specifically binding to the
analyte, and utilization of a dilution ratio thus obtained
enables avoidance and confirmation of the prozone
phenomenon which has been a problem with the conventional
specific binding analysis methods.
In the present invention, it is also possible to
qualitatively or quantitatively analyze the analyte in the
sample by adjusting the characteristic of the labeling
material in each of the reaction fields where the specific
binding reaction is conducted. The characteristic of the
labeling material for example is a particle size or a
material of the labeling material. With the characteristic
of the labeling material changed, the kind as well as an
intensity of a signal that can be read out from the
labeling material also change. It is thus possible to
chose a reaction field capable of sending an appropriate
signal for analysis of the analyte concentration in the
sample, whereby the prozone phenomenon which has been a
problem with the conventional specific binding analysis
methods can be avoided or confirmed, without diluting the
sample. Further, adjustment of an amount of the first
specific binding substance labeled with the labeling
material in each of the reaction fields where the specific
binding reaction is conducted, by utilizing the
characteristic of the labeling material, makes it possible
to adjust a component ratio between the analyte and the
specific binding substance which are capable of
participating in the specific binding reaction, whereby the
specific binding reaction can be observed under conditions
where no prozone phenomenon occurs, without diluting the
sample. In this manner, the prozone phenomenon which has
been a problem with the conventional specific binding
analysis methods can be avoided or confirmed.
In the present invention, the analyte in the
sample may be qualitatively or quantitatively analyzed by
adjusting the first specific binding substance labeled with
the labeling material and/or the second specific binding
substance in each of the reaction fields where the specific
binding reaction is conducted. Disposition of specific
binding substances capable of specifically binding to
different analytes in the respective reaction fields where
the specific binding reaction is conducted makes it
possible to adjust an analyte to be detected in each of the
reaction fields where the specific binding reaction is
conducted. Even in a case where a plurality of analytes
are present in the sample, therefore, disposition of a
specific binding substance capable of specifically binding
to a certain analyte in line with a purpose in each of the
reaction fields where the specific binding reaction is
conducted makes it possible to simultaneously detect a
plurality of analytes and also to correspond to the multi-item
measurement which has been required in the clinical
field.
In the specific binding analysis device in the
present invention, the solution containing the first
specific binding substance labeled with the labeling
material may be sealed into the space forming zone.
Thereby, if the sample is introduced from the inlet, the
specific binding reaction between the analyte in the sample
and the first specific binding substance labeled with the
labeling material can be conducted while the sample is
retained in the space forming zone. Further, adjustment of
an amount of the solution containing the first specific
binding substance labeled with the labeling material to be
sealed into the space forming zone enables automatic
dilution of the sample in phases so that the prozone
phenomenon which has been a problem with the conventional
specific binding analysis method can be avoided or
confirmed.
It is to be noted that in the specific binding
analysis device in the present invention, when the contents
of the respective space forming zones are equal, the first
specific binding substance labeled with the labeling
material may not be sealed in the space forming zone. For
example, when the amount of the first specific binding
substance labeled with the labeling material is adjusted in
each of the reaction fields where the specific binding
reaction is conducted, it becomes possible to adjust the
component ratio between the analyte and the specific
binding substance which are capable of participating in the
specific binding reaction in each of the reaction fields
where the specific binding reaction is conducted so that
the specific binding reaction can be observed under
conditions where no prozone phenomenon occurs, without
diluting the sample, and the prozone phenomenon which has
been a problem with the conventional specific binding
analysis methods can be avoided or confirmed.
In addition, disposition of first specific
binding substances labeled with the labeling material,
having different affinities in the respective reaction
fields where the specific binding reaction is conducted,
makes the specific binding reaction between the analyte and
the specific binding substance controllable, by utilizing
the affinity difference, in each of the reaction fields
where the specific binding reaction is conducted so that
the specific binding reaction can be observed under
conditions where no prozone phenomenon occurs, without
diluting the sample, and the prozone phenomenon which has
been a problem with the conventional specific binding
analysis methods can be avoided or confirmed.
Further, disposition of specific binding
substances, which are capable of specifically binding to
the same analyte but have different characteristics, in the
respective reaction fields where the specific binding
reaction is conducted, renders the specific binding
reaction between the analyte and the specific binding
substance controllable, by utilizing the characteristic
difference, in each of the reaction fields where the
specific binding reaction is conducted. For example, when
specific binding substances with different affinities are
disposed, the specific binding reaction between the analyte
and the specific binding substance can be controlled by
utilizing the affinity difference in each of the reaction
fields where the specific binding reaction is conducted,
and thus the specific binding reaction can be observed
under conditions where no prozone phenomenon occurs,
without diluting the sample. That is, the prozone
phenomenon which has been a problem with the conventional
specific binding analysis methods can be avoided or
confirmed. It should be noted that the specific binding
reaction can be controlled simply by replacement of the
first specific binding substance with the second specific
binding substance in the combination thereof.
Moreover, in the specific binding analysis device
of the present invention, it is preferable that the unit
comprises a detection zone for detecting a signal obtained
attributed to the specific binding reaction and the second
specific binding substance is substantially immobilized in
the detection zone. Herein, the second specific binding
substance is immobilized in the detection zone so as not to
move freely even when the developing layer constituting the
reaction field is in a wet state. In such a manner, an
unreacted substance is washed off along with the sample
flow, thereby enabling detection of the signal attributed
to the specific binding reaction in the detection zone
without conducting an operation of separating the unreacted
substance. It is to be noted that the device of the
present invention may comprise a plurality of detection
zones.
The developing layer in the present invention is
the reaction field where the analyte in the sample and the
first specific binding substance labeled with the labeling
material develop. The examples thereof may include a
porous carrier and a gel carrier. Among them,
nitrocellulose is most preferable. This material is superior
to other developing layer materials such as paper because it
is inherently capable of binding to protein without previous
sensitization. When directly applied to nitrocellulose, a
specific binding substance such as an antibody can be reliably
immobilized, without requiring any chemical treatment that may
suppress the specific binding capability of the specific
binding substance. When paper is used as the developing layer
material, for example, the immobilization of the antibody
necessitates a chemical binding using CNBr,
carbonyldiimidazole, tressil chloride or the like.
Furthermore, nitrocellulose is available in various
pore sizes so that the developing layer material can be
readily selected according to conditions such as a flow rate
of the sample. It is desirable that strength of a
nitrocellulose sheet, when handled, is improved by attaching a
plastic sheet or the like onto the back of the sheet. This
can be readily made by forming a thin film of nitrocellulose
on a reinforcing material sheet.
After the antibody is immobilized in the detection
zone, a portion, other than the portion in which the antibody
is immobilized, is preferably blocked to reduce non-specific
absorption to the developing layer. The blocking may be
achieved by application of protein (e.g., bovine serum albumin
and milk protein), polyvinylalcohol or ethanolamine, or a
combination thereof.
The space forming zone in the present invention
may be one capable of forming a space for temporality
retaining the sample, and further, it serves to accurately
and automatically collect and introduce a certain amount of
the sample, depending on the volume thereof, into the
specific binding analysis device and also serves as an
anti-pollution protective material when the device is
handled after the introduction of the sample. For example,
it can be constituted using a synthetic resin material such
as ABS, polystyrene or poly vinyl chloride, or a solution-impermeable
material such as metal or glass.
In the present invention, the inlet is one for
introducing the sample and the outlet is one for
discharging the sample retained in the space forming zone
to the reaction field where the specific binding reaction
is conducted. It is preferable here that the rate of
introducing the sample from the inlet into the space
forming zone is sufficiently faster than the rate of
discharging the sample from the outlet to the reaction
field where the specific binding reaction is conducted.
Thereby, the sample brought into contact with the inlet
flows into the space forming zone due to capillarity
phenomenon, and the amount thereof to be introduced becomes
substantially equivalent to the content of the space forming
zone. It is therefore possible to accurately and
automatically collect and introduce a certain amount of the
sample into the specific binding analysis device. Further,
temporary retention of the sample in the space forming zone
after the sample flows in becomes possible so that, even in
the case of sealing a reagent into the space forming zone, the
time taken for the reaction between the sample and the reagent
can be secured.
The signal in the present invention may be one which
is generated by a reaction contributed to by the labeling
material and can be detected, and the examples may include
fluorescence measurable with a fluorescent photometer,
luminescence measurable with a luminescent photometer and
exhibited color measurable by visual determination and a
color-difference meter. In this case, an intensity of
reflected light, an intensity of fluorescence or
luminescence generated in the detection zone, or the like,
is detected in the detection zone.
In one of the embodiments of the present
invention, a sample is introduced into a test strip
connected to a signal intensity measurement device, or a
test strip with a sample introduced therein is connected to
the signal intensity measurement device, and then the
degree of modulation of a signal in a detection zone is
measured by naked-eye visual observation or with a suitable
external measurement device according to the property of
the signal. Between the aforesaid measurements more
preferred is one where the test strip is connected to the
signal intensity measurement device and the sample is then
introduced into the test strip to detect the signal.
In one of the embodiments of the present
invention, it is preferable that signals attributed to a
plurality of specific binding reactions, sent from the
respective reaction fields where the specific binding
reaction is conducted, are distinguished due to the
respective reaction fields where the specific binding
reaction is conducted and successively read out so that the
analyte in the sample is qualitatively or quantitatively
analyzed. This operation makes it possible to reduce the
time required for the step of reading out the signal even
when a plurality of specific binding reactions are
conducted, and to correspond to clinical examination
devices as well as sensors for the domestic use which
require rapid determination of results.
It is also preferable that the reaction field
where the specific binding reaction is conducted and/or a
device for reading out a signal move in a certain direction
so that signals sent from the respective reaction fields
where the specific binding reaction is conducted are
successively read out. For example, in the case of using a
strip where a plurality of detection zones, capable of
reading out a signal, are arranged in parallel, scanning of
the signal intensity measurement device in the direction
along the detection zones allows successive measurement of
signals obtained from a plurality of specific binding
reactions. Even in a case where, reversely, the signal
intensity measurement device is immobilized while the strip
is scanned, a similar effect can be expected to be obtained.
This operation can simplify the device required for the
signal intensity measurement and can also make the device
smaller and less expensive.
Moreover, when the specific binding analysis
device of the present invention is used, a step of
recognizing the introduction of the sample from the inlet
is preferably performed. For example employed is a start-of-measurement
detector, or the like, for detecting the
introduction of the sample and the start of the measurement
by using a difference between a conductivity of the
developing layer in a dry state before the sample
introduction and a conductivity of the developing layer in
a wet state changed from the dry state due to the sample
introduction. It is preferable to start measuring the
measurement time on the basis of the time at which the
introduction of the sample from the inlet is recognized.
This operation enables accurate control of the detection
time of signal, i.e., the time elapsed between the sample
introduction and the signal intensity measurement, and also
enables reduction in error caused by measurement
manipulation.
It is further preferable that the labeled first
specific binding substance is contained in the developing
layer. In such a manner, the sample introduced into the
test strip reacts with the labeled first specific binding
substance when developing along the developing layer so
that a step of causing a reaction between the sample and
the labeled first specific binding substance can be
simplified.
It is further preferable that the labeled first
specific binding substance is in a dry state. Herewith,
when the developing layer is in the dry state, the labeled
first specific binding substance is retained in the
retention zone on the developing layer; when the developing
layer gets wet caused by the sample introduction or the
like, the labeled first specific binding substance can
freely move within the developing layer. The developing
layer material is made band-shaped or sheet-shaped, and the
reagent is applied onto spatially separate regions on the
developing layer and is made to infiltrate from the side or
the end of the sheet or the band to the other side at the
time of the sample introduction.
It should be noted that the sample may be
introduced into the strip after being previously reacted
with the labeled first specific binding substance in the
outside of the strip. In such a case, the labeled first
specific binding substance may not be contained in the
developing layer or the space forming zone.
The first specific binding substance and the
second specific binding substance in the present invention
may be substances which are capable of specifically binding
to analytes, and the examples thereof may include
antibodies, antigens, glycoproteins, polysaccharides, complex
glycolipids, nucleic acids, effector molecules, receptor
molecules, enzymes and inhibitors.
Among them, at least either the first specific
binding substance or the second specific binding substance is
preferably an antibody, and more preferably a monoclonal
antibody, from the viewpoint of high specificity. It is
further preferable that the first specific binding substance
and the second specific binding substance have specificities
against different epitopes of the analyte. When the analyte
has a plurality of same epitopes, the same specific binding
substances may be used.
The labeling material in the present invention may
be an arbitrary substance whose presence can be readily
detected. The preferable one is a direct label, namely a
material visible with the naked eye in a natural state, or
readily visible with the use of an optical filter and/or by
the use of a method of promoting fluorescence by adding a
stimulation such as an ultraviolet ray or the like. Since the
direct label is capable of generating a signal which is
detectable, without addition of another reagent, analysis
results can be obtained in a moment of time, and further, the
direct label can be readily used in an analysis device stored
in a dry state because of the strong and stable properties
thereof.
As the direct label particularly preferred are
fine colored particles such as dye sols, metal sols, particles
containing a fluorescent substance and colored latex particles.
Employment of such particles enables concentration of the
label in a small area or volume, which forms a region thickly
colored to generate a signal which is readily detectable.
Among them most preferred are colloidal gold particles. This
evaluation of a signal can be conducted by visual
estimation or, if required, by using apparatus.
In the meantime, indirect labels such as enzymes
like alkaline phsphotase, horseradish peroxidase, etc. can
be employed. Reasonably, however, the indirect label is
inferior to the direct label in terms of simplicity since
detection of a visible signal usually requires addition of
one or more development reagents such as a substrate. In
such a case of adding the development reagent, the reagent
may be contained in a porous development layer material so
as to dissolve or disperse in the sample. Another method
available may be to mix the sample with the development
reagent beforehand, and then introduce the resulting
mixture into the test strip after occurrence of the
specific binding reaction.
It is to be noted that the labeling material and
the specific binding substance can be bound to one another
by covalent bonding or hydrophobic bonding, as
circumstances demand.
In the test strip used in a preferable embodiment
of the specific binding analysis device of the present
invention, when the analyte is present in the sample, a
sandwich reaction occurs that the labeled first specific
binding substance and the second specific binding substance
immobilized in the detection zone are bound to one another
via the analyte, and in the detection zone, the labeled
first specific binding substance is bound. An intensity of
a signal from the labeled first specific binding substance
as thus bound in the detection zone is measured, and then
the analyte in the sample is qualitatively or
quantitatively analyzed based on the measured signal
intensity.
Herein, the labeled first specific binding
substance may move as the sample flows toward the detection
zone, and it is preferable that the sample keeps flowing
even after passing through the detection zone. For this
purpose, a sufficient amount of the sample is introduced
into the test strip so that an excess of the labeled first
specific binding substance, which is not capable of
participating in the specific binding reaction in the
detection zone, is washed off from the detection zone by
the sample flow through the detection zone. An absorption
zone may be provided at the end of the developing layer
material. The material for the absorption zone may be any
material having enough an absorptive property to wash off
an unbound composition out of the detection zone, which may
be exemplified by the glass fiber filter paper GA-200
(manufactured by TOYO KABUSHIKI KAISHA).
It is further preferable that the product of a
signal intensity and a dilution magnification is used to
qualitatively or quantitatively analyze the analyte in the
sample. In the present invention, the corresponding
relationship between the analyte concentration and the signal
intensity with regard to a standard substance with a known
concentration is previously assayed to create a calibration
curve and, for example, from a signal intensity, measured in
terms of a sample to be detected which has been automatically
diluted to have an analyte concentration not influenced by the
prozone phenomenon, the analyte concentration contained in the
sample to be detected can be determined by the use of the
calibration curve. In such a case, the product of the
dilution ratio and the analyte concentration obtained using
the calibration curve is the analyte concentration in the
sample.
Further, the specific binding analysis method using
the specific binding analysis device of the present invention
is characterized in that the analyte in the sample is
qualitatively or quantitatively analyzed by analyzing a signal
intensity of a reaction field where the specific binding
reaction is conducted to show a signal intensity not higher
than a certain threshold. It is preferable here that the
threshold is less than the signal intensity shown by the
analyte with such a concentration as causing no prozone
phenomenon. Herewith, it is possible to qualitatively or
quantitatively analyze the analyte while avoiding the prozone
phenomenon.
It is further preferable that the analyte in the
sample is qualitatively or quantitatively analyzed by
analyzing a signal intensity of a reaction field where the
specific binding reaction is conducted to show the largest
signal intensity among the reaction fields where the specific
binding reaction is conducted to show signal intensities not
higher than a certain threshold. In the present invention,
with regard to a standard substance with a known concentration,
the corresponding relationship between the analyte
concentration and the signal intensity in the detection zone
is previously assayed to create a calibration curve. When the
analyte is quantitatively analyzed using the calibration curve,
a quantitative property is improved by using a calibration
curve having a large inclination, namely a large value given
by dividing the signal intensity by the concentration, in the
straight line region where the prozone phenomenon is not
occurring.
Further, in the specific binding analysis method
using the specific binding analysis device of the present
invention, the analyte is qualitatively or quantitatively
analyzed by comparing signal intensities of a plurality of
reaction fields where the specific binding reaction is
conducted; when comparing the straight line regions of the
calibration curves among the reaction fields where the
specific binding reaction is conducted to show signal
intensities not higher than a certain threshold, a larger
signal intensity is observed on a more-steeply-inclined
calibration curve. Hence it becomes possible to qualitatively
or quantitatively analyze the analyte in the sample in a more
accurate manner by analyzing the signal intensity of the
reaction field where the specific binding reaction is
conducted to show the largest signal intensity among the
reaction fields where the specific binding reaction is
conducted to show signal intensities not higher than a
predetermined threshold.
Moreover, the present invention is characterized in
that, when the analyte in the sample is qualitatively or
quantitatively analyzed, referring to the corresponding curves
of the analyte concentration and the signal intensity of the
reaction field where the specific binding reaction is
conducted to show the largest signal intensity among the
reaction fields where the specific binding reaction is
conducted to show signal intensities not higher than the
threshold, in a case where there exist a plurality of analyte
concentrations corresponding to the signal intensity of the
reaction field where the specific binding reaction is
conducted to show the largest signal intensity among the
reaction fields where the specific binding reaction is
conducted to show signal intensities not higher than the
threshold, the smallest concentration is considered as the
analyte concentration. Further, the threshold is less than
the minimum value of a signal intensity at an intersection
which is generated when overlapping the corresponding curves
of the analyte concentration and the signal intensity of the
respective reaction fields where the specific binding reaction
is conducted, and is also less than the minimum signal
intensity among the maximum values of the signal intensities
of the respective corresponding curves.
In the present invention, with regard to a standard
substance with a known concentration, the corresponding
relationship between the analyte concentration and the signal
intensity in the detection zone is previously assayed to
create a calibration curve.
In the specific binding analysis method using the
specific binding analysis device of the present invention, the
analyte is qualitatively or quantitatively analyzed by
comparing signal intensities of a plurality of reaction fields
where the specific binding reaction is conducted; when
overlapping calibration curves of the respective reaction
fields where the specific binding reaction is conducted, the
possibility may arise where an intersection is generated
between the calibration curves, if creation of a calibration
curve accompanied by the assay where prozone phenomenon is
present. A value less than the minimum values of signal
intensities of these intersections and also less than the
minimum signal intensity among the maximum values of the
signal intensities of the respective calibration curves is set
up as a threshold, reaction fields where the specific binding
reaction is conducted to show signal intensities not higher
than the threshold are selected, a reaction field to show the
maximum signal intensity is selected by comparing the signal
intensities among those reaction fields, and then the signal
intensity of the selected reaction field is analyzed, to
qualitatively or quantitatively analyze the analyte in the
sample.
In the present invention, since the analyte in the
sample is qualitatively or quantitatively analyzed by the use
of corresponding curves of a plurality of reaction fields
where the specific binding reaction is conducted, the range of
the qualitative or quantitative analysis is extended as
compared to that in the conventional specific binding analysis
method using a single corresponding curve. When the analyte
concentration in the sample is less than the minimum value of
an analyte concentration at an intersection generated when
overlapping the calibration curves of the respective reaction
fields where the specific binding reaction is conducted, as
comparing signal intensities of reaction fields, where the
sample is introduced and the specific binding reaction is
conducted, the analyte in the sample shows a larger signal
intensity in a reaction field whose calibration curve is more
steeply inclined in the straight line region, where the
prozone phenomenon is not occurring. Therefore, when the
magnitude relationship among the signal intensities and the
inclinations of the calibration curves in the straight line
region where the prozone phenomenon is not occurring, in each
of the reaction fields where the specific binding reaction is
conducted, is in the aforesaid state, in a case where there
exist a plurality of analyte concentrations corresponding to a
signal intensity of the reaction field selected as the
reaction field for qualitatively or quantitatively analyzing
the analyte in the sample, the smallest concentration among
the corresponding concentrations is the analyte concentration
in the sample.
On the other hand, when the analyte concentration in
the sample is not less than the minimum value of the analyte
concentration at the intersection generated when overlapping
the calibration curves of the respective reaction fields where
the specific binding reaction is conducted, the magnitude
relationship among the signal intensities shown by the analyte
in the sample in the reaction fields, where the sample is
introduced and the specific binding reaction is conducted, do
not correspond to the magnitude relationship among the
inclinations of the calibration curves in the straight line
regions where the prozone phenomenon is not occurring. The
signal intensity and the inclination of the calibration curve
in the straight line region where the prozone phenomenon is
not occurring is in such a state, the specific binding
analysis device in the present invention judges the analyte
concentration in the sample as being out of the scope of the
qualitatively or quantitatively analysis. In such a case, a
sample further diluted is employed or a specific binding
analysis device capable of corresponding to an analyte with a
high concentration is used, to qualitatively or quantitatively
analyze the analyte in the sample.
In the present invention, since it is possible to
qualitatively or quantitatively analyze the analyte in the
sample in a case where the analyte concentration is less than
the minimum value of the analyte concentration at the
intersection generated when overlapping the calibration curves
of the respective reaction fields where the specific binding
reaction is conducted, the range of qualitatively or
quantitatively analyzing the analyte is extended by preparing
a device with a large minimum value of the analyte
concentration at this intersection. Further, in the case of
using an analyte where it matters whether or not the analyte
is not less than a normal value in a certain range, such as
some kind of clinical marker, it is clinically useful to set
up a value adjacent to the normal value as a threshold since
it can be a criterion of decision as to whether or not an
abnormal value is shown.
When an intersection is not generated between
calibration curves, the analyte is qualitatively or
quantitatively analyzed by analyzing a signal intensity of a
reaction field whose calibration curve in the straight line
region is most steeply inclined among reaction fields where
the specific binding reaction is conducted to show signal
intensities not higher than a certain threshold. The
threshold in this case is less than the maximum value of the
signal intensity whose calibration curve in the straight line
region, where the prozone phenomenon is not occurring, is most
steeply inclined among calibration curves of reaction fields
where the specific binding reaction is conducted.
As thus described, it is possible to qualitatively
or quantitatively analyze the analyte in the sample, using the
present invention, without being influenced by the prozone
phenomenon which has been a problem with the conventional
specific binding reaction analysis, by comparing the magnitude
relationship among the signal intensities of the respective
reaction fields where the specific binding reaction is
conducted and the magnitude relationship among the
inclinations of the calibration curves in the straight line
regions where the prozone phenomenon is not occurring, and
comparing the signal intensities of the respective reaction
fields where the specific binding reaction is conducted to
show signal intensities not higher than a threshold, set up by
utilizing the present invention, and to select the reaction
field to show the maximum signal intensity, which is used for
analysis.
Embodiments of the present invention are
specifically described here by reference to the drawings.
However, the present invention is not limited thereto.
FIG. 1 is a schematic oblique view of a single
unit constituting a test strip as a specific binding
analysis device in accordance with the present embodiment,
and FIG. 2 is a schematic oblique view of a test strip in
accordance with the present invention in which a plurality
of units, shown in FIG. 1, are linked to one another.
Further, FIG. 3 is a schematic sectional view showing a
structure of an analysis device and a test strip of the
present invention.
As a representative example described is a case
where hCG is used as an analyte. A monoclonal antibody to
hCG, which is capable of participating in a sandwich
reaction with hCG, is used as a first specific binding
substance and a second specific binding substance. And
colloidal gold is used as a labeling material (direct
label).
As shown in FIG. 3, the strip is constituted by a
developing layer 1 on which a space forming zone 2 with an
equivalent content is disposed. Further, on the developing
layer 1, the anti-hCG monoclonal antibody as the first
specific binding substance is retained in a retention zone
5 in the state of being labeled with colloidal gold, and
the anti-hCG monoclonal antibody as the second specific
binding substance is immobilized in a detection zone 6; on
the upper face of the developing layer 1, a first electrode
11 and a second electrode 12 are disposed. Further, an
analysis device is constituted by a light source 7, a light
detector 8, an analyzer 9 and a start-of-measurement
detector 10 as a means to recognize introduction of a
sample into the strip.
The detection zone 6 is irradiated with light
having a prescribed wavelength (e.g. 520 nm) from the light
source 7, and the reflected light is detected with the
light detector 8 and then analyzed with the analyzer 9, to
measure an absorption in the detection zone 6. As the
measurement wavelength selected may be one suitable for the
sample or exhibition of color of the labeling material in
the detection zone 6.
A sample containing hCG is introduced into the
test strip. When the sample is brought into contact with
an inlet 3, a certain amount of the sample flows into the
space forming zone 2 due to capillarity phenomenon. With the
introduction of the sample, the developing layer 1 in a dry
state changes to be in a wet state, and a conductivity of the
developing layer 1 thus changes. Using the first electrode 11
and the second electrode 12, the conductivity of the
developing layer 1 in a dry state is previously measured prior
to the sample introduction and then the conductivity is
monitored during the sample introduction so that the start-of-measurement
detector 10 can detect the sample introduction
from the change in conductivity of the developing layer 1.
Once the sample introduction is detected, the information on
this detection is sent from the start-of-measurement detector
10 to the analyzer 9, which starts calculation of the
measurement time on the assumption that the time at which the
sample introduction is detected is zero.
The analyzer 9 has the function of controlling the
light source 7 and the light detector 8 so as to automatically
measure the absorption in the detection zone 6 at a previously
predetermined time. The sample temporarily retained in the
space forming zone 2 is discharged out of an outlet 4,
develops along the developing layer 1 and arrives at the
retention zone 5, where hCG in the sample and the anti-hCG
monoclonal antibody bound to colloidal gold form a labeled
antigen-antibody complexes. Subsequently, upon arrival of the
sample at the detection zone 6, the labeled antigen-antibody
complexes are bound to the immobilized anti-hCG monoclonal
antibody so that the labeled anti-hCG monoclonal antibody is
trapped in the detection zone 6 to exhibit color.
The absorption of the labeling material in the
detection zone 6 reflects an amount of hCG in the sample. In
the analysis example of the present invention, a sampling
inspection is previously conducted at the time of preparation
of the analysis devices where the absorptions in the detection
zones 6 are measured using a standard substance, and further,
with the use of the analysis device from the same lot, the
absorptions in the detection zone 6 measured with respect to
the respective hCG concentrations are plotted to give a
calibration curve. Herewith, a plurality of calibration
curves for concentration conversion are prepared during
preparation of the analysis devices, and then, when using the
analysis devices, measurements are conducted using the
standard sample, and from the absorption in the detection zone
6 shown by the standard sample, a calibration curve for
concentration conversion to be applied to each of the analysis
devices is determined. With this calibration curve utilized,
the hCG concentration in the sample introduced to the
developing layer 1 can be calculated from the absorption in
the detection zone 6.
Herein, FIG. 19 shows a schematic oblique view of
a strip (a specific binding analysis device) in accordance
with the present invention, comprising a single inlet. In
the present invention, as shown in FIG. 19, the strip may
be constituted by a plurality of units and just a single
inlet. In the strip shown in FIG. 2, the sample needs to
be introduced separately into each inlet of a plurality of
units; however, in the strip shown in FIG. 19, the sample
can be introduced into each of the units only by one-time
introduction of the sample into one inlet(3a) due to
capillary phenomenon. It should be noted that the
constituents shown by the reference numbers in FIG. 19 are
the same as those shown by the reference numbers in FIG. 1.
As the present embodiment described is a case
where the analyte is hCG, each of the first specific binding
substance and the second specific binding substance is the
monoclonal antibody to hCG, which is capable of participating
in a sandwich reaction with hCG, and colloidal gold is used
as the labeling material for direct labeling.
On the developing layer 1, the anti-hCG
monoclonal antibody as the first specific binding substance
is retained in a retention zone 5 in the state of being
labeled with colloidal gold, and the anti-hCG monoclonal
antibody as the second specific binding substance is
immobilized in a detection zone 6; on the upper face of the
developing layer 1, a first electrode 11 and a second
electrode 12 are disposed.
The strip is constituted by the developing layers
1, on which the space forming zones 2 are equal in volume
while the retention zones 5 are different in retained
amount of the anti-hCG monoclonal antibody, as the first
specific binding substance, labeled with colloidal gold.
The analysis device is constituted by a light source 7, a
light detector 8, an analyzer 9 and a start-of-measurement
detector 10 for recognizing introduction of a sample into
the test strip.
The detection zone 6 is irradiated with light
having a prescribed wavelength (e.g. 520 nm) from the light
source 7, and the reflected light is detected with the
light detector 8 and then analyzed with the analyzer 9, to
measure an absorption in the detection zone 6. As the
measurement wavelength selected may be one suitable for the
sample or exhibition of color of the labeling material in
the detection zone 6.
A sample containing hCG is introduced into the
test strip. When the sample is brought into contact with
an inlet 3, a certain amount of the sample flows into the
space forming zone 2 due to capillarity phenomenon. With the
introduction of the sample, the developing layer 1 in a dry
state changes to be in a wet state, and a conductivity of the
developing layer 1 thus changes. Using the first electrode 11
and the second electrode 12, the conductivity of the
developing layer 1 in a dry state is previously measured prior
to the sample introduction and then the conductivity is
monitored during the sample introduction so that the start-of-measurement
detector 10 can detect the sample introduction
from the change in conductivity of the developing layer 1.
Once the sample introduction is detected, the information on
this detection is sent from the start-of-measurement detector
10 to the analyzer 9, which starts calculation of the
measurement time on the assumption that the time at which the
sample introduction is detected is zero.
The analyzer 9 has the function of controlling the
light source 7 and the light detector 8 so as to automatically
measure the absorption in the detection zone 6 at a previously
predetermined time. The sample temporarily retained in the
space forming zone 2 is discharged out of the outlet 4,
develops along the developing layer 1 and arrives at the
retention zone 5, where hCG in the sample and the anti-hCG
monoclonal antibody bound to colloidal gold form a labeled
antigen-antibody complexes. Subsequently, upon arrival of the
sample at the detection zone 6, the labeled antigen-antibody
complexes are bound to the immobilized anti-hCG monoclonal
antibody so that the labeled anti-hCG monoclonal antibody is
trapped in the detection zone 6 to exhibit color.
The absorption of the labeling material in the
detection zone 6 reflects an amount of hCG in the sample. In
the analysis example of the present invention, an amount of
the sample introduced to each of the developing layers 1 is
equal since the space forming zone 2 on each of the developing
layers 1 is equal in volume; however, the absorption in each
of the detection zones 6 is different since an amount of the
anti-hCG monoclonal antibody, as the first specific binding
substance, labeled with colloidal gold, retained in each of
the retention zones 5 is different. Accordingly, the
introduction of the sample into the test strip allows
automatic, simultaneous observation of reactions between the
antigen and the antibody in different composition ratios.
In the present invention, it is possible to
automatically adjust the composition ratio of the analyte and
the specific binding substance which are capable of
participating in the specific binding reaction on each of the
developing layers 1, by previously adjusting the amount of the
anti-hCG monoclonal antibody, as the first specific binding
substance, labeled with colloidal gold, retained in the
detection zone 5 on each of the developing layers 1, and it is
also possible to calculate the hCG concentration in the sample
introduced into the test strip by observing and comparing the
results of the specific binding reactions between the analyte
and the specific binding substance in different composition
ratios, and by utilizing the calibration curve, from the
absorption of the labeling material in the detection zone 6 on
the developing layer 1 with the composition ratio not
influenced by the prozone phenomenon.
The present embodiment is described in detail by
reference to FIGS. 6, 7 and 3.
FIG. 6 is a schematic oblique view of a single
unit constituting a test strip as a specific binding
analysis device in accordance with the present embodiment,
and FIG. 7 is a schematic oblique view of a test strip in
accordance with the present invention in which a plurality
of units, shown in FIG. 6, are linked to one another. It
is to be noted that the structure of the specific binding
analysis device in accordance with the present embodiment
is the same as that shown in FIG. 3.
As the present embodiment described is a case
where the analyte is hCG, each of the first specific binding
substance and the second specific binding substance is the
monoclonal antibody to hCG, which is capable of participating
in a sandwich reaction with hCG, and colloidal gold is used
as the labeling material for direct labeling.
A solution of an anti-hCG monoclonal antibody, as
the first specific binding substance, labeled with
colloidal gold is sealed into the space forming zone 2
disposed on the developing layer 1, and the concentration,
as well as an amount, of the anti-hCG monoclonal antibody
solution to be sealed can be adjusted without restraint.
Further, the anti-hCG monoclonal antibody as the
second specific binding substance is immobilized in the
detection zone 6 on the developing layer 1, and the first
electrode 11 and the second electrode 12 are disposed on
the upper face of the developing layer 1. Further, the
analysis device is constituted by a light source 7, a light
detector 8, an analyzer 9 and a start-of-measurement
detector 10 as a means to recognize introduction of a
sample into the test strip. The detection zone 6 is
irradiated with light having a prescribed wavelength (e.g.
520 nm) from the light source 7, and the reflected light is
detected with the light detector 8 and then analyzed with
the analyzer 9, to measure an absorption in the detection
zone 6. As the measurement wavelength selected may be one
suitable for the sample or exhibition of color of the
labeling material in the detection zone 6.
The sample containing hCG is introduced into the
test strip for a test reagent. When brought into contact
with the inlet 3, the sample flows into the space forming
zone 2 due to capillarity phenomenon. With the introduction
of the sample, the developing layer 1 in a dry state changes
to be in a wet state, and a conductivity of the developing
layer 1 thus changes. Using the first electrode 11 and the
second electrode 12, a conductivity of the developing layer 1
in a dry state is previously measured prior to the sample
introduction and the conductivity is monitored during the
sample introduction so that the start-of-measurement detector
10 can detect the sample introduction from the change in
conductivity of the developing layer 1. Once the sample
introduction is detected, the information on this detection is
sent from the start-of-measurement detector 10 to the analyzer
9, which starts calculation of the measurement time on the
assumption that the time at which the sample introduction is
detected is zero.
The analyzer 9 has the function of controlling the
light source 7 and the light detector 8 so as to automatically
measure the absorption in the detection zone 6 at a previously
predetermined time. The sample having flown into the space
forming zone 2 comes into contact and then gets mixed with the
solution of the anti-hCG monoclonal antibody, as the first
specific binding substance, labeled with colloidal gold having
been sealed in the space forming zone 2 so that the anti-hCG
monoclonal antibody bound to colloidal gold and hCG in the
sample form a labeled antigen-antibody complexes. The sample
temporarily retained in the space forming zone 2 is discharged
out of the outlet 4, develops along the developing layer 1 and
arrives at the detection zone 6, where the labeled antigen-antibody
complexes are bound to the immobilized anti-hCG
monoclonal antibody, and thereby the labeled anti-hCG
monoclonal antibody is trapped in the detection zone 6 to
exhibit color.
The absorption of the labeling material in the
detection zone 6 reflects the amount of hCG in the sample. In
the analysis example of the present invention, a sampling
inspection is previously conducted at the time of preparation
of the analysis devices where the absorptions in the detection
zones 6 are measured using a standard substance, and further,
with the use of the analysis device from the same lot, the
absorptions in the detection zone 6 measured with respect to
the respective hCG concentrations are plotted to give a
calibration curve. Herewith, a plurality of calibration
curves for concentration conversion are prepared during
preparation of the analysis devices, and then, when using the
analysis devices, measurements are conducted using the
standard sample, and from the absorption in the detection zone
6 shown by the standard sample, a calibration curve for
concentration conversion to be applied to each of the analysis
devices is determined. With this calibration curve utilized,
the hCG concentration in the sample introduced to the
developing layer 1 can be calculated from the absorption in
the detection zone 6.
Subsequently, a sample containing hCG intended to be
quantitatively analyzed is introduced into a strip from the
same lot for a test reagent which comprises a plurality of
space forming zones 2. The total amount of the anti-hCG
monoclonal antibodies sealed in the respective space forming
zones 2 in the strip is constant, whereas the concentration as
well as the amount of the anti-hCG monoclonal antibody
solution sealed in each of the space forming zones 2 are
different. When brought into contact with the inlet 3, the
sample flows into the space forming zone 2 due to capillary
phenomenon; however, the amounts of the sample flowing in are
different among the respective space forming zones 2 because
of the difference in amount of the solution of the anti-hCG
monoclonal antibody, as the first specific binding substance,
labeled with colloidal gold, which is sealed in each of the
space forming zones 2. Since the total amount of the anti-hCG
monoclonal antibodies sealed in the respective space forming
zones 2 is constant, the introduction of the sample into the
test strip comprising a plurality of space forming zones 2
allows simultaneous observation of the specific binding
reactions of the automatically diluted sample.
In the present invention, it is possible to make the
sample automatically diluted in phases by previously adjusting
the amount of the solution sealed in the space forming zone 2,
and it is also possible to confirm as to whether there exists
the concentration range where the prozone phenomenon is
occurring, by observing and comparing the absorptions of the
sample, diluted in phases, in the detection zone 6. Further,
the hCG concentration in the sample introduced to the
developing layer 1 can be calculated from the absorption of
the sample, diluted to have a concentration not influenced by
the prozone phenomenon, in the detection zone 6, with the use
of the calibration curve. In such a case, the product of the
dilution ratio and the analyte concentration obtained using
the calibration curve is the analyte concentration in the
sample.
A strip for a test reagent in the present
embodiment is the same as in above Embodiment 2, except
that the strip is constituted by the developing layers 1
with different affinities of the anti-hCG monoclonal
antibodies as the second specific binding substances
immobilized in the respective detection zones 6.
When the sample containing hCG is introduced into
the strip, the absorption of the labeling material in the
detection zone 6 reflects the amount of hCG in the sample.
In the analysis example of the present invention, anti-hCG
monoclonal antibodies each having a different affinity are
prepared and immobilized in the detection zones 6 as the
second specific binding substance, whereby the absorption
in the detection zone 6 is different on each of the
developing layers 1. Accordingly, the introduction of the
sample into the test strip allows automatic and
simultaneous observation of the antigen-antibody reactions
having different signal intensities.
According to the present embodiment, it is
possible to adjust, on each of the developing layers 1, the
strength of the interaction between the analyte and the
specific binding substance which are capable of
participating in the specific binding reaction by
previously adjusting the affinity of the anti-hCG monoclonal
antibody as the second specific binding substance immobilized
in the detection zone 6 on each of the developing layers 1,
and it is also possible to calculate the hCG concentration
in the sample introduced into the test strip by observing and
comparing the results of the specific binding reactions with
different strengths of the interactions between the analyte
and the specific binding substance, and by utilizing the
calibration curve, from the absorption of the labeling
material in the detection zone 6 on the developing layer 1,
where the antibody having the affinity not influenced by the
prozone phenomenon is immobilized.
In the present embodiment, the same strip for a test
reagent as in above Embodiment 3 is used, except that
solutions of the anti-hCG monoclonal antibody, labeled with
colloidal gold with different particle sizes, are adjusted to
have a fixed absorption with a prescribed wavelength (e.g. 520
nm), which is then sealed in the same amount into each of the
space forming zones 2 to constitute the strip.
A sample containing hCG intended to be
quantitatively analyzed is introduced into a strip from the
same lot for a test reagent which comprises a plurality of
space forming zones 2. When colloidal gold as the labeling
material have different particle sizes, the number of the
labeling materials and the number of the antibodies, to be
sealed, are different among the respective space forming zones
2. When the sample is introduced into the strip, reactions
between the antigen and the antibody in different composition
ratios are observed on the respective developing layers 1 due
to steric hindrance which is caused by the particle size of
colloidal gold and the difference in number of the labeling
materials or the difference in number of the antibodies.
Accordingly, the introduction of the sample into the strip
comprising a plurality of space forming zones 2 allows
simultaneous observation of the specific binding reactions
with different signal intensities in the detection zones 6.
In the present embodiment, it is possible to
automatically adjust, on each of the developing layers 1,
the composition ratio of the analyte and the specific
binding substance which are capable of participating in the
specific binding reaction by utilizing the characteristic
of the labeling material, and it is also possible to
calculate the hCG concentration in the sample introduced into
the test strip by observing and comparing the results of the
specific binding reactions between the analyte and the
specific binding substance in different composition ratios,
and by utilizing the calibration curve, from the absorption of
the labeling material in the detection zone 6 on the
developing layer 1 with the composition ratio not influenced
by the prozone phenomenon.
In the present embodiment, the corresponding
relationship between the analyte concentration and the signal
intensity in the detection zone 6 is previously assayed by the
use of a standard substance with a known concentration, and
the characteristic of the labeling material is utilized to
adjust the concentration of the analyte, at which the prozone
phenomenon occurs, to be different on each of the developing
layers 1. It should be noted that the specific binding
substance solution to be sealed into each of the space forming
zones 2 is not necessarily in a fixed amount. Further, the
method to be used for adjusting the amount of the specific
binding substance solution is not limited to the method using
the absorptions. Moreover, the characteristic of the labeling
material is not limited to the particle size thereof, but
various characteristics of the labeling material can be
applied as necessary, according to each of labeling material
agents.
In the present embodiment, the sample containing hCG
is introduced into the strip to make the detection zone 6
exhibit color in the same manner as in Embodiment 3. The
light source 7 and the light detector 8 are then scanned in
the direction along the detection zone 6 so as to successively
measure the signal intensities in the detection zones 6. It
should be noted that the same effect can also be obtained by
immobilizing the light source 7 and the light detector 8 and
scanning the strip in a certain direction. Since the
developing layers 1 are disposed in parallel while providing a
gap between each of the layers, the signal intensities can be
distinguishd among the respective developing layers 1 when the
signal intensities are successively measured in a plurality of
detection zones 6.
FIG. 12 is a schematic diagram of a curve drawn
after analyzing the distribution status of the signal
intensity in the detection zone 6 in the direction of the
width of a developing layer 1. This curve was drawn after
irradiating the upper face of the developing layer 1 with
light from the light source 7 while scanning the developing
layer 1 or the light source 7 and the light detector 8, and
then analyzing, with the analyzer 9, reflected light
detected with the light detector 8. In the diagram of this
curve, the ordinate and the abscissa express the signal
intensity and position in the detection zone region,
respectively. It is to be noted that, in the present
embodiment, the strip, or the light source 7 and the light
detector 8, are scanned in the direction along the detection
zone 6 to successively measure the reflected light in the
detection zone 6 so that the signal intensity is obtained.
The measurement is conducted, considering the height "h" of
the curve as the signal intensity based on the specific
binding reaction. Herein, the area "S" of the curve can be
considered as the signal intensity based on the specific
binding reaction. The absorption of the labeling material in
the detection zone 6 reflects the amount of hCG in the sample.
In the analysis example of the present embodiment, a
sampling inspection is previously conducted at the time of
preparation of the analysis devices where the absorptions in
the detection zones 6 are measured using a standard substance,
and further, with the use of the analysis device from the same
lot, the absorptions in the detection zone 6 measured with
respect to the respective hCG concentrations are plotted to
give a calibration curve. Herewith, a plurality of
calibration curves for concentration conversion are prepared
during preparation of the analysis devices, and then, when
using the analysis devices, measurements are conducted using
the standard sample, and from the absorption in the detection
zone 6 shown by the standard sample, a calibration curve for
concentration conversion to be applied to each of the analysis
devices is determined. With this calibration curve utilized,
the hCG concentration in the sample introduced to the
developing layer 1 can be calculated from the absorption in
the detection zone 6.
In the present embodiment, the sample containing hCG
is introduced into the strip to make the detection zone 6
exhibit color in the same manner as in Embodiment 4. The
light source 7 and the light detector 8 are then scanned in
the direction along the detection zone 6 so as to successively
measure the signal intensity in the detection zone 6. It
should be noted that the same effect can also be obtained by
immobilizing the light source 7 and the light detector 8 and
scanning the strip in a certain direction. Since the
developing layers 1 are disposed in parallel while providing a
gap between each of the layers, the signal intensities can be
distinguishd among the respective developing layers 1 when the
signal intensities are successively measured in a plurality of
detection zones 6.
The absorption in the detection zone 6 reflects
the amount of the hCG in the sample. In the analysis
example of the present invention, anti-hCG monoclonal
antibodies each having a different affinity are prepared
and immobilized in the detection zones 6 as the second
specific binding substance, whereby the absorption in the
detection zone 6 is different on each of the developing
layers 1. Accordingly, the introduction of the sample into
the test strip allows automatic and simultaneous
observation of the antigen-antibody reactions having
different signal intensities.
In the present embodiment, it is possible to
adjust, on each of the developing layers 1, the strength of
the interaction between the analyte and the specific
binding substance which are capable of participating in the
specific binding reaction by previously adjusting the
affinity of the anti-hCG monoclonal antibody as the second
specific binding substance immobilized in the detection zone 6
on each of the developing layers 1, and it is also possible
to calculate the hCG concentration in the sample introduced
into the test strip by observing and comparing the results of
the specific binding reactions with different strengths of the
interactions between the analyte and the specific binding
substance, and by utilizing the calibration curve, from the
absorption of the labeling material in the detection zone 6 on
the developing layer 1, where the antibody having the affinity
not influenced by the prozone phenomenon is immobilized.
In the present embodiment, the corresponding
relationship between the analyte concentration and the signal
intensity in the detection zone 6 is previously assayed by the
use of a standard substance with a known concentration, and
the characteristic of the labeling material is utilized to
adjust the concentration of the analyte, at which the prozone
phenomenon occurs, to be different on each of the developing
layers 1. It should be noted that, in the embodiments of the
present invention, the case is described where the difference
in affinity of the monoclonal antibody is utilized as being
easy to control; however, the characteristic of the specific
binding substance is not limited to the affinity.
In the present embodiment, a sample containing hCG
intended to be quantitatively analyzed is introduced into a
strip for a test reagent which comprises a plurality of space
forming zones 2, in the same manner as in Embodiment 6.
Herein, solutions of the anti-hCG monoclonal antibody, labeled with colloidal gold with different particle sizes, are adjusted to have a fixed absorption with a prescribed wavelength (e.g. 520 nm), which is then sealed in the same amount into each of thespace forming zones 2 to constitute
the strip. Thereat, when colloidal gold, as the labeling
material, have different particle sizes, the number of the
labeling materials and the number of the antibodies, to be
sealed, are different among the respective space forming zones
2. When the sample is introduced into the strip, reactions
between the antigen and the antibody in different composition
ratios are observed on the respective developing layers 1 due
to steric hindrance which is caused by the particle size of
colloidal gold and the difference in number of the labeling
materials or the difference in number of the antibodies.
Accordingly, the introduction of the sample into the test
strip comprising a plurality of space forming zones 2 allows
simultaneous observation of the specific binding reactions
with different signal intensities in the detection zones 6.
Herein, solutions of the anti-hCG monoclonal antibody, labeled with colloidal gold with different particle sizes, are adjusted to have a fixed absorption with a prescribed wavelength (e.g. 520 nm), which is then sealed in the same amount into each of the
In the present embodiment, it is possible to
automatically adjust, on each of the developing layers 1,
the composition ratio of the analyte and the specific
binding substance which are capable of participating in the
specific binding reaction by utilizing the characteristic
of the labeling material, and it is also possible to
calculate the hCG concentration in the sample introduced into
the test strip by observing and comparing the results of the
specific binding reactions between the analyte and the
specific binding substance in different composition ratios,
and by utilizing the calibration curve, from the absorption of
the labeling material in the detection zone 6 on the
developing layer 1 with the composition ratio not influenced
by the prozone phenomenon.
In the present embodiment, the corresponding
relationship between the analyte concentration and the signal
intensity in the detection zone 6 is previously assayed by the
use of a standard substance with a known concentration, and
the characteristic of the labeling material is utilized to
adjust the concentration of the analyte, at which the prozone
phenomenon occurs, to be different on each of the developing
layers 1. It should be noted that the specific binding
substance solution to be sealed into each of the space forming
zones 2 is not necessarily in a fixed amount. Further, the
method to be used for adjusting the amount of the specific
binding substance solution is not limited to the method using
the absorptions. Moreover, the characteristic of the labeling
material is not limited to the particle size thereof, but
various characteristics of the labeling material can be
applied as necessary, according to each of labeling material
agents.
In the following, the present invention is described
more specifically by means of examples; however, the present
invention is not limited thereto.
The present example was performed in line with
aforesaid Embodiment 1 using the specific binding analysis
device in accordance with FIGS. 1 to 3. A strip comprising
five units shown in FIG. 2 was used. A monoclonal antibody
to hCG capable of participating in a sandwich reaction with
hCG was used as a first specific binding substance and a
second specific binding substance, and colloidal gold was
used as a labeling material to directly label the first
specific binding substance. Urine added with a known
amount of hCG was used as a sample, and when the detection
zone 6 was irradiated with light having a wavelength of 520
nm, a signal intensity obtained in the light detector 8 was
measured, to quantitatively measure the hCG concentration
in the sample. As the sample used was urine with an hCG
concentration of 50 IU/L, 100 IU/L, 250 IU/L, 500 IU/L or
1,000 IU/L. These samples were introduced from each inlet
3 of the five units.
Further, the introduction of the sample was
detected with the start-of-measurement detector 10 from the
change in conductivity of the developing layer 1, and the
measurement time was determined on the assumption that the
start-of-detection time was zero. The space forming zone 2
with a volume of 50 µl was used. After being brought into
contact with the inlet 3, the sample filled the space
forming zone 2 within five seconds, and finished developing
through the test strip in three minutes. Hence the rate of
introducing the sample was sufficiently faster than the
rate of discharging the sample. The volume of the space
forming zone 2 is not particularly limited and is set up
accordingly to the sample, analysis device or the like.
FIG. 4 is a graph of the signal intensities
measured in the detection zone 6 at 520 nm, five minutes
after the introduction of the sample into the test strip.
In terms of each of the hCG concentrations, the signal
intensity increases dependently on the concentration,
indicating that they are in the linear relationship.
Although not shown in the drawing, when a sample, with the
hCG concentration being substantially zero as indicated by
the detector, was introduced into the test strip, the
signal intensity in the detection zone 6 at 520 nm was zero.
In such a manner, the use of FIG. 4 as the calibration
curve allows measurement of the hCG concentration in the
sample with a favorable quantitative property.
The present example was performed in line with
aforesaid Embodiment 2 using the specific binding analysis
device in accordance with FIGS. 1 to 3. A test strip
comprising two units was used here. The monoclonal
antibody to hCG capable of participating in a sandwich
reaction with hCG was used as the first specific binding
substance and the second specific binding substance, and
colloidal gold was used as the labeling material to
directly label the first specific binding substance. Urine
added with a known amount of hCG was used as the sample,
and a signal intensity in the detection zone 6 at 520 nm
was measured. As the sample used was urine with an hCG
concentration of 100 IU/L, 500 IU/L, 1,000 IU/L, 1,500 IU/L,
2,000 IU/L or 2,500 IU/L.
Further, the introduction of the sample was
detected with the start-of-measurement detector 10 from the
change in conductivity of the developing layer 1, and the
measurement time was determined on the assumption that the
start-of-detection time was zero. The amount of the first
specific binding substance, directly labeled by the use of
colloidal gold, retained in the retention zone 5 in the
first unit was adjusted so as to be one tenth the amount
retained in the second unit. That is, five single units
are in a linked state in FIG. 2, whereas the strip with the
configuration of comprising two units (the first unit and
the second unit) linked to one another was used in the
present example. Namely, samples with the aforesaid six
kinds of hCG concentrations were introduced into both the
first unit and the second unit.
FIG. 5 is a graph showing the relationships
between the hCG concentrations and the signal intensities
in the detection zones 6 at 520 nm, measured five minutes
after detection of the sample introduction, in the first
unit and the second unit.
The signal intensity measured five minutes after
the detection of the sample introduction in the first unit
increases with an increase in hCG concentration when the
concentration is low (hCG concentration = 100 IU/L, 500
IU/L, 1,000 IU/L, 1,500 IU/L); however, on the contrary, it
decreases with an increase in hCG concentration when the
concentration is as high as not less than 2,000 IU/L,
whereby it is found that there may exist a plurality of hCG
concentrations which correspond to one signal intensity,
depending on the concentration range.
In this case, that is, the presence of excess hCG
in the sample causes competition between hCG not
specifically bound to the first specific binding substance
labeled with colloidal gold and hCG specifically bound to
the first specific binding substance labeled with colloidal
gold, in the specific binding reaction with the second
specific binding substance in the detection zone 6,
resulting in a decrease in amount of the first specific
binding substance labeled with colloidal gold, which is
bound in the detection zone 6, and a decrease in signal
intensity, to which colloidal gold contributes, and hence
the signal intensity detected in the detection zone 6 does
not reflect the amount of hCG in the sample.
In the second unit, in terms of each of the hCG
concentrations, the signal intensity increases dependently
on the concentration, indicating that they are in the
linear relationship. Although not shown in the drawing,
when a sample, with the hCG concentration being
substantially zero as indicated by the detector, was
introduced into the second unit, the signal intensity in
the detection zone 6 at 520 nm was zero. This means that
in the second unit, by increasing the amount of the anti-hCG
monoclonal antibody, as the first specific binding
substance labeled with colloidal gold, retained in the
retention zone 5, the amount of hCG not specifically bound
to the first specific binding substance, labeled with
colloidal gold, which had caused the prozone phenomenon
observed in the first unit, decreased, to avoid the
influence of the prozone phenomenon.
As thus described, it is possible to calculate
the hCG concentration in the sample introduced into the
test strip by previously adjusting the amount of the anti-hCG
monoclonal antibody, as the first specific binding
substance, labeled with colloidal gold, retained in the
retention zone 5 in each of the units to automatically
adjust, in each of the units, the composition ratio of the
analyte and the specific binding substance which are
capable of participating in the specific binding reaction,
and by utilizing the calibration curve, from the absorption
of the labeling material in the detection zone 6 on the
developing layer 1 with the composition ratio not
influenced by the prozone phenomenon. Table 1 showed the
signal intensity ratios in the detection zones 6 of the
first unit and the second unit, determined from FIG. 5.
| hCG concentration (IU/L) | Signal intensity ratio |
| (first unit/second unit) | |
| 100 | 0.962 |
| 500 | 0.964 |
| 1000 | 0.969 |
| 1500 | 0.959 |
| 2000 | 0.724 |
| 2500 | 0.529 |
The signal intensity ratios are almost constant
when the hCG concentration is low (hCG concentration = 100
IU/L, 500 IU/L, 1,000 IU/L, 1,500 IU/L), whereas the signal
intensity ratios decrease with an increase in the hCG
concentration when the concentration is as high as not less
than 2,000 IU/L. Whether the prozone phenomenon has
occurred can thus be confirmed by introducing the sample
into the test strip where the amount of the anti-hCG
monoclonal antibody, as the first specific binding
substance, labeled with colloidal gold, retained in the
retention zone 5 in each of the units, has been adjusted,
and then calculating the ratios of the signal intensities
in the respective detection zones 6 followed by observation
and comparison.
The present example was performed in line with
aforesaid Embodiment 3 using the specific binding analysis
device in accordance with FIGS. 3, 6 and 7. The number of
the units in FIG. 7 was five whereas the number of the
units here was six. The monoclonal antibody to hCG capable
of participating in a sandwich reaction with hCG was used
as the first specific binding substance and the second
specific binding substance, and colloidal gold was used as
the labeling material to directly label the first specific
binding substance. Herein, an equal amount of a solution
of an anti-hCG monoclonal antibody, as the first specific
binding substance, was sealed into each of the space
forming zones 2. Urine added with a known amount of hCG
was used as the sample, and a signal intensity in the
detection zone 6 at 520 nm was measured.
As the sample used here was urine with an hCG
concentration of 100 IU/L, 500 IU/L, 1,000 IU/L, 1,500 IU/L,
2,000 IU/L or 2,500 IU/L. Such samples were introduced
from each inlet 3 of the six units. Further, the
introduction of the sample was detected with the start-of-measurement
detector 10 from the change in conductivity of
the developing layer 1, and the measurement time was
determined on the assumption that the start-of-detection
time was zero.
FIG. 8 is a graph showing the relationships
between the hCG concentrations and the signal intensities
in the detection zones 6 at 520 nm, measured five minutes
after the detection of the sample introduction, in the
strip comprising the six units. The signal intensity
measured five minutes after the detection of the sample
introduction increases with an increase in hCG
concentration when the concentration is low (hCG
concentration = 100 IU/L, 500 IU/L, 1,000 IU/L, 1,500
IU/L); however, on the contrary, it decreases with an
increase in hCG concentration when the concentration is as
high as not less than 2,000 IU/L, whereby it is found that
there may exist a plurality of hCG concentrations which
correspond to one signal intensity, depending on the
concentration range.
In this case, that is, the presence of excess hCG
in the sample causes competition between hCG not
specifically bound to the first specific binding substance
labeled with colloidal gold and hCG specifically bound to
the first specific binding substance labeled with colloidal
gold, in the specific binding reaction with the second
specific binding substance in the detection zone 6,
resulting in a decrease in amount of the first specific
binding substance labeled with colloidal gold, which is
bound in the detection zone 6, and a decrease in signal
intensity, to which colloidal gold contributes, and hence
the signal intensity detected in the detection zone 6 does
not reflect the amount of hCG in the sample.
Next, urine with an hCG concentration of 2,500
IU/L was introduced into each of the units of the test
strip comprising five space forming zones 2. The test
strip was used where the total amount of the anti-hCG
monoclonal antibodies sealed in the respective space
forming zones 2 was constant, but the concentration as well
as the amount of the anti-hCG monoclonal antibody solution
sealed in each of the space forming zones 2 were made
different; to be more specific, the anti-hCG monoclonal
antibody solutions were adjusted such that the final hCG
concentrations of the samples to be developed along the
developing layers 1 were, respectively, 100 IU/L, 500 IU/L,
1,000 IU/L, 1,500 IU/L and 2,000 IU/L, which were then
sealed into the space forming zones 2.
In the present invention, when the sample was
brought into contact with the inlet 3, a certain amount of
the sample flowed in due to capillary phenomenon; however,
the amount of the sample flowing in was different in each of
the space forming zones 2 because of the difference in amount
of the solution of the anti-hCG monoclonal antibody, as the
first specific binding substance, labeled with colloidal gold,
which was sealed in each of the space forming zones 2. Since
the total amount of the anti-hCG monoclonal antibodies sealed
in the respective space forming zones 2 was constant, the
introduction of the sample into the test strip comprising a
plurality of space forming zones 2 allowed simultaneous
observation of the specific binding reactions of the
automatically diluted sample.
As a result of measuring the signal intensity in the
detection zone 6 at 520 nm, five minutes after detection of
the sample introduction, accuracy of the sample dilution was
confirmed. Further, the signal intensity increased with an
increase in hCG concentration when the concentration was
low (hCG concentration = 100 IU/L, 500 IU/L, 1,000 IU/L,
1,500 IU/L); however, it decreased with an increase in hCG
concentration when the concentration was 2,000 IU/L.
In the present invention, as thus described, it
is possible to automatically dilute the sample in phases by
previously adjusting the amount of the solution sealed in the
space forming zone 2.
Next, a specific binding analysis device with a
configuration of linking three single units was used. In
this case, the space forming zone 2 was disposed in each of
Unit A, Unit B and Unit C. FIG. 9 showed a graph of
overlapped calibration curves each obtained by measuring
the signal intensity in the detection zone 6 by the use of
a sample containing hCG with a known concentration as the
sample in each of Unit A, Unit B and Unit C. The
calibration curve A, the calibration curve B and the
calibration curve C were corresponded to Unit A, Unit B and
Unit C, respectively.
Unit A, Unit B and Unit C were used under the
same conditions except for the amount of the solution of
the anti-hCG monoclonal antibody labeled with colloidal
gold, which was sealed in each of the space forming zones 2.
Although the total amount of the anti-hCG monoclonal
antibodies sealed in the respective space forming zones 2
in Unit A. Unit B and Unit C was constant, the amount of
the antibody solution sealed in each of the space forming
zones 2 was made smaller in the order of Unit A, Unit B and
Unit C, i.e., the amount of Unit A > the amount of Unit B >
the amount of Unit C.
The inclination of the calibration curve in the
straight line region where the prozone phenomenon was not
occurring was steeper in the order of Unit C, Unit B and
Unit A since, upon introduction of the sample containing
hCG into the space forming zone 2, the larger the amount of
the sealed antibody solution, the more sample was diluted.
As for each of the calibration curves A, B and C, when the
hCG concentration was low, the signal intensity increased
with an increase in concentration; when the hCG
concentration was high, the prozone phenomenon was observed.
The intersection of the calibration curves A and
B was (C1, S1), the intersection of the calibration curves
B and C was (C2, S2) and the intersection of the
calibration curves A and C was (C3, S3), and a threshold S5
was set, which was less than the minimum signal intensity
S3 among the values of signal intensities of the respective
calibration curves and also less than the minimum signal
intensity S4 among the maximum values of the signal
intensities of the respective calibration curves. The
signal intensities in the detection zones 6 when Sample X,
Sample Y and Sample Z, each containing hCG, were developed
in the strips were (XA, XB, XC), (YA, YB, YC), (ZA, ZB, ZC) in
the order of Unit A, Unit B and Unit C.
With Sample X, the magnitudes of the signal
intensities were represented by XA<XB<XC and XC<S5. In the
present invention, the hCG concentration in the sample
could be measured by using the signal intensity XC shown in
Unit C which showed the largest signal intensity among the
reaction fields to show signal intensities not more than
the threshold S5 (Units A, B, C). When the hCG
concentration in the sample was less than the minimum value
C2 of the hCG concentration at the intersection generated
when overlapping the calibration curves A, B and C, as
comparing the signal intensities on the reaction fields,
where the sample was introduced and the specific binding
reaction was conducted, the steeper the inclination of the
calibration curve in the straight line region where the
prozone phenomenon was not occurring, the larger the signal
intensity shown by hCG in the sample.
In such a case where the magnitude relationship
of the signal intensities shown by the analyte in the
sample on the reaction fields, where the sample was
introduced and the specific binding reaction was conducted,
corresponded to the magnitude relationship of the
inclinations of the calibration curves in the straight line
regions where the prozone phenomenon was not occurring, the
smaller concentration Cx1 between Cx1 and Cx2 corresponding
to the signal intensity XC obtained from the calibration
curve C was the hCG concentration in the sample. In this
case, the product of the dilution ratio and the analyte
concentration Cx1 obtained using the calibration curve C
was the analyte concentration in the sample.
With the sample Y, the magnitudes of the signal
intensities were expressed by YA<YB<YC and YB<S5<YC. In the
present invention, the hCG concentration in the sample
could be measured by using the signal intensity YB shown in
Unit B which showed the largest signal intensity among the
reaction fields to show signal intensities not more than
the threshold S5 (Units A, B). In such a case where the
magnitude relationship of the signal intensities shown by
the analyte in the sample on the reaction fields, where the
sample was introduced and the specific binding reaction was
conducted, corresponded to the magnitude relationship of
the inclinations of the calibration curves in the straight
line regions where the prozone phenomenon was not occurring,
the smaller concentration CY1 between CY1 and CY2
corresponding to the signal intensity YB obtained from the
calibration curve B was the hCG concentration in the sample.
In this case, the product of the dilution ratio and the
analyte concentration CY1 obtained from the calibration
curve C was the analyte concentration in the sample. With
the sample Z, the magnitudes of the signal intensities were
expressed by ZC<ZB<ZA and ZB<S5<ZA.
In such a manner, when the magnitude relationship
of the signal intensities shown by the analyte in the
sample on the reaction fields, where the sample was
introduced and the specific binding reaction was conducted,
did not correspond to the magnitude relationship of the
inclinations of the calibration curves in the straight line
regions where the prozone phenomenon was not occurring,
namely, when the hCG concentration in the sample was not
less than the minimum value C2 of the hCG concentration at
the intersection generated when overlapping the calibration
curves A, B and C, the specific binding analysis device in
the present invention could consider the hCG concentration
in the sample as being out of the scope of the
qualitatively or quantitatively analysis. In this case,
the sample Z was further diluted or a specific binding
analysis device adaptable to a high hCG concentration was
used so as to qualitatively or quantitatively analyze hCG
in the sample.
As thus described, it is possible to
qualitatively or quantitatively analyze the analyte in the
sample without being influenced by the prozone phenomenon
which has been a problem with the conventional specific
binding reaction, by comparing the magnitude relationship
of the absorptions of the samples, diluted in phases, in
the detection zones 6 on the respective development layers
1 constituting the test strip, with the magnitude
relationship of the inclinations of the calibration curves
in the straight line regions where the prozone phenomenon
is not occurring, and then analyzing the signal intensity
on the reaction field to show the largest signal intensity
among reaction fields where the specific binding reaction
is conducted to show signal intensities not more than a
threshold set up by utilizing the present invention. In
this case, the product of the dilution ratio and the
analyte concentration obtained from the calibration curve
is the analyte concentration in the sample.
The present example was performed in line with
aforesaid Embodiment 4 using the specific binding analysis
device in accordance with FIGS. 1 to 3. Hence the same
operation was conducted as in Example 2, except that a
strip comprising a first unit and a second unit was
prepared and anti-hCG monoclonal antibodies having
different affinities (1011M-1 and 1010M-1) were immobilized,
respectively, in the detection zones 6 of the first unit
and the second unit.
FIG. 10 is a graph showing the relationships
between the hCG concentrations and the signal intensities
in the respective detection zones 6 at 520 nm, measured
five minutes after the detection of the sample introduction,
in the first unit and the second unit.
The signal intensity in the first unit measured
five minutes after the detection of the sample introduction
increases with an increase in hCG concentration when the
concentration is low (hCG concentration = 100 IU/L, 500
IU/L, 1,000 IU/L, 1,500 IU/L); however, on the contrary, it
decreases with an increase in hCG concentration when the
concentration is as high as not less than 2,000 IU/L,
whereby it is found that there may exist a plurality of hCG
concentrations which correspond to one signal intensity,
depending on the concentration range.
Further, in the second unit, in terms of each of
the hCG concentrations, the signal intensity increases
dependently on the concentration, indicating that they are
in the linear relationship. Although not shown in the
drawing, when a sample, with the hCG concentration being
substantially zero as indicated by the detector, was
introduced into the strip, the signal intensity in the
detection zone 6 at 520 nm was zero. This means that the
use of the antibody with lower affinity in the second unit
as compared to the antibody immobilized in the first unit
weakened the strength of the interaction with the analyte,
changing the balance between the analyte trapped due to the
specific binding reaction in the detection zone 6 and the
analyte washed off out of the detection zone 6 along with
the flow of the sample so that the analyte concentration
observed as the prozone phenomenon shifts to the higher
concentration side than the developing layer 1, thereby
resulting in avoidance of the influence of the prozone
phenomenon in the second unit.
It is thereby found that the hCG concentration in
the sample introduced into the test strip can be calculated
by previously adjusting the affinity of the anti-hCG
monoclonal antibody to be immobilized in the detection zone 6
in each of the units to adjust the strength of the interaction
with the analyte and by utilizing the calibration curve, from
the absorption of the labeling material in the detection zone
6 in the unit, where the antibody with an affinity not
influenced by the prozone phenomenon is immobilized.
Next, a specific binding analysis device with a
configuration of linking three single units in the same manner
as in Example 4 was used and the same operation as in Example
5 was conducted. A graph was created by overlapping
calibration curves each obtained by measuring the signal
intensity in the detection zone 6, using a sample containing
hCG with a know concentration as the sample in each of Unit A,
Unit B and Unit C, which was the same graph as the one shown
in FIG. 9.
Also in the present invention, therefore, it is
possible to qualitatively or quantitatively analyze the
analyte in the sample without being influenced by the
prozone phenomenon which has been a problem with the
conventional specific binding reaction, by comparing the
magnitude relationship of the absorptions in the detection
zones 6 in the respective units constituting the strip,
with the magnitude relationship of the inclinations of the
calibration curves in the straight line regions where the
prozone is not occurring, and then analyzing a signal
intensity on the reaction field to show the largest signal
intensity among reaction fields where specific binding
reaction is conducted to show signal intensities not more
than a threshold set up by utilizing the present invention.
The same operation as in Example 5 was conducted
in line with aforesaid Embodiment 5 where the particle size
of colloidal gold as the labeling material is changed.
It is to be noted that urine with an hCG
concentration of 100 IU/L, 250 IU/L, 500 IU/L, 1,000 IU/L,
1,500 IU/L, 2,000 IU/L or 2,500 IU/L was used as the sample.
A strip comprising a first unit and a second unit
was prepared and colloidal gold with particle sizes of 20
nm and 70 nm were used as the labeling materials for the
anti-hCG monoclonal antibodies as the first specific
binding substances in the respective units. The equal
amount of the solution of the anti-hCG monoclonal antibody
labeled with each of the colloidal gold, with the
absorption at 520 nm made constant, was sealed into each of
the space forming zones.
FIG. 11 is a graph showing the relationships
between the hCG concentrations and the signal intensities
in the detection zones 6 at 520 nm, measured five minutes
after the detection of the sample introduction, in the
first unit and the second unit. The signal intensity in
the second unit measured five minutes after the detection
of the sample introduction increases with an increase in
hCG concentration when the concentration is low (hCG
concentration = 100 IU/L, 250 IU/L, 500 IU/L, 1,000 IU/L).
However, on the contrary, it decreases with an increase in
hCG concentration when the concentration is as high as not
less than 1,500 IU/L. That is to say, there may exist a
plurality of hCG concentrations which correspond to one
signal intensity, depending on the concentration range.
In this case, the presence of excess hCG in the
sample causes competition between hCG not specifically
bound to the first specific binding substance labeled with
colloidal gold and hCG specifically bound to the first
specific binding substance labeled with colloidal gold, in
the specific binding reaction with the second specific
binding substance in the detection zone 6. As a result,
the amount of the first specific binding substance labeled
with colloidal gold, which is bound in the detection zone 6,
decreases and the signal intensity, to which colloidal gold
contributes, decreases, and hence the signal intensity
detected in the detection zone 6 does not reflect the
amount of hCG in the sample.
In the first unit, in terms of each of the hCG
concentrations, the signal intensity increases dependently
on the concentration, indicating that the linear
relationship has been formed therebetween. Although not
shown in the drawing, when a sample, with the hCG
concentration being substantially zero as indicated by the
detector, was introduced into the test strip, the signal
intensity in the detection zone 6 at 520 nm was zero. This
means that in the first unit, by making the particle size
of colloidal gold as the labeling material smaller, the
number of the anti-hCG monoclonal antibodies as the first
specific binding substances which were sealed in the space
forming zone increased while the amount of hCG not
specifically bound to the first specific binding substance
labeled with colloidal gold, which had caused the prozone
phenomenon observed in the second unit, decreased, to avoid
the influence of the prozone phenomenon.
It is thereby found that the hCG concentration in
the sample introduced into the strip can be calculated by
previously adjusting the characteristic of the labeling
material to adjust the number of the anti-hCG monoclonal
antibodies as the first specific binding substances labeled
with colloidal gold in the respective units and
automatically adjust the composition ratio of the analyte
and the specific binding substance which are capable of
participating in the specific binding reaction, and by
utilizing the calibration curve, from the absorption of the
labeling material in the detection zone 6 in the unit with
the composition ratio not influenced by the prozone
phenomenon.
In line with aforesaid Embodiment 6 using the
specific binding analysis device in accordance with FIGS. 1
to 3, the monoclonal antibody to hCG capable of
participating in a sandwich reaction with hCG was used as
the first specific binding substance and the second
specific binding substance, and colloidal gold was used as
the labeling material to directly label the first specific
binding substance. Urine added with a known amount of hCG
was used as the sample, and a signal intensity in the
detection zone at 520 nm was measured. As the sample used
was urine with an hCG concentration of 100 IU/L, 250 IU/L,
500 IU/L or 1,000 IU/L. Further, the introduction of the
sample was detected with the start-of-measurement detector
10 from the change in conductivity of the developing layer
1, and the measurement time was determined on the
assumption that the start-of-detection time was zero.
FIG. 13 represented the distribution status of
the signal intensity in the detection zone 6 at 520 nm,
measured five minutes after the detection of the sample
introduction in a strip constituted by disposing four units
on parallel. As evident from the drawing, since the
developing layers 1 are disposed in parallel while
providing a gap between each of the layers, the signal
intensities in the respective units can be distinguishd
when the signal intensities in a plurality of detection
zones 6 are successively measured.
FIG. 14 is a graph showing the relationship
between the hCG concentration and the signal intensity in
the detection zone 6 at 520 nm, measured five minutes after
the detection of the sample introduction, when it is
assumed that the height of the curve in FIG. 13 was the
signal intensity in the detection zone of each of the units.
In terms of each of the hCG concentration, the signal
intensity increases dependently on the concentration,
indicating that the linear relationship has been formed
therebetween. Although not shown in the drawing, when a
sample, with the hCG concentration being substantially zero
as indicated by the detector, was introduced into the test
strip, the signal intensity in the detection zone 6 at 520
nm was zero.
In line with aforesaid Embodiment 7 using the
specific binding analysis device in accordance with FIGS. 1
to 3, the monoclonal antibody to hCG capable of
participating in a sandwich reaction with hCG was used as
the first specific binding substance and the second
specific binding substance, and colloidal gold was used as
the labeling material to directly label the first specific
binding substance. Urine added with a known amount of hCG
was used as the sample, and a signal intensity in the
detection zone at 520 nm was measured. As the sample used
was urine with an hCG concentration of 100 IU/L, 500 IU/L,
1,000 IU/L, 1,500 IU/L, 2,000 IU/L or 2,500 IU/L.
Further, the introduction of the sample was
detected with the start-of-measurement detector 10 from the
change in conductivity of the developing layer 1, and the
measurement time was determined on the assumption that the
start-of-detection time was zero. A strip comprising a
first unit and a second unit was prepared and anti-hCG
monoclonal antibodies having different affinities (1011M-1
and 1010M-1) were immobilized, respectively, in the
detection zones 6 of the first unit and the second unit.
(a) to (f) in FIG. 15 represented the
distribution statuses of the signal intensities in the
detection zones 6 at 520 nm, measured five minutes after
detecting the introduction of the samples with different
hCG concentrations. As obvious from the drawing, since the
first unit is disposed in parallel with the second unit
while providing a gap therebetween, the signal intensities
in the respective units can be distinguishd when the signal
intensities in a plurality of detection zones 6 are
successively measured.
FIG. 16 is a graph showing the relationships
between the hCG concentrations and the signal intensities
in the detection zones 6 at 520 nm, measured five minutes
after the detection of the sample introduction, when it is
assumed that the height of the curve in FIG. 15 was the
signal intensity in the detection zone of each of the units.
The signal intensity in the first unit measured
five minutes after the detection of the sample introduction
increases with an increase in hCG concentration when the
concentration is low (hCG concentration = 100 IU/L, 500
IU/L, 1,000 IU/L, 1,500 IU/L); however, on the contrary, it
decreases with an increase in hCG concentration when the
concentration is as high as not less than 2,000 IU/L,
whereby it is found that there may exist a plurality of hCG
concentrations which correspond to one signal intensity,
depending on the concentration range.
In this case, namely, the presence of excess hCG
in the sample causes competition between hCG not
specifically bound to the first specific binding substance
labeled with colloidal gold and hCG specifically bound to
the first specific binding substance labeled with colloidal
gold, in the specific binding reaction with the second
specific binding substance in the detection zone 6,
resulting in a decrease in amount of the first specific
binding substance labeled with colloidal gold, which is
bound in the detection zone 6, and a decrease in signal
intensity, to which colloidal gold contributes, and hence
the signal intensity detected in the detection zone 6 does
not reflect the amount of hCG in the sample.
In the second unit, in terms of each of the hCG
concentrations, the signal intensity increases dependently
on the concentration, indicating that they are in the
linear relationship. Although not shown in the drawing,
when a sample, with the hCG concentration being
substantially zero as indicated by the detector, was
introduced into the test strip, the signal intensity in the
detection zone 6 at 520 nm was zero. The use of the
antibody with lower affinity in the second unit as compared
to the antibody immobilized in the first unit weakened the
strength of the interaction with the analyte, thereby
changing the balance between the analyte trapped due to the
specific binding reaction in the detection zone 6 and the
analyte washed off out of the detection zone along with the
flow of the sample. The analyte concentration observed as
the prozone phenomenon then shifts to the higher
concentration side than the developing layer 1, meaning
that, as a result, the influence of the prozone phenomenon
is avoided in the second unit.
It is thereby found that the hCG concentration in
the sample introduced into the test strip can be calculated
by previously adjusting the affinity of the anti-hCG
monoclonal antibody to be mobilized in the detection zone 6 in
each of the units to adjust the strength of the interaction
with the analyte, and by utilizing the calibration curve, from
the absorption of the labeling material in the detection zone
in the unit, where the antibody with the affinity not
influenced by the prozone phenomenon is immobilized.
In line with aforesaid Embodiment 8 using the
specific binding analysis device in accordance with FIGS. 1
to 3, the monoclonal antibody to hCG capable of
participating in a sandwich reaction with hCG was used as
the first specific binding substance and the second
specific binding substance, and colloidal gold was used as
the labeling material to directly label the first specific
binding substance. Urine added with a known amount of hCG
was used as the sample, and a signal intensity in the
detection zone at 520 nm was measured. As the sample used
was urine with an hCG concentration of 100 IU/L, 250 IU/L,
500 IU/L, 1,000 IU/L, 1,500 IU/L, 2,000 IU/L or 2,500 IU/L.
Further, the introduction of the sample was
detected with the start-of-measurement detector 10 from the
change in conductivity of the developing layer, and the
measurement time was determined on the assumption that the
start-of-detection time was zero. A strip comprising a
first unit and a second unit was prepared and colloidal
gold with particle sizes of 20 nm and 70 nm were used as
the labeling materials for the anti-hCG monoclonal
antibodies as the first specific binding substances of the
respective units. Further, the equal amount of the
solution of the anti-hCG monoclonal antibody labeled with
each of the colloidal gold, with the absorption at 520 nm
made constant, was sealed into each of the space forming
zones.
(a) to (g) in FIG. 17 represented the
distribution statuses of the signal intensities in the
detection zones 6 at 520 nm, measured five minutes after
the detection of the sample introduction. As obvious from
the drawing, since the units are disposed in parallel while
providing a gap therebetween, the signal intensities in the
respective units can be distinguishd when the signal
intensities in a plurality of detection zones 6 are
successively measured.
FIG. 18 is a graph showing the relationships
between the hCG concentrations and the signal intensities
in the detection zones 6 at 520 nm, measured five minutes
after the detection of the sample introduction, when it is
assumed that the height of the curve in FIG. 17 was the
signal intensity in the detection zone of each of the units.
The signal intensity in the second unit measured five
minutes after the detection of the sample introduction
increases with an increase in hCG concentration when the
concentration is low (hCG concentration = 100 IU/L, 250
IU/L, 500 IU/L, 1,000 IU/L); however, on the contrary, it
decreases with an increase in hCG concentration when the
concentration is as high as not less than 1,500 IU/L,
whereby it is found that there may exist a plurality of hCG
concentrations which correspond to one signal intensity,
depending on the concentration range.
In this case, that is, the presence of excess hCG
in the sample causes competition between hCG not
specifically bound to the first specific binding substance
labeled with colloidal gold and hCG specifically bound to
the first specific binding substance labeled with colloidal
gold, in the specific binding reaction with the second
specific binding substance in the detection zone 6,
resulting in a decrease in amount of the first specific
binding substance labeled with colloidal gold, which is
bound in the detection zone 6, and a decrease in signal
intensity, to which colloidal gold contributes, and hence
the signal intensity detected in the detection zone 6 does
not reflect the amount of hCG in the sample.
In the first unit, in terms of each of the hCG
concentrations, the signal intensity increases dependently
on the concentration, indicating that they are in the
linear relationship. Although not shown in the drawing,
when a sample, with the hCG concentration being
substantially zero as indicated by the detector, was
introduced into the strip, the signal intensity in the
detection zone 6 at 520 nm was zero. This means that in
the first unit, by making the particle size of colloidal
gold as the labeling material smaller, the number of the
anti-hCG monoclonal antibodies as the first specific
binding substances which were sealed in the space forming
zone increased while the amount of hCG not specifically
bound to the first specific binding substance labeled with
colloidal gold, which had caused the prozone phenomenon
observed in the second unit, decreased, to avoid the
influence of the prozone phenomenon.
It is thereby found that the hCG concentration in
the sample introduced into the test strip can be calculated
by previously adjusting the characteristic of the labeling
material to adjust the number of the anti-hCG monoclonal
antibodies as the first specific binding substances labeled
with colloidal gold in the respective units and
automatically adjust the composition ratio of the analyte
and the specific binding substance which are capable of
participating in the specific binding reaction, and by
utilizing the calibration curve, from the absorption of the
labeling material in the detection zone 6 in the unit with
the composition ratio not influenced by the prozone
phenomenon.
As thus described, according to the present
invention, a specific binding analysis device and a specific
binding analysis method can be provided, which are capable of
making a sample automatically diluted without the need for an
advanced device or operation, and further capable of
qualitatively or quantitatively analyzing an analyte in a
sample by means of a small-sized, simple measurement device in
a simple, rapid and accurate manner, under little influence
attributed to the concentration of the analyte in the sample.
Claims (20)
- A specific binding analysis device for qualitatively or quantitatively analyzing an analyte in a sample, using a specific binding reaction between an analyte and a specific binding substance capable of specifically binding to said analyte,
said device comprising: an inlet for introducing said sample; a plurality of space forming zones for temporarily retaining said sample introduced from said inlet; a plurality of reaction fields where a specific binding reaction of said sample retained in said space forming zone occurs; and an outlet for discharging said sample from said space forming zone to said reaction field,
said specific binding reaction occurring under a different condition in each of said reaction fields. - The specific binding analysis device in accordance with Claim 1, wherein the number of said inlets is one.
- The specific binding analysis device in accordance with Claim 1, wherein each of said space forming zones is different in content.
- The specific binding analysis device in accordance with Claim 1 or 2, wherein the rate of introducing said sample from said inlet into said space forming zone is faster than the rate of discharging said sample from said outlet to said reaction field.
- The specific binding analysis device in accordance with any of Claims 1 to 3, wherein said reaction field comprises a first specific binding substance labeled with a labeling material and a second specific binding substance, and a qualitative or quantitative analysis is performed based on a signal attributed to a specific binding reaction that said first specific binding substance and said second specific binding substance are bound to one another via said analyte.
- The specific binding analysis device in accordance with Claim 5, wherein the characteristic of said labeling material differs in each of said reaction fields.
- The specific binding analysis device in accordance with Claim 6, wherein the characteristic of said labeling material is a particle size or a material of said labeling material.
- The specific binding analysis device in accordance with any of Claims 5 to 7, wherein said reaction field is a developing layer capable of developing said sample due to capillarity, a detection zone is disposed on said developing layer, and said second specific binding substance is immobilized in said detection zone.
- The specific binding analysis device in accordance with Claim 8, wherein said first specific binding substance is retained on said developing layer.
- The specific binding analysis device in accordance with Claim 8, wherein said sample does not move between a plurality of said developing layers.
- The specific binding analysis device in accordance with any of Claims 1 to 10, comprising equipment for differentiating, by each of said a plurality of said reaction fields, signals attributed to specific binding sent from said reaction fields and also for successively reading out said signals.
- A specific binding analysis method for qualitatively or quantitatively analyzing an analyte in a sample,
using a specific binding analysis device which comprises: an inlet for introducing said sample; a plurality of space forming zones for temporarily retaining said sample introduced from said inlet; a plurality of reaction fields where a specific binding reaction of said analyte in said sample retained in said space forming zone occurs; and an outlet for discharging said sample from said space forming zone to said reaction field, and is characterized in that said specific binding reaction occurs under a different condition in each of said reaction fields, and
adjusting at least one selected from the group consisting of a content of said space forming zone, a dilution ratio of said sample retained in said space forming zone and the characteristic of said labeling material to analyze said analyte. - The specific binding analysis method in accordance with Claim 12, wherein the characteristic of said labeling material is a particle size or a material of said labeling material.
- The specific binding analysis method in accordance with Claim 12, wherein said analyte in said sample is qualitatively or quantitatively analyzed by making said space forming zone carry a solution containing a first specific binding substance, and then adjusting an amount of said solution to be carried.
- The specific binding analysis method in accordance with Claim 12, wherein said analyte in said sample is qualitatively or quantitatively analyzed by analyzing the product of an intensity of a signal attributed to said specific binding reaction and a magnification of said dilution.
- The specific binding analysis method in accordance with Claim 12, wherein said analyte in said sample is qualitatively or quantitatively analyzed by analyzing in said reaction fields a signal intensity of a portion where a specific binding reaction is conducted to show a signal intensity not higher than a prescribed threshold.
- The specific binding analysis method in accordance with Claim 15, wherein said analyte in said sample is qualitatively or quantitatively analyzed by analyzing a signal intensity of a portion where a specific binding reaction is conducted to show the largest signal intensity among reaction fields where a specific binding reaction is conducted to show signal intensities not higher than said threshold.
- The specific binding analysis method in accordance with Claim 16 or 17, wherein said threshold is less than the minimum value of a signal intensity at an intersection which is generated when overlapping corresponding curves of an analyte concentration and a signal intensity of each of said portions where a specific binding reaction is conducted, and is also less than the minimum signal intensity among the maximum values of said signal intensities of respective said corresponding curves.
- The specific binding analysis method in accordance with any of Claims 16 to 18, wherein, when said analyte in said sample is qualitatively or quantitatively analyzed, referring to said corresponding curves of said analyte concentration and said signal intensity of said portion where a specific binding reaction is conducted to show the largest signal intensity among said reaction fields where a specific binding reaction is conducted to show signal intensities not higher than said threshold, in a case where there exist a plurality of analyte concentrations corresponding to said signal intensity of said portion where a specific binding reaction is conducted to show the largest signal intensity among said reaction fields where a specific binding reaction is conducted to show signal intensities not higher than said threshold, the smallest concentration is considered as the analyte concentration.
- The specific binding analysis method in accordance with Claim 12, wherein said analyte in said sample is qualitatively or quantitatively analyzed by differentiating, by each of said a plurality of said reaction fields, signals attributed to specific binding sent from said reaction fields and also for successively reading out said signals.
Applications Claiming Priority (5)
| Application Number | Priority Date | Filing Date | Title |
|---|---|---|---|
| JP2001302340 | 2001-09-28 | ||
| JP2001302340 | 2001-09-28 | ||
| JP2001383358 | 2001-12-17 | ||
| JP2001383358 | 2001-12-17 | ||
| PCT/JP2002/009527 WO2003029822A1 (en) | 2001-09-28 | 2002-09-17 | Specific binding analyzer and method of analyzing specific binding |
Publications (2)
| Publication Number | Publication Date |
|---|---|
| EP1361435A1 true EP1361435A1 (en) | 2003-11-12 |
| EP1361435A4 EP1361435A4 (en) | 2005-01-26 |
Family
ID=26623357
Family Applications (1)
| Application Number | Title | Priority Date | Filing Date |
|---|---|---|---|
| EP02800234A Withdrawn EP1361435A4 (en) | 2001-09-28 | 2002-09-17 | SPECIFIC BINDING ANALYSIS DEVICE AND SPECIFIC BINDING ANALYSIS METHOD |
Country Status (5)
| Country | Link |
|---|---|
| US (1) | US20040096985A1 (en) |
| EP (1) | EP1361435A4 (en) |
| JP (1) | JPWO2003029822A1 (en) |
| CN (1) | CN1489691A (en) |
| WO (1) | WO2003029822A1 (en) |
Cited By (7)
| Publication number | Priority date | Publication date | Assignee | Title |
|---|---|---|---|---|
| WO2005111607A3 (en) * | 2004-05-12 | 2006-02-02 | Roche Diagnostics Gmbh | Method for increasing the dynamic measuring range of test elements, especially immunological test elements, that are based on specific bonding reactions |
| WO2008073393A1 (en) * | 2006-12-12 | 2008-06-19 | Response Biomedical Corporation | Multiple analyte immunoassay |
| US7875433B2 (en) | 2007-02-26 | 2011-01-25 | Response Biomedical Corporation | Comparative multiple analyte assay |
| WO2014106033A1 (en) * | 2012-12-28 | 2014-07-03 | Abbott Point Of Care Inc. | Apparatus and method for identifying a hook effect and expanding the dynamic range in point of care immunoassays |
| WO2014149111A1 (en) * | 2013-03-15 | 2014-09-25 | Abbott Laboratories | Assay with increased dynamic range |
| US9005901B2 (en) | 2013-03-15 | 2015-04-14 | Abbott Laboratories | Assay with internal calibration |
| US10451615B2 (en) | 2014-12-05 | 2019-10-22 | Mbio Diagnostics, Inc. | Methods and devices for performing high dynamic range immunoassays |
Families Citing this family (13)
| Publication number | Priority date | Publication date | Assignee | Title |
|---|---|---|---|---|
| WO2004034056A2 (en) * | 2002-10-08 | 2004-04-22 | Tara Nylese | Portable diagnostic device and method for determining temporal variations in concentrations |
| JP2006038700A (en) * | 2004-07-28 | 2006-02-09 | Nippon Gene Co Ltd | Analyzer and analysis method |
| ITMI20060477A1 (en) * | 2006-03-16 | 2007-09-17 | Univ Degli Studi Milano | METHOD OF MEASUREMENT OF MOLECULAR INTERACTIONS THROUGH SURFACES LIGHT DETECTION |
| ITMI20060480A1 (en) * | 2006-03-16 | 2007-09-17 | Solvay Solexis Spa | USOM OF PERFLUOROPOLYMERS IN THE DTERMIBNAZIONE OF THE LIGANDO-RECEPTOR BOND CONSTANT |
| EP1909206A1 (en) | 2006-09-11 | 2008-04-09 | Roche Diagnostics GmbH | Improvement of measuring range of a chromatographic rapid test |
| CN101842695A (en) * | 2007-10-31 | 2010-09-22 | 爱科来株式会社 | Control liquid identifying method and analysis device |
| JP5184962B2 (en) * | 2007-10-31 | 2013-04-17 | アークレイ株式会社 | Immunochromatography equipment |
| JP4980944B2 (en) | 2008-02-12 | 2012-07-18 | 富士フイルム株式会社 | Immunological measurement method |
| JP5374439B2 (en) * | 2009-09-14 | 2013-12-25 | 積水化学工業株式会社 | Immunoassay method and immunoassay device |
| JP5813481B2 (en) * | 2011-11-29 | 2015-11-17 | Kddi株式会社 | Biosensor and test liquid measurement method |
| KR20140111192A (en) | 2013-03-08 | 2014-09-18 | (주)프로테옴텍 | Parallel line biochip for multiplex diagnosis |
| JP2018054549A (en) * | 2016-09-30 | 2018-04-05 | キヤノン株式会社 | Detection kit and detection method |
| WO2019049395A1 (en) * | 2017-09-08 | 2019-03-14 | アルフレッサファーマ株式会社 | Analysis device and analysis method |
Family Cites Families (11)
| Publication number | Priority date | Publication date | Assignee | Title |
|---|---|---|---|---|
| WO1992012428A1 (en) * | 1991-01-11 | 1992-07-23 | Quidel Corporation | A one-step lateral flow nonbibulous assay |
| US6168956B1 (en) * | 1991-05-29 | 2001-01-02 | Beckman Coulter, Inc. | Multiple component chromatographic assay device |
| AU3439693A (en) * | 1992-01-22 | 1993-09-01 | Abbott Laboratories | Calibration reagents for semi-quantitative binding assays and devices |
| US5637469A (en) * | 1992-05-01 | 1997-06-10 | Trustees Of The University Of Pennsylvania | Methods and apparatus for the detection of an analyte utilizing mesoscale flow systems |
| JP3479100B2 (en) * | 1993-06-02 | 2003-12-15 | 帝国臓器製薬株式会社 | Simple semi-quantitative immunochemical method and apparatus |
| US6403383B1 (en) * | 1996-03-11 | 2002-06-11 | American Bio Medica Corp. | Diagnostic test kit for immunological assays of fluid samples |
| US6194220B1 (en) * | 1996-09-25 | 2001-02-27 | Becton, Dickinson And Company | Non-instrumented assay with quantitative and qualitative results |
| JPH11326326A (en) * | 1998-05-13 | 1999-11-26 | Dainippon Printing Co Ltd | Immune test |
| US6514769B2 (en) * | 1999-07-29 | 2003-02-04 | Jin Po Lee | Multiple analyte assay device with sample integrity monitoring system |
| EP1347299B1 (en) * | 2000-12-26 | 2006-03-08 | Matsushita Electric Industrial Co., Ltd. | Specific bonding analysis method and specific bonding analysis device using it |
| DE60212776T2 (en) * | 2001-09-14 | 2007-06-28 | Matsushita Electric Industrial Co., Ltd., Kadoma | Specific binding analysis method |
-
2002
- 2002-09-17 EP EP02800234A patent/EP1361435A4/en not_active Withdrawn
- 2002-09-17 CN CNA028041720A patent/CN1489691A/en active Pending
- 2002-09-17 JP JP2003532984A patent/JPWO2003029822A1/en active Pending
- 2002-09-17 WO PCT/JP2002/009527 patent/WO2003029822A1/en not_active Ceased
- 2002-09-17 US US10/469,766 patent/US20040096985A1/en not_active Abandoned
Cited By (15)
| Publication number | Priority date | Publication date | Assignee | Title |
|---|---|---|---|---|
| WO2005111607A3 (en) * | 2004-05-12 | 2006-02-02 | Roche Diagnostics Gmbh | Method for increasing the dynamic measuring range of test elements, especially immunological test elements, that are based on specific bonding reactions |
| US8354235B2 (en) | 2004-05-12 | 2013-01-15 | Roche Diagnostics Operations, Inc. | Method for increasing the dynamic measuring range of test elements based on specific binding reactions |
| CN1954212B (en) * | 2004-05-12 | 2013-03-13 | 霍夫曼-拉罗奇有限公司 | Method for increasing the dynamic measurement range of test units based on specific binding reactions, in particular immunoassay units |
| US8404493B2 (en) | 2006-12-12 | 2013-03-26 | Response Biomedical Corporation | Multiple analyte immunoassay |
| WO2008073393A1 (en) * | 2006-12-12 | 2008-06-19 | Response Biomedical Corporation | Multiple analyte immunoassay |
| CN101595388A (en) * | 2006-12-12 | 2009-12-02 | 反应生物医学公司 | Multi-analyte immunoassay |
| US7875433B2 (en) | 2007-02-26 | 2011-01-25 | Response Biomedical Corporation | Comparative multiple analyte assay |
| WO2014106033A1 (en) * | 2012-12-28 | 2014-07-03 | Abbott Point Of Care Inc. | Apparatus and method for identifying a hook effect and expanding the dynamic range in point of care immunoassays |
| US9671398B2 (en) | 2012-12-28 | 2017-06-06 | Abbott Point Of Care Inc. | Apparatus and method for identifying a hook effect and expanding the dynamic range in point of care immunoassays |
| WO2014149111A1 (en) * | 2013-03-15 | 2014-09-25 | Abbott Laboratories | Assay with increased dynamic range |
| US9005901B2 (en) | 2013-03-15 | 2015-04-14 | Abbott Laboratories | Assay with internal calibration |
| US9157910B2 (en) | 2013-03-15 | 2015-10-13 | Abbott Laboratories | Assay with increased dynamic range |
| US10073090B2 (en) | 2013-03-15 | 2018-09-11 | Abbott Laboratories | Assay with increased dynamic range |
| US10942179B2 (en) | 2013-03-15 | 2021-03-09 | Abbott Laboratories | Assay with increased dynamic range |
| US10451615B2 (en) | 2014-12-05 | 2019-10-22 | Mbio Diagnostics, Inc. | Methods and devices for performing high dynamic range immunoassays |
Also Published As
| Publication number | Publication date |
|---|---|
| US20040096985A1 (en) | 2004-05-20 |
| JPWO2003029822A1 (en) | 2005-01-20 |
| WO2003029822A1 (en) | 2003-04-10 |
| CN1489691A (en) | 2004-04-14 |
| EP1361435A4 (en) | 2005-01-26 |
Similar Documents
| Publication | Publication Date | Title |
|---|---|---|
| EP1361435A1 (en) | Specific binding analyzer and method of analyzing specific binding | |
| EP1347299B1 (en) | Specific bonding analysis method and specific bonding analysis device using it | |
| JP4846573B2 (en) | Lateral flow assay device and method with natural analyte as reference | |
| JP4007624B2 (en) | Apparatus and method for binding assays with adsorbent carrier materials | |
| EP0398913B1 (en) | Test method and reagent kit therefor | |
| US7344893B2 (en) | Immuno-gold lateral flow assay | |
| EP3244189B1 (en) | Quantitative analyte assay device and method | |
| EP2284538B1 (en) | Biosensor | |
| JPH03503081A (en) | Quantification of environmental concentrations of several test substances | |
| US8354235B2 (en) | Method for increasing the dynamic measuring range of test elements based on specific binding reactions | |
| EP1293780B1 (en) | Specific binding analysis method | |
| JP3654591B2 (en) | Specific binding analysis method and specific binding analysis device | |
| US8101429B2 (en) | Native analyte as a reference in lateral flow assays | |
| JP5073507B2 (en) | Multiple immunochemical assays on elements | |
| JP4179419B2 (en) | Test substance detection method, sensitizer and immunochromatography kit | |
| JP2000258418A (en) | Measuring method by using immuno-chromatography and test body analytical tool used therein | |
| JPH1048212A (en) | Method for measuring an analyte using an immunochromatographic test strip | |
| HK1106025B (en) | Method for increasing the dynamic measuring range of test elements, especially immunological test elements, that are based on specific bonding reactions | |
| HK1001235B (en) | Test method and reagent kit therefor | |
| HK1001235A (en) | Test method and reagent kit therefor |
Legal Events
| Date | Code | Title | Description |
|---|---|---|---|
| PUAI | Public reference made under article 153(3) epc to a published international application that has entered the european phase |
Free format text: ORIGINAL CODE: 0009012 |
|
| 17P | Request for examination filed |
Effective date: 20030722 |
|
| AK | Designated contracting states |
Kind code of ref document: A1 Designated state(s): AT BE BG CH CY CZ DE DK EE ES FI FR GB GR IE IT LI LU MC NL PT SE SK TR |
|
| AX | Request for extension of the european patent |
Extension state: AL LT LV MK RO SI |
|
| A4 | Supplementary search report drawn up and despatched |
Effective date: 20041215 |
|
| STAA | Information on the status of an ep patent application or granted ep patent |
Free format text: STATUS: THE APPLICATION HAS BEEN WITHDRAWN |
|
| 18W | Application withdrawn |
Effective date: 20050421 |