Field of the Invention
The present invention relates generally to a rapid method of characterizing
interactions between compounds and biological molecules in vitro, in order to predict
the in vivo characteristics of the compounds.
Background
It is known that biological molecules may take a variety of conformations, and
that the binding of a ligand to a biomolecule may stabilize the biomolecule in a
particular conformation. For example, The estrogen receptor alpha (ERα)
conformation stabilized by estradiol is different than the conformation stabilized by
tamoxifen. The conformation of a ligand-bound biomolecule may affect the
subsequent biochemical interactions of the biomolecule, including cofactor/accessory
protein recruitment, homo- or hetero-dimerization, gene regulation, control of
biological processes and cellular/tissue outcomes.
A ligand-bound biomolecule may, for example, interact with a cofactor protein
in a different manner, compared to the interaction which would occur between that
cofactor protein and the unliganded biomolecule. The variation in cofactor protein
binding that occurs due to the conformation of the biomolecule/ligand can be
measured using techniques as are known in the art; one such method is to measure
and compare the absolute or relative amount of peptide that binds to the various
biomolecule/ligand pairs (and/or to the unliganded biomolecule).
For example, the ERα ligand binding domain (LBD) in an unliganded form
will bind to RAC3(671-697) (see Figure 7). The percentage of available RAC3 that
binds to ERα LBD decreases when the ERα LBD is bound to 4-OH tamoxifen
(relative to binding of RAC3 to unliganded ERα LBD) and increases when the ERα is
bound to estradiol. The conformation of ERα LBD stabilized by estradiol results in
an increase in the amount of RAC3 binding, whereas the conformational change
stabilized by 4-OH tamoxifen decreases RAC3 binding (relative to binding in the
absence of either tamoxifen or estradiol).
For many biomolecules (including but not limited to nuclear receptors,
GPCRs, 7TMs, and ion channels), cell-based assays are known that are reliable
indicators of the ability of a compound to activate a certain biomolecule (agonist ), or
block activation of the biomolecule (antagonist compound). For example, the MCF-7
breast cell proliferation assay is known in the art for use as a screening assay to
identify compounds with ERα agonist or antagonist activity. Thus, the outcome of
certain cell-based assays are known to be responsive to modulation (activation or
inhibition) of a given biomolecule that is within the cell (either naturally or
recombinantly).
In drug discovery research, it is typical to screen vast numbers of chemical
compounds using cell-based assays, to identify those compounds with
pharmaceutically desirable properties. For example, multiple compounds are known
to activate the estrogen receptor activity in vitro. Nonetheless, in vivo these
compounds may have different effects among different tissues types, some of which
are pharmaceutically desirable and some of which are not. See, e.g., Shang and
Brown, Science 295:2465 (2002). For example, it is undesirable for a compound to
have proliferative activity in reproductive tissues such as breast or uterus, as one
outcome may be an increased risk of cancer. Some compounds, such as tamoxifen,
are known to have agonist activity in uterine endometrial cells but act as antagonists
in breast cancer cells. It is also recognized that compounds not having activities in
reproductive tissues can have other desirable physiological consequences, such as
bone protective effects and cardiovascular benefits. Typically, compounds identified
as having increased or decreased binding activity in vitro must undergo additional
cell-based assay screening to identify those compounds most suitable for
pharmaceutical development.
As cell-based assays are labor and resource intensive, methods of predicting
the cell-based effects of a compound, based on in vitro binding assays, are desirable.
By identifying those compounds most likely to have desirable cell-based effects, a
large series of compounds may be prioritized for subsequent in vivo assays, including
in cellulo (cell and tissue-based assays), and in animal models.
SUMMARY OF THE INVENTION
A first aspect of the present invention is a method of predicting the effect of a
pharmaceutical compound in a cell-based assay that is responsive to modulation of a
nuclear receptor. A plurality of reference compounds are selected whose effects in a
cell-based assay are known, where the cell-based assay is responsive to modulation of
a nuclear receptor. A plurality of binding partners known to bind to the nuclear
receptor is also selected, and the binding partners and nuclear receptor are contacted
in the presence of a reference compound, under conditions that allow binding. The
extent of binding between each binding partner and the nuclear receptor is detected,
so that the compound's binding profile can be characterized by the relative differences
between the binding results for that compound. These steps are repeated for each of
the plurality of reference compounds. For at least one test compound (whose effects
in the cell-based assay are not known), the extent of binding of the nuclear receptor to
each of the binding partners in the presence of the test compound is determined, such
that the test compound's binding profile can be characterized by the relative
differences between the binding results for that compound. The binding profile of
each reference compound is then compared to the binding profile of the test
compound, to identify the reference compound having the binding profile that is most
similar to the test compound binding profile. Identification of a reference compound
binding profile that is similar to the test compound binding profile indicates that the
test compound will achieve results in the cell-based assays similar to the results
achieved by the reference compound.
A further aspect of the present invention is a method of predicting the effect
of a pharmaceutical compound in a cell-based assay that is responsive to modulation
of a G-protein coupled receptor (GPCR). A plurality of reference compounds are
selected whose effects in a cell-based assay are known, where the cell-based assay is
responsive to modulation of a GPCR. A plurality of binding partners known to bind
to the GPCR is also selected, and the binding partners and GPCR are contacted in the
presence of a reference compound, under conditions that allow binding. The extent of
binding between each binding partner and the GPCR is detected, so that the
compound's binding profile can be characterized by the relative differences between
the binding results for that compound. These steps are repeated for each of the
plurality of reference compounds. For at least one test compound (whose effects in
the cell-based assay are not known), the extent of binding of the GPCR to each of the
binding partners in the presence of the test compound is determined, such that the test
compound's binding profile can be characterized by the relative differences between
the binding results for that compound. The binding profile of each reference
compound is then compared to the binding profile of the test compound, to identify
the reference compound having the binding profile that is most similar to the test
compound binding profile. Identification of a reference compound binding profile
that is similar to the test compound binding profile indicates that the test compound
will achieve results in the cell-based assays similar to the results achieved by the
reference compound.
A further aspect of the present invention is a method of predicting the effect
of a pharmaceutical compound in a cell-based assay that is responsive to modulation
of a 7-transmembrane receptor (7TM receptor). A plurality of reference compounds
are selected whose effects in a cell-based assay are known, where the cell-based assay
is responsive to modulation of a 7TM receptor. A plurality of binding partners known
to bind to the 7TM receptor is also selected, and the binding partners and 7 TM
receptor are contacted in the presence of a reference compound, under conditions that
allow binding. The extent of binding between each binding partner and the 7TM
receptor is detected, so that the compound's binding profile can be characterized by
the relative differences between the binding results for that compound. These steps
are repeated for each of the plurality of reference compounds. For at least one test
compound (whose effects in the cell-based assay are not known), the extent of binding
of the 7TM receptor to each of the binding partners in the presence of the test
compound is determined, such that the test compound's binding profile can be
characterized by the relative differences between the binding results for that
compound. The binding profile of each reference compound is then compared to the
binding profile of the test compound, to identify the reference compound having the
binding profile that is most similar to the test compound binding profile.
Identification of a reference compound binding profile that is similar to the test
compound binding profile indicates that the test compound will achieve results in the
cell-based assays similar to the results achieved by the reference compound
A further aspect of the present invention is a method of predicting the effect
of a pharmaceutical compound in a cell-based assay that is responsive to modulation
of an ion channel. A plurality of reference compounds are selected whose effects in a
cell-based assay are known, where the cell-based assay is responsive to modulation of
an ion channel. A plurality of binding partners known to bind to the ion channel is
also selected, and the binding partners and an ion channel are contacted in the
presence of a reference compound, under conditions that allow binding. The extent of
binding between each binding partner and the ion channel is detected, so that the
compound's binding profile can be characterized by the relative differences between
the binding results for that compound. These steps are repeated for each of the
plurality of reference compounds. For at least one test compound (whose effects in
the cell-based assay are not known), the extent of binding of the ion channel to each
of the binding partners in the presence of the test compound is determined, such that
the test compound's binding profile can be characterized by the relative differences
between the binding results for that compound. The binding profile of each reference
compound is then compared to the binding profile of the test compound, to identify
the reference compound having the binding profile that is most similar to the test
compound binding profile. Identification of a reference compound binding profile
that is similar to the test compound binding profile indicates that the test compound
will achieve results in the cell-based assays similar to the results achieved by the
reference compound
BRIEF DESCRIPTION OF THE FIGURES
Figure 1 is a schematic representation of a method to identify, from a large
library of peptides, those peptides that display preferential binding to certain
conformations of a biomolecule (in the present case the ERα receptor stabilized in a
certain conformation due to the presence of a modulating compound such as estradiol
or raloxifene).
Figure 2 illustrates that phage clones could be identified that bind
preferentially to ERα that is conformationally stabilized by one compound.
Figure 3 lists the names of phage display peptides found to bind preferentially
to ERα stabilized by a target compound.
Figure 4 illustrates that, in the examples described herein, binding of the ERα
ligand binding domain (LBD) to peptides coupled to microspheres was detected using
flow cytometric analysis to detect the acquisition of orange fluorescence.
Figure 5 represents the multiplexed molecular interactions that can be utilized
to create Binding Profiles as described herein.
Figure 6 represents the use of flow cytometric analysis of multiplexed
microspheres to detect binding of ERα LBD to peptides, as described herein.
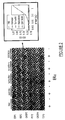
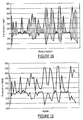
Figure 7 is a Binding Profile of ERα and various cofactor peptides. Extent of
binding is represented on the vertical axis by Mean Fluorescence Intensity (MFI);
cofactor peptides are referenced on the horizontal axis.
Figure 8 is the Binding Profile of Figure 7, graphed using basal subtraction to
show the increase or decrease in ERα binding in the presence of a compound,
compared to basal binding (no compound) .
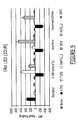
Figure 9 is a Binding Profile of ERα and various phage-identified binding
peptides.
Figure 10a compares the binding of ERα LBD to peptide SRC-1(2) in the
presence of various compounds (compared to basal binding; vertical axis) and the
results obtained in the ERE cell-based assay (horizontal axis).
Figure 10b compares the binding of ERα LBD to peptide RIP 140(3) in the
presence of various compounds (compared to basal binding; vertical axis) and the
results obtained in the ERE cell-based assay (horizontal axis).
Figure 10c compares the binding of ERα LBD to peptide AIB(2) in the
presence of various compounds (compared to basal binding;vertical axis) and the
results obtained in the ERE cell-based assay (horizontal axis).
Figure 10d compares the binding of ERα LBD to peptide TIF2(2) in the
presence of various compounds (compared to basal binding; vertical axis) and the
results obtained in the ERE cell-based assay (horizontal axis).
Figure 11a graphs the results of the MCF-7 cell proliferation assay for varying
concentrations of estradiol (horizontal axis), wherein proliferation of a human breast
cancer cell line is assessed by [3H]-thymidine incorporation (counts per minute
(CPM) on vertical axis). MCF-7 potency = (pEC50 or pIC50)(%cpm max or % cpm
min).
Figure 11b graphs the results of the MCF-7 cell proliferation assay for
varying concentrations of raloxifene (horizontal axis), wherein proliferation of a
human breast cancer cell line is assessed by [3H]-thymidine incorporation (counts per
minute (CPM) on vertical axis). MCF-7 potency = (pEC50 or pIC50)(%cpm max or
% cpm min).
Figure 12a compares the binding of ERα LBD to peptide SRC-1(2) in the
presence of various compounds (compared to basal binding; vertical axis) and the
results obtained in the MCF-7 cell-based assay (horizontal axis).
Figure 12b compares the binding of ERα LBD to peptide RIP140(3) in the
presence of various compounds (compared to basal binding; vertical axis) and the
results obtained in the MCF-7 cell-based assay (horizontal axis).
Figure 12c compares the binding of ERα LBD to peptide AIB(2) in the
presence of various compounds (compared to basal binding; vertical axis) and the
results obtained in the MCF-7 cell-based assay (horizontal axis).
Figure 12d compares the binding of ERα LBD to peptide TIF2(2) in the
presence of various compounds (compared to basal binding; vertical axis) and the
results obtained in the MCF-7 cell-based assay (horizontal axis).
Figure 13 graphs the results of the Ishikawa cell stimulation assay for varying
concentrations of raloxifene and estradiol (horizontal axis), wherein stimulation of
endometrial cells is measured by stimulation of intrinsic alkaline phosphatase (A405-blank;
vertical axis). %Emax = 100*(A405 compound-blank)/(A405 estradiol-blank).
Figure 14a compares the binding of ERα LBD to peptide SRC-1(2) in the
presence of various compounds (compared to basal binding; vertical axis) and the
results obtained in the Ishikawa cell-based assay (horizontal axis).
Figure 14b compares the binding of ERα LBD to peptide T1P3 in the
presence of various compounds (compared to basal binding; vertical axis) and the
results obtained in the Ishikawa cell-based assay (horizontal axis).
Figure 14a compares the binding of ERα LBD to peptide GW5P2 in the
presence of various compounds (compared to basal binding; vertical axis) and the
results obtained in the Ishikawa cell-based assay (horizontal axis).
Figure 15 is a representation of a Binding Landscape consisting of Binding
Profiles for two compounds, compared using basal subtraction.
Figure 16 illustrates how the bar graph of Figure 15 can be converted to a
profile plot.
Figure 17 is the profile plot of the Binding Landscape of Figure 15.
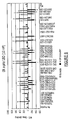
Figure 18 is a Binding Landscape of three compounds (GW5616, estradiol,
and raloxifene).
Figure 19 is a Binding Landscape of three compounds (GW5616, GI7500
and lasofoxifene).
Figure 20 is a Binding Landscape of two compounds (GI7500 and GI4927).
In the Ishikawa cell-based assay, GI7500 = 8.9% and GI4927 = 28.2%.
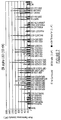
Figure 21 is a Binding Landscape of 145 compound Binding Profiles.
Figure 22 is a Binding Landscape showing a subset of compounds (reference
compounds) of Figure 21.
Figure 23 is a Binding Landscape of 145 compound Binding Profiles,
showing the dendrogram utilized in cluster analysis.
Figure 24 shows the Binding Landscape of Figure 23 divided into twelve
clusters.
Figure 25 shows the clusters of Figure 24 correlated to data from the ERE
cell-based assay.
Figure 26 shows the clusters of Figure 24 correlated to data from MCF-7 cell
proliferation assay.
Figure 27 shows the clusters of Figure 24 correlated to data from the Ishikawa
cell-based assay.
DETAILED DESCRIPTION
Typically, novel or uncharacterized compounds that are believed to bind to,
and therefore affect the function of a biological receptor, are studied using cell-based
assays, where the cell-based assays have been shown to respond to modulation of that
receptor. For example, in studying a compound believed to bind to the ERα ligand
binding domain, and affect the function of the estrogen receptor, one skilled in the art
would readily know of various cell-based assays in which the outcome of the assay
indicates a favorable ERα activity or an unsuitable ERα activity. Due to the time and
resources required to conduct cell-based assays, methods of predicting how a
compound will act in cell-based assays are useful to prioritize potential
pharmaceutical compounds for further study. By selecting compounds most likely to
provide the desired cell-based assay results, identification of lead compounds for
pharmaceutical development will be facilitated.
The present invention utilizes the conformational plasticity of biomolecules,
and the variation in binding of biomolecules to binding partners due to the
conformation of the biomolecule, in methods that allow one to predict the results an
uncharacterized compound will provide in an associated cell-based assay. In such
methods, a selected set of binding partners is assessed to determine the relative
binding of each binding partner to a selected biomolecule/ligand pair (a Binding
Profile). A plurality of Binding Profiles are created, each Binding Profile utilizing a
common set of binding partners and the same biomolecule, but different modulating
compounds (ligands) (and optionally a control Binding Profile in which no
modulating compound is used). The modulating compounds preferably include at
least one known agonist for the biomolecule activity and at least one known
antagonist, and more preferably also include modulating compounds that have partial
agonist and antagonist activities. At least some of the modulating compounds have
been further characterized using cell-based assays (where the cell-based assay is
responsive to conformational modulation of the biomolecule). Compounds that have
been characterized in at least one such cell-based assay are referred to herein as
"reference" or "tool" compounds.
In a Binding Profile, the extent of binding may be assessed as an absolute
value, or as a relative value (relative to binding in the control (no binding partner)
situation, or as relative binding in the absence of compound (basal peptide binding),
or relative to binding to a single reference compound).
The multiple Binding Profiles are then compiled into a Binding Landscape, as
described below. The Binding Landscape includes Binding Profiles for both
reference (or "tool") compounds, as well as uncharacterized (or "test") compounds.
The Binding Landscape then undergoes cluster analysis, to group similar Binding
Profiles into clusters.
The present inventors have discovered that, using the above method and
comparing the Binding Landscape clusters to associated cell-based results, one can
readily predict the results an uncharacterized compound will provide in an associated
cell-based assay. Accordingly, the present invention provides methods of analyzing
Binding Profiles to detect and predict Structure Activity Relationships (SARs)
between modulating compounds and associated cell-based assays.
It will be apparent to one skilled in the art that a Binding Profile may be
added to an already completed Binding Landscape (where a common set of binding
partners and the same biomolecule are utilized), creating a "new" Binding Landscape
which can be subjected to cluster analysis. In other words, adding a Binding Profile
to a Binding Landscape does not require that the Binding Profiles for each reference
or test compound be recreated. Similarly, where it is desired to add a binding partner
to the Binding Landscape analysis, the additional binding partner can be studied with
each biomolecule/ligand pair, and this new binding information added to existing
Binding Profiles, and used to create a new Binding Landscape. In other words, the
data produced and used in a first Binding Landscape analysis may be re-utilized in a
second Binding Landscape analysis without the necessity of re-creating the in vitro
studies that initially provided the data.
Thus in one embodiment of the present invention, the effect of various
modulating compounds (reference and test compounds) on the binding of a
biomolecule target to a plurality of binding partners is investigated, and used to
predict the effects of the uncharacterized compounds in associated cell-based assays.
Suitable biomolecules that may be studied by the present methods include, but are not
limited to, nuclear receptors, GPCRs, ion channels, and 7-transmembrane receptors.
The biomolecule may be full-length or may be a fragment of the biomolecule that
contains a binding domain.
The present method of acquiring conformation-based binding data to predict
cellular responses can be applied to various classes of biomolecule receptors where
activities such as conformational changes, associations of protein or DNA binding
partners, or homo- hetero-dimerization can be modulated by small molecules.
Examples of such receptors suitable for use as target biomolecules in the present
methods include seven transmembrane receptors, ion channels, transcription factors or
repressors, and other signaling molecules.
For example, a typical seven transmembrane G-protein coupled receptor or □-adrenergic
receptor can be recombinantly expressed, purified, and then reconstituted
into vesicles or liposomes (Levitzki, (1985) Biochimica et Biophysica Acta. 822: 127-53;
McIntire et al. (2002) Methods in Enzymology 343: 372-93). The receptor will be
incorporated into the lipid vesicle in one of several orientations, such as extracellular
side out and intracellular side in or vice versa. This protein can be labeled with an
appropriate fluorophore. Binding partners, such as G-proteins, kinases, transcription
factors, or peptides identified by an affinity selection technique such as phage display,
can be biotinylated and then attached to a streptavidin-coated fluorescent
microsphere. A small molecule that binds to the fluorescently-labeled transmembrane
receptor can induce a conformational change in the receptor which enables
association or dissociation with a number of binding partners that are attached to a
particular fluorescent bead. These binding events are related to stimulation of a
signaling cascade and ultimately are related to an effect that a small molecule has on a
cell. This approach of obtaining a membrane receptor and using lipid vesicle
reconstitution can be applied to other classes of receptors such as ion channels,
hematopoetic single membrane-spanning receptors, immunoglobulin-like receptors,
ATPases, and/or integrins.
The binding partners used to create a Binding Profile may include full length
coactivator, coregulator, or corepressor proteins for the biomolecule, phage display
peptides that have been determined to bind to the biomolecule; as well as fragments of
coactivator, coregulator, or corepressor proteins that are known to bind to the
biomolecule, or that contain known binding motifs for that biomolecule. In addition,
proteins and DNA fragments that are discovered to be binding partners or promoter
elements, respectively, may also be used to create a Binding Profile.
Suitable modulating compounds include known agonists, antagonists, or
compounds having partial agonist and partial antagonist effects on the target
biomolecule, and test or uncharacterized compounds whose effects on, or binding to,
the target biomolecule are unknown.
The present methods utilize the multiplexed binding assay as described in WO
01/75443 (Consler et al., Glaxo Group Limited) to generate a Binding Profile for a
preselected receptor and a set of binding peptides, in the presence or absence of a
modulating compound. See also Iannone et al., Cytometry 44:326 (2001); Iannone,
Clinics in Laboratory Medicine, 21(4): 731 (2001).
A Binding Profile is thus a compilation of binding data for a particular
receptor or biomolecule, a plurality of binding partners, and the presence of a
particular modulator (or no modulator), or combinations of modulators. Preferably,
what is measured is, for each binding partner, the percentage of available binding
partner moieties that are boudn to the biomolecule under the assay conditions, in the
presence of a modulating compound (or no modulating compound). The individual
binding assays are conducted under similar conditions, so that results can be
compared within a Binding Profile. For example, using a multiplexed system where a
plurality of interactions are studied in a single volume aids in ensuring the use of
similar conditions. For ease of interpretation a Binding Profile may be represented
graphically, e.g., as a bar graph or profile plot (see Figure 15). The Binding Profile
allows one to compare the extent of binding, among a plurality of binding partners, to
a plurality of ligand-bound biomolecules. See WO 01/75443, the contents of which
are incorporated herein by reference in their entirety.
According to the present invention, multiple Binding Profiles are compiled
into a Binding Landscape. The individual Binding Profiles must contain a common
set of binding partners and the same target biomolecule, but differ in the modulating
compound used. For Binding Profiles that are compiled into a single Binding
Landscape, the binding assays are conducted under similar conditions such that
binding results can be compared among the Binding Profiles ("similar conditions" as
will be apparent to one skilled in the art).
Once a Binding Landscape has been prepared for a biomolecule, a Binding
Profile for a test compound can be assessed using the Binding Landscape, to predict
the test compound's activity in associated cell-based assays.
It will be apparent to one skilled in the art that an initial Binding Landscape
may be prepared using only reference compounds, and subsequently Binding Profiles
for individual test compounds may be added to and analyzed with the Binding
Landscape. Alternatively, an initial Binding Landscape may be prepared that
includes multiple reference compounds as well as one or more test compounds.
Binding Profile Example: ERα
A combination of three Binding Profiles uisng the ERα LBD as the
biomolecule target is shown in Figure 7. Each Binding Profile represents a set of 39
binding peptides (synthesized fragments of biotinylated corepressors, coactivators and
coregulators) as well as a 'no-peptide' control. The Binding Profiles were run with
either estradiol or 4-OH Tamoxifen as the modulating compound, and a basal or
control Binding Profile was run without any modulating compound. The vertical axis
shows Mean Fluorescence Intensity (MFI) and is an indicator of the percentage of
each peptide class that was bound by ERα LBD.
Figure 8 shows the data as graphed in Figure 7, but graphed to show the
change in binding, with the basal (no modulator) binding subtracted (basal
subtraction). It is apparent from Figure 8 that the presence of 4-OH tamoxifen
decreases or only slightly increases binding of the tested binding partners, compared
to basal levels. In contrast, estradiol increases binding of ERα to most of the binding
peptides.
Figure 9 shows ERα LBD binding to six phage-identified peptides in the
presence of four different modulating compounds. K7P2 binding is increased in the
presence of estradiol, and not in the presence of the anti-estrogen compounds 4-OH
tamoxifen, or in the presence of idoxifene or levormeloxifene. As used herein, a
compound with estrogenic effects is one that stabilizes the estrogen receptor in a
conformation that promotes binding to coactivators, whereas a compound with anti-estrogenic
effects stabilizes the receptor in a conformation that decreases binding to
coactivators. Accordingly, K7P2 is identified as a useful peptide to use in Binding
Profiles, to indicate compounds that have estradiol-like (estrogenic) effects on ERα.
The present inventors discovered that Binding Profiles created using known
receptor modulators (where the effects of those modulators are also known in cell-based
assays responsive to modulation of the target biomolecule), could be analyzed
to predict the cell-based activity of an uncharacterized modulator. In other words,
raloxifene + ERα produces a certain Binding Profile for a selected set of binding
proteins. Raloxifene used in cell-based assays will also produce consistent results in a
cell-based assay, where that cell-based assay is responsive to ERα ligands. By
comparing the ERα Binding Profile of an uncharacterized ERα modulating compound
with Binding Profiles of characterized ERα modulating compounds, it is possible to
predict how the uncharacterized compound will act in cell-based assays. The
prediction is not based on the comparison of any one binding peptide, but is based on
a comparison of the collection of responses to the set of binding peptides (the Binding
Profile). This method is also useful for rapid determination that an uncharacterized or
novel ERα modulating compound is different than a characterized compound, by
determining that its Binding Profile is unique compared to that of the characterized
compound, or collection of known compounds.
While not wishing to be held to a single theory, the present inventors believe
that the results in cell-based assays are dependent on the relative extent of in vivo
binding among multiple binding partners, and have determined that in vitro binding
assays are predictive of cell-based behavior. Further, the present inventors have
determined that binding peptides identified by screening phage display libraries (i.e.,
peptides that may or may not be present in the cell-based assays) also have predictive
value in the present methods. The phage display libraries to be screened may be
random, unfocused libraries.
Using the high-throughput generation of Binding Profiles to predict the
activity of an uncharacterized compound in a cell-based assay allows the selection of
the most promising new candidates from a library of candidate compounds. In this
manner, high-throughput methods can be used to prioritize candidate compounds for
testing in more laborious cell-based assays, and/or to exclude the unpromising or least
desirable candidates.
Binding Landscapes
Using Binding Profiles generated as above, a Binding Landscape was
compiled, and was then analyzed to predict the effect of uncharacterized compounds
in ERα -responsive cell based assays.
As shown in Figure 15, the peptide Binding Profiles for two or more
modulator compounds (using the same target biomolecule and set of binding
partners), can be represented as a Binding Landscape, where one dimension (height of
each bar in Figure 15) represents the increased or decreased amount of peptide
binding to the target biomolecule for a particular biomolecule/ligand combination. In
Figure 15, binding is increased or decreased compared to binding in the absence of
any modulating compound (the basal binding). It will be readily apparent to those
skilled in the art that the precise graphical representation of a Binding Landscape may
vary; Figure 15 is an example of a Binding Landscape in a bar graph format, with the
vertical axis representing increase or decrease in binding over basal binding.
Alternatively, a 'basal' binding level could be determined using a reference
modulating compound (rather than no compound); the increase or decrease in binding
achieved in the presence of other compounds would be reported as the
increase/decrease over that achieved with the reference compound.
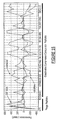
As shown in Figures 16 and 17, the bar heights of Figure 15 may be made
continuous, to provide a better graphical representation of the distinctive Binding
Landscape pattern. In Figures 16 and 17, the vertical axis represents the amount of
binding minus the basal level of binding (as indicated by the fluorescence
measurement).
By preparing a Binding Landscape comprising multiple reference or tool
compound Binding Profiles, and comprising at least one Binding Profile for an
uncharacterized compound, one can predict the uncharacterized compound's effects in
associated cell-based assays. In this manner, by analyzing uncharacterized
compounds in Binding Landscapes, one can identify novel compounds that are most
likely to function in cell-based assays in a desirable manner. Alternatively, one can
identify uncharacterized compounds that are likely to provide cell-based assay results
that are unlike any of the reference compound results, and to identify those with
undesirable cell-based assay effects.
Figure 18 shows a Binding Landscape for ERα compiled of the Binding
Profiles of estradiol, raloxifene, and GW5616 (the set of binding peptides is
represented on the horizontal axis). It is readily apparent that the Binding Profile of
GW5616 is more similar to raloxifene than to estradiol, yet there are features of the
Binding Profile of GW5616 that make it distinct from both tool compounds.
Figure 19 compares the Binding Profiles for two experimental Selective
Estrogen Receptor Modulators (SERMs) and lasofoxifene. As shown, Compound
7500 gives a unique peptide binding profile. When tested in the Ishikawa cell based
assay, Compound 7500 gave %Emax = 8.9% ± 2.7% These cell based assay results
for Compound 7500 were also distinct from the results obtained with raloxifene.
Figure 20 compares the Binding Profiles for two SERM compounds, 7500
and 4927. Note that both Figure 19 and Figure 20 show the same binding profile for
compound 7500 but using different scales. The overall appearance of the Compound
7500 Binding Profile differs between these Figures only because the scale is different,
and illustrates that Binding Profile data may be displayed in different visual formats.
Within a Binding Landscape, however, the individual Binding Profiles must be
graphically represented in the same manner, and each must contain a common set of
binding partners.
Similarity of Binding Profiles
As used herein, "similar" Binding Profiles are those that are grouped together
by a clustering analysis. Clustering, as applied here, is a quantitative approach used
to characterize and segregate some number of individual objects into a smaller
number of groups, or clusters. Members of a cluster have more in common with one
another than with objects in other clusters. One common use or interpretation of a
clustering analysis is that members of a cluster will exhibit similar characteristics or
behaviors outside of those used as a quantitative measure in the clustering analysis
itself.
The criteria by which the objects are compared are the 'descriptors', and in
the present invention are the binding profile data. Each set of binding data for one
binding partner constitutes one 'dimension' in 'descriptor space'.
This clustering analysis has three components: (1) the quantitative measure of
similarity between peptide binding profiles of individual compounds, (2) the
quantitative measure of similarity between clusters, and (3) the particular
methodology for forming clusters based on the similarity within (1) and between
candidate clusters (2).
As an example, consider a matrix of peptide binding data arranged so that the
data for each compound lies along one row, where the binding measurements for each
peptide occupy a series of adjacent columns. A profile for one compound can be
characterized by the relative differences between the different peptide binding results.
This can be quantitated as the slope (or gradient)between adjacent peptide binding
results. The quantitative measure of similarity between two compounds (1) is the
euclidian distance between the slopes of those compounds' profiles between each pair
of result columns. THis method focuses on the pattern of relative activity across
multiple columns of data, without consideration of the absolute magnitude. This
comparison between two profiles is termed the 'shape' based clustering in Spotfire
Decision Site, a commercial application useful for such analyses.
To quantitate the similarity, or 'distance' between two clusters (2), the mean
similarity between all members of the two clusters is calculated. Finally, a
hierarchical agglomerative method can be used to carry out the actual formation of
clusters. This approach begins with each individual compound as a cluster, and by
way of the similarity measrues described above, combines individuals to form
clusters. Iteratively, all members can be combined into one cluster, and a tree-like
structure or dendogram can be used to illustrate the relationship between the clusters
at each step of combination or 'agglomeration'. The choice of the number of clusters
ultimately used to represent the data may be made by selecting a boundary line
through the cluster tree. This is subjective, but targets a balance between having
many homogeneous profiles within any given cluster, and having too many clusters
containing one or few compounds.
Dimension Reduction in Binding Landscape
The present inventors determined that in some Binding Landscapes data from
a subset of the binding partners may provide the majority of the variation in binding
among the biomolecule/ligand pairs studied. Where, for example, a peptide bound to
every biomolecule/ligand pair in essentially the same manner (or did not bind to any ),
that binding partner would not contribute in a meaningful way to predicting cell-based
assay results. Additionally, where multiple binding partners mimicked each others'
responses to the biomolecule/ligand pairs studied (i.e., were correlated), most of those
should be removed from the Landscape analysis to reduce possible bias due to
overrepresentation of the binding effects represented by these binding partners.
For example, in a study described herein using ERα LBD, a set of 45 binding
peptides (plus a no-peptide control = 46 peptide variables), and 145 different
modulator compounds, it was determined that 21 of the original 46 peptide variables
accounted for ≥ 99% of the variation detected. Subsequent clustering analysis was
conducted with the Binding Profile data for these 21 peptide variables.
Accordingly, it is preferable that dimensional reduction analysis be carried out
on a Binding Landscape, to identify and remove correlated data, and to remove the
least informative binding partners. Dimensional reduction may be accomplished
using any suitable statistical method as is known in the art. One such method is
Principal Components Analysis (PCA), which may be accomplished using the JMP
program (available from SAS Institute, Cary, NC). Preferably PCA will be conducted
and those components will be selected that represent at least about 80% of the
variation in the data, more preferably at least about 85%, 90%, 93%, 95% or more,
most preferably 98% or 99%. For each of the chosen components, binding partners
representing contributions of more than 25% to each of these components are
preferably selected as data dimensions in the subsequent analysis. As will be apparent
to those skilled in multivariate analysis, methods other than PCA, and/or software
other than JMP may be used for dimensional reduction within a Binding Landscape.
As used herein, "binding peptides" are peptides that bind preferentially to at
least one form of a biomolecule target. The biomolecule target may be in a liganded
or unliganded form, and binding of the binding peptide to the biomolecule may vary
depending on the conformation of the biomolecule.
As used herein, a "biomolecule" refers to a molecule that functions within a
living organism by interacting with other molecules, including protein/protein
interactions, nucleic acid/protein interactions, and nucleic acid/nucleic acid
interactions. Furthermore, these functional interactions are frequently modulated by
an additional molecule or molecules to form a macromolecular functional unit.
Biomolecules include but are not limited to nuclear receptors, GPCRs, 7TMs, and ion
channels. Assays that have traditionally been used to evaluate these functional
interactions include enzyme activity assays, ligand binding assays, endpoint assays,
kinetic binding assays, competitive binding assays, hybridization reactions,
BIACORE, homogeneous time-resolved fluorescence, scintillation proximity assays,
and others.
As used herein, a cell-based assay "responsive" to modulation of a given
biomolecule is one in which the measured outcome of the assay is altered depending
on the activity of that biomolecule. In other words, the cell-based assay is useful to
indicate when functional modulation of that biomolecule has occurred.
As used herein, a "test" or "uncharacterized" compound is one whose activity
in a particular cell-based assay is not known. An uncharacterized compound may
have a known chemical structure or an unknown structure. A compound may be
"uncharacterized" with respect to one cell-based assay, but characterized with respect
to a different cell-based assay.
As used herein, a "reference" or "tool" compound is one whose activity in a
particular cell-based assay is known. A characterized compound may have a known
chemical structure or an unknown structure. A compound may be "characterized"
with respect to one cell-based assay, but uncharacterized with respect to a different
cell-based assay.
As used herein, a "modulating compound" for a particular biomolecule is one
that binds to that biomolecule and induces a conformational change. For example both
estradiol and raloxifen are modulating compounds for ERα.
As used herein, "in a single assay" means a single assay volume (e.g., a single
tube or well). The single assay can be a multiplexed assay in which simultaneous, or
near simultaneous, determinations of binding events can be measured from the same
assay process. For example, numerous first members, second members, and
additional members of numerous binding complexes can be added to the same assay
process for subsequent identification and analysis.
"Relative binding" means the amount of binding that occurs between one
binding pair as compared to another binding pair. For example, one first member of a
binding pair may have relatively higher binding to one specific second member than
to a different second member. One first member may have higher binding to one
second member as compared to the binding between a different first member and a
different second member. Similarly, a specific first and a specific second member
may have higher relative binding compared to a different first member and different
second member. The amount of binding can include the absence of binding.
"Conditions that allow binding" of binding components, (biomolecules,
binding partners, modulating agents) refer to those parameters that are conducive to
the binding event, as would be understood by one skilled in the art. Such conditions
can include, for example, pH, time, temperature, and buffer composition. Such
conditions do not require that all binding components are involved in binding
interactions, only that the conditions allow for specific binding interactions to occur
By "binding pairs" is meant at least two binding members that have bound
together, or are capable of preferentially binding together. A modulating agent may
bind to either member of a biomolecule-binding partner binding pair, and may
prevent or enhance binding between these members of the binding pair. By "binding
complex" is meant at least a binding pair and, optionally, a third member and/or a
modulating agent. In some cases the modulating agent may allow binding between
two members of a binding pair that do not form a binding pair in the absence of the
modulating agent. A biomolecule-ligand pair refers to a biomolecule and a ligand
(modulator or compound) capable of binding to the biomolecule. When bound, this
may be referred to as a "liganded biomolecule".
As used throughout, the "contacting" step of the present invention is
preferably in vitro.
Microspheres used in the present methods may include one or more
fluorescent "labels mixed together to constitute a specific "label" for a subset of
microspheres. For example, it is well known in the art that microspheres can be
labeled with two or more fluorochromes mixed together in varying concentrations,
such that each specific label has a specific concentration of each fluorochrome. It is
the specific concentrations of the various fluorochromes together that provide a
spectrum of labels that can be used to distinguish among subsets of labeled
microspheres.
Microspheres used in the present inventions preferably have a plurality of the
same molecule (binding partner or biomolecule) coupled to it. By "a set of
microspheres" is meant a plurality of microspheres consisting of subsets of
microspheres labeled with distinguishable labels. By coupling each subset to a
specific first member, or a plurality of the same first member, a specific label for each
first member species is provided.
"Coupled directly or indirectly" will be understood by one skilled in the art to
include various methods for coupling. For example, binding partners or biomolecules
used in the present methods can be coupled directly or indirectly to microspheres,
using streptavidin, biotinylation or maleimide or can be carboxylated. One skilled in
the art would recognize that other coupling agents can be used.. See, e.g., WO
99/19515 and WO 99/37814, which are incorporated herein by reference in their
entirety for types of functional groups that can be used for coupling agents to the
microspheres. Optionally, a linker can be used between the microsphere and the
agent.
Labels can also be coupled to the microspheres, agents to be screened, or
second members using a variety of methods known in the art. As used throughout,
"label" refers to a moiety (e.g., a hapten) that provides a means for labeling, as well as
radiolabels, and fluorescent labels. Thus, labels can be radiolabels, dyes, fluorescent
labels, or a combination thereof. One skilled in the art would recognize that
numerous fluorochromes are available for use in the present method.. See, e.g., WO
99/19515 and WO 99/37814, which are incorporated herein in their entirety for types
of fluorescent dyes and fluorochromes that can be used as labels.
One skilled in the art would recognize that a variety of types of microspheres
can be used in the methods of the present invention. See, e.g., WO 99/19515 and WO
99/37814, which are incorporated herein in their entirety for types of microspheres
and methods of making and using same. For example, the microspheres can be
polystyrene-divinylbenzene microspheres.
By "detecting the presence" of a label means detecting any amount of label.
Thus, in some cases the amount of label may be an absence of the label.
As used throughout, "a binding profile" is a systematic summary of binding
data such that the binding profile indicates the relative binding between a first
member and second members of various binding pairs. The binding of the first and
second members may be influenced by the presence of a third agent, such as a
modulating compound.
As used herein, binding partners may be selected from a group comprising
cofactors, receptors, receptor ligands, proteins, peptides, protein domains,
oligonucleotides, transcription factors, nucleic acids, small molecules, and small
compounds, any of which can be synthetic, modified, or naturally occurring.
By "small molecules" is meant natural or synthetic organic molecules less
than about 1000 daltons and, more preferably, less than about 500 daltons. Small
molecules, for example, include estradiol, cyclic nucleotides, retinoic acid, steroid
hormones, amino acids, neurotransmitters (e.g., norepinephrine, epinephrine,
acetylcholine), and numerous other compounds.
As used herein, "receptor" includes but is not limited to orphan receptors or
nuclear receptors. As used herein, "orphan receptors" are molecules identified as
having receptor or receptor-like domains or tertiary structures but lacking a known
function. Thus, the present methods can be used to characterize the binding profile of
an orphan receptor in an effort to characterize the function of the receptor. Nuclear
receptors include, for example, all known receptors identified by the Nuclear
Receptors Nomenclature Committee, 1999. See Vincent Laudet, Johan Auwerx, Jan-Ake
Gustafsson, and Walter Wahli; A Unified Nomenclature System for the Nuclear
Receptor Superfamily, Cell (1999) 97: 161-163, which is incorporated herein in its
entirety by reference for the identification of known nuclear receptors. Nuclear
receptors also include, for example, receptors that have yet to be identified but have at
least one function or have at least one characteristic of known nuclear receptors.
"Cofactors" or "coregulators" as used throughout can refer to coactivators,
corepressors, or a combination of coactivators and corepressors. Examples of nuclear
receptor cofactors include, for example, those identified in Daniel Robyr, Alan
P.Wolffe and Walter Wahli, Nuclear Hormone Receptor Coregulators in Action:
Diversity for Shared Tasks, Mol.Endocrinol. (2000) 14: 329-347, which is
incorporated herein in its entirety for examples of nuclear receptor cofactors.
By "conditions that allow formation of detection products" means conditions
in which first members can bind to second members, and preferably conditions in
which modulating agents can bind to either the first member, second member, third
member, or some combination thereof. Such conditions do not require that all first
and second members bind or that all third members bind, only that the conditions
allow for specific binding interactions to occur. These conditions include, for
example, pH, time, temperature, and buffer composition, which allow binding
between the members and agents of interest.
A "set of microspheres" comprises one or more subsets of microspheres
wherein each subset comprises a plurality of microspheres labeled with the same label
or combination of labels and wherein each label or combination of labels is specific
for that subset.
The present invention is more particularly described in the following examples
which are intended as illustrative only, as numerous modifications and variations
therein will be apparent to those skilled in the art.
Throughout this application, various publications are referenced. The
disclosures of these publications in their entireties are hereby incorporated by
reference into this application in order to more fully describe the state of the art to
which this invention pertains.
Although the present process has been described with reference to specific
details of certain embodiments thereof, it is not intended that such details should be
regarded as limitations upon the scope of the invention except as and to the extent that
they are included in the accompanying claims.
EXAMPLE 1
Identification of Binding Peptides using Phage Display
("Affinity Selection")
Phage display was used to identify binding peptides that preferentially bind to
certain conformations of the ERα receptor. Such peptides are useful in the production
of Binding Profiles for that receptor. Methods of phage display and selection are
known in the art (see e.g., US Patent 5,837,500, WO 97/35196; WO 98/19162; Norris
et al., Mol. & Cell. Biol. 19(12):8226-39, 1999; Wijayaratne et al. Endocrinology
140(12):5828-40, 1999; Norris et al., Science 285(5428):744-6, 1999; Paige et al,
Proc. Natl Acad. Sci. (USA) 96(7):3999-4004, 1999.
As shown in Figure 1, a phage display library of approximately 1010 different
peptides was constructed and screened. The phage library particles were contacted
with the target receptor of interest (ERα ligand binding domain) in both the
unliganded form and the liganded (receptor + modulating compound) form. In this
example, modulating compounds used included estradiol, tamoxifen, raloxifene, and
GW5638.
After washing to remove unbound phage and then eluting the phage that
remained bound to the receptor, the eluted phage was used to infect additional host
cells and the process repeated. The phages identified as binding to the receptor were
retained, their DNA was isolated and sequenced, and phage clones were characterized
by phage ELISA. Phage ELISA is a characterization step to confirm that the phage
displayed peptide binds the receptor, and also binds to the receptor in the presence of
the identified modulating compound.
Peptides were identified that bound specifically to specified ERα/modulator
pairs. As shown in Figure 2, selected phage clones were found that bound
preferentially to estradiol + ERα (peptide E9P1) under these conditions, but did not
bind to ERα + tamoxifen, ERα +raloxifene, or ERα + GW5638 under the same
conditions. ERα+estradiol was shown to bind to E9P1 and P3P2 under these
conditions, but not R5P2; wherease ERα+raloxifene was shown to bind to R5P2 but
not E9P1 or P3P2 under these conditions.
Seven of the peptides, ranging from K7P2 (identified as a "pan agonist"
selective peptide, or one that would bind to most agonist/ERα pairs to CP7P2
(identified as a "pan antagonist") were studied for their binding to a series of eight
benzothiazipine ERα ligands having varied agonist - antagonist activity.
Table 1
indicates that the relative binding of the peptides to the compound/ER pairs was an
indicator of relative agonist or antagonist activity of the compound. Accordingly,
these peptides would be informative in Binding Profiles for ERα.
Such peptides that are known to bind preferentially to a receptor in the resence
of a particular modulating compound are useful in the production of Binding Profiles
and Binding Landscapes as described herein.
A variety of conformation-sensing peptides have been identified. Figure 3
lists the peptide name, the conditions used for identification of the peptides, and a
brief description of the specificity of the particular phage-displayed peptide.
EXAMPLE 2
Binding Profiles for ERα: Methods
Example of multiplex microsphere based binding profile:
Utilizing aspects of the Multiplexing method as described in WO 01/75443,
ERα Binding Profiles were generated for 145 different estrogen receptor modulator
compounds, including agonists and antagonists, and those with unique tissue selective
activity (e.g., idoxifene, levormeloxifene).
Forty-five binding peptides were utilized, including six peptides identified by
phage display as binding to ERαLBD/modulator pairs, 32 fragments of known
LXXLL-containing coactivator proteins, five fragments of LXXLL-containing coregulator
proteins, and two fragments of corepressor proteins (see Table 2).
"Fragments" were artificially synthesized based on known protein sequences; the
amino acid sequence numbers corresponding to the fragments are shown in the Table.
The short sequence motif LXXLL (where L is leucine and X is any amino
acid) is present in various nuclear receptor cofactor proteins, including RIP-140,
SRC-1 and CBP. It has been demonstrated that these short regions, commonly known
as NR boxes, are necessary and sufficient to mediate the binding of these proteins to
liganded nuclear receptors. Therefor, synthetic fragments containing the motif are
useful as surrogates for the complete protein in binding assays. It has been shown
that the ability of SRC-1 to bind the estrogen receptor and enhance its transcriptional
activity is dependent upon the integrity of the LXXLL motifs and on key hydrophobic
residues in a conserved hydrophobic groove of the estrogen receptor that are required
for its ligand-induced activation function. See e.g., Heery et al., Nature
387(6634):733 (1997).
| Phage-display | K7P2 (agonist sensing) |
| identified peptides | GW5P2 (GW5638 sensing) |
| | T1P3 (tamoxifen sensing) |
| | I8P2 (levormeloxifene/idoxifene sensing) |
| | N30P2 (GW4927 sensing) |
| | R5P2 (raloxifene sensing) |
| LXXLL-containing | TRIP2 (54-80) |
| Coactivator | TRIP3 (85-109) |
| peptides | TRIP4 (23-47) |
| | TRIP8 (26-47) |
| | TRIP9 (61-85) |
| | TRIP9 (275-301) |
| | RIP140 (119-143) |
| | RIP140 (172-196) |
| | RIP140 (366-390) |
| | RIP140 (487-511) |
| | RIP140 (699-723) |
| | RIP140 (8) (805-831) |
| | RIP140 (922-946) |
| | CBP-1 (58-80) |
| | CBP-2 (346-368) |
| | CBP-3 (2055-2078) |
| | SRC-1 (1)(626-642) |
| | SRC-1 (2) (676-700) |
| | SRC-1 (3) (735-759) |
| | TIF1 (368-392) |
| | TIF1 (711-732) |
| | TIF2 (627-651) |
| | TIF2 (676-702) |
| | TIF2 (732-756) |
| | TIF2 (864-888) |
| | AIB1 (102-123) |
| | AIB1 (607-631) |
| | RAC3 (671-697) |
| | PCIP (1027-1051) |
| | P300(1)(67-93) |
| | P300(2037-2061) |
| | p300AF(176-200) |
| LXXLL-containing | DAX (1-23) |
| Coregulator | DAX (66-90) |
| peptides | DAX (132-156) |
| | SHP (7-31) |
| | SHP (104-128) |
| Corepressor | N-CoR |
| Peptides | SMRT |
| Control | - no peptide - |
The peptide sequences were synthesized with biotin at one end, and coupled to
fluorescently distinct microsphere populations (5.6um streptavidin-coated latex
microsphere particles). Multiple peptides of the same sequence were coupled to
microspheres having the same fluorescent label, creating 46 fluorescently distinct
microsphere populations (45 peptides plus no-peptide control). The microspheres
populations were then multiplexed (combined). Alternatively, the ERα LBD could be
coupled to the fluorescent microspheres.
The Estrogen Receptor α Ligand Binding Domain (ERα LBD) was coupled to
the fluorophore Alexa 532 (Molecular Probes, Inc., Eugene, OR), which is suitable
for use with 532 nm excitation sources. The excitation and emission spectra of Alexa
532 is intermediate between the green-fluorescent Alexa Fluor 488 dye and the
orange-fluorescent Alexa Fluor 546 dye.
Binding Profiles using the above peptides and ERαLBD were generated for
145 compounds known to have estrogen receptor binding ability . These compounds
included examples from various chemical classes, including benzothiazipines,
napthalenes, triphenylethylenes, triazines, and benzopyrans. All of the compounds in
this set were initially tested for binding to the ERα LBD using an estradiol
displacement assay and were confirmed to have pKi ≥ 6, which is generally
considered desirable in candidate pharmaceutical compound. Binding Profiles were
also generated using 8 reference compounds: estradiol, 4-OH tamoxifen, raloxifene,
idoxifene, levormeloxifene, GI7604, GW5616 and lasofoxifene. Cell-based assay
results were known for these reference compounds in the ERE, MCF7 and Ishikawa
cell-based assays (described herein).
As shown in Figures 4, 5, 6, the multiplexed microspheres and ERα ligand
binding domain are then incubated with a compound (or no compound for control),
using 10nM of ERαLBD, 1uM of compound, and 2,000 microspheres of each of the
46 microsphere populations per well.
The resulting binding of peptide to LBD is detected by flow cytometric
analysis as is known in the art (see, e.g. WO 01/75443). In the present example,
binding of ERα to a microsphere subset was indicated by the acquisition of orange
fluorescence, detected using a LX-100 instrument (Luminex Corporation, Austin,
TX). The above procedure is repeated for each compound to create a library of
Binding Profiles.
Figures 7 and 8 show the extent of binding of the ERα LBD to the
coactivator, coregulator, and corepressor peptides, in the presence of either no
compound (basal), estradiol (1 uM) or 4-OH tamoxifen (1 uM). This data is
represented in Figure 7 as Mean Fluorescence Intensity, where fluorescence intensity
indicates the amount of ERα LBD that bound to a peptide-coupled microsphere
population in the presence of a particular compound. In Figure 8, the amount of
binding is represented by subtracting basal (no compound) binding, to show the
increase or decrease over basal. Figure 8 shows that for most peptides, the presence
of 4-OH tamoxifen reduced the amount of peptide binding compared to basal binding,
whereas estradiol increased peptide binding compared to basal levels.
Binding Profiles for each of the six phage-identified peptides described above
were also generated using the same multiplexed assay as described above. The
microsphere bound peptides were incubated as described above with 10nM ERαLBD
and 1uM of one of four ER binding compounds: estradiol, 4-OH tamoxifen,
idoxifene, levormeloxifene. Results are shown in Figure 9, where the binding of
peptides is indicated (using basal subtraction) on the vertical axis.
As indicated by Figure 9, the binding of these peptides identifies whether the
compound is estradiol-like (increased binding of K7P2 peptide over basal) or anti-estrogenic
(4-OH tamoxifen; decreased binding of K7P2 over basal, increased binding
of T1P3 over basal). The binding profiles are similar for idoxifene and
levormeloxifene, two compounds known to have similar in vivo ERα activity
(desirable bone protective effects).
EXAMPLE 3: Cell-Based Assays - Methods
The present inventors utilized three ERα responsive cell-based assays in
studying the effects of modulator compounds on the binding of peptides to ERα.
a) Estrogen Response Element (ERE) assay:
The Estrogen Response Element (ERE) assay was conducted by transiently
transfecting a T47D breast cell line with a plasmid containing (a) the frog vitellogenin
promoter which drives expression of a secreted placental alkaline phosphatase (SPAP)
reporter gene, and (b) a plasmid that expresses the full length ERα gene. The
vitellogenin promoter contains the consensus vitellogenin ERE sequence (F-vitERE).
See, e.g., Martinez et al., EMBO J, 6:3719(1987); Edmunds et al.,
Neurotoxicology 18:525 (1997). In this ERE assay, the presence of an ERα agonist
increases transcriptional activity of the reporter gene.
Compounds were evaluated for their potential to either stimulate
transcriptional activity (agonist mode, increasing concentrations of compound are
incubated with cells in the absence of a competing compound) or inhibit
transcriptional activity (antagonist mode, increasing concentrations of compound are
incubated with cells in the presence of a fixed concentration of estradiol).
Transcriptional activity was measured by acquisition of OD405 which indicates SPAP
activity. An EC50 (agonist mode) or IC50 (antagonist mode) was determined for each
compound tested. A compound's ERE potency is defined as pEC50 x %max (agonist
mode) or pIC50 x %min (antagonist mode).
b) Breast cell proliferation
Cell proliferation of MCF-7 breast cancer cells was determined by [3H]-thymidine
incorporation . Compounds were tested for their potential to either
stimulate MCF-7 proliferation or inhibit proliferation. An EC50 or IC50 was
determined for each compound tested. A compound's MCF-7 potency is defined as
pEC50 x %CPMmax (relative to estradiol) or pIC50 x %CPMmin (relative to
raloxifine).
c) Ishikawa Endometrial Cell Stimulation
The stimulation of human endometrial cells (Ishikawa cell line) was
determined by increases in intrinsic alkaline phosphatase activity. Compounds were
tested for their potential to stimulate endometrial cells, as compared to estradiol. The
%Emax is defined as 100 x (spectrophotometric reading at 405nm with compound-blank)/(spectrophotometric
reading at 405nm estradiol-blank).
EXAMPLE 4: Cell Based Assays - Results
ERE assay
Results of the ERE cell-based assay are shown in Figure 10, plotted against
binding assay results where multiple ER ligand compounds were tested for their
effects on ERα binding to LXXLL-containing coactivator peptides. In this example,
compounds were run in the agonist mode ERE assay in which compounds were tested
for their ability to increase reporter gene transcription. In Figure 10, each square
represents the results obtained with a single compound. The tool compound estradiol
is included in this compound set. Each compound is shaded according to its core
structure. Four example coactivator peptides are shown: SRC-1(2), AIB (2),
RIP140(3) and TIF2(2). The vertical axis indicates fluorescence minus the
fluorescence in the absence of compound. This difference indicates receptor binding
to the respective peptide in the presence of compound. A negative value indicates the
compound decreased binding of the coactivator peptide to ERα. The horizontal axis
represents a measure of reporter gene expression represented as (pEC50)x%maximal
response. As shown in Figure 10a, compounds that inhibit binding of SRC-1(2) to
ERα compared to basal binding (negative value on vertical axis) also tended to group
on the horizontal axis, showing they did not stimulate ERE activity (promote
transcription) in the cell-based assay.
MCF-7 Cell Proliferation
Results shown in Figure 11 for proliferation of MCF-7 cells in the presence of
estradiol or raloxifene. The vertical axis indicates counts-per-minute of 3H thymidine
incorporation, as a measure of proliferation; the horizontal axis indicates
concentration of the compound. These results indicate that as estradiol (agonist)
concentration increased cell proliferation increased, whereas cell proliferation
decreased as raloxifene (antagonist) increased.
Results for the MCF-7 cell proliferation assay are shown in Figure 12, where
multiple ER ligand compounds were tested for their effects on ERαLBD binding to
LXXLL-containing coactivator proteins. In Figure 12, each square represents the
results obtained with a single compound. The tool compounds estradiol and
raloxifene were included in this set and are shown labeled. Four coactivator peptides
are shown: SRC-1(2), AIB (2), RIP140(3) and TIF2(2). The vertical axis indicates
fluorescence minus the fluorescence in the absence of compound. This difference
indicates receptor binding to the respective receptor in the presence of compound.The
horizontal axis indicates the extent of cell proliferation compared to control. A
negative value indicates the compound decreased cell proliferation; a positive value
indicates the compound increased cell proliferation (relative to control).
Ishikawa Cell Stimulation Assay
The results of the Ishikawa cell stimulation assay are shown in Figure 13, for
estradiol and raloxifene. Estradiol increases stimulation of intrinsic alkaline
phosphatase, as measured on the vertical axis. Alkaline phosphatase activity for a
compound is measured by acquiring absorbance at 405nm (minus blank). As shown
estradiol stimulates this activity whereas raloxifene has very low stimulatory activity.
Figure 14 shows the results of the Ishikawa cell stimulation assay for multiple
ER ligand compounds, compared to their effects on ERαLBD binding to an LXXLL-containing
coactivator peptide (coactivator peptide SRC-1(2) and the phage-display
identified peptides T1P3 and GW5P2 ). In Figure 14, each square represents the
results obtained with a single compound. Shown in this set of compounds are the two
tool compounds estradiol and tamoxifen. The vertical axis indicates the extent of
receptor binding to each of the respective peptides.. A negative value indicates the
compound decreased peptide binding; a positive value indicates the compound
increased peptide binding . The horizontal axis shows the amount of alkaline
phosphatase activity induced by each of the compounds where the values are
expressed as a percentage relative to control.
EXAMPLE 5: Preparation of Binding Landscape
A Binding Profile provides information on the binding of a particular receptor
to multiple peptides, in the presence of a particular modulating compound (or without
any modulating compound, as a control) . The extent of each peptide's binding may
be reported, recorded or displayed in any suitable manner as will be apparent to one
skilled in the art. For example, the extent of binding may be given as an absolute
value, or as a "basal subtraction" value (binding with compound minus binding
without compound), or as a ratio (binding with compound/binding without
compound). These values may be graphically represented as shown in the figures
herein, or may be recorded and analyzed as numerical values (e.g., by storing and
analyzing using a computerand appropriate software).
However, within a Binding Profile, the values provided for the peptide binding
must be comparable -- i.e., obtained under similar conditions (except for the peptide
variable) and reported in similar units. Figures 7 and 8 graphically represent
Binding Profiles for estradiol and 4-OH tamoxifen, and control (no compound), in bar
graph form. Figure 7 provides the data in absolute form; Figure 8 provides the data
in "basal substraction" form.
As shown in Figures 16 and 17, Binding Profiles may also be represented
graphically as a profile plot. Figure 17 was prepared using Spotfire data
visualization software (Spotfire Inc., Somerville Mass). Such graphic data
representations assist in displaying multivariate data to human viewers.
Multiple Binding Profiles may be compiled into a Binding Landscape. Figure
18 is a graphic representation of a Binding Landscape for three compounds (estradiol,
raloxifene, and GW5616). In preparing a graphic Binding Landscape, each Binding
Profile must contain data from a common set of binding peptides.
EXAMPLE 6: Creating Binding Landscapes
The present inventors determined that Binding Profiles of reference
compounds may be compiled into a Binding Landscape in order to obtain useful
infromation regarding uncharacterized (test) compounds. The Binding Landscape can
be utilized to predict the response of the test compound in cell-based assays, where
that test compound has not previously been characterized using the cell based assays.
To achieve this, a plurality of Binding Profiles for reference compounds (using the
same set of binding peptides and the same receptor, but different modulating
compounds) are compiled into a Binding Landscape. The Binding Landscape
contains at least three, preferably about five, more preferably at least about 10, 15, 20,
25 or more reference Binding Profiles. Most preferably, the Binding Landscape
contains dozens or hundreds of reference compounds, as the more reference
compounds utilized the more predictive a Binding Landscape will be. Preferably, the
set of binding peptides has been chosen to include peptides that are specific indicators
of agonist activity, and peptides that are specific indicators of antagonist activity.
Preferably the modulating compounds represented in the Binding Landscape include
those having a spectrum of activity from agonist to antagonist.
As used herein, "reference compound" is not an absolute category. A
compound may be uncharacterized when its Binding Profile is initially created, but as
the activity of that compound is determined, it may subsequently be used as a
reference compound.
Optionally, a Principal Components Analysis may be carried out on a Binding
Landscape to identify those peptide variables that account for the majority of the
variation seen, and to identify (and preferably omit) those peptides which do not
contribute, or contribute only minimally, to the analysis. Such peptides may, for
example, bind to each of the modulator/receptor combinations in a similar manner or
not at all, or may replicate the binding profile of another peptide to provide
cumulative information. It is most preferable to omit peptides that duplicate another
peptide's responses, as including multiple peptides that respond in the same manner to
the modulator compounds may bias the results. Excluding such peptide variables is
termed "dimension reduction".
Figure 21 represents a Binding Landscape for ERα LBD, which has
undergone dimension reduction by Principal Component Analysis. This Binding
Landscape comprises 145 different binding profiles (145 different ERα modulating
compounds, originally conducted with a set of 45 binding peptides plus a no-peptide
control. Principal Component Analysis using SAS JMP software indicated that 21 of
the initial 46 variables accounted for >99% of the variation seen. Figure 21 thus
includes only 21 of the initial 46 peptide variables.
Once the Binding Landscape has been prepared in its final form, Peptide
Profile Cluster Analysis can be conducted. The peptide Binding Profiles are
grouped into clusters, based on the ratios of binding among the 21 peptides. In other
words, the Binding Profiles that are most alike are classified in a hierarchical tree;
similarity is based on the ratios of the data values. The ratio of the data values can be
assessed visually (qualitatively) in the Binding Profiles provided herein by looking at
the overall shape of the profile plot. However, it is preferred that the similarity
assessment be performed quantitatively. Various quantitative methods are available
to compare the data values among the Binding Profiles, as will be apparent to those
skilled in the art.
The present inventors determined that the relative binding effects of a test
compound in vitro (assessed using a Binding Landscape as set forth herein) can be
used to infer the effects of the test compound in associated cell-based assays (where
the cell-based assays are responsive to the same receptor tested in the Binding
Profiles). Using the high-throughput Binding Landscape method, test compounds can
be screened and their likely effects in cell-based assays predicted. Additionally,
compounds with unusual Binding Profiles (and thus potentially novel cell-based
effects) can be rapidly identified. In this manner, a series of hundreds of test
compounds may be rapidly assessed, and prioritized or reduced in number for cell-based
screening.
Accordingly, after the Binding Landscape is created, the compounds are
clustered according to their relative effects in vitro(binding to peptides), which allows
the prediction of the relative effects in vivo for uncharacterized compounds.
Figure 22 shows Binding Profiles for reference compounds (those with
associated cell-based assay data).
Figure 23 shows a Binding Landscape compiled for 145 compounds, where
Binding Profiles were originally conducted with 45 binding peptides plus a no-peptide
control. After dimensional reduction using Principal Component Analysis, the
Binding Landscape was constructed using the 21 binding peptides that provided
>99% of the variation.
The individual Binding Profiles were then grouped into clusters based on
binding among the 21 peptides (represented graphically by the shape of the profile).
On the left of Figure 23 is a hierarchical classification tree of Binding Profiles (a
'compound dendrogram'). The branch points of the dendrogram separate shape-based
clusters. At the highest resolution, the "tree" would consist of 145 separate Binding
Profiles; at the lowest resolution, the tree would consist of a single group of all 145
Binding Profiles. The most informative cut-off level in the tree lies between these
two extremes, but there is no single criterium that must be used to identify an
informative cut-off point. Ideally the cut-off point yields multiple clusters (as shown
in Figure 24), where some clusters contain more than one Binding Profile.
Alternatively, in an analyzing a single uncharacterized compound, the cut-off
level in the tree can be selected to provide a cluster containing that uncharacterized
compound and at least one reference compound.
As shown in Figure 24, a cut-off point was selected that provided twelve
clusters. Five of the clusters (1,2, 4, 8 and 12) contained a single Binding Profile.
Three clusters contained from two to three Binding Profiles, and four clusters each
contained more than ten Binding Profiles. Test compounds that fall within the same
cluster as a "tool" compound are predicted to have the same in vivo effects of the tool
compound. Test compounds that fall within their own cluster are predicted to have
cell-based effects that differ from the 'tool' compounds.
EXAMPLE 7
Cell-Based Analysis and Prediction
By grouping cell-based data according to the cluster scheme identified above,
it can be shown that the Binding Landscape method reveals cell-based assay trends.
In the present example, three established ERα cell-based assays were utilized, as
discussed in Example 4, above.
Of the 145 compounds represented in the Binding Profile of Figure 23, a
subset of those had been assessed in the ERE cell-based assay. The effects of the
compounds on transcriptional activity in vivo (as assessed in the ERE cell-based
assay) are compared to the Clustering of Binding Profiles, to reveal associated trends.
For example, as shown in Figure 25, in Cluster 3, the data points from the cell-based
assay do not show much variation. As shown in Figure 25, in Cluster 3, the data
points from the cell-based assay do not show much variation. Accordingly, an
uncharacterized compound that fell in this cluster would be predicted to have a similar
result in the ERE assay. Key associations: Increased binding of ERα LBD to
coactivator peptides (including the phage-derived K7P2 peptide binding) correlated
with increased ERE activity; wherease inhibition of ERα LBD binding to coactivator
peptides (including K7P2) correlated with inhibition of ERE activity.
The present methods utilize whole Binding Profiles (multiple binding
partners), grouped by cluster analysis, to reveal cell-based data trends specific to the
Binding Profile.
Figure 26 displays the correlation of results in the MCF-7 cell proliferation
assay to the Binding Profile clusters. Again, for example, in Cluster 3, the data points
for the cell-based assay do not show much variation (all are negative values).
Accordingly, an uncharacterized modulating compound with a Binding Profile in this
cluster can be predicted to have similar results when tested in the MCF-7 cell-based
assay. Key associations: ERα LBD binding to coactivator peptides (including K7P2
peptide binding) correlated with increased MCF-7 cell proliferation.
In Figure 27, the results for the Ishikawa cell-based assay are grouped tightly
in Cluster 3 as an example; accordingly, an uncharacterized modulating compound
with a Binding Profile in this cluster is expected to have similar results when tested in
an Ishikawa cell-based assay. Key associations: Enhanced binding of ERα LBD to the
peptides GW5P2 and T1P3 correlates with low Ishikawa stimulation and increased
binding of ERα LBD to coactivator peptides (including K7P2) correlates with high
Ishikawa stimulation.
EXAMPLE 8: Further refinement of Binding Landscape
In some cases a Binding Landscape cluster will contain similar binding
profiles, yet the results of an associated cell-based assay are not similar (i.e., the
Binding Landscape cluster is not predictive for results in that cell-based assay). In
such instances that cluster may be further resolved by the addition of additional
binding peptide data to the Binding Profiles. This may be carried out by screening
additional phage-displayed peptides (as discussed in Example 1, above) to identify
additional appropriate binding peptides, or by screening additional known coactivator,
corepressor, or coregulator proteins, or to screen DNA fragments that represent
promoter elements to identify those that show variation in binding among the
receptor/modulator combinations in the unresolved cluster.
EXAMPLE 9: Identification of compounds with unique Binding Profiles
Where a Binding Landscape has been prepared using known receptor ligands
and uncharacterized modulating compounds, and has been resolved into clusters using
a middle point on the dendrogram, a cluster containing a single uncharacterized
compound indicates that the uncharacterized compound has unique properties
compared to the known receptor ligands.