EP1331565A1 - Application execution profiling in conjunction with a virtual machine - Google Patents
Application execution profiling in conjunction with a virtual machine Download PDFInfo
- Publication number
- EP1331565A1 EP1331565A1 EP02290195A EP02290195A EP1331565A1 EP 1331565 A1 EP1331565 A1 EP 1331565A1 EP 02290195 A EP02290195 A EP 02290195A EP 02290195 A EP02290195 A EP 02290195A EP 1331565 A1 EP1331565 A1 EP 1331565A1
- Authority
- EP
- European Patent Office
- Prior art keywords
- application
- virtual machine
- profile
- acquiring
- circuitry
- Prior art date
- Legal status (The legal status is an assumption and is not a legal conclusion. Google has not performed a legal analysis and makes no representation as to the accuracy of the status listed.)
- Granted
Links
Images


Classifications
-
- G—PHYSICS
- G06—COMPUTING OR CALCULATING; COUNTING
- G06F—ELECTRIC DIGITAL DATA PROCESSING
- G06F11/00—Error detection; Error correction; Monitoring
- G06F11/30—Monitoring
- G06F11/34—Recording or statistical evaluation of computer activity, e.g. of down time, of input/output operation ; Recording or statistical evaluation of user activity, e.g. usability assessment
- G06F11/3409—Recording or statistical evaluation of computer activity, e.g. of down time, of input/output operation ; Recording or statistical evaluation of user activity, e.g. usability assessment for performance assessment
- G06F11/3419—Recording or statistical evaluation of computer activity, e.g. of down time, of input/output operation ; Recording or statistical evaluation of user activity, e.g. usability assessment for performance assessment by assessing time
-
- G—PHYSICS
- G06—COMPUTING OR CALCULATING; COUNTING
- G06F—ELECTRIC DIGITAL DATA PROCESSING
- G06F2201/00—Indexing scheme relating to error detection, to error correction, and to monitoring
- G06F2201/815—Virtual
-
- G—PHYSICS
- G06—COMPUTING OR CALCULATING; COUNTING
- G06F—ELECTRIC DIGITAL DATA PROCESSING
- G06F2201/00—Indexing scheme relating to error detection, to error correction, and to monitoring
- G06F2201/88—Monitoring involving counting
-
- Y—GENERAL TAGGING OF NEW TECHNOLOGICAL DEVELOPMENTS; GENERAL TAGGING OF CROSS-SECTIONAL TECHNOLOGIES SPANNING OVER SEVERAL SECTIONS OF THE IPC; TECHNICAL SUBJECTS COVERED BY FORMER USPC CROSS-REFERENCE ART COLLECTIONS [XRACs] AND DIGESTS
- Y02—TECHNOLOGIES OR APPLICATIONS FOR MITIGATION OR ADAPTATION AGAINST CLIMATE CHANGE
- Y02D—CLIMATE CHANGE MITIGATION TECHNOLOGIES IN INFORMATION AND COMMUNICATION TECHNOLOGIES [ICT], I.E. INFORMATION AND COMMUNICATION TECHNOLOGIES AIMING AT THE REDUCTION OF THEIR OWN ENERGY USE
- Y02D10/00—Energy efficient computing, e.g. low power processors, power management or thermal management
Definitions
- This invention relates in general to processing devices and, more particularly, to profiling application execution on devices using a virtual machine.
- a virtual machine is a layer of software that resides between applications and the physical hardware platform and operating system.
- a virtual machine is instrumental in providing portability of applications.
- the JVM defines a virtual platform for which all JAVA programs may be written.
- the virtual platform is the same regardless of the actual hardware executing the JVM. Accordingly, the programmer can write an application directed to the JVM without knowledge of the underlying hardware.
- JAVA programs are compiled into "byte-codes", which can be thought of as the machine language of the JVM.
- the JVM executes the byte-codes just as a processor executes machine code; however, the byte-codes do not directly control the underlying hardware. Instead, they are interpreted by the JVM, which generates the instructions to the underlying hardware.
- performance for a specified portion of an application where the specified portion can include all or part of the application, that executes on a target device via a virtual machine interface is estimated by acquiring an application profile that specifies a number of executions for a plurality of operations used in the specified portion of the application, acquiring a virtual machine profile that relates a performance characteristic to individual operations and generating an aggregate value for the performance characteristic based on the application profile and the virtual machine profile.
- the present invention provides significant advantages over the prior art.
- an accurate estimation of a performance criteria such as average time, maximum time, or energy consumption, for the application can be provided.
- the application profile can be generated on an application development platform and used for optimizing an application and can be downloaded to the target device for scheduling and other purposes.
- the application profile can also be generated on the target device itself upon the first execution of the application.
- the virtual machine profile can be generated one time on a target device with a specialized virtual machine and used by software development platforms and operating target devices.
- Figures 1a through 1c illustrate a generalized description of the invention.
- an application profile 10 is generated from an application 12.
- the application profile 10 is a byte-code based profile which indicates how many times each operation (such as a byte-code or a native method) is used during execution of the application 12, or in specified parts of the application 12.
- the application profile 10 may be generated on a development system by the software developer or it may be generated on the target device upon the first execution of the application.
- a JVM profile 14 is generated for a specific hardware platform 16 using a benchmark program 18.
- the JVM profile 14 provides information indicative of a performance characteristic of the underlying target hardware for each particular operation.
- the performance characteristic may be the time necessary to execute each particular operation and/or the energy expended by the hardware platform 16 in executing each particular operation, but also could involve other performance characteristics such as bandwidth occupation of different memory modules, cache misses occurrences, TLB misses and so on.
- Any performance characteristic that can be measured in relation to an operation can be used if a JVM profile 14; for purposes of illustration, however, implementation of the invention will be discussed herein with regard to operation execution time and energy consumption.
- a JVM profile can be generated by the designer of the JVM for a respective hardware platform and used for multiple software development platforms and operating devices.
- the information in the application profile 10 and the information in the JVM profile 14 are combined to generate a performance estimate 20.
- the estimate 20 may be generated on an application development system, to aid the programmer in optimizing the application for the target device, or on an operating target device, to aid in efficient operation of the device.
- the application profile 10 specifies the number of times each possible operation is executed during execution of the execution of application 12.
- a video codec may have a one application profile for receiving a 24-bit color video file and another application profile for receiving an 8-bit color video file.
- the application profile 14 may be generated by the programmer, or may be generated upon the first execution of the application on the host device. By multiplying the number of times each operation is used in execution of the application (as specified in the application profile 10) by the energy/time consumed by the operation (as specified in the JVM profile 14) and summing the results for all such operations, a very accurate estimation of the time/energy used by the application can be generated.
- the time/energy information can be used for a number of purposes.
- Figure 2 illustrates a general state diagram showing the generation of a application profile 10.
- an on command (described in greater detail below) in the application begins the profiling of the application 12 in state 32.
- the execution of each operation in the application 12 increments a counter associated with the particular operation.
- Each executed operation is counted until an off command (described below) is received.
- a save results command causes the values of the counters to be stored in a file in state 34.
- the local variable zone contains input parameters and private data of the method.
- the stack is used to store the input and output data needed to realize the byte-codes.
- a set of byte-codes permits the exchange of data between the local variable zone and the stack. Data is located to a specific index in the local variable zone. Iload realizes the pop of a byte from the stack to obtain the index.
- the index of local variable index is limited to 255 (byte precision).
- the byte-code wide has been introduced to access an index up to 65535.
- the JVM pops two byte values from the stack to determine the index of the data in the local variable zone. Therefore, a wide iload takes more time than an iload .
- the wide byte-code influences two other byte-codes: ret and iinc.
- a wide iinc sequence increments by one the local variable identified using two bytes, and not only one (as it does without wide).
- the ret byte-code is used to end a subroutine. Its action is simple; it pops one byte value on the stack, calculates the return address and modifies the PC of the JAVA method. In order to support more than 255 offsets (for the return address), wide ret sequence will increase the PC modification using a two-byte value. Accordingly, byte-codes that have a wide variant must be separately monitored for wide and normal behavior.
- Invocation byte-codes realize the execution of another method.
- the called method can be composed of JAVA byte-codes or can be a native method.
- its execution time depends directly on the native implementation because as the invocation is synchronous, the time needed to complete the invocation depends on the native method implementation. Accordingly, it is necessary to distinguish invocation opcodes that invokes native methods from the others.
- the content of the application profiles 10 need to provide: (1) one entry for each java byte-code except for wide, (2) one entry for each wide dependant byte-code (wide load based, wide store based, wide ret, and wide iinc), (3) one entry for the native invocation byte-code and (4) one entry for each available native method.
- the application profile 10, JVM profile 14 and the real execution time/energy estimation 20 can be generated through the use of several APIs (application program interface).
- the application profile 10 documents the number of times each standard JAVA byte-code (with and without wide ) is executed and the number of times each native method of the JVM is executed. Collectively, the byte-codes and native methods are referred to herein as the "operations". In other virtual machines, there may be different or additional operations.
- the application 12 is executed with a JVM, which is instrumented to count each operation and calculate the profile.
- the JVM which is used to generate the profile is referred to as the "profiling tool”.
- ProfilerApplication APIs are defined in order to generate the application's profile as shown in Table 1. Using this API, it is possible to document the profiling of several code sequences of an application. For example, if two different loops of an application need profiling, the APIs indicate to the profiler JVM which loop is being executed in order to update its profile.
- the on and off methods start and stop the profiling for each loop. After twenty iterations, the profiling is ended and the results saved.
- the generated file is:
- the JVM profile 14 contains an execution time/energy estimate for each operation - for JAVA, byte-codes (with and without wide ) and native methods.
- a general state diagram illustrating the generation of time estimates for each operation is shown in Figure 3a.
- a start time is determined in state 42.
- a stop time is determined in state 44.
- An elapsed time is computed in state 46 and the register associated with the particular operation is incremented by the amount of the elapsed time. In the preferred embodiment, maximum and minimum execution times associated with the operation are maintained as well. This sequence is repeated for each operation execution.
- the average elapsed time for each operation is stored in the JVM profile in state 48. As described below in connection with Figure 4, the criteria for determining an elapsed time may vary depending upon several factors.
- a set of APIs are used that control internal profiling of byte-codes and native methods.
- a specialized JVM is instrumented to record stopping and starting times; typically, this JVM is different than the one used in determining the application profile 10.
- the APIs are shown in Table 2.
- the on call activates profiling and the off call stops profiling. Several sequences of on and off can be done during the application execution.
- the saveResult call generates a file named jvmProfile. java that contains the JVM profile 14.
- a benchmark uses the APIs and executes all the byte-codes (with and without wide ) and all the native methods many times. Experimentation using at least 10000 repetitions have been found to produce accurate results. A sample of the benchmark is shown below:
- the benchmark uses two routines BenchLogic() and BenchIntegers() for profiling; BenchLogic() profiles the program control flow operations and BenchIntegers() profiles the arithmetic operations.
- the design of the benchmark is dependent upon the design of the particular JVM. Because the execution characteristics of a particular operation may depend upon a number of factors, such as cache misses and so on, it is up to the designer of the benchmark to account for different critical situations that may arise.
- the benchmark may be composed of some constant fields that permit configuration of the execution context of the byte-codes.
- information on energy consumption can also be stored in the JVM profile 14.
- an operation start indicator begins a determination of the energy being used by the operation in state 52.
- the energy consumption data could be based on resources used by the operation and the time of execution.
- the register associated with the operation is incremented by the estimation of the energy consumed in state 54. In the preferred embodiment, maximum and minimum execution times associated with the operation are maintained as well.
- the energy consumption calculations are performed for each operation. Upon receiving the save results command, the average energy consumption is calculated for each operation and is stored in the JVM profile (state 56).
- ProfilerExecution APIs are implemented as shown in Table 3. After making a new instance of an execution's profiler object, a call to Eskimation(ink idSequence) method returns the execution time in nanoseconds of the code sequence idSequence . This call realizes, for each code sequence, the sum of the multiplication of each entry of the application profile 10 by each entry of the JVM profile 14.
- These APIs can be implemented in pure Java code.
- APIs can be used on the real target or on the host development desktop.
- An example of use of these APIs is shown on below:
- the application uses the estimations to resume its execution only if the estimated time of the two internal loops is less than 100000 nanoseconds.
- the call new MyAppProfile inside the main of the application guaranty that the application's profile class file is linked within the application class files.
- the method getExecutionTime is offered transparently.
- JVM JVM for calculating estimations on time/energy performance
- JVM profile 10 JVM profile 14
- JVM profile 14 C structures are added to JVM for obtaining profiles:
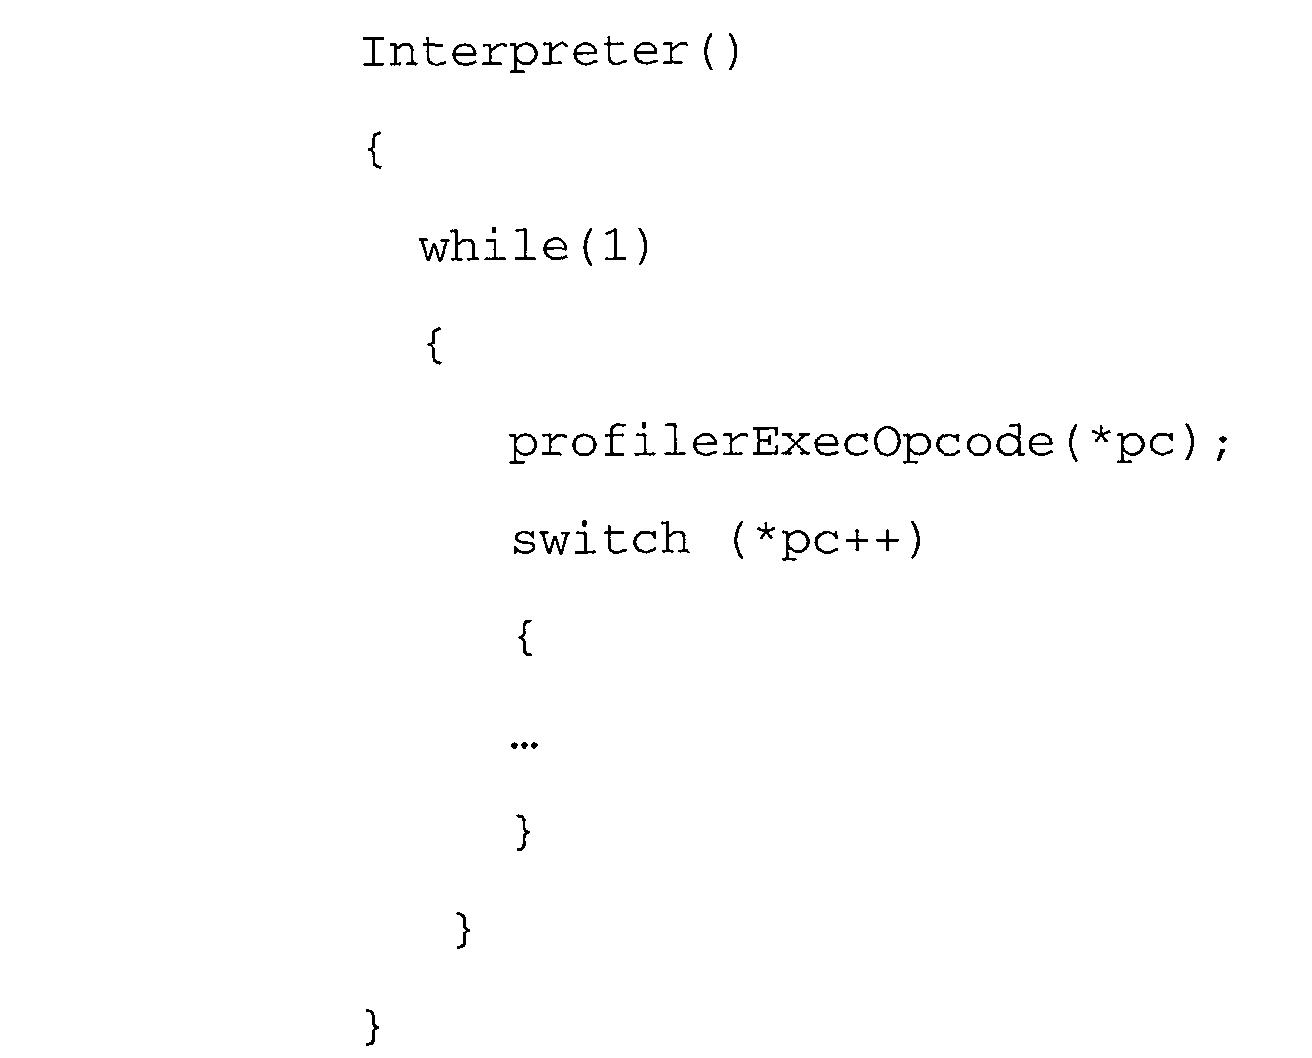
- the profiler JVM counts the number of times of each operation is executed. Therefore, it is necessary to instrument the main interpreter loop. As shown below, before each byte-code execution, a call to profilerExecOpcode procedure counts the current executed byte-code:
- IdActiveSequence indicates the current codeSequence being profiled.
- onOffBoolean indicates if the profile is active or not.
- NumberSequences stores the number of times the profile has been used for a particular code sequence in order to calculate its average profile. Each time a byte-code or a native method is executed, the corresponding entry in sumProfile is incremented by one.
- sumProfile is composed of 270 entries (200 byte-codes without wide, 12 byte-codes with wide support, 4 entries for each native invocation byte-code and finally one entry for each of the native methods of the JVM; in this case, it is assumed that there are 54 native methods, although a particular implementation may use more or less).
- the first special case is native method invocation.
- the time between ( tOpcodeEnd-tOpcodeBegin ) will include the time of the native method execution. Accordingly, in the case of a native method invocation, as the execution time of the native method is ( tNativeEnd-tNativeBegin ), the execution time of a method native invocation byte-code will be ( tOpcodeEnd-tOpcodeBegin ) - ( tNativeEnd-tNativeBegin ).
- the second special case involves new byte-code and nested interpreter loops.
- another interpreter loop is executed in order to run the ⁇ clinit> method that initializes the object.
- the time before entering the new interpreter level ( tLevelBegin ) and the time at the return from it ( tLevelEnd ) are measured.
- the execution time taken by the new interpreter loop is then ( tLevelEnd-tLevelBegin ) and the execution time of the new byte-code is ( tOpcodeEnd-tOpcodeBegin ) - ( tLevelEnd-tLevelBegin ).
- a return based byte-code is done to return to the previous interpreter loop.
- the execution of the return byte-code is (tLevelEnd-tOpcodeBegin), with the tOpcodeBegin of the return byte-code interpreter loop level.
- the third special case involves native method invocation and nested interpreter loops.
- During an execution of a native method it is also possible to execute another interpreter loop using JNI (JAVA Native Interface) interface calls.
- JNI Java Native Interface
- the execution time of the native method is ( tNativeEnd-tNativeBegin) - ( tLevelEnd-tLevelBegin ).
- an instrumentation of a JVM can be done such that there is one modification in the main interpreter loop, another in the native invocation call and finally one inside the call that launches a new interpreter loop.
- levels of interpreters it is possible to support several nested interpreters.
- Table 4 summarizes the names of the times taken and Table 5 gives the estimated time for a byte-code and a native method according to these times.
- the most important advantage of the profiling is the separation of two isolated and independent parts the profiling of an application, i.e., separate application and virtual machine profiling. This allows, for example, optimization work to be done on the application without an identified target hardware platform. On the other hand, work on the JVM can be done for obtaining a better performance, and a better JVM profile 14.
- the application profile 10 and the JVM profile 14 are class files and can be downloaded through a network. From the target hardware's perspective, estimation can be deduced after the download of an application, either through downloading the application profile 10 or by generating an application profile 10 upon the first execution. Further, the host development station can download desired JVM profiles 14 for different hardware platforms. This way, an application designer can optimize its application for several targets.
- Another perspective of this work is to adapt the JVM profile 14 in order to obtain energy consumption estimations of a JAVA application.
- the estimation of energy consumption could be performed using the same principles as for execution time. This is a real discontinuity in embedded application development cycle where a huge instrumentation and lots of tools are needed to obtain these estimations.
- the energy performance (and execution time performance) could be used by the target device for scheduling applications, as described in connection with EP Serial No. 99402655.7,filed on October 25, 1999, for "Intelligent Power Management for Distributed Processing Systems” (U.S. Ser. No. 09/696,052, filed October 25, 2000, for "Intelligent Power Management for Distributed Processing Systems” to Chauvel et al), which is incorporated by reference herein.
- profiling techniques described herein could be adapted to take into account an interpreter-based execution and a JIT one.
- WCET Worst Case Execution Times
- the profiling tool is a JVM that calculates the application profile 10 by the execution of the application
- the application profile can be generated on the fly after the download of the application. Then, after the first execution, an estimation can be delivered.
- the overhead in terms of performance is not too important and will only concern the first execution. In the specific case of stream based applications, in which there are important time variations due to the kind of data received, a dynamic profiling will permit to adjust dynamically the execution time estimation with a small overhead.
Landscapes
- Engineering & Computer Science (AREA)
- General Engineering & Computer Science (AREA)
- Theoretical Computer Science (AREA)
- Computer Hardware Design (AREA)
- Quality & Reliability (AREA)
- Physics & Mathematics (AREA)
- General Physics & Mathematics (AREA)
- Debugging And Monitoring (AREA)
Abstract
Description
- This invention relates in general to processing devices and, more particularly, to profiling application execution on devices using a virtual machine.
- Many applications operate in conjunction with a "virtual machine". The best-known virtual machine is the JAVA virtual machine, or JVM. A virtual machine is a layer of software that resides between applications and the physical hardware platform and operating system.
- A virtual machine is instrumental in providing portability of applications. For example, in JAVA, the JVM defines a virtual platform for which all JAVA programs may be written. The virtual platform is the same regardless of the actual hardware executing the JVM. Accordingly, the programmer can write an application directed to the JVM without knowledge of the underlying hardware.
- JAVA programs are compiled into "byte-codes", which can be thought of as the machine language of the JVM. The JVM executes the byte-codes just as a processor executes machine code; however, the byte-codes do not directly control the underlying hardware. Instead, they are interpreted by the JVM, which generates the instructions to the underlying hardware.
- While the JVM is the most well-known virtual machine, other platform-independent languages use a similar structure.
- To optimize an application, estimations of execution time or energy consumption are often needed. This is particularly true in the case of mobile devices, such as smart phones, personal digital assistants, and the like, which have limited energy and processing resources. When programming for a virtual machine, however, the underlying hardware is masked from the programmer. Accordingly, optimization is more difficult, particularly if the application is meant for multiple hardware platforms. Often, the application must be tested on the actual hardware platform to obtain accurate estimates.
- Therefore, a need has arisen for a method and apparatus for reliably estimating performance characteristics, such as execution time and energy, in a device using a virtual machine interface.
- In the present invention, performance for a specified portion of an application, where the specified portion can include all or part of the application, that executes on a target device via a virtual machine interface is estimated by acquiring an application profile that specifies a number of executions for a plurality of operations used in the specified portion of the application, acquiring a virtual machine profile that relates a performance characteristic to individual operations and generating an aggregate value for the performance characteristic based on the application profile and the virtual machine profile.
- The present invention provides significant advantages over the prior art. By independently generating the application profile, based on the number of times operations are executed in the application, and the virtual machine profile, based on actual hardware response on the target device, an accurate estimation of a performance criteria, such as average time, maximum time, or energy consumption, for the application can be provided. The application profile can be generated on an application development platform and used for optimizing an application and can be downloaded to the target device for scheduling and other purposes. The application profile can also be generated on the target device itself upon the first execution of the application. The virtual machine profile can be generated one time on a target device with a specialized virtual machine and used by software development platforms and operating target devices.
- For a more complete understanding of the present invention, reference is now made to the following descriptions taken in conjunction with the accompanying drawings, in which:
- Figure 1a illustrates a depiction of the generation of an application profile;
- Figure 1b illustrates a depiction of the generation of a virtual machine profile;
- Figure 1c illustrates a depiction of an estimation based on the application and virtual machine profiles;
- Figure 2 is a state diagram describing the generation of an application profile;
- Figure 3a is a state diagram describing the generation timing information for a virtual machine profile;
- Figure 3b is a state diagram describing the generation energy information for a virtual machine profile; and
- Figure 4 illustrates timing factors in computing elapsed time.
-
- The present invention is best understood in relation to Figures 1 - 4 of the drawings, like numerals being used for like elements of the various drawings.
- For purposes of illustration, the invention will be discussed in terms of a JAVA application running on a JVM, although the techniques described herein apply to any architecture using a virtual machine interface.
- Figures 1a through 1c illustrate a generalized description of the invention. In Figure 1a, an
application profile 10 is generated from anapplication 12. Theapplication profile 10 is a byte-code based profile which indicates how many times each operation (such as a byte-code or a native method) is used during execution of theapplication 12, or in specified parts of theapplication 12. Theapplication profile 10 may be generated on a development system by the software developer or it may be generated on the target device upon the first execution of the application. - In Figure 1b, a
JVM profile 14 is generated for aspecific hardware platform 16 using abenchmark program 18. TheJVM profile 14 provides information indicative of a performance characteristic of the underlying target hardware for each particular operation. The performance characteristic may be the time necessary to execute each particular operation and/or the energy expended by thehardware platform 16 in executing each particular operation, but also could involve other performance characteristics such as bandwidth occupation of different memory modules, cache misses occurrences, TLB misses and so on. Any performance characteristic that can be measured in relation to an operation can be used if aJVM profile 14; for purposes of illustration, however, implementation of the invention will be discussed herein with regard to operation execution time and energy consumption. In general, a JVM profile can be generated by the designer of the JVM for a respective hardware platform and used for multiple software development platforms and operating devices. - In Figure 1c, the information in the
application profile 10 and the information in theJVM profile 14 are combined to generate aperformance estimate 20. Theestimate 20 may be generated on an application development system, to aid the programmer in optimizing the application for the target device, or on an operating target device, to aid in efficient operation of the device. - The
application profile 10 specifies the number of times each possible operation is executed during execution of the execution ofapplication 12. There may be severaldifferent application profiles 10 to accommodate different operating conditions. For example, a video codec may have a one application profile for receiving a 24-bit color video file and another application profile for receiving an 8-bit color video file. - The
application profile 14 may be generated by the programmer, or may be generated upon the first execution of the application on the host device. By multiplying the number of times each operation is used in execution of the application (as specified in the application profile 10) by the energy/time consumed by the operation (as specified in the JVM profile 14) and summing the results for all such operations, a very accurate estimation of the time/energy used by the application can be generated. The time/energy information can be used for a number of purposes. - Figure 2 illustrates a general state diagram showing the generation of a
application profile 10. Starting from anidle state 30, an on command (described in greater detail below) in the application begins the profiling of theapplication 12 instate 32. At this point, the execution of each operation in theapplication 12 increments a counter associated with the particular operation. Each executed operation is counted until an off command (described below) is received. A save results command causes the values of the counters to be stored in a file instate 34. - In generating the
application profile 10, it is important to provide enough information to deduce real execution time. It is therefore important to have a careful understanding of the operations. For example, there are 201 byte-codes supported by a standard JVM (some JVMs may support additional byte-codes). Some byte-codes realize arithmetic operations, some perform PC (program counter) modifications, some manage the stack, some load-store between the stack, the local variables and the object heap, and some manage objects. Most byte-codes are regular in their operation. But wide byte-codes and invocation byte-codes are special cases that must be handled differently than other byte-codes. - With regard to wide byte-codes, in JAVA, there are two specific memory zones associated to each method: one local variable zone and one stack. The local variable zone contains input parameters and private data of the method. The stack is used to store the input and output data needed to realize the byte-codes. A set of byte-codes permits the exchange of data between the local variable zone and the stack. Data is located to a specific index in the local variable zone. Iload realizes the pop of a byte from the stack to obtain the index. In the specification of the JVM, the index of local variable index is limited to 255 (byte precision). The byte-code wide has been introduced to access an index up to 65535. For example, if the byte-code sequence is wide iload, the JVM pops two byte values from the stack to determine the index of the data in the local variable zone. Therefore, a wide iload takes more time than an iload. Moreover, the wide byte-code influences two other byte-codes: ret and iinc. A wide iinc sequence increments by one the local variable identified using two bytes, and not only one (as it does without wide). The ret byte-code is used to end a subroutine. Its action is simple; it pops one byte value on the stack, calculates the return address and modifies the PC of the JAVA method. In order to support more than 255 offsets (for the return address), wide ret sequence will increase the PC modification using a two-byte value. Accordingly, byte-codes that have a wide variant must be separately monitored for wide and normal behavior.
- Invocation byte-codes realize the execution of another method. The called method can be composed of JAVA byte-codes or can be a native method. In the case of a native method, its execution time depends directly on the native implementation because as the invocation is synchronous, the time needed to complete the invocation depends on the native method implementation. Accordingly, it is necessary to distinguish invocation opcodes that invokes native methods from the others.
- Thus, in order to be accurate, the content of the application profiles 10 need to provide: (1) one entry for each java byte-code except for wide, (2) one entry for each wide dependant byte-code (wide load based, wide store based, wide ret, and wide iinc), (3) one entry for the native invocation byte-code and (4) one entry for each available native method.
- The
application profile 10,JVM profile 14 and the real execution time/energy estimation 20 can be generated through the use of several APIs (application program interface). - The
application profile 10 documents the number of times each standard JAVA byte-code (with and without wide) is executed and the number of times each native method of the JVM is executed. Collectively, the byte-codes and native methods are referred to herein as the "operations". In other virtual machines, there may be different or additional operations. - To calculate the
application profile 10, theapplication 12 is executed with a JVM, which is instrumented to count each operation and calculate the profile. The JVM which is used to generate the profile is referred to as the "profiling tool". ProfilerApplication APIs are defined in order to generate the application's profile as shown in Table 1. Using this API, it is possible to document the profiling of several code sequences of an application. For example, if two different loops of an application need profiling, the APIs indicate to the profiler JVM which loop is being executed in order to update its profile.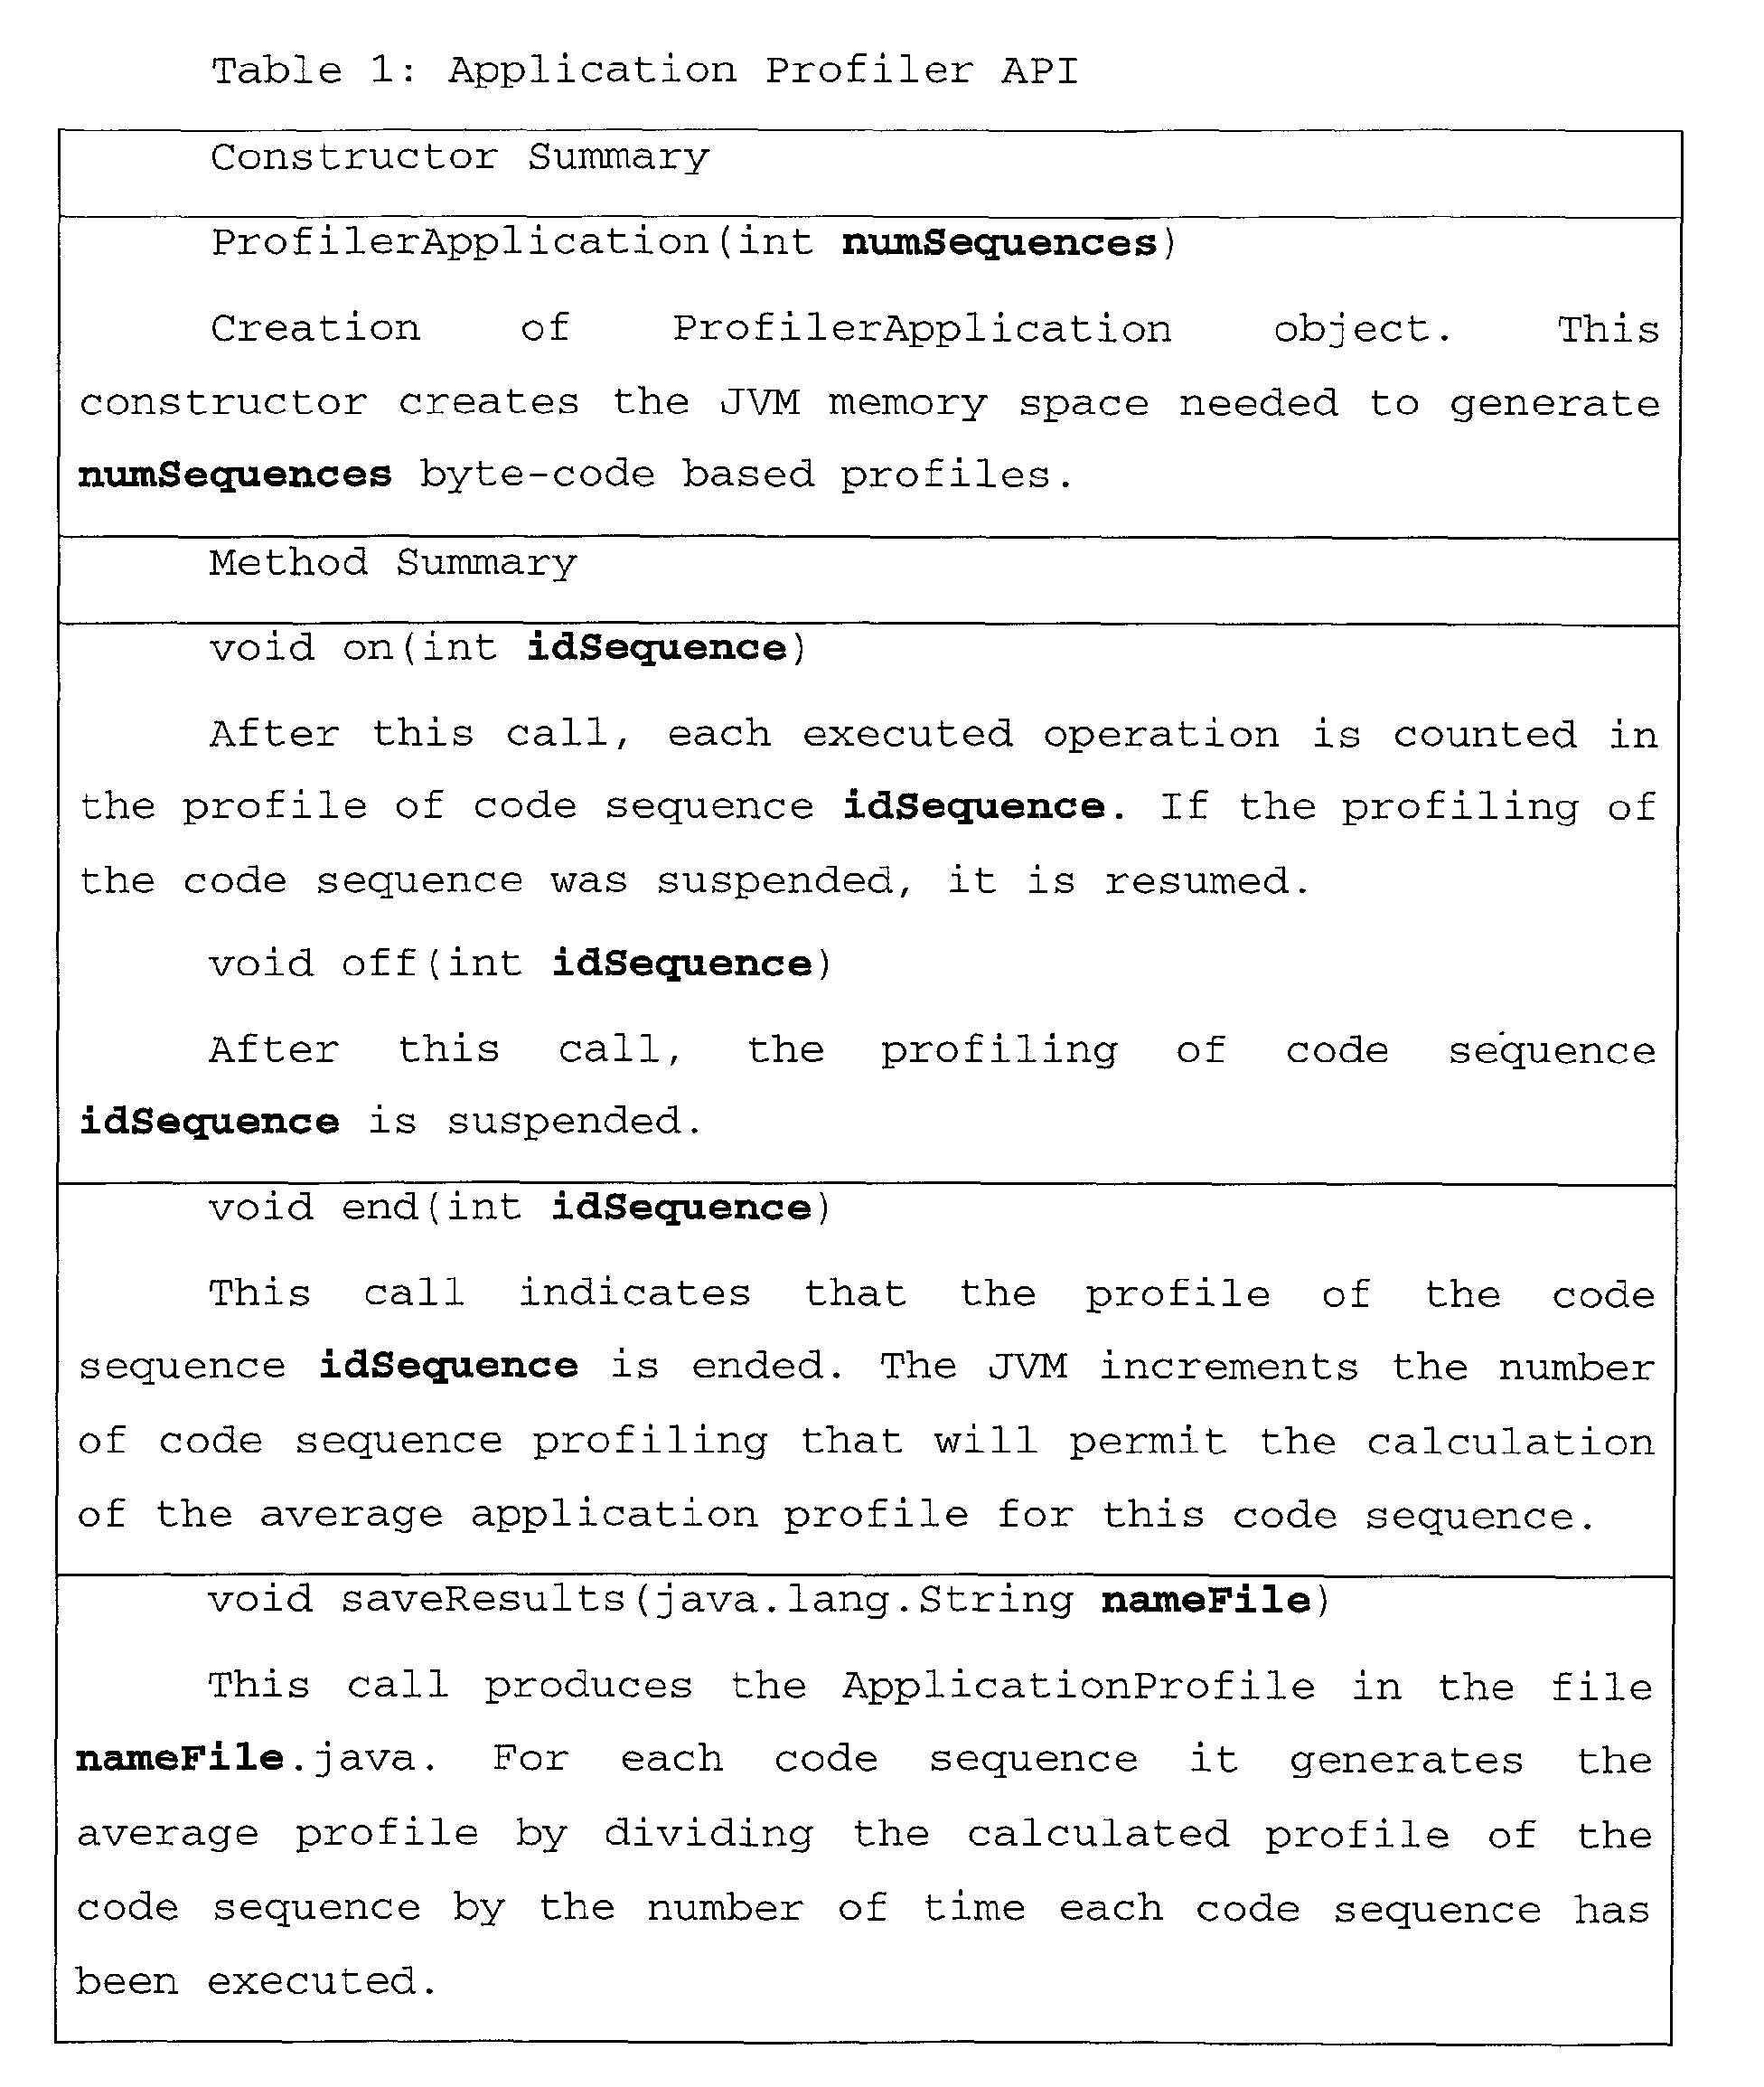
- These APIs are simple to use. First, it is necessary to create a ProfileApplication object by indicating the number of code sequences to profile. The on method engages the profiling of the idSequence code sequence, and off method stops it. Several on and off sequences can be performed until an end method invocation is done. This method increments the number of times a profile for the code sequence idSequence has been generated. Before ending the application, saveResults method creates a file named nameFile.java, which contains the average application profile for each code sequence.
- A simple JAVA application is set forth below:


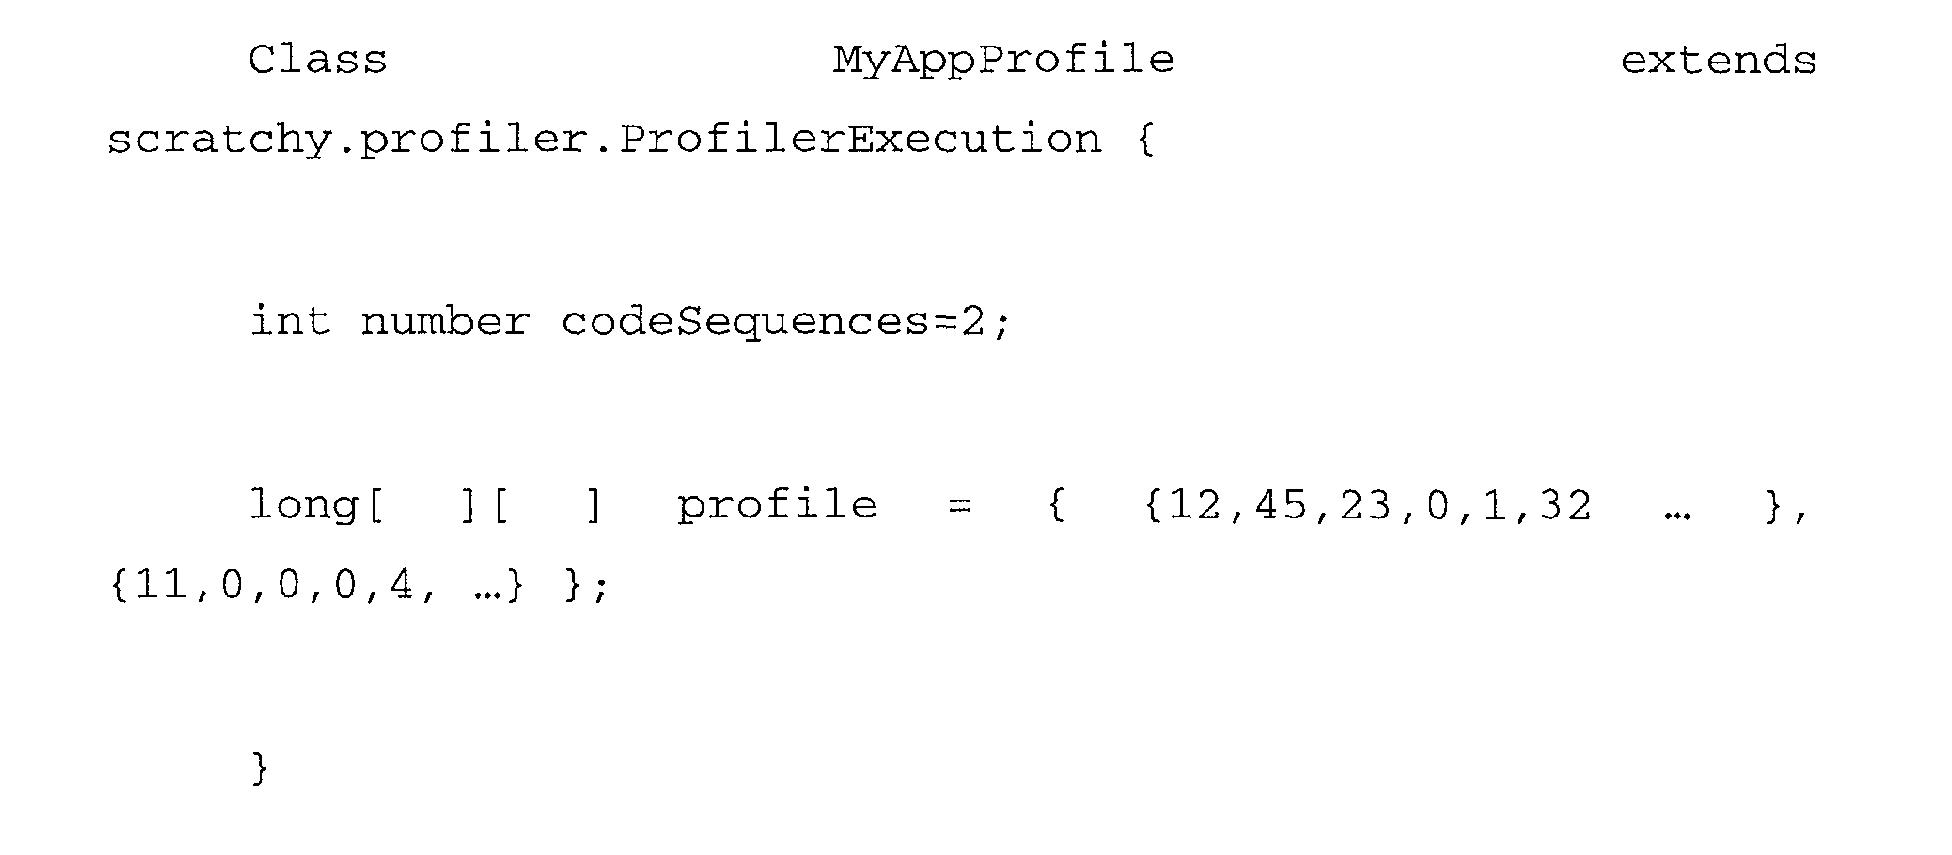
- The on and off methods start and stop the profiling for each loop. After twenty iterations, the profiling is ended and the results saved. The generated file is:
- The
JVM profile 14 contains an execution time/energy estimate for each operation - for JAVA, byte-codes (with and without wide) and native methods. A general state diagram illustrating the generation of time estimates for each operation is shown in Figure 3a. - From
initial state 40, upon the start of an operation, a start time is determined instate 42. At the end of the operation, a stop time is determined instate 44. An elapsed time is computed instate 46 and the register associated with the particular operation is incremented by the amount of the elapsed time. In the preferred embodiment, maximum and minimum execution times associated with the operation are maintained as well. This sequence is repeated for each operation execution. When a save results command is received, the average elapsed time for each operation is stored in the JVM profile instate 48. As described below in connection with Figure 4, the criteria for determining an elapsed time may vary depending upon several factors. - To obtain the profile, a set of APIs are used that control internal profiling of byte-codes and native methods. A specialized JVM is instrumented to record stopping and starting times; typically, this JVM is different than the one used in determining the
application profile 10. The APIs are shown in Table 2.
- The on call activates profiling and the off call stops profiling. Several sequences of on and off can be done during the application execution. The saveResult call generates a file named jvmProfile. java that contains the
JVM profile 14. - To generate the
JVM profile 14, a benchmark uses the APIs and executes all the byte-codes (with and without wide) and all the native methods many times. Experimentation using at least 10000 repetitions have been found to produce accurate results. A sample of the benchmark is shown below:

- With the use of this benchmark, the JVM profile is generated easily. In the illustrated embodiment, the benchmark uses two routines BenchLogic() and BenchIntegers() for profiling; BenchLogic() profiles the program control flow operations and BenchIntegers() profiles the arithmetic operations. The design of the benchmark is dependent upon the design of the particular JVM. Because the execution characteristics of a particular operation may depend upon a number of factors, such as cache misses and so on, it is up to the designer of the benchmark to account for different critical situations that may arise. The benchmark may be composed of some constant fields that permit configuration of the execution context of the byte-codes. For example, it may be desirable to configure the number of input and output parameters and the number of private variables needed to execute a method because these parameters may influence the execution time of the invocation. Therefore, in order to obtain an average execution case of the native methods these constant fields permit adaptation of the execution context of each native method.
- As shown in Figure 3b, information on energy consumption can also be stored in the
JVM profile 14. Fromidle state 50, an operation start indicator begins a determination of the energy being used by the operation instate 52. The energy consumption data could be based on resources used by the operation and the time of execution. When the operation is completed, the register associated with the operation is incremented by the estimation of the energy consumed instate 54. In the preferred embodiment, maximum and minimum execution times associated with the operation are maintained as well. The energy consumption calculations are performed for each operation. Upon receiving the save results command, the average energy consumption is calculated for each operation and is stored in the JVM profile (state 56). - For obtaining the
real estimations 20, ProfilerExecution APIs are implemented as shown in Table 3. After making a new instance of an execution's profiler object, a call to gekEskimation(ink idSequence) method returns the execution time in nanoseconds of the code sequence idSequence. This call realizes, for each code sequence, the sum of the multiplication of each entry of theapplication profile 10 by each entry of theJVM profile 14. These APIs can be implemented in pure Java code.
- These APIs can be used on the real target or on the host development desktop. An example of use of these APIs is shown on below:


- In this example, the application uses the estimations to resume its execution only if the estimated time of the two internal loops is less than 100000 nanoseconds. The call new MyAppProfile inside the main of the application guaranty that the application's profile class file is linked within the application class files. Moreover, when executed, and due to the inheritance of ProfilerExecution class (see above) the method getExecutionTime is offered transparently.
- In order to support the application profiling APIs, two modifications inside a JVM are required. The JVM for calculating estimations on time/energy performance is typically separate from the JVM used for generating the
application profile 10 or theJVM profile 14. Initially, C structures are added to JVM for obtaining profiles: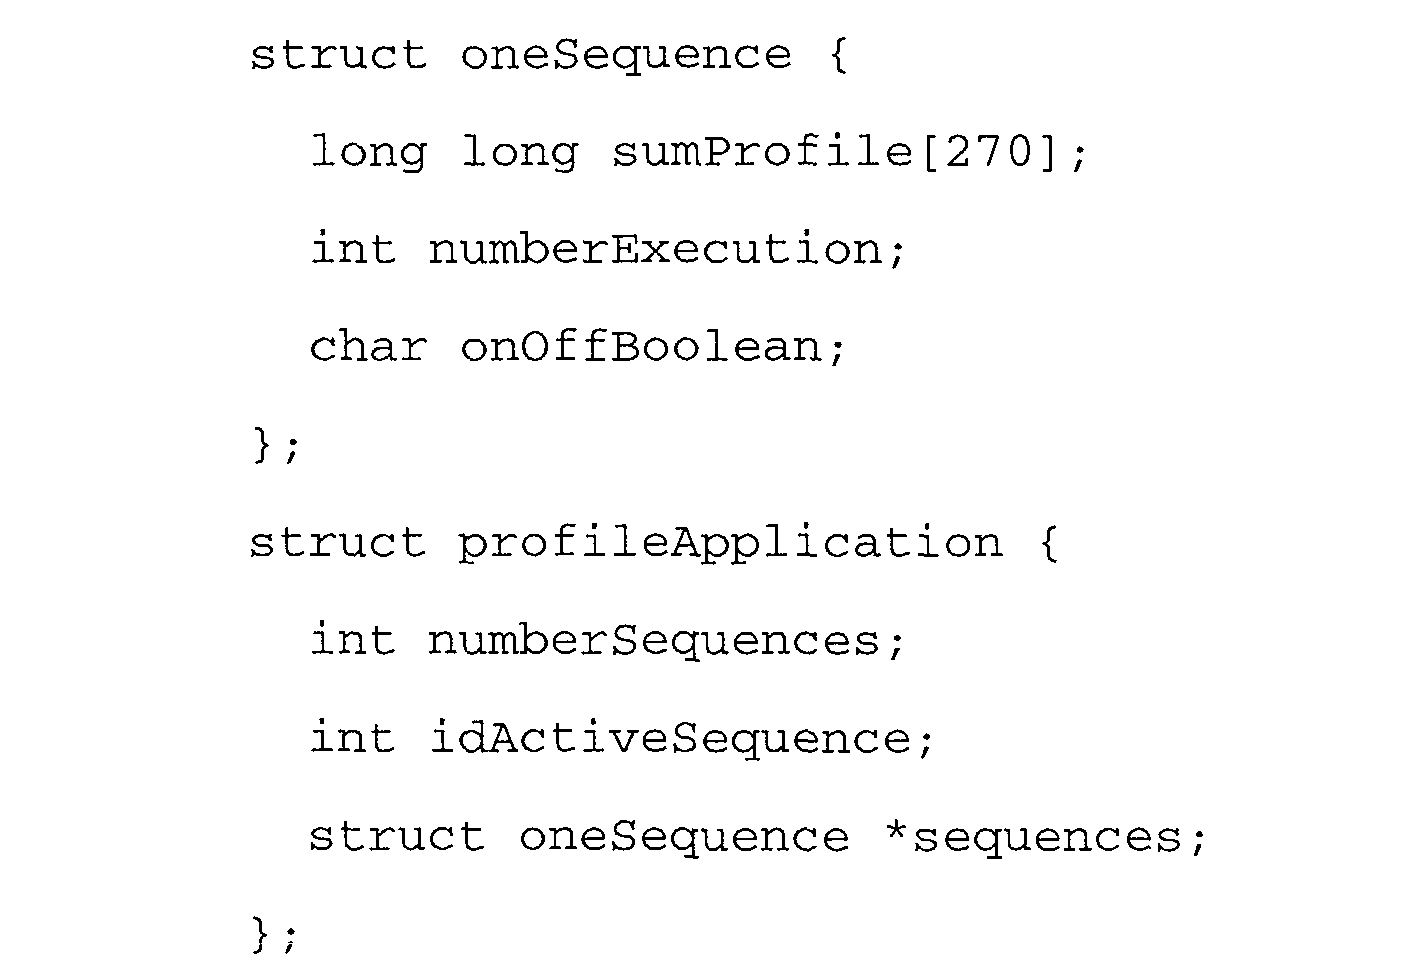
- The profiler JVM counts the number of times of each operation is executed. Therefore, it is necessary to instrument the main interpreter loop. As shown below, before each byte-code execution, a call to profilerExecOpcode procedure counts the current executed byte-code:
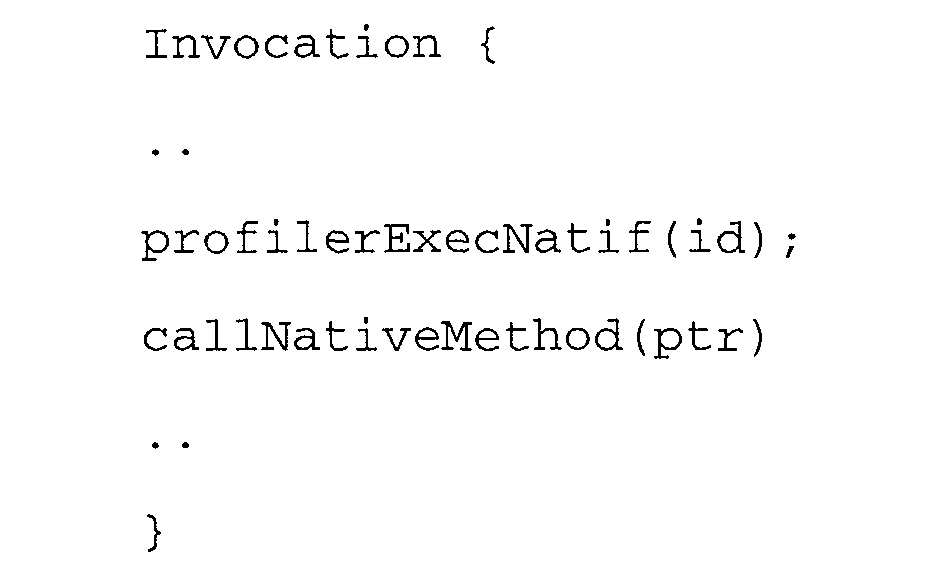
- Second, there must also be a count of the number of executions of each native method. A simple modification of the invocation opcode, shown below, permits the detection of which native method is being executed:
- Structure sequences is allocated at the same time the object ApplicationProfiler is created. IdActiveSequence indicates the current codeSequence being profiled. For each code sequence, onOffBoolean indicates if the profile is active or not. NumberSequences stores the number of times the profile has been used for a particular code sequence in order to calculate its average profile. Each time a byte-code or a native method is executed, the corresponding entry in sumProfile is incremented by one. This is why sumProfile is composed of 270 entries (200 byte-codes without wide, 12 byte-codes with wide support, 4 entries for each native invocation byte-code and finally one entry for each of the native methods of the JVM; in this case, it is assumed that there are 54 native methods, although a particular implementation may use more or less).
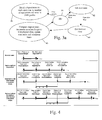
- In order to have execution times of Java byte-codes, the time before the execution of the byte-code and the time after its execution must be measured properly. As shown of Figure 3a (general case) the execution time of a byte-code is (tOpcodeEnd-tOpcodeBegin), and with a simple modification of the main interpreter loop, these times can be easily obtained.' But to be accurate, some cases must be measured differently, as shown in Figure 4.
- The first special case is native method invocation. During the execution of an invocation byte-code, if the method to invoke is a native one, the time between (tOpcodeEnd-tOpcodeBegin) will include the time of the native method execution. Accordingly, in the case of a native method invocation, as the execution time of the native method is (tNativeEnd-tNativeBegin), the execution time of a method native invocation byte-code will be (tOpcodeEnd-tOpcodeBegin) - (tNativeEnd-tNativeBegin).
- The second special case involves new byte-code and nested interpreter loops. When executing a new byte-code, another interpreter loop is executed in order to run the <clinit> method that initializes the object. In this particular case, the time before entering the new interpreter level (tLevelBegin) and the time at the return from it (tLevelEnd) are measured. The execution time taken by the new interpreter loop is then (tLevelEnd-tLevelBegin) and the execution time of the new byte-code is (tOpcodeEnd-tOpcodeBegin) - (tLevelEnd-tLevelBegin). As shown in Figure 6, a return based byte-code is done to return to the previous interpreter loop. In this case, the execution of the return byte-code is (tLevelEnd-tOpcodeBegin), with the tOpcodeBegin of the return byte-code interpreter loop level.
- The third special case involves native method invocation and nested interpreter loops. During an execution of a native method, it is also possible to execute another interpreter loop using JNI (JAVA Native Interface) interface calls. In this case, the execution time of the native method is (tNativeEnd-tNativeBegin) - (tLevelEnd-tLevelBegin).
- To obtain times in this circumstance, an instrumentation of a JVM can be done such that there is one modification in the main interpreter loop, another in the native invocation call and finally one inside the call that launches a new interpreter loop. Moreover, using levels of interpreters, it is possible to support several nested interpreters.
- Table 4 summarizes the names of the times taken and Table 5 gives the estimated time for a byte-code and a native method according to these times.
Description of measured times Time Designation tOpcodeBeginlevel Time taken before the byte-code execution in a specific interpreter loop level tOpcodeEndlevel Time taken after the byte-code execution in a specific interpreter loop level tLevelBegin level Time taken before entering a new interpreter loop level tLevelEnd level Time taken after the execution of a higher interpreter loop level tNatifBegin level Time taken before the native call in a specific interpreter loop level tNatifEnd level Time taken after the native call in a specific interpreter loop level Byte-code estimation times according to measured times Type Corresponding estimation times Native methods (tNatifEndlevel - tNatifBeginlevel) -(tLevelEndlevel - tLevelBeginlevel) Byte-codes Except for Return if nested in an interpreter loop : (tOpcodeEndlevel - tOpcodeBeginlevel) -(tNatifEndlevel - tNatifBeginlevel) - (tLevelEndlevel - tLevelBeginlevel) for Return if nested in an interpreter loop: (tLevelEndlevel-1 - tOpcodeBeginlevel) - The most important advantage of the profiling is the separation of two isolated and independent parts the profiling of an application, i.e., separate application and virtual machine profiling. This allows, for example, optimization work to be done on the application without an identified target hardware platform. On the other hand, work on the JVM can be done for obtaining a better performance, and a
better JVM profile 14. - Another important point is that the
application profile 10 and theJVM profile 14 are class files and can be downloaded through a network. From the target hardware's perspective, estimation can be deduced after the download of an application, either through downloading theapplication profile 10 or by generating anapplication profile 10 upon the first execution. Further, the host development station can download desired JVM profiles 14 for different hardware platforms. This way, an application designer can optimize its application for several targets. - Another perspective of this work is to adapt the
JVM profile 14 in order to obtain energy consumption estimations of a JAVA application. Instead of (or in addition to) profiling the execution time on the target, the estimation of energy consumption could be performed using the same principles as for execution time. This is a real discontinuity in embedded application development cycle where a huge instrumentation and lots of tools are needed to obtain these estimations. The energy performance (and execution time performance) could be used by the target device for scheduling applications, as described in connection with EP Serial No. 99402655.7,filed on October 25, 1999, for "Intelligent Power Management for Distributed Processing Systems" (U.S. Ser. No. 09/696,052, filed October 25, 2000, for "Intelligent Power Management for Distributed Processing Systems" to Chauvel et al), which is incorporated by reference herein. - Just in time compilers may improve performance due to their sophisticated optimizations created dynamically. The profiling techniques described herein could be adapted to take into account an interpreter-based execution and a JIT one.
- Another very interesting perspective of the profiling technique is to estimate Worst Case Execution Times (WCET) of JAVA applications. As it is possible, using existing techniques, to generate the WCET for the
application profile 10 and the WCET for each operation execution in theJVM profile 14, it is possible to obtain the WCET estimate for the application. Similarly, a best case execution time could be obtained as well. - Finally, as the profiling tool is a JVM that calculates the
application profile 10 by the execution of the application, the application profile can be generated on the fly after the download of the application. Then, after the first execution, an estimation can be delivered. Moreover, as there is only the main interpreter loop and the native call that are instrumented, the overhead in terms of performance is not too important and will only concern the first execution. In the specific case of stream based applications, in which there are important time variations due to the kind of data received, a dynamic profiling will permit to adjust dynamically the execution time estimation with a small overhead. - Although the Detailed Description of the invention has been directed to certain exemplary embodiments, various modifications of these embodiments, as well as alternative embodiments, will be suggested to those skilled in the art. The invention encompasses any modifications or alternative embodiments.
Claims (20)
- A method of estimating performance for a specified portion of an application, where the specified portion can include all or part of the application, that executes on a target device via a virtual machine interface, which method comprising:acquiring an application profile that specifies a number of executions for a plurality of operations used in the specified portion of the application;acquiring a virtual machine profile that relates a performance characteristic to individual operations; andgenerating an aggregate value for said performance characteristic based on the application profile and the virtual machine profile.
- The method of claim 1, wherein acquiring said virtual machine profile comprises:acquiring a virtual machine profile that relates average execution time to individual operations.
- The method of claim 1, wherein acquiring said virtual machine profile comprises:acquiring a virtual machine profile that relates maximum execution time to individual operations.
- The method of claim 1, wherein acquiring said virtual machine profile comprises:acquiring a virtual machine profile that relates minimum execution time to individual operations.
- The method of claim 1, wherein acquiring said virtual machine profile comprises:acquiring a virtual machine profile that relates power consumption to individual operations.
- The method of claim 1, wherein acquiring said virtual machine profile comprises:generating a virtual machine profile that measures said performance characteristic during execution of a benchmark program on said target device.
- The method of claim 1, wherein acquiring said virtual machine profile comprises:downloading a previously generated virtual machine profile that measures said performance characteristic during execution of a benchmark program on said target device.
- The method of any of claims 1-7, wherein acquiring said application profile comprises:generating an application profile that specifies a number of executions for a plurality of operations used in the application on an application development processing device.
- The method of any of claims 1-7, wherein acquiring said application profile comprises:generating an application profile that specifies a number of executions for a plurality of operations used in the application test conditions on the target device.
- The method of any of claims 1-7 further comprising:generating said application profile responsive to a first set of operating criteria; andgenerating one or more other application profiles for the specified portion of the application associated with different operating criteria.
- Apparatus for estimating performance for a specified portion of an application, where the specified portion can include all or part of the application, that executes on a target device via a virtual machine interface, which circuitry comprising:circuitry for acquiring an application profile that specifies a number of executions for a plurality of operations used in the specified portion of the application;circuitry for acquiring a virtual machine profile that relates a performance characteristic to individual operations; andcircuitry for generating an aggregate value for said performance characteristic based on the application profile and the virtual machine profile.
- The apparatus of claim 11, wherein said circuitry for acquiring a virtual machine profile comprises circuitry for acquiring a virtual machine profile that relates average execution time to individual operations.
- The apparatus of claim 11, wherein said circuitry for acquiring a virtual machine profile comprises circuitry for acquiring a virtual machine profile that relates maximum execution time to individual operations.
- The apparatus of claim 11, wherein said circuitry for acquiring a virtual machine profile comprises circuitry for acquiring a virtual machine profile that relates minimum execution time to individual operations.
- The apparatus of claim 11, wherein said circuitry for acquiring a virtual machine profile comprises circuitry for acquiring a virtual machine profile that relates power consumption to individual operations.
- The apparatus of claim 11, wherein said circuitry for acquiring a virtual machine profile comprises circuitry for generating a virtual machine profile that measures said performance characteristic during execution of a benchmark program on said target device.
- The apparatus of claim 11, wherein said circuitry for acquiring a virtual machine profile comprises circuitry for downloading a previously generated virtual machine profile that measures said performance characteristic during execution of a benchmark program on said target device.
- The apparatus of any of claims 11-17, wherein circuitry for generating an application profile comprises circuitry for generating an application profile that specifies a number of executions for a plurality of operations used in the application on an application development processing device.
- The apparatus of any of claims 11-17, wherein said circuitry for generating an application profile comprises circuitry for generating an application profile that specifies a number of executions for a plurality of operations used in the application on the target device.
- The circuitry of any of claims 11-17, wherein said application profile is generated responsive to a first set of operating criteria and further comprising circuitry for generating one or more other application profiles for the specified portion of the application associated with different operating criteria.
Priority Applications (2)
| Application Number | Priority Date | Filing Date | Title |
|---|---|---|---|
| EP02290195.3A EP1331565B1 (en) | 2002-01-29 | 2002-01-29 | Application execution profiling in conjunction with a virtual machine |
| US10/195,268 US20040010785A1 (en) | 2002-01-29 | 2002-07-15 | Application execution profiling in conjunction with a virtual machine |
Applications Claiming Priority (2)
| Application Number | Priority Date | Filing Date | Title |
|---|---|---|---|
| EP02290195.3A EP1331565B1 (en) | 2002-01-29 | 2002-01-29 | Application execution profiling in conjunction with a virtual machine |
| US10/195,268 US20040010785A1 (en) | 2002-01-29 | 2002-07-15 | Application execution profiling in conjunction with a virtual machine |
Publications (2)
| Publication Number | Publication Date |
|---|---|
| EP1331565A1 true EP1331565A1 (en) | 2003-07-30 |
| EP1331565B1 EP1331565B1 (en) | 2018-09-12 |
Family
ID=32313851
Family Applications (1)
| Application Number | Title | Priority Date | Filing Date |
|---|---|---|---|
| EP02290195.3A Expired - Lifetime EP1331565B1 (en) | 2002-01-29 | 2002-01-29 | Application execution profiling in conjunction with a virtual machine |
Country Status (2)
| Country | Link |
|---|---|
| US (1) | US20040010785A1 (en) |
| EP (1) | EP1331565B1 (en) |
Cited By (3)
| Publication number | Priority date | Publication date | Assignee | Title |
|---|---|---|---|---|
| US6824064B2 (en) | 2000-12-06 | 2004-11-30 | Mobile-Mind, Inc. | Concurrent communication with multiple applications on a smart card |
| WO2009022302A1 (en) * | 2007-08-15 | 2009-02-19 | Nxp B.V. | Profile based optimization of processor operating points |
| CN113778819A (en) * | 2020-06-10 | 2021-12-10 | 通用电气公司 | Real-time software and hardware performance benchmarking |
Families Citing this family (29)
| Publication number | Priority date | Publication date | Assignee | Title |
|---|---|---|---|---|
| US7546598B2 (en) * | 2003-09-03 | 2009-06-09 | Sap Aktiengesellschaft | Measuring software system performance using benchmarks |
| US7770034B2 (en) * | 2003-12-16 | 2010-08-03 | Intel Corporation | Performance monitoring based dynamic voltage and frequency scaling |
| US7904893B2 (en) * | 2004-03-17 | 2011-03-08 | Marvell International Ltd. | Power and/or energy optimized compile/execution |
| US7493596B2 (en) * | 2004-06-30 | 2009-02-17 | International Business Machines Corporation | Method, system and program product for determining java software code plagiarism and infringement |
| US7647581B2 (en) * | 2004-06-30 | 2010-01-12 | International Business Machines Corporation | Evaluating java objects across different virtual machine vendors |
| US20060136877A1 (en) * | 2004-12-22 | 2006-06-22 | International Business Machines Corporation | Method, system and program product for capturing a semantic level state of a program |
| US20090178032A1 (en) * | 2005-03-03 | 2009-07-09 | Rongzhen Yang | Mining for performance data for systems with dynamic compilers |
| US20070079294A1 (en) * | 2005-09-30 | 2007-04-05 | Robert Knight | Profiling using a user-level control mechanism |
| US7788664B1 (en) * | 2005-11-08 | 2010-08-31 | Hewlett-Packard Development Company, L.P. | Method of virtualizing counter in computer system |
| US8209681B1 (en) * | 2005-11-08 | 2012-06-26 | Hewlett-Packard Development Company, L.P. | Method of sampling hardware events in computer system |
| US7975263B2 (en) * | 2006-01-10 | 2011-07-05 | Intel Corporation | Method and apparatus for generating run time profiles for program compilation |
| US8959515B2 (en) * | 2006-01-18 | 2015-02-17 | International Business Machines Corporation | Task scheduling policy for limited memory systems |
| ATE468556T1 (en) * | 2006-04-13 | 2010-06-15 | Microsoft Corp | VIRTUAL EXECUTION SYSTEM FOR RESOURCE LIMITED DEVICES |
| US7804435B2 (en) * | 2006-08-31 | 2010-09-28 | Ati Technologies Ulc | Video decoder with reduced power consumption and method thereof |
| US9582060B2 (en) * | 2006-08-31 | 2017-02-28 | Advanced Silicon Technologies Llc | Battery-powered device with reduced power consumption based on an application profile data |
| US7992136B2 (en) * | 2006-10-18 | 2011-08-02 | International Business Machines Corporation | Method and apparatus for automatic application profiling |
| US20090113403A1 (en) * | 2007-09-27 | 2009-04-30 | Microsoft Corporation | Replacing no operations with auxiliary code |
| US9594578B2 (en) * | 2012-02-28 | 2017-03-14 | Red Hat, Inc. | Hardware implementation of a virtual machine interpreter |
| CN104937550B (en) * | 2013-01-15 | 2019-03-26 | 英派尔科技开发有限公司 | Function-targeted virtual machine switching |
| US9471347B2 (en) | 2013-01-31 | 2016-10-18 | International Business Machines Corporation | Optimization of virtual machine sizing and consolidation |
| US9542179B2 (en) * | 2013-09-06 | 2017-01-10 | Texas Instruments Incorporated | System and method for energy aware program development |
| EP2927763B1 (en) * | 2014-04-04 | 2019-06-19 | Abb Ag | System and method for an optimized operation of real-time embedded solutions in industrial automation |
| US20170185292A1 (en) * | 2015-12-23 | 2017-06-29 | Intel Corporation | Memory Management of High-Performance Memory |
| FR3067482A1 (en) * | 2017-06-12 | 2018-12-14 | Inria Institut National De Recherche En Informatique Et En Automatique | DEVICE FOR CHARACTERIZATION AND / OR MODELING OF PERIODIC PERFORMANCE TIME |
| US10509721B2 (en) | 2017-11-09 | 2019-12-17 | Microsoft Technology Licensing, Llc | Performance counters for computer memory |
| US12314422B2 (en) * | 2019-06-15 | 2025-05-27 | Cisco Technology, Inc. | Automatic application data collection for potentially insightful business values |
| US11972242B2 (en) * | 2022-07-26 | 2024-04-30 | Red Hat, Inc. | Runtime environment optimizer for JVM-style languages |
| US11747782B1 (en) * | 2023-01-20 | 2023-09-05 | Citibank, N.A. | Systems and methods for providing power consumption predictions for selected applications within network arrangements featuring devices with non-homogenous or unknown specifications |
| US11843248B1 (en) * | 2023-01-20 | 2023-12-12 | Citibank, N.A. | Systems and methods for providing power consumption predictions for selected applications within network arrangements featuring devices with non-homogenous or unknown specifications |
Family Cites Families (8)
| Publication number | Priority date | Publication date | Assignee | Title |
|---|---|---|---|---|
| US6126329A (en) * | 1993-06-08 | 2000-10-03 | Rational Software Coporation | Method and apparatus for accurate profiling of computer programs |
| US5903758A (en) * | 1997-02-24 | 1999-05-11 | Sun Microsystems, Inc. | Method and apparatus for auditing dynamically linked procedure calls |
| US6053492A (en) * | 1997-03-03 | 2000-04-25 | Newsome; John R. | Apparatus for sequentially feeding cards to inserter in a magazine binding line |
| US20020059562A1 (en) * | 2000-09-26 | 2002-05-16 | Yutaka Haga | Apparatus for collecting profiles of programs |
| US20020069263A1 (en) * | 2000-10-13 | 2002-06-06 | Mark Sears | Wireless java technology |
| US7007270B2 (en) * | 2001-03-05 | 2006-02-28 | Cadence Design Systems, Inc. | Statistically based estimate of embedded software execution time |
| US6857119B1 (en) * | 2001-09-25 | 2005-02-15 | Oracle International Corporation | Techniques for modifying a compiled application |
| US6983455B2 (en) * | 2002-04-10 | 2006-01-03 | Sun Microsystems, Inc. | Mechanism for profiling computer code |
-
2002
- 2002-01-29 EP EP02290195.3A patent/EP1331565B1/en not_active Expired - Lifetime
- 2002-07-15 US US10/195,268 patent/US20040010785A1/en not_active Abandoned
Non-Patent Citations (5)
| Title |
|---|
| J HORGAN; J POWER; J WALDRON: "Measurement and Analysis of Runtime Profiling of Data for Java Programs", IEEE INTERNATIONAL WORKSHOP ON SOURCE CODE ANALYSIS AND MANIPULATION, 10 October 2001 (2001-10-10) |
| J. HORGAN, J. POWER AND J. WALDRON: "Measurement and Analysis of Runtime Profiling Data for Java Programs", IEEE INTERNATIONAL WORKSHOP ON SOURCE CODE ANALYSIS AND MANIPULATION,, 10 October 2001 (2001-10-10), Florence, Italy, XP002206029 * |
| RADHAKRISHNAN R ET AL: "Characterization of Java applications at bytecode and ultra-SPARC machine code levels", COMPUTER DESIGN, 1999. (ICCD '99). INTERNATIONAL CONFERENCE ON AUSTIN, TX, USA 10-13 OCT. 1999, LOS ALAMITOS, CA, USA,IEEE COMPUT. SOC, US, 10 October 1999 (1999-10-10), pages 281 - 284, XP010360576, ISBN: 0-7695-0406-X * |
| TIA NEWALL; BARTON P. MILLER: "Performance Measurement of Dynamically Compiled Java Executions", 199 ACM JAVA GRANDE CONFERENCE, June 1999 (1999-06-01) |
| TIA NEWHALL AND BARTON P. MILLER: "Performance Measurement of Dynamically Compiled Java Executions", 1999 ACM JAVA GRANDE CONFERENCE, June 1999 (1999-06-01), Palo Alto, USA, XP002206028 * |
Cited By (7)
| Publication number | Priority date | Publication date | Assignee | Title |
|---|---|---|---|---|
| US6824064B2 (en) | 2000-12-06 | 2004-11-30 | Mobile-Mind, Inc. | Concurrent communication with multiple applications on a smart card |
| WO2009022302A1 (en) * | 2007-08-15 | 2009-02-19 | Nxp B.V. | Profile based optimization of processor operating points |
| US8813056B2 (en) | 2007-08-15 | 2014-08-19 | Nxp B.V. | Profile based optimization of processor operating points |
| CN113778819A (en) * | 2020-06-10 | 2021-12-10 | 通用电气公司 | Real-time software and hardware performance benchmarking |
| EP3923142A1 (en) * | 2020-06-10 | 2021-12-15 | General Electric Company | Performance benchmarking for real-time software and hardware |
| US11429507B2 (en) | 2020-06-10 | 2022-08-30 | General Electric Company | Performance benchmarking for real-time software and hardware |
| CN113778819B (en) * | 2020-06-10 | 2025-05-23 | 通用电气公司 | Performance benchmarking of real-time software and hardware |
Also Published As
| Publication number | Publication date |
|---|---|
| EP1331565B1 (en) | 2018-09-12 |
| US20040010785A1 (en) | 2004-01-15 |
Similar Documents
| Publication | Publication Date | Title |
|---|---|---|
| EP1331565B1 (en) | Application execution profiling in conjunction with a virtual machine | |
| US9858183B2 (en) | Determining a benefit of reducing memory footprint of a Java application | |
| Driesen et al. | The direct cost of virtual function calls in C++ | |
| US6374369B1 (en) | Stochastic performance analysis method and apparatus therefor | |
| US10324741B2 (en) | Speeding up dynamic language execution on a virtual machine with type speculation | |
| Davis et al. | The case for virtual register machines | |
| Binder et al. | Platform‐independent profiling in a virtual execution environment | |
| US20170269950A1 (en) | Selective execution of ahead-of-time compiled code | |
| US11204767B2 (en) | Context switching locations for compiler-assisted context switching | |
| Ebcioğlu et al. | Execution-based scheduling for VLIW architectures | |
| Binder et al. | Using bytecode instruction counting as portable CPU consumption metric | |
| Hulaas et al. | Program transformations for portable CPU accounting and control in Java | |
| US6804681B2 (en) | Identifying and tracking object references in a java programming environment | |
| Delsart et al. | JCOD: A lightweight modular compilation technology for embedded Java | |
| Binder | A portable and customizable profiling framework for Java based on bytecode instruction counting | |
| Binder et al. | A quantitative evaluation of the contribution of native code to Java workloads | |
| Pfeffer et al. | Real-time garbage collection for a multithreaded Java microcontroller | |
| US7684971B1 (en) | Method and system for improving simulation performance | |
| US7065747B2 (en) | Identifying references to objects during bytecode verification | |
| Binder et al. | Exact and portable profiling for the jvm using bytecode instruction counting | |
| Radhakrishnan et al. | Execution characteristics of just-in-time compilers | |
| Lee et al. | Enhanced hot spot detection heuristics for embedded java just-in-time compilers | |
| Binder et al. | Cross-profiling for embedded Java processors | |
| Barisone et al. | Ultrasparc instruction level characterization of Java virtual machine workload | |
| Brandner et al. | Embedded JIT compilation with CACAO on YARI |
Legal Events
| Date | Code | Title | Description |
|---|---|---|---|
| PUAI | Public reference made under article 153(3) epc to a published international application that has entered the european phase |
Free format text: ORIGINAL CODE: 0009012 |
|
| 17P | Request for examination filed |
Effective date: 20020221 |
|
| AK | Designated contracting states |
Designated state(s): AT BE CH CY DE DK ES FI FR GB GR IE IT LI LU MC NL PT SE TR |
|
| AX | Request for extension of the european patent |
Extension state: AL LT LV MK RO SI |
|
| AKX | Designation fees paid |
Designated state(s): AT BE CH CY DE DK ES FI FR GB GR IE IT LI LU MC NL PT SE TR |
|
| 17Q | First examination report despatched |
Effective date: 20070404 |
|
| STAA | Information on the status of an ep patent application or granted ep patent |
Free format text: STATUS: EXAMINATION IS IN PROGRESS |
|
| GRAP | Despatch of communication of intention to grant a patent |
Free format text: ORIGINAL CODE: EPIDOSNIGR1 |
|
| STAA | Information on the status of an ep patent application or granted ep patent |
Free format text: STATUS: GRANT OF PATENT IS INTENDED |
|
| INTG | Intention to grant announced |
Effective date: 20180417 |
|
| RIN1 | Information on inventor provided before grant (corrected) |
Inventor name: ROUTEAU, JEAN-PAUL Inventor name: LASSERRE, SERGE Inventor name: LESOT, JEAN PHILIPPE Inventor name: D'INVERNO, DOMINIQUE Inventor name: PARAIN, FREDERIC Inventor name: BANATRE, MICHEL Inventor name: CHAUVEL, GERARD Inventor name: CABILLIC, GILBERT |
|
| GRAS | Grant fee paid |
Free format text: ORIGINAL CODE: EPIDOSNIGR3 |
|
| GRAA | (expected) grant |
Free format text: ORIGINAL CODE: 0009210 |
|
| STAA | Information on the status of an ep patent application or granted ep patent |
Free format text: STATUS: THE PATENT HAS BEEN GRANTED |
|
| AK | Designated contracting states |
Kind code of ref document: B1 Designated state(s): AT BE CH CY DE DK ES FI FR GB GR IE IT LI LU MC NL PT SE TR |
|
| REG | Reference to a national code |
Ref country code: GB Ref legal event code: FG4D |
|
| REG | Reference to a national code |
Ref country code: CH Ref legal event code: EP |
|
| REG | Reference to a national code |
Ref country code: IE Ref legal event code: FG4D |
|
| REG | Reference to a national code |
Ref country code: DE Ref legal event code: R096 Ref document number: 60249603 Country of ref document: DE |
|
| REG | Reference to a national code |
Ref country code: AT Ref legal event code: REF Ref document number: 1041403 Country of ref document: AT Kind code of ref document: T Effective date: 20181015 |
|
| REG | Reference to a national code |
Ref country code: NL Ref legal event code: MP Effective date: 20180912 |
|
| PG25 | Lapsed in a contracting state [announced via postgrant information from national office to epo] |
Ref country code: SE Free format text: LAPSE BECAUSE OF FAILURE TO SUBMIT A TRANSLATION OF THE DESCRIPTION OR TO PAY THE FEE WITHIN THE PRESCRIBED TIME-LIMIT Effective date: 20180912 Ref country code: FI Free format text: LAPSE BECAUSE OF FAILURE TO SUBMIT A TRANSLATION OF THE DESCRIPTION OR TO PAY THE FEE WITHIN THE PRESCRIBED TIME-LIMIT Effective date: 20180912 Ref country code: GR Free format text: LAPSE BECAUSE OF FAILURE TO SUBMIT A TRANSLATION OF THE DESCRIPTION OR TO PAY THE FEE WITHIN THE PRESCRIBED TIME-LIMIT Effective date: 20181213 |
|
| PG25 | Lapsed in a contracting state [announced via postgrant information from national office to epo] |
Ref country code: ES Free format text: LAPSE BECAUSE OF FAILURE TO SUBMIT A TRANSLATION OF THE DESCRIPTION OR TO PAY THE FEE WITHIN THE PRESCRIBED TIME-LIMIT Effective date: 20180912 |
|
| REG | Reference to a national code |
Ref country code: AT Ref legal event code: MK05 Ref document number: 1041403 Country of ref document: AT Kind code of ref document: T Effective date: 20180912 |
|
| PG25 | Lapsed in a contracting state [announced via postgrant information from national office to epo] |
Ref country code: NL Free format text: LAPSE BECAUSE OF FAILURE TO SUBMIT A TRANSLATION OF THE DESCRIPTION OR TO PAY THE FEE WITHIN THE PRESCRIBED TIME-LIMIT Effective date: 20180912 Ref country code: IT Free format text: LAPSE BECAUSE OF FAILURE TO SUBMIT A TRANSLATION OF THE DESCRIPTION OR TO PAY THE FEE WITHIN THE PRESCRIBED TIME-LIMIT Effective date: 20180912 Ref country code: AT Free format text: LAPSE BECAUSE OF FAILURE TO SUBMIT A TRANSLATION OF THE DESCRIPTION OR TO PAY THE FEE WITHIN THE PRESCRIBED TIME-LIMIT Effective date: 20180912 |
|
| PG25 | Lapsed in a contracting state [announced via postgrant information from national office to epo] |
Ref country code: PT Free format text: LAPSE BECAUSE OF FAILURE TO SUBMIT A TRANSLATION OF THE DESCRIPTION OR TO PAY THE FEE WITHIN THE PRESCRIBED TIME-LIMIT Effective date: 20190112 |
|
| REG | Reference to a national code |
Ref country code: DE Ref legal event code: R097 Ref document number: 60249603 Country of ref document: DE |
|
| PLBE | No opposition filed within time limit |
Free format text: ORIGINAL CODE: 0009261 |
|
| STAA | Information on the status of an ep patent application or granted ep patent |
Free format text: STATUS: NO OPPOSITION FILED WITHIN TIME LIMIT |
|
| PG25 | Lapsed in a contracting state [announced via postgrant information from national office to epo] |
Ref country code: DK Free format text: LAPSE BECAUSE OF FAILURE TO SUBMIT A TRANSLATION OF THE DESCRIPTION OR TO PAY THE FEE WITHIN THE PRESCRIBED TIME-LIMIT Effective date: 20180912 |
|
| REG | Reference to a national code |
Ref country code: DE Ref legal event code: R119 Ref document number: 60249603 Country of ref document: DE |
|
| 26N | No opposition filed |
Effective date: 20190613 |
|
| PG25 | Lapsed in a contracting state [announced via postgrant information from national office to epo] |
Ref country code: MC Free format text: LAPSE BECAUSE OF FAILURE TO SUBMIT A TRANSLATION OF THE DESCRIPTION OR TO PAY THE FEE WITHIN THE PRESCRIBED TIME-LIMIT Effective date: 20180912 |
|
| REG | Reference to a national code |
Ref country code: CH Ref legal event code: PL |
|
| GBPC | Gb: european patent ceased through non-payment of renewal fee |
Effective date: 20190129 |
|
| PG25 | Lapsed in a contracting state [announced via postgrant information from national office to epo] |
Ref country code: LU Free format text: LAPSE BECAUSE OF NON-PAYMENT OF DUE FEES Effective date: 20190129 |
|
| REG | Reference to a national code |
Ref country code: BE Ref legal event code: MM Effective date: 20190131 |
|
| REG | Reference to a national code |
Ref country code: IE Ref legal event code: MM4A |
|
| PG25 | Lapsed in a contracting state [announced via postgrant information from national office to epo] |
Ref country code: FR Free format text: LAPSE BECAUSE OF NON-PAYMENT OF DUE FEES Effective date: 20190131 Ref country code: DE Free format text: LAPSE BECAUSE OF NON-PAYMENT OF DUE FEES Effective date: 20190801 |
|
| PG25 | Lapsed in a contracting state [announced via postgrant information from national office to epo] |
Ref country code: BE Free format text: LAPSE BECAUSE OF NON-PAYMENT OF DUE FEES Effective date: 20190131 |
|
| PG25 | Lapsed in a contracting state [announced via postgrant information from national office to epo] |
Ref country code: CH Free format text: LAPSE BECAUSE OF NON-PAYMENT OF DUE FEES Effective date: 20190131 Ref country code: GB Free format text: LAPSE BECAUSE OF NON-PAYMENT OF DUE FEES Effective date: 20190129 Ref country code: LI Free format text: LAPSE BECAUSE OF NON-PAYMENT OF DUE FEES Effective date: 20190131 |
|
| PG25 | Lapsed in a contracting state [announced via postgrant information from national office to epo] |
Ref country code: IE Free format text: LAPSE BECAUSE OF NON-PAYMENT OF DUE FEES Effective date: 20190129 |
|
| PG25 | Lapsed in a contracting state [announced via postgrant information from national office to epo] |
Ref country code: TR Free format text: LAPSE BECAUSE OF FAILURE TO SUBMIT A TRANSLATION OF THE DESCRIPTION OR TO PAY THE FEE WITHIN THE PRESCRIBED TIME-LIMIT Effective date: 20180912 |
|
| PG25 | Lapsed in a contracting state [announced via postgrant information from national office to epo] |
Ref country code: CY Free format text: LAPSE BECAUSE OF FAILURE TO SUBMIT A TRANSLATION OF THE DESCRIPTION OR TO PAY THE FEE WITHIN THE PRESCRIBED TIME-LIMIT Effective date: 20180912 |